iii. the freight transportation system · iii. the freight transportation system freight travels...
TRANSCRIPT
15
III. THE FREIgHT TRAnSPoRTATIon SySTEM
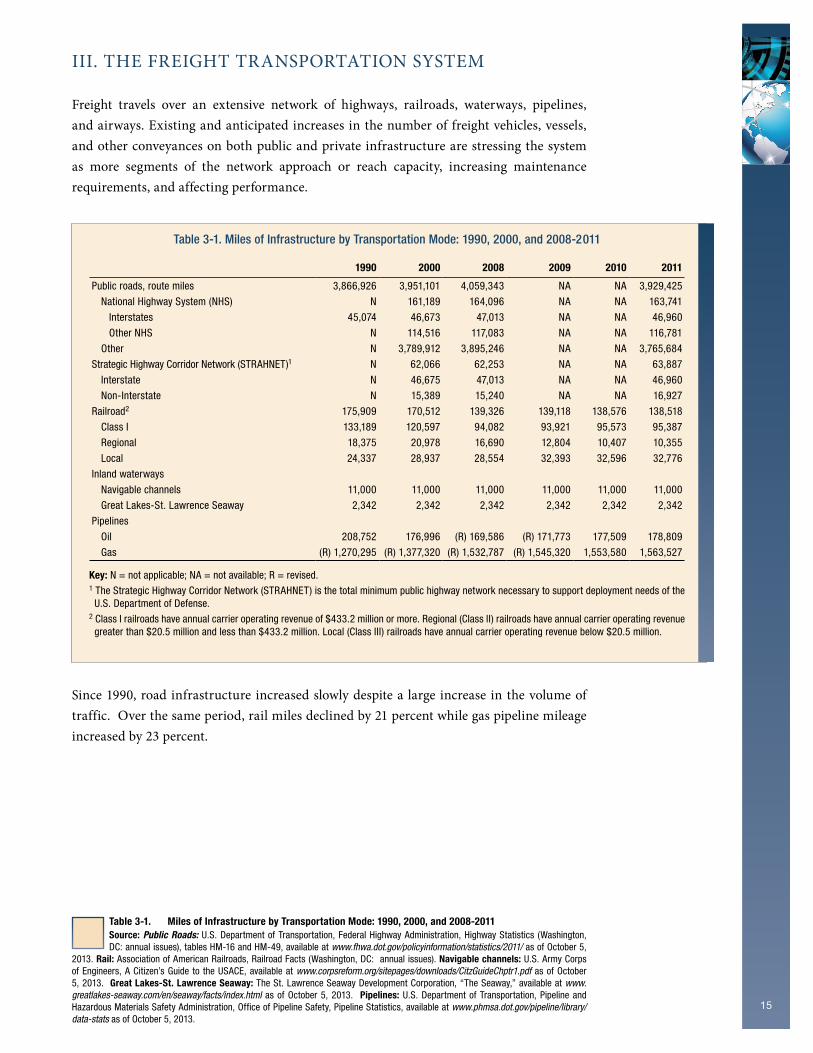
Freight travels over an extensive network of highways, railroads, waterways, pipelines, and airways. Existing and anticipated increases in the number of freight vehicles, vessels, and other conveyances on both public and private infrastructure are stressing the system as more segments of the network approach or reach capacity, increasing maintenance requirements, and affecting performance.
Since 1990, road infrastructure increased slowly despite a large increase in the volume of traffic. over the same period, rail miles declined by 21 percent while gas pipeline mileage increased by 23 percent.
Table 3-1. Miles of Infrastructure by Transportation Mode: 1990, 2000, and 2008-2011
1990 2000 2008 2009 2010 2011
Public roads, route miles 3,866,926 3,951,101 4,059,343 NA NA 3,929,425
National Highway System (NHS) N 161,189 164,096 NA NA 163,741
Interstates 45,074 46,673 47,013 NA NA 46,960
Other NHS N 114,516 117,083 NA NA 116,781
Other N 3,789,912 3,895,246 NA NA 3,765,684
Strategic Highway Corridor Network (STRAHNET)1 N 62,066 62,253 NA NA 63,887
Interstate N 46,675 47,013 NA NA 46,960
Non-Interstate N 15,389 15,240 NA NA 16,927
Railroad2 175,909 170,512 139,326 139,118 138,576 138,518
Class I 133,189 120,597 94,082 93,921 95,573 95,387
Regional 18,375 20,978 16,690 12,804 10,407 10,355
Local 24,337 28,937 28,554 32,393 32,596 32,776
Inland waterways
Navigable channels 11,000 11,000 11,000 11,000 11,000 11,000
Great Lakes-St. Lawrence Seaway 2,342 2,342 2,342 2,342 2,342 2,342
Pipelines
Oil 208,752 176,996 (R) 169,586 (R) 171,773 177,509 178,809
Gas (R) 1,270,295 (R) 1,377,320 (R) 1,532,787 (R) 1,545,320 1,553,580 1,563,527
Key: N = not applicable; NA = not available; R = revised.1 The Strategic Highway Corridor Network (STRAHNET) is the total minimum public highway network necessary to support deployment needs of the
U.S. Department of Defense.2 Class I railroads have annual carrier operating revenue of $433.2 million or more. Regional (Class II) railroads have annual carrier operating revenue
greater than $20.5 million and less than $433.2 million. Local (Class III) railroads have annual carrier operating revenue below $20.5 million.
Table 3-1. Miles of Infrastructure by Transportation Mode: 1990, 2000, and 2008-2011Source: Public Roads: U.S. Department of Transportation, Federal Highway Administration, Highway Statistics (Washington, DC: annual issues), tables HM-16 and HM-49, available at www.fhwa.dot.gov/policyinformation/statistics/2011/ as of October 5,
2013. Rail: Association of American Railroads, Railroad Facts (Washington, DC: annual issues). Navigable channels: U.S. Army Corps of Engineers, A Citizen’s Guide to the USACE, available at www.corpsreform.org/sitepages/downloads/CitzGuideChptr1.pdf as of October 5, 2013. Great Lakes-St. Lawrence Seaway: The St. Lawrence Seaway Development Corporation, “The Seaway,” available at www.greatlakes-seaway.com/en/seaway/facts/index.html as of October 5, 2013. Pipelines: U.S. Department of Transportation, Pipeline and Hazardous Materials Safety Administration, Office of Pipeline Safety, Pipeline Statistics, available at www.phmsa.dot.gov/pipeline/library/data-stats as of October 5, 2013.

16
Intermodal connectors are important components of the highway network. They provide access between major intermodal facilities, such as ports and truck/pipeline terminals, and the national Highway System (nHS). Although intermodal connectors account for about one-half of one percent of total nHS mileage (1,222 miles), they handle a large volume of trucks.
Table 3-2. Freight Intermodal Connectors on the National Highway System by State: 2013
StatePort
TerminalTruck/ Rail
FacilityAirport
Truck/ Pipeline Terminal
Total 323 267 262 67Alabama 5 4 4 1Alaska 8 0 9 0Arizona 0 2 3 0Arkansas 3 7 4 3California 17 15 14 3Colorado 0 5 6 4Connecticut 3 0 1 0Delaware 1 0 1 0District of Columbia 0 0 0 0Florida 14 12 24 0Georgia 5 13 4 7Hawaii 10 0 5 0Idaho 1 0 2 1Illinois 9 42 4 0Indiana 8 2 5 0Iowa 6 1 3 3Kansas 0 4 1 2Kentucky 4 7 3 3Louisiana 9 9 8 0Maine 3 4 5 0Maryland 8 3 1 3Massachusetts 5 10 12 0Michigan 14 8 11 0Minnesota 1 1 3 0Mississippi 20 2 3 0Missouri 4 8 3 0Montana 0 0 1 0Nebraska 0 2 1 1Nevada 0 0 2 0New Hampshire 1 0 3 0New Jersey 5 5 2 0New Mexico 0 0 1 0New York 8 16 16 0North Carolina 2 4 9 5North Dakota 0 0 2 0Ohio 29 19 8 5Oklahoma 3 1 2 1Oregon 15 5 6 1Pennsylvania 8 7 4 2Rhode Island 2 0 1 0South Carolina 4 2 4 0South Dakota 0 2 3 0Tennessee 5 8 4 2Texas 43 20 23 18Utah 0 2 1 2Vermont 0 2 2 0Virginia 6 3 7 0Washington 13 6 14 0West Virginia 2 0 2 0Wisconsin 19 4 5 0Wyoming 0 0 0 0
Table 3-2. Freight Intermodal Connectors on the National Highway System by State: 2013Source: U.S. Department of Transportation, Federal Highway Administration, Office of Planning, Environment, and Realty, Intermodal Connectors, available at www.fhwa.dot.gov/planning/national_highway_system/intermodal_connectors/ as of
October 3, 2013.

17
A vast number of vehicles and vessels move goods over the transportation network. The number of highway vehicles has remained relatively stable in recent years, while the number of rail cars has continued to decline with improved utilization and the deployment of larger cars.
Table 3-3. Number of Trucks, Locomotives, Rail Cars, and Vessels: 1990, 2000, and 2008-2011
1990 2000 2008 2009 2010 2011
Highway (all vehicles)1 NA NA 255,917,664 254,212,610 250,070,048 253,108,389
Truck, single-unit 2-axle 6-tire or more NA NA 8,288,046 8,356,097 8,217,189 7,819,055
Truck, combination NA NA 2,585,229 2,617,118 2,552,865 2,451,638
Truck, total NA NA 10,873,275 10,973,215 10,770,054 10,270,693
Trucks as percent of all highway vehicles NA NA 4.2 4.3 4.3 4.1
Rail
Class I, locomotive 18,835 20,028 24,003 24,045 23,893 24,250
Class I, freight cars2 658,902 560,154 450,297 416,180 397,730 380,699
Nonclass I, freight cars2 103,527 132,448 109,487 108,233 101,755 95,972
Car companies and shippers freight cars2 449,832 688,194 833,188 839,020 809,544 806,554
Water 39,445 41,354 40,301 40,109 40,512 40,521
Nonself-propelled vessels3 31,209 33,152 31,238 31,008 31,412 31,498
Self-propelled vessels4 8,236 8,202 9,063 9,101 9,100 9,023
Key: NA = not available.1 Based on a new methodology, FHWA revised its annual vehicle-miles traveled, number of vehicles, and fuel economy data beginning with 2007.
Information on the new methodology is available at www.fhwa.dot.gov/policyinformation/statistics.cfm. Data in this table should not be compared to those in pre-2011 editions of Freight Facts and Figures.
2 Beginning with 2001 data, Canadian-owned U.S. railroads are excluded. Canadian-owned U.S. railroads accounted for over 46,000 freight cars in 2000.
3 Nonself-propelled vessels include dry-cargo barges, tank barges, and railroad-car floats.4 Self-propelled vessels include dry cargo, passenger, off-shore support, tankers, and towboats.
Table 3-3. Number of Trucks, Locomotives, Rail Cars, and Vessels: 1990, 2000, and 2008-2011Source: Highway: U.S. Department of Transportation, Federal Highway Administration, Highway Statistics (Washington, DC: annual issues), table VM-1, available at www.fhwa.dot.gov/policyinformation/statistics/2011/ as of September 11, 2013. Rail:
Locomotive: Association of American Railroads, Railroad Facts (Washington, DC: annual issues). Freight cars: Association of American Railroads, Railroad Equipment Report (Washington, DC: annual issues). Water: U.S. Army Corps of Engineers, Institute for Water Resources, Waterborne Transportation Lines of the United States, Volume 1, National Summaries (New Orleans, LA: annual issues), available at www.navigationdatacenter.us/veslchar/veslchar.htm as of September 24, 2013.
18
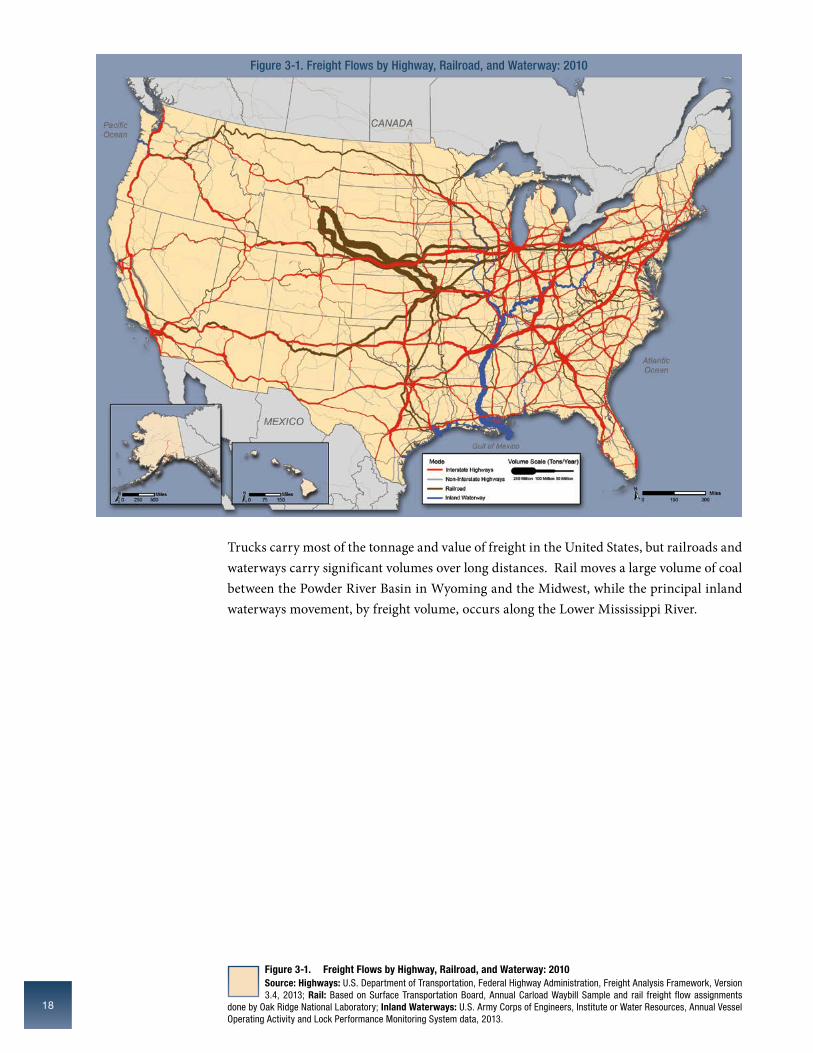
Trucks carry most of the tonnage and value of freight in the United States, but railroads and waterways carry significant volumes over long distances. Rail moves a large volume of coal between the Powder River Basin in Wyoming and the Midwest, while the principal inland waterways movement, by freight volume, occurs along the Lower Mississippi River.
Figure 3-1. Freight Flows by Highway, Railroad, and Waterway: 2010
Figure 3-1. Freight Flows by Highway, Railroad, and Waterway: 2010Source: Highways: U.S. Department of Transportation, Federal Highway Administration, Freight Analysis Framework, Version 3.4, 2013; Rail: Based on Surface Transportation Board, Annual Carload Waybill Sample and rail freight flow assignments
done by Oak Ridge National Laboratory; Inland Waterways: U.S. Army Corps of Engineers, Institute or Water Resources, Annual Vessel Operating Activity and Lock Performance Monitoring System data, 2013.

19
Transportation facilities that move international trade into and out of the United States demonstrate the importance of all modes and intermodal combinations to global connectivity. The top 25 foreign-trade gateways measured by value of shipments consist of 11 water ports, 5 land-border crossings, and 9 air gateways.
Figure 3-2. Top 25 U.S.-International Trade Freight Gateways by Value of Shipments: 2011Sources: Air: U.S. Department of Commerce, U.S. Census Bureau, Foreign Trade Division, special tabulation, October 2012; Water: U.S. Army Corps of Engineers, Institute for Water Resources, special tabulation, October 2012; Land: U.S. Department
of Transportation, Bureau of Transportation Statistics, North American TransBorder Freight Data, special tabulation, available at www.bts.gov/programs/international/transborder/ as of October 2012; as reported in U.S. Department of Transportation, Bureau of Transportation Statistics, National Transportation Statistics, available at www.rita.dot.gov/bts/publications as of October 8, 2013.
Figure 3-2. Top 25 U.S.-International Trade Freight Gateways by Value of Shipments: 2011
Notes: All data: Trade levels reflect the mode of transportation as a shipment enters or exits at a border port. Flows through individual ports are based on reported data collected from U.S. trade documents. Trade does not include low-value shipments. (In general, these are imports valued at less than $1,250 and exports that are valued at less than $2,500). Air: Data for all air gateways include a low level (generally less than 2%-3% of the total value) of small user-fee airports located in the same region. Air gateways not identified by airport name (e.g., Chicago, IL, and others) include major airport(s) in that geographic area in addition to small regional airports. In addition, due to U.S. Census Bureau confidentiality regulations, data for courier operations are included in the airport totals for JFK International Airport, Cleveland, New Orleans, Los Angeles, Chicago, Miami, and Anchorage. To further protect data for individual couriers, data for Memphis is included with New Orleans and data for Louisville is included with Cleveland.

20
different modes of transportation frequently work together to move high-value, time-sensitive cargo. The classic forms of rail intermodal transportation are trailer-on-flatcar and container-on-flatcar, and these services are spread throughout the United States. The largest concentrations are on routes between Pacific Coast ports and Chicago, southern California and Texas, and Chicago and new york.
Figure 3-3. Tonnage of Trailer-on-Flatcar and Container-on-Flatcar Rail Intermodal Moves: 2011
Figure 3-3. Tonnage of Trailer-on-Flatcar and Container-on-Flatcar Rail Intermodal Moves: 2011Source: U.S. Department of Transportation, Federal Railroad Administration, special tabulation, September 2013.

21
Containerized cargo has grown rapidly in recent years and is concentrated at a few large water ports. The Ports of Los Angeles and Long Beach together handle about 37 percent of all container traffic at water ports in the United States. Container trade at these two ports increased by nearly 61 percent between 2000 and 2011, roughly equal to that reported for container cargo overall.
Figure 3-4. Top 25 Water Ports by Containerized Cargo: 2011Source: U.S. Department of Transportation, Maritime Administration, U.S. Waterborne Container Trade by U.S. Custom Ports, based on data provided by Port Import/Export Reporting Service, available at www.marad.dot.gov/library_landing_page/data_and_statistics/Data_and_Statistics.htm as of September 13, 2013.
Figure 3-4. Top 25 Water Ports by Containerized Cargo: 2011
Notes: The data include both government and non-government shipments by vessel into and out of U.S. foreign trade zones, the 50 states, District of Columbia, and Puerto Rico.

2222
From 2006 to 2011, the number of calls by containership with capacities of 5,000 TEUs or greater has increased by nearly 80 percent. These large container ships accounted for 27 percent of total containership calls at U.S. ports in 2011, up from 17 percent in 2006.
Table 3-4. Containership Calls at U.S. Ports by Vessel Size and Number of Vessels: 2006-2011
Vessel Size (TEUs) 2006 2007 2008 2009 2010 2011
Calls< 2,000 (R) 4,143 (R) 3,900 (R) 3,492 (R) 3,287 (R) 3,707 4,5632,000-2,999 (R) 3,985 4,099 (R) 3,344 (R) 2,676 (R) 2,760 2,8783,000-3,999 3,333 2,866 2,460 (R) 2,499 (R) 2,052 2,3634,000-4,999 4,782 5,033 (R) 5,120 (R) 5,303 (R) 5,876 6,421> 4,999 3,344 3,961 (R) 4,313 4,434 5,126 5,997
Total Calls (R) 19,587 (R) 19,859 (R) 18,729 (R) 18,199 (R) 19,521 22,222
Vessels< 2,000 212 195 196 179 178 1822,000-2,999 257 230 219 220 206 1843,000-3,999 177 166 141 147 130 1314,000-4,999 258 271 284 306 315 307> 4,999 260 277 326 366 396 418Total Vessels 1,164 1,140 1,166 1,218 1,225 1,222
Key: TEU = twenty-foot equivalent unit; R = revised.
Table 3-4. Containership Calls at U.S. Ports by Vessel Size and Number of Vessels: 2006-2011Sources: Lloyd’s Marine Intelligence Unit, Vessel Movements Data Files, 2006-2011 (London: Lloyd’s Marine Intelligence Unit, 2007-2012); Lloyd’s Marine Intelligence Unit, Seasearcher (London: Lloyd’s Marine Intelligence Unit, 2012); and Clarkson
Research Studies, Clarkson’s Vessel Registers (London: Clarkson Research Studies, January 2012); as reported in U.S. Department of Transportation, Maritime Administration, Vessel Calls Snapshot, 2011 (Washington, DC: 2013), available at www.marad.dot.gov/documents/Vessel_Calls_at_US_Ports_Snapshot.pdf as of September 25, 2013.

23
Although the top ports for containerized cargo are primarily on the Pacific and Atlantic Coasts, bulk cargo, such as coal, crude petroleum, and grain moves through ports on the gulf Coast and inland waterway system. The top 25 water ports by tonnage handle more than two-thirds of the weight of all foreign and domestic goods moved by water.
Figure 3-5. Top 25 Water Ports by Tonnage: 2011
Figure 3-5. Top 25 Water Ports by Tonnage: 2011 Source: U.S. Army Corps of Engineers, 2011 Waterborne Commerce of the United States, Part 5, National Summaries (Alexandria, VA: 2012), table 5-2, available at www.navigationdatacenter.us/wcsc/ as of September 17, 2013.

24
In 2011, 7,662 oceangoing vessels made 67,929 calls at U.S. ports, a 13 percent increase from the previous year. Tankers accounted for 35 percent of total calls, followed by containerships (33 percent) and dry bulk vessels (16 percent). Approximately 98 percent of all tankers calling at U.S. ports are double-hull vessels, a 14 percent increase from five years earlier.
The average vessel size per call at U.S. ports increased from 50,653 deadweight tons (dWT) in 2006 to 53,955 dWT in 2011, an increase of nearly 7 percent. The average size
Table 3-5. Number of Vessel Calls at U.S. Ports: 2006-2011 (Vessels Weighing 10,000 Deadweight Tons or Greater)
Type (R) 2006 (R) 2007 (R) 2008 (R) 2009 (R) 2010 2011Percent Change,
2006-2011 Tanker 20,391 20,699 20,096 18,991 20,832 23,678 16.1
Double hull 17,070 18,158 18,315 18,035 20,199 23,214 36.0Product 12,746 12,671 12,182 11,413 12,537 14,677 15.1
Double hull 9,869 10,350 10,561 10,534 11,947 14,216 44.0Crude 7,645 8,028 7,914 7,578 8,295 9,001 17.7
Double hull 7,201 7,808 7,754 7,501 8,252 8,998 25.0Container 19,587 19,859 18,729 18,199 19,521 22,222 13.5Dry Bulk 11,579 10,081 9,513 7,884 9,227 10,883 -6.0Roll on/Roll off 6,315 6,074 5,962 4,947 5,842 6,172 -2.3Vehicle 4,181 4,084 4,101 3,336 4,100 4,339 3.8
Gas 879 824 698 659 738 846 -3.8Liquefied Natural Gas 213 202 171 201 202 157 -26.3
Combo 319 222 169 127 158 120 -62.4General 3,983 3,844 3,584 3,274 3,553 4,008 0.6All Types 63,053 61,603 58,751 54,081 59,871 67,929 7.7
Key: R = revised.
Table 3-5. Number of Vessel Calls at U.S. Ports: 2006-2011 (Vessels Weighing 10,000 Deadweight Tons or Greater) Sources: Lloyd’s Marine Intelligence Unit, Vessel Movements Data Files, 2006-2011 (London: Lloyd’s Marine Intelligence Unit, 2007-2012); Lloyd’s Marine Intelligence Unit, Seasearcher (London: Lloyd’s Marine Intelligence Unit, 2012); and Clarkson
Research Studies, Clarkson’s Vessel Registers (London: Clarkson Research Studies, January 2012); as reported in U.S. Department of Transportation, Maritime Administration, Vessel Calls Snapshot, 2011 (Washington, DC: 2013), available at www.marad.dot.gov/documents/Vessel_Calls_at_US_Ports_Snapshot.pdf as of September 25, 2013.
Table 3-6. Average Vessel Size per Call at U.S. Ports: 2006-2011 (Deadweight Tons)Sources: Lloyd’s Marine Intelligence Unit, Vessel Movements Data Files, 2005-2011 (London: Lloyd’s Marine Intelligence Unit, 2007-2012); Lloyd’s Marine Intelligence Unit, Seasearcher (London: Lloyd’s Marine Intelligence Unit, 2012); and Clarkson Research Studies, Clarkson’s Vessel Registers (London: Clarkson Research Studies, January 2012); as reported in U.S. Department of Transportation, Maritime Administration, Vessel Calls Snapshot, 2011 (Washington, DC: 2013), available at www.marad.dot.gov/documents/Vessel_Calls_at_US_Ports_Snapshot.pdf as of September 25, 2013.
Table 3-6. Average Vessel Size per Call at U.S. Ports: 2006-2011 (Deadweight Tons)
Type (R) 2006 (R) 2007 (R) 2008 (R) 2009 (R) 2010 2011Percent Change,
2006-2011
Tanker 72,340 72,741 72,660 72,483 71,748 70,749 -2.2Double hull 76,306 76,898 75,358 74,012 72,689 71,375 -6.5
Product 37,765 36,766 36,672 37,363 37,373 37,572 -0.5Double hull 37,972 37,048 36,909 37,305 37,291 37,520 -1.2
Crude 129,984 129,521 128,056 125,377 123,703 124,847 -4.0Double hull 128,844 129,723 127,725 125,561 123,937 124,862 -3.1
Container 46,602 47,726 49,214 50,207 51,266 51,216 9.9 TEU 3,503 3,598 3,744 3,849 3,932 3,969 13.3
Dry Bulk 44,578 45,145 47,276 48,126 50,439 53,701 20.5Roll on/Roll off 19,750 19,634 20,146 20,631 20,574 20,831 5.5Vehicle 18,801 18,585 18,886 19,203 19,261 19,745 5.0
Gas 41,287 41,262 41,388 45,078 44,154 40,744 -1.3Cubic meters 61,739 61,486 61,921 68,722 66,980 59,697 -3.3
Liquefied Natural Gas 70,962 73,703 70,097 74,465 74,445 81,363 14.7Cubic meters 130,006 134,832 128,834 135,895 137,028 151,719 16.7
Combo 86,338 94,837 98,709 102,115 106,559 109,331 26.6General 25,408 25,540 24,596 23,641 23,595 22,758 -10.4All Types 50,653 51,638 52,518 53,472 53,687 53,955 6.5
Key: TEU = twenty-foot equivalent unit; R = revised.

25
of containerships increased by 13 percent in terms of TEU capacity (10 percent in terms of dWT) as carriers expanded the deployment of post-panamax container ships in U.S. trades. Post-panamax refers to vessels that are larger than the width and length of the lock chambers in the Panama Canal.
The three most important U.S. airports that handle all-cargo aircraft are Memphis, Anchorage, and Louisville. Memphis and Louisville are major hubs for FedEx and the United Parcel Service, respectively. Anchorage is a major international gateway for trade with Asia.
Table 3-7. Top 25 Airports by Landed Weight of All-Cargo Operations: 2000 and 2009-20121
2012 Rank
Landed weight (thousands of short tons)
Airport 2000 2009 2010 2011 2012
Memphis, TN (Memphis International) 1 6,318 9,464 9,772 10,152 10,263
Anchorage, AK (Ted Stevens Anchorage International)2 2 8,084 7,762 9,732 8,887 8,261
Louisville, KY (Louisville International-Standiford Field) 3 3,987 5,139 5,319 5,491 5,462
Miami, FL (Miami International) 4 2,929 3,176 3,453 3,317 3,574
Indianapolis, IN (Indianapolis International) 5 2,884 2,288 2,359 2,407 2,470
Chicago, IL (O'Hare International) 6 2,062 1,750 2,448 2,184 2,278
Los Angeles, CA (Los Angeles International) 7 2,892 1,884 1,977 2,022 2,102
New York, NY (John F. Kennedy International) 8 2,793 1,591 1,962 1,972 1,747
Cincinnati, OH (Cincinnati /Northern Kentucky International) 9 912 564 1,216 1,410 1,594
Fort Worth, TX (Dallas/Fort Worth International) 10 1,691 1,436 1,516 1,532 1,544
Newark, NJ (Newark Liberty International) 11 1,961 1,464 1,489 1,525 1,427
Oakland, CA (Metropolitan Oakland International) 12 1,811 1,341 1,324 1,340 1,323
Ontario, CA (Ontario International) 13 1,220 1,168 1,121 1,157 1,181
Atlanta, GA (William B. Hartsfield International) 14 1,090 1,278 1,314 1,328 1,014
Honolulu, HI (Honolulu International) 15 692 1,021 1,062 1,057 988
Philadelphia, PA (Philadelphia International) 16 1,454 1,132 994 975 947
Houston, TX (George Bush Intercontinental) 17 480 784 763 808 784
Phoenix, AZ (Sky Harbor International) 18 920 610 607 620 650
Seattle, WA (Seattle-Tacoma International) 19 1,060 803 697 679 645
Denver, CO (Denver International) 20 900 624 619 605 602
San Francisco, CA (San Francisco International) 21 1,267 747 652 622 599
Portland, OR (Portland International) 22 882 545 531 567 581
Salt Lake City, UT (Salt Lake City International) 23 751 449 424 428 438
Minneapolis, MN (Minneapolis-St Paul International/Wold-Chamberlain) 24 622 474 512 484 438
San Juan, PR (Luis Munoz Marin International) 25 485 543 441 434 425
Top 25 airports3 52,381 48,153 52,350 52,043 51,338
United States, all airports4 74,743 63,191 67,530 66,095 67,448
Top 25 as % of U.S. total 70.1 76.2 77.5 78.7 76.1
1 Dedicated to the exclusive transportation of cargo, all-cargo operations do not include aircraft carrying passengers that also may be carrying cargo. Aircraft landed weight is the certificated maximum gross landed weight of the aircraft as specified by the aircraft manufacturers.
2 Anchorage includes a large share of all-cargo operations in-transit.3 Airport rankings change each year. Totals represent the top 25 airports for each year, not necessarily the top 25 airports listed here for 2012.4 Limited to airports with an aggregate landed weight in excess of 100 million pounds (50,000 short tons) annually.Note: 1 short ton = 2,000 pounds.
Table 3-7. Top 25 Airports by Landed Weight of All-Cargo Operations: 2000 and 2009-2012Source: U.S. Department of Transportation, Federal Aviation Administration, Air Carrier Activity Information System (ACAIS) database, All-Cargo Data, available at www.faa.gov/airports/planning_capacity/passenger_allcargo_stats/passenger/ as of September 11, 2013.

26
A handful of states are responsible for the bulk of domestic production. Texas is the largest oil producing state while north dakota, where the Bakken shale formation is located, has the distinction of being the fastest growing oil producer. Alaska and California also are major oil producing states.
Figure 3-6. Crude Oil Production by State: 2011Source: U.S. Department of Transportation, Federal Highway Administration, Office of Freight Management and Operations, Freight Analysis Framework, version 3.4, 2013.
Figure 3-6. Crude Oil Production by State: 2011
27
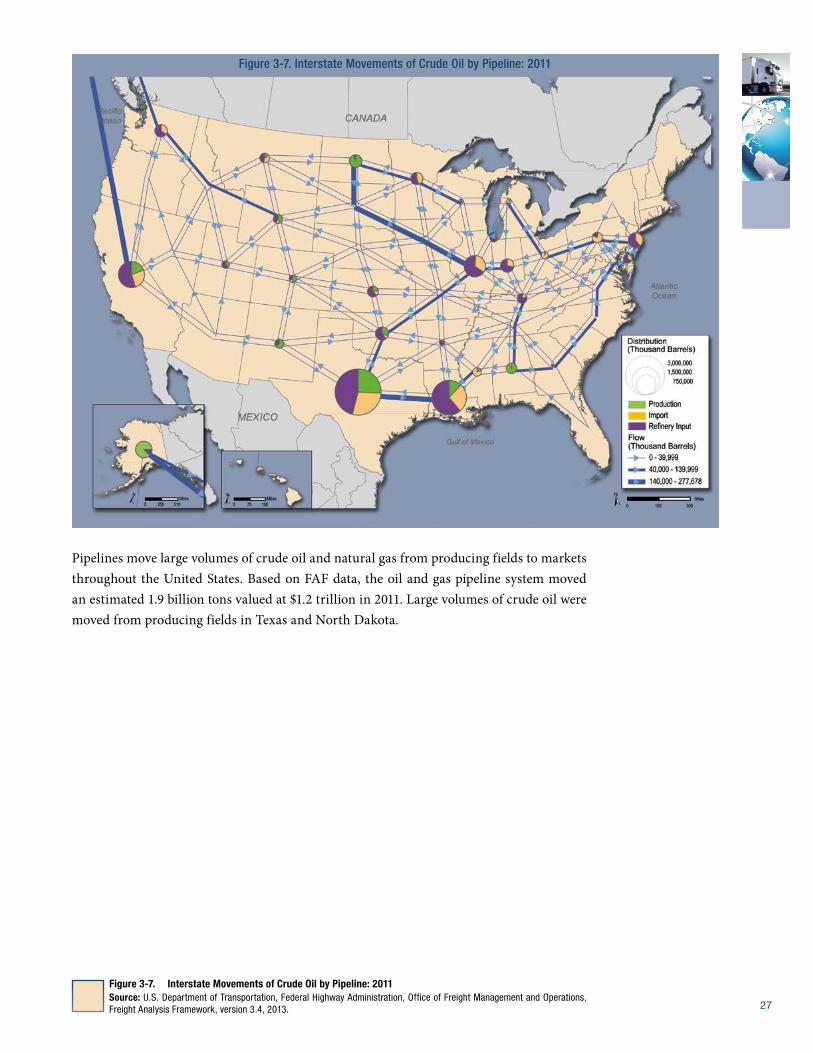
Pipelines move large volumes of crude oil and natural gas from producing fields to markets throughout the United States. Based on FAF data, the oil and gas pipeline system moved an estimated 1.9 billion tons valued at $1.2 trillion in 2011. Large volumes of crude oil were moved from producing fields in Texas and north dakota.
Figure 3-7. Interstate Movements of Crude Oil by Pipeline: 2011 Source: U.S. Department of Transportation, Federal Highway Administration, Office of Freight Management and Operations, Freight Analysis Framework, version 3.4, 2013.
Figure 3-7. Interstate Movements of Crude Oil by Pipeline: 2011

28
natural gas is located in many of the same areas as crude oil. gathering pipelines (or trunk lines) move the gas from the well to processing plants where impurities are removed. From the processing plants, natural gas is moved to areas of high natural gas demand via an extensive and complex system of interstate pipelines. The interstate pipeline network spans about 217,000 miles.
Figure 3-8. Interstate Movements of Natural Gas by Pipeline: 2011
Figure 3-8. Interstate Movements of Natural Gas by Pipeline: 2011 Source: U.S. Department of Transportation, Federal Highway Administration, Office of Freight Management and Operations, Freight Analysis Framework, version 3.4, 2013.

29
despite doubling over the past two decades, truck traffic remains a relatively small share of highway traffic as a whole. In 2011, commercial trucks accounted for about 9 percent of highway vehicle-miles traveled. Truck tractors hauling semitrailers and other truck combinations accounted for approximately 63 percent of commercial truck travel, while single-unit trucks with six or more tires accounted for the remainder.
Figure 3-9. Share of Highway Vehicle-Miles Traveled by Vehicle Type: 2011Source: U.S. Department of Transportation, Federal Highway Administration, Highway Statistics (Washington, DC: annual issues), table VM-1, available at www.fhwa.dot.gov/policyinformation/statistics/2011/ as of September 2, 2013.
Figure 3-9. Share of Highway Vehicle-Miles Traveled by Vehicle Type: 2011
Notes: “Other” comprises bus and motorcycle. “Light-duty vehicles” includes passenger cars, light trucks, vans, and sport utility vehicles. Based on a new methodology, FHWA revised its annual vehicle-miles traveled, number of vehicles, and fuel economy data beginning with 2007. Information on the new methodology is available at www.fhwa.dot.gov/policyinformation/statistics.cfm. Data in this figure should not be compared to those in pre-2011 editions of Freight Facts and Figures.

3030
The nation’s truck fleet has grown significantly in number and distance driven. of trucks weighing more than 10,000 pounds registered to businesses, individuals, and organizations other than government, most growth has occurred at either end of the weight spectrum. distance traveled more than doubled between 1987 and 2002 for trucks weighing between 10,000 pounds and 26,000 pounds and for trucks weighing over 80,000 pounds. Trucks between 60,000 pounds and 80,000 pounds form the largest category in both number of trucks and vehicle-miles traveled because in most cases 80,000 pounds is the maximum weight allowed on the highway system without special permits.
Table 3-8. Trucks and Truck Miles by Average Weight: 1987, 1992, 1997, and 20021
1987 1992 1997 2002Percent Change,
1987 to 2002Average weight (pounds)
Number (thousands)
VMT (millions)
Number (thousands)
VMT (millions)
Number (thousands)
VMT (millions)
Number (thousands)
VMT (millions)
Number VMT
Total 3,624 89,972 4,008 104,987 4,701 147,876 5,415 145,624 49.4 61.9Light-heavy 1,030 10,768 1,259 14,012 1,436 19,815 1,914 26,256 85.9 143.810,001 to 14,000 525 5,440 694 8,000 819 11,502 1,142 15,186 117.6 179.214,001 to 16,000 242 2,738 282 2,977 316 3,951 396 5,908 63.6 115.816,001 to 19,500 263 2,590 282 3,035 301 4,362 376 5,161 43.2 99.3
Medium-heavy 766 7,581 732 8,143 729 10,129 910 11,766 18.8 55.219,501 to 26,000 766 7,581 732 8,143 729 10,129 910 11,766 18.8 55.2
Heavy-heavy 1,829 71,623 2,017 82,832 2,536 117,931 2,591 107,602 41.7 50.226,001 to 33,000 377 5,411 387 5,694 428 7,093 437 5,845 15.9 8.033,001 to 40,000 209 4,113 233 5,285 257 6,594 229 3,770 9.7 -8.440,001 to 50,000 292 7,625 339 9,622 400 13,078 318 6,698 9.0 -12.250,001 to 60,000 188 7,157 227 8,699 311 12,653 327 8,950 73.8 25.160,001 to 80,000 723 45,439 781 51,044 1,070 74,724 1,179 77,489 63.1 70.580,001 to 100,000 28 1,254 33 1,529 46 2,427 69 2,950 144.3 135.2100,001 to 130,000 8 440 12 734 18 1,051 26 1,571 238.5 257.2130,001 or more 4 185 5 227 6 312 6 329 43.2 77.9
Key: VMT = vehicle-miles traveled. 1 Excludes trucks with an average weight of 10,000 pounds or less.
Note: Weight includes the empty weight of the vehicle plus the average weight of the load carried. Numbers may not add to totals due to rounding.
Table 3-8. Trucks and Truck Miles by Average Weight: 1987, 1992, 1997, and 2002Source: U.S. Department of Commerce, Census Bureau, 2002 Vehicle Inventory and Use Survey: United States, EC02TV-US (Washington, DC: 2004), available at www.census.gov/prod/ec02/ec02tv-us.pdf as of September 20, 2013; U.S. Department of
Commerce, Census Bureau, 1992 Truck Inventory and Use Survey: United States, TC92-T-52 (Washington, DC: 1995), available at www.census.gov/prod/ec97/97tv-us.pdf as of September 20, 2013.

31
Federal and state governments are concerned about truck weight because of the damage that heavy trucks can do to roads and bridges. To monitor truck weight, more than 189 million weighs were made in 2012, about 61 percent of which were weigh-in-motion, and 39 percent were static. Approximately 2 percent of commercial vehicle weighs discover violations.
Freight moving in combination trucks depends heavily on the Interstate System. Although only one-fourth of the distance traveled by all traffic is on the Interstate System, nearly one-half of combination-truck vehicle miles of travel are on Interstate highways.
Table 3-9. Commercial Vehicle Weight Enforcement Activities: 2006-2012Source: U.S. Department of Transportation, Federal Highway Administration, Office of Freight Management and Operations, Annual State Certifications of Size and Weight Enforcement on Federal-aid Highways, as prescribed under CFR Part 657,
October 5, 2013.
Table 3-10. Annual Vehicle Distance Traveled by Highway Category and Vehicle Type: 2011Source: U.S. Department of Transportation, Federal Highway Administration, Highway Statistics, Table VM-1, available at www.fhwa.dot.gov/policyinformation/statistics/2011/ as of September, 2, 2013.
Table 3-10. Annual Vehicle Distance Traveled by Highway Category and Vehicle Type: 2011
Combination Trucks
Single-Unit Trucks1 Other2
Light-duty Vehicles3
Total, All Motor
Vehicles
Interstate vehicle-miles (millions) 81,431 23,621 7,159 608,081 720,291 Interstate percent 49.7 22.8 22.2 23.0 24.4 Non-Interstate vehicle-miles (millions) 82,260 79,894 25,123 2,038,560 2,225,839 Non-Interstate percent 50.3 77.2 77.8 77.0 75.6 Total vehicle-miles, all roadways 163,692 103,515 32,283 2,646,641 2,946,131
1 Trucks on a single frame with at least two axles and six tires2 Includes buses and motorcycles.3 Includes passenger cars, light trucks, vans and sport utility vehicles with a wheelbase equal to or less than 121 inches and large
passenger cars, vans, light trucks, and sport utility vehicles with a wheelbase larger than 121 inches.
Notes: Based on a new methodology, FHWA revised its annual vehicle-miles traveled, number of vehicles, and fuel economy data beginning with 2007. Information on the new methodology is available at www.fhwa.dot.gov/policyinformation/statistics.cfm. Data in this table should not be compared to those in pre-2011 editions of Freight Facts and Figures. Numbers may not add to totals due to rounding.
Table 3-9. Commercial Vehicle Weight Enforcement Activities: 2006-2012
2006 2007 2008 2009 2010 2011 2012
All Weighs 229,450,656 217,444,117 200,419,382 182,256,996 198,564,690 185,498,220 189,743,150Weigh-in-Motion 142,598,736 132,257,618 119,826,305 116,176,399 118,025,789 119,718,032 116,640,351
Static Weighs1 86,851,920 85,186,499 80,593,077 66,080,597 80,538,901 65,780,188 73,102,799
Semiportable Scales 422,860 425,731 357,502 373,073 285,484 323,936 278,308
Fixed Scales 85,900,007 84,213,507 79,644,702 65,182,174 79,703,573 64,922,321 72,258,822
Portable Scales 529,053 547,261 590,873 525,350 549,844 533,931 565,669
Violations2 621,391 530,350 555,168 489,975 478,576 415,545 408,492Axle Weight Violations 269,758 233,563 248,813 220,631 216,735 178,209 179,774
Gross Weight Violations 149,561 126,761 120,384 116,291 114,171 84,490 91,006
Bridge Weight Violations 202,072 170,026 185,971 153,053 147,670 152,846 137,712
Permits3 4,598,227 4,827,668 5,215,724 4,528,654 4,838,663 4,944,334 4,918,118Non-Divisible Trip Permits 3,399,435 3,743,323 3,693,248 3,285,801 3,510,301 3,762,553 3,878,031
Non-Divisible Annual Permits 250,505 332,148 322,288 298,805 303,230 320,767 296,870
Divisible Trip Permits 426,381 398,003 489,712 369,906 341,737 334,650 201,633Divisible Annual Permits 521,906 354,194 710,476 574,142 683,395 526,364 541,584
1 Static weighs include the total number of vehicles weighed from semiportable, portable, and fixed scales.2 Violations include those from axle, gross, and bridge formula weight limits.3 Permits issued are for divisible and non-divisible loads on a trip or on an annual basis, as well as for the over-width movement of a divisible load.
Note: Incomplete data from District of Columbia (2008), Hawaii (2008, 2009, 2010, and 2011), Massachusetts (2010), New Hampshire (2011) Pennsylvania (2006), South Dakota (2006 and 2007), and Vermont (2011).
32
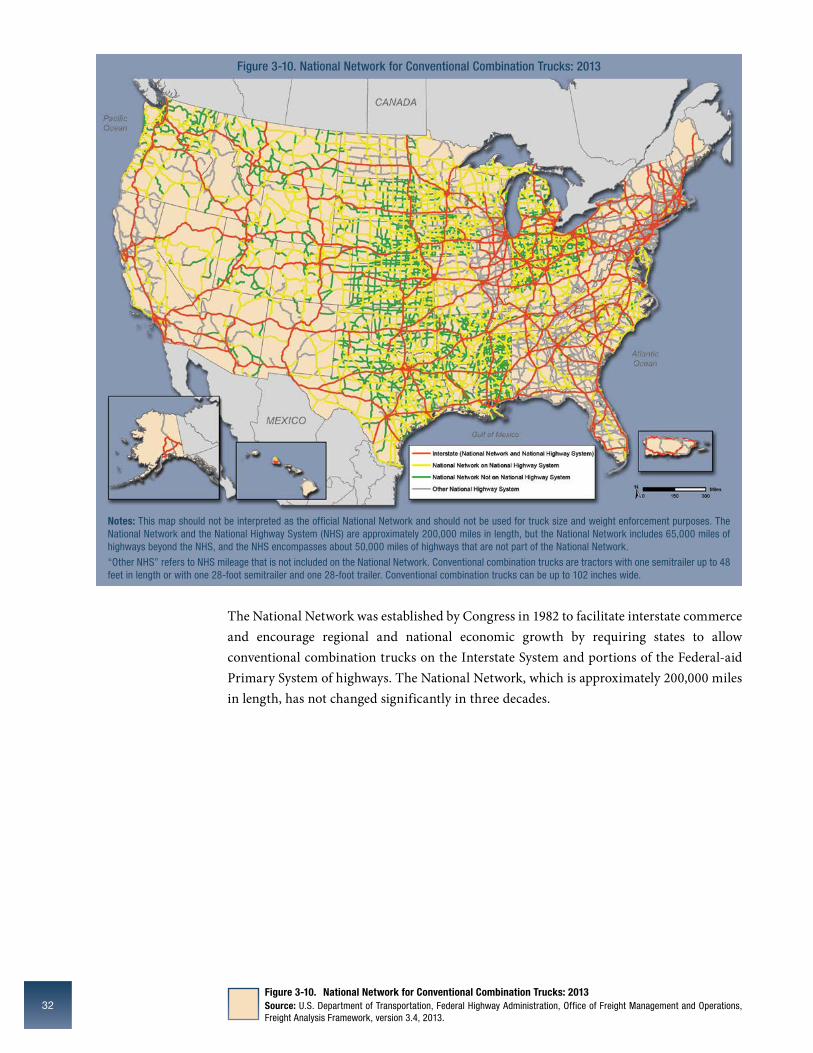
The national network was established by Congress in 1982 to facilitate interstate commerce and encourage regional and national economic growth by requiring states to allow conventional combination trucks on the Interstate System and portions of the Federal-aid Primary System of highways. The national network, which is approximately 200,000 miles in length, has not changed significantly in three decades.
Figure 3-10. National Network for Conventional Combination Trucks: 2013 Source: U.S. Department of Transportation, Federal Highway Administration, Office of Freight Management and Operations, Freight Analysis Framework, version 3.4, 2013.
Figure 3-10. National Network for Conventional Combination Trucks: 2013
Notes: This map should not be interpreted as the official National Network and should not be used for truck size and weight enforcement purposes. The National Network and the National Highway System (NHS) are approximately 200,000 miles in length, but the National Network includes 65,000 miles of highways beyond the NHS, and the NHS encompasses about 50,000 miles of highways that are not part of the National Network.
“Other NHS” refers to NHS mileage that is not included on the National Network. Conventional combination trucks are tractors with one semitrailer up to 48 feet in length or with one 28-foot semitrailer and one 28-foot trailer. Conventional combination trucks can be up to 102 inches wide.
33
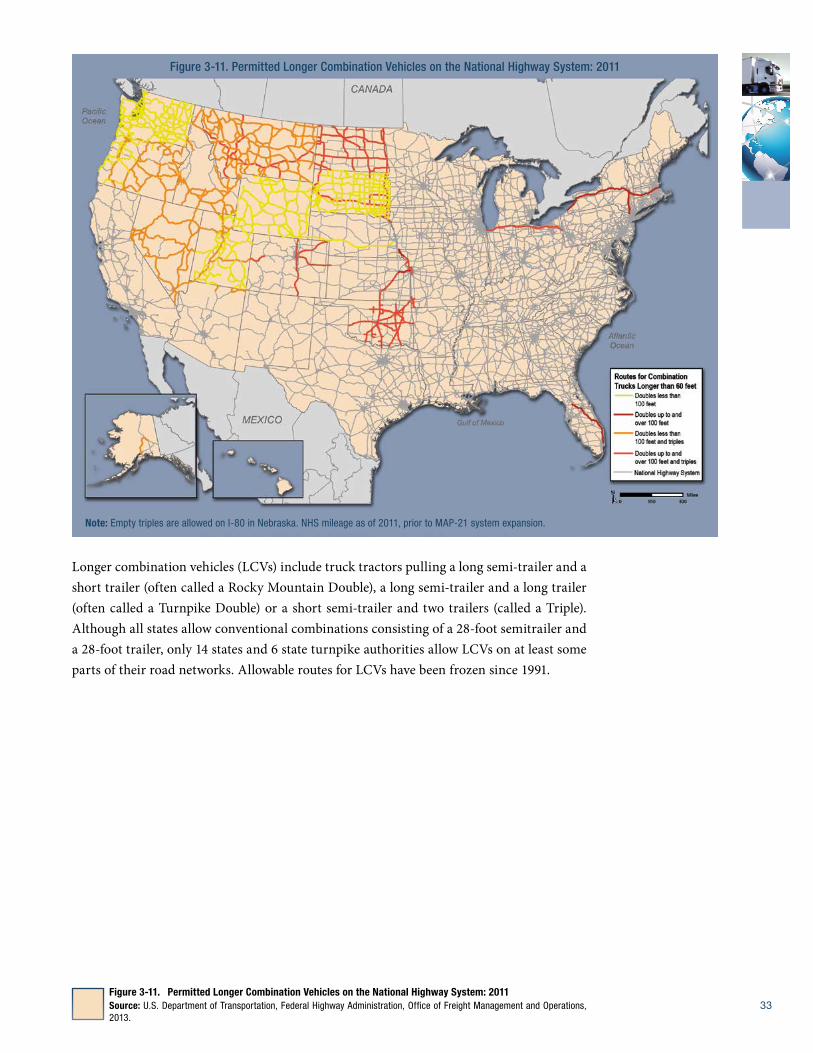
Longer combination vehicles (LCVs) include truck tractors pulling a long semi-trailer and a short trailer (often called a Rocky Mountain double), a long semi-trailer and a long trailer (often called a Turnpike double) or a short semi-trailer and two trailers (called a Triple). Although all states allow conventional combinations consisting of a 28-foot semitrailer and a 28-foot trailer, only 14 states and 6 state turnpike authorities allow LCVs on at least some parts of their road networks. Allowable routes for LCVs have been frozen since 1991.
Figure 3-11. Permitted Longer Combination Vehicles on the National Highway System: 2011
Note: Empty triples are allowed on I-80 in Nebraska. NHS mileage as of 2011, prior to MAP-21 system expansion.
Figure 3-11. Permitted Longer Combination Vehicles on the National Highway System: 2011Source: U.S. Department of Transportation, Federal Highway Administration, Office of Freight Management and Operations, 2013.
34
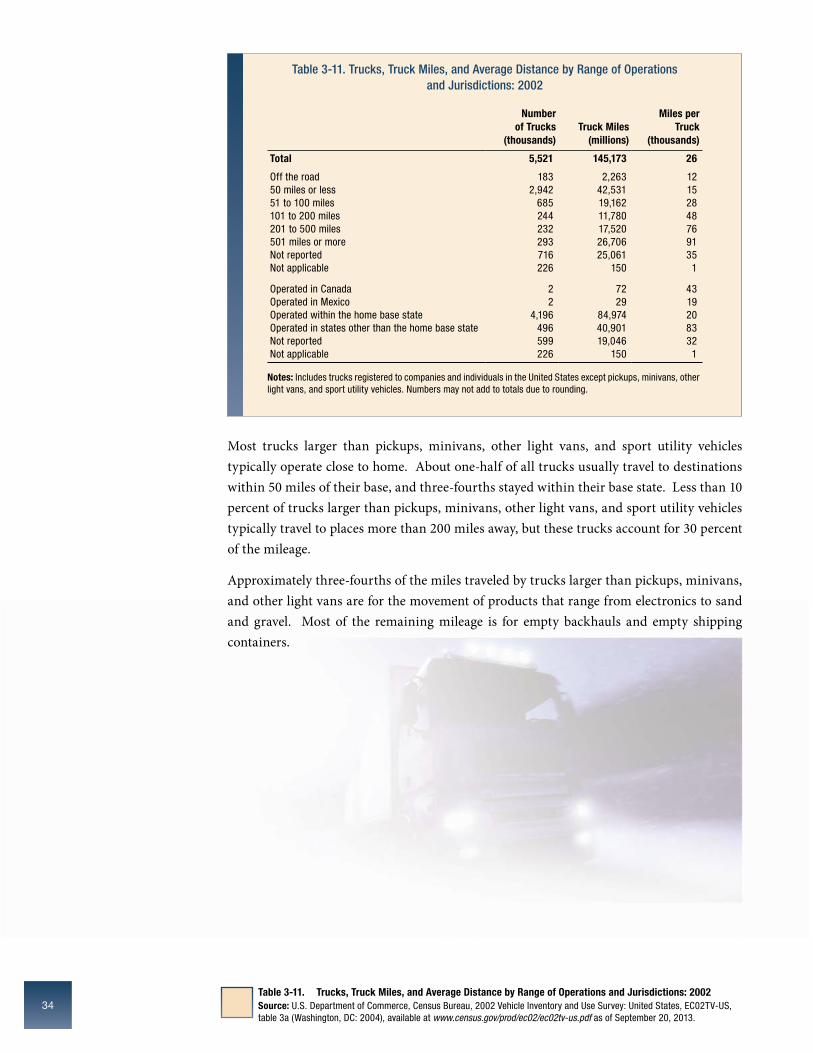
Most trucks larger than pickups, minivans, other light vans, and sport utility vehicles typically operate close to home. About one-half of all trucks usually travel to destinations within 50 miles of their base, and three-fourths stayed within their base state. Less than 10 percent of trucks larger than pickups, minivans, other light vans, and sport utility vehicles typically travel to places more than 200 miles away, but these trucks account for 30 percent of the mileage.
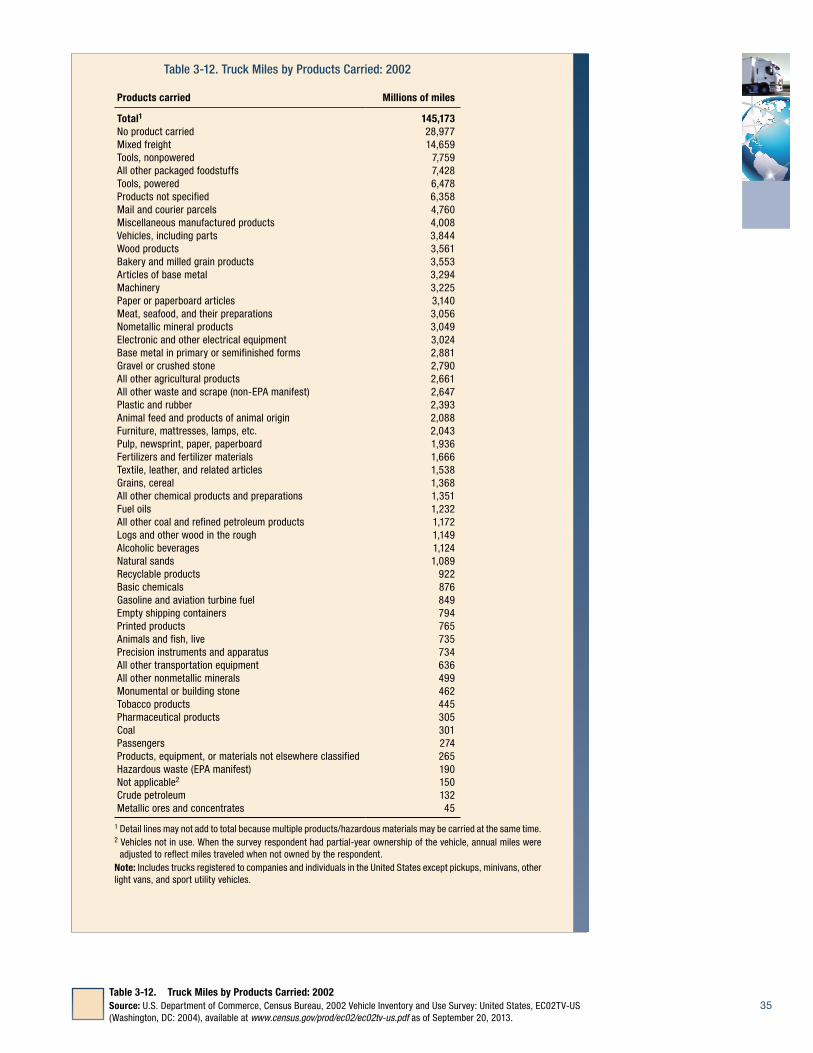
Approximately three-fourths of the miles traveled by trucks larger than pickups, minivans, and other light vans are for the movement of products that range from electronics to sand and gravel. Most of the remaining mileage is for empty backhauls and empty shipping containers.
Table 3-11. Trucks, Truck Miles, and Average Distance by Range of Operations and Jurisdictions: 2002
Number of Trucks
(thousands)Truck Miles
(millions)
Miles per Truck
(thousands)
Total 5,521 145,173 26
Off the road 183 2,263 12 50 miles or less 2,942 42,531 15 51 to 100 miles 685 19,162 28 101 to 200 miles 244 11,780 48 201 to 500 miles 232 17,520 76 501 miles or more 293 26,706 91 Not reported 716 25,061 35 Not applicable 226 150 1
Operated in Canada 2 72 43 Operated in Mexico 2 29 19 Operated within the home base state 4,196 84,974 20 Operated in states other than the home base state 496 40,901 83 Not reported 599 19,046 32 Not applicable 226 150 1
Notes: Includes trucks registered to companies and individuals in the United States except pickups, minivans, other light vans, and sport utility vehicles. Numbers may not add to totals due to rounding.
Table 3-11. Trucks, Truck Miles, and Average Distance by Range of Operations and Jurisdictions: 2002Source: U.S. Department of Commerce, Census Bureau, 2002 Vehicle Inventory and Use Survey: United States, EC02TV-US, table 3a (Washington, DC: 2004), available at www.census.gov/prod/ec02/ec02tv-us.pdf as of September 20, 2013.
35
Table 3-12. Truck Miles by Products Carried: 2002
Products carried Millions of miles
Total1 145,173No product carried 28,977Mixed freight 14,659Tools, nonpowered 7,759All other packaged foodstuffs 7,428Tools, powered 6,478Products not specified 6,358Mail and courier parcels 4,760Miscellaneous manufactured products 4,008Vehicles, including parts 3,844Wood products 3,561Bakery and milled grain products 3,553Articles of base metal 3,294Machinery 3,225Paper or paperboard articles 3,140Meat, seafood, and their preparations 3,056Nometallic mineral products 3,049Electronic and other electrical equipment 3,024Base metal in primary or semifinished forms 2,881Gravel or crushed stone 2,790All other agricultural products 2,661All other waste and scrape (non-EPA manifest) 2,647Plastic and rubber 2,393Animal feed and products of animal origin 2,088Furniture, mattresses, lamps, etc. 2,043Pulp, newsprint, paper, paperboard 1,936Fertilizers and fertilizer materials 1,666Textile, leather, and related articles 1,538Grains, cereal 1,368All other chemical products and preparations 1,351Fuel oils 1,232All other coal and refined petroleum products 1,172Logs and other wood in the rough 1,149Alcoholic beverages 1,124Natural sands 1,089Recyclable products 922Basic chemicals 876Gasoline and aviation turbine fuel 849Empty shipping containers 794Printed products 765Animals and fish, live 735Precision instruments and apparatus 734All other transportation equipment 636All other nonmetallic minerals 499Monumental or building stone 462Tobacco products 445Pharmaceutical products 305Coal 301Passengers 274Products, equipment, or materials not elsewhere classified 265Hazardous waste (EPA manifest) 190Not applicable2 150Crude petroleum 132Metallic ores and concentrates 45
1 Detail lines may not add to total because multiple products/hazardous materials may be carried at the same time. 2 Vehicles not in use. When the survey respondent had partial-year ownership of the vehicle, annual miles were
adjusted to reflect miles traveled when not owned by the respondent.Note: Includes trucks registered to companies and individuals in the United States except pickups, minivans, other light vans, and sport utility vehicles.
Table 3-12. Truck Miles by Products Carried: 2002Source: U.S. Department of Commerce, Census Bureau, 2002 Vehicle Inventory and Use Survey: United States, EC02TV-US (Washington, DC: 2004), available at www.census.gov/prod/ec02/ec02tv-us.pdf as of September 20, 2013.
36
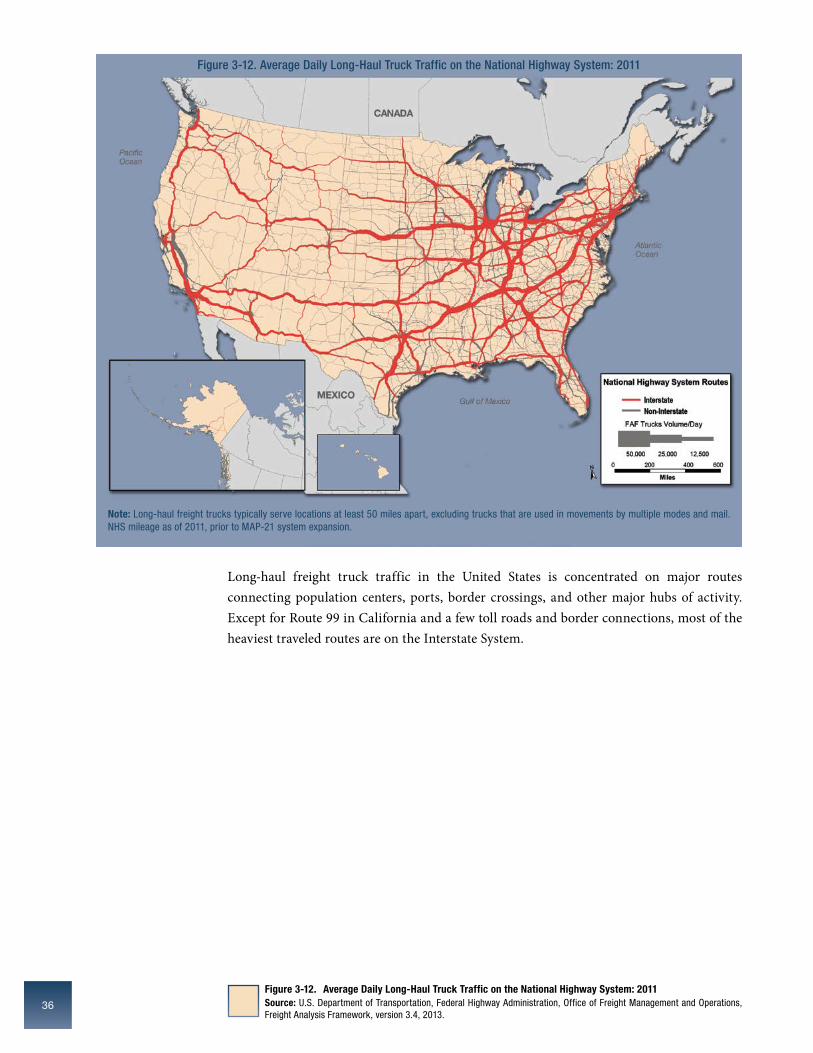
Long-haul freight truck traffic in the United States is concentrated on major routes connecting population centers, ports, border crossings, and other major hubs of activity. Except for Route 99 in California and a few toll roads and border connections, most of the heaviest traveled routes are on the Interstate System.
Figure 3-12. Average Daily Long-Haul Truck Traffic on the National Highway System: 2011
Note: Long-haul freight trucks typically serve locations at least 50 miles apart, excluding trucks that are used in movements by multiple modes and mail. NHS mileage as of 2011, prior to MAP-21 system expansion.
Figure 3-12. Average Daily Long-Haul Truck Traffic on the National Highway System: 2011 Source: U.S. Department of Transportation, Federal Highway Administration, Office of Freight Management and Operations, Freight Analysis Framework, version 3.4, 2013.

37
By 2040, long-haul freight truck traffic in the United States is expected to increase dramatically on the nHS. Forecast data indicate that truck travel may reach 460 million miles per day.
Figure 3-13. Average Daily Long-Haul Truck Traffic on the National Highway System: 2040
Note: Long-haul freight trucks typically serve locations at least 50 miles apart, excluding trucks that are used in movements by multiple modes and mail. NHS mileage as of 2011, prior to MAP-21 system expansion.
Figure 3-13. Average Daily Long-Haul Truck Traffic on the National Highway System: 2040 Source: U.S. Department of Transportation, Federal Highway Administration, Office of Freight Management and Operations, Freight Analysis Framework, version 3.4, 2013.

38
Selected routes carry a significant concentration of trucks, either as an absolute number or as a percentage of the traffic stream. nearly 14,530 miles of the nHS carry more than 8,500 trucks per day on sections where at least every fourth vehicle is a truck. With each truck carrying an average of 16 tons of cargo, 8,500 trucks per day haul approximately 50 million tons per year.
Figure 3-14. Major Truck Routes on the National Highway System: 2011
Notes: AADTT is average annual daily truck traffic and includes all freight-hauling and other trucks with six or more tires. AADT is average annual daily traffic and includes all motor vehicles. NHS mileage as of 2011, prior to MAP-21 system expansion.
Figure 3-14. Major Truck Routes on the National Highway System: 2011 Source: U.S. Department of Transportation, Federal Highway Administration, Office of Freight Management and Operations, Freight Analysis Framework, version 3.4, 2013.

39
The number of nHS miles carrying large volumes and high percentages of trucks is forecast to increase dramatically by 2040. Segments with more than 8,500 trucks per day and where at least every fourth vehicle is a truck are forecast to reach 42,000 miles, an increase of more than 175 percent from 2011.
Figure 3-15. Major Truck Routes on the National Highway System: 2040
Notes: AADTT is average annual daily truck traffic and includes all freight-hauling and other trucks with six or more tires. AADT is average annual daily traffic and includes all motor vehicles. NHS mileage as of 2011, prior to MAP-21 system expansion.
Figure 3-15. Major Truck Routes on the National Highway System: 2040 Source: U.S. Department of Transportation, Federal Highway Administration, Office of Freight Management and Operations, Freight Analysis Framework, version 3.4, 2013.

40
Recurring congestion caused by volumes of passenger vehicles and trucks that exceed capacity on roadways during peak periods is concentrated primarily in major metropolitan areas. In 2011, peak-period congestion resulted in traffic slowing below posted speed limits on 13,500 miles of the nHS and created stop-and-go conditions on an additional 8,700 miles.
Figure 3-16. Peak-Period Congestion on the National Highway System: 2011
Notes: Highly congested segments are stop-and-go conditions with volume/service flow ratios greater than 0.95. Congested segment have reduced traffic speeds with volume/service flow ratios between 0.75 and 0.95.The volume/service flow ratio is estimated using the procedures outlined in the Highway Performance Monitoring System Field Manual, Appendix N. NHS mileage as of 2011, prior to MAP-21 system expansion.
Figure 3-16. Peak-Period Congestion on the National Highway System: 2011 Source: U.S. Department of Transportation, Federal Highway Administration, Office of Freight Management and Operations, Freight Analysis Framework, version 3.4, 2013.

41
Assuming no changes in network capacity, increases in truck and passenger vehicle traffic are forecast to expand areas of recurring peak-period congestion to 34 percent of the nHS in 2040 compared with 10 percent in 2011. This will slow traffic on 28,000 miles of the nHS and create stop-and-go conditions on an additional 46,000 miles.
Figure 3-17. Peak-Period Congestion on the National Highway System: 2040
Notes: AADTT is average annual daily truck traffic and includes all freight-hauling and other trucks with six or more tires. AADT is average annual daily traffic and includes all motor vehicles. NHS mileage as of 2011, prior to MAP-21 system expansion.
Figure 3-17. Peak-Period Congestion on the National Highway System: 2040 Source: U.S. Department of Transportation, Federal Highway Administration, Office of Freight Management and Operations, Freight Analysis Framework, version 3.4, 2013.

42
Congested highways carrying a large number of trucks substantially impede interstate commerce, and trucks on those segments contribute significantly to congestion. Recurring congestion slows traffic on 5,800 miles and creates stop-and-go conditions on 4,500 miles of the nHS that carry more than 8,500 trucks per day.
Figure 3-18. Peak-Period Congestion on High-Volume Truck Portions of the National Highway System: 2011
Notes: High-volume truck portions of the National Highway System carry more than 8,500 trucks per day, including freight-hauling long-distance trucks, freight hauling local trucks, and other trucks with six or more tires.Highly congested segments are stop-and-go conditions with volume/service flow ratios greater than 0.95. Congested segments have reduced traffic speeds with volume/service flow ratios between 0.75 and 0.95.The volume/service flow ratio is estimated using the procedures outlined in the HPMS Field Manual, Appendix N. NHS mileage as of 2011, prior to MAP-21 system expansion.
Figure 3-18. Peak-Period Congestion on High-Volume Truck Portions of the National Highway System: 2011 Source: U.S. Department of Transportation, Federal Highway Administration, Office of Freight Management and Operations, Freight Analysis Framework, version 3.4, 2013.

43
Assuming no change in network capacity, the number of nHS miles with recurring congestion and a large number of trucks is forecast to increase significantly between 2011 and 2040. on highways carrying more than 8,500 trucks per day, recurring congestion will slow traffic on close to 7,400 miles and create stop-and-go conditions on an additional 22,000 miles.
Figure 3-19. Peak-Period Congestion on High-Volume Truck Portions of the National Highway System: 2040
Notes: High-volume truck portions of the National Highway System carry more than 8,500 trucks per day, including freight-hauling long-distance trucks, freight hauling local trucks, and other trucks with six or more tires.Highly congested segments are stop-and-go conditions with volume/service flow ratios greater than 0.95. Congested segments have reduced traffic speeds with volume/service flow ratios between 0.75 and 0.95.The volume/service flow ratio is estimated using the procedures outlined in the HPMS Field Manual, Appendix N. NHS mileage as of 2011, prior to MAP-21 system expansion.
Figure 3-19. Peak-Period Congestion on High-Volume Truck Portions of the National Highway System: 2040 Source: U.S. Department of Transportation, Federal Highway Administration, Office of Freight Management and Operations, Freight Analysis Framework, version 3.4, 2013.
44
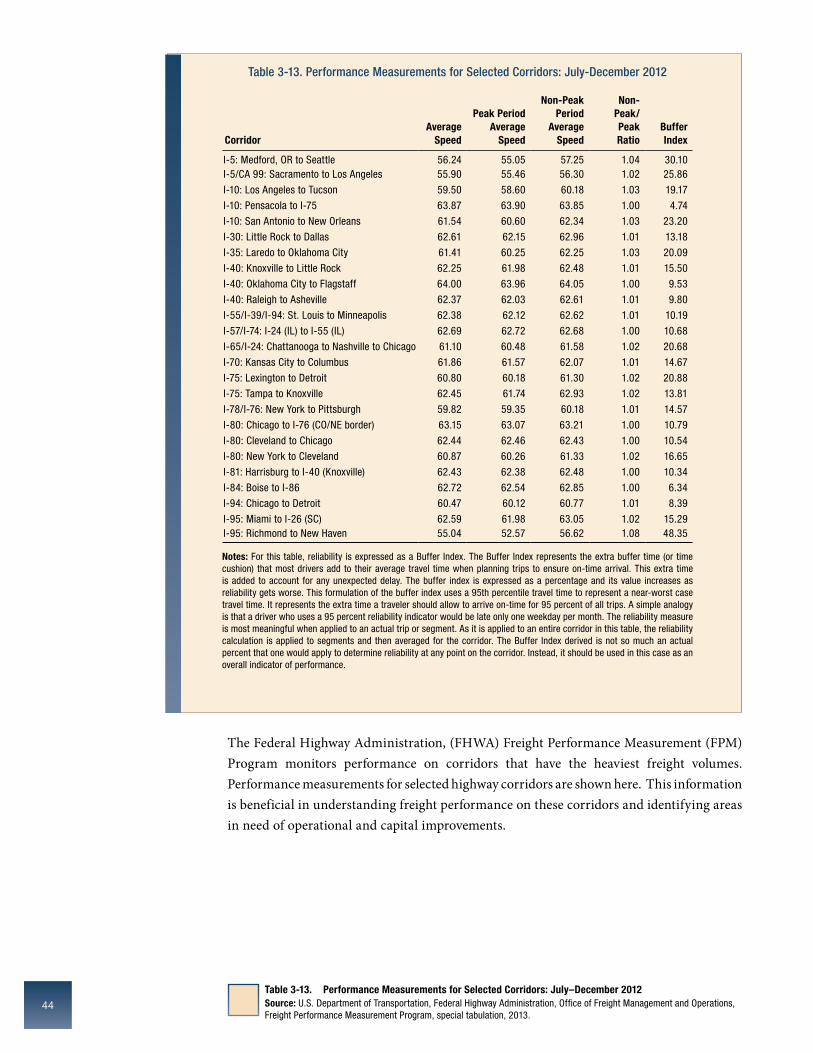
The Federal Highway Administration, (FHWA) Freight Performance Measurement (FPM) Program monitors performance on corridors that have the heaviest freight volumes. Performance measurements for selected highway corridors are shown here. This information is beneficial in understanding freight performance on these corridors and identifying areas in need of operational and capital improvements.
Table 3-13. Performance Measurements for Selected Corridors: July-December 2012
CorridorAverage
Speed
Peak Period Average
Speed
Non-Peak Period
Average Speed
Non-Peak/ Peak Ratio
Buffer Index
I-5: Medford, OR to Seattle 56.24 55.05 57.25 1.04 30.10I-5/CA 99: Sacramento to Los Angeles 55.90 55.46 56.30 1.02 25.86
I-10: Los Angeles to Tucson 59.50 58.60 60.18 1.03 19.17
I-10: Pensacola to I-75 63.87 63.90 63.85 1.00 4.74
I-10: San Antonio to New Orleans 61.54 60.60 62.34 1.03 23.20
I-30: Little Rock to Dallas 62.61 62.15 62.96 1.01 13.18
I-35: Laredo to Oklahoma City 61.41 60.25 62.25 1.03 20.09
I-40: Knoxville to Little Rock 62.25 61.98 62.48 1.01 15.50
I-40: Oklahoma City to Flagstaff 64.00 63.96 64.05 1.00 9.53
I-40: Raleigh to Asheville 62.37 62.03 62.61 1.01 9.80
I-55/I-39/I-94: St. Louis to Minneapolis 62.38 62.12 62.62 1.01 10.19
I-57/I-74: I-24 (IL) to I-55 (IL) 62.69 62.72 62.68 1.00 10.68
I-65/I-24: Chattanooga to Nashville to Chicago 61.10 60.48 61.58 1.02 20.68
I-70: Kansas City to Columbus 61.86 61.57 62.07 1.01 14.67
I-75: Lexington to Detroit 60.80 60.18 61.30 1.02 20.88
I-75: Tampa to Knoxville 62.45 61.74 62.93 1.02 13.81
I-78/I-76: New York to Pittsburgh 59.82 59.35 60.18 1.01 14.57
I-80: Chicago to I-76 (CO/NE border) 63.15 63.07 63.21 1.00 10.79
I-80: Cleveland to Chicago 62.44 62.46 62.43 1.00 10.54
I-80: New York to Cleveland 60.87 60.26 61.33 1.02 16.65
I-81: Harrisburg to I-40 (Knoxville) 62.43 62.38 62.48 1.00 10.34
I-84: Boise to I-86 62.72 62.54 62.85 1.00 6.34
I-94: Chicago to Detroit 60.47 60.12 60.77 1.01 8.39
I-95: Miami to I-26 (SC) 62.59 61.98 63.05 1.02 15.29I-95: Richmond to New Haven 55.04 52.57 56.62 1.08 48.35
Notes: For this table, reliability is expressed as a Buffer Index. The Buffer Index represents the extra buffer time (or time cushion) that most drivers add to their average travel time when planning trips to ensure on-time arrival. This extra time is added to account for any unexpected delay. The buffer index is expressed as a percentage and its value increases as reliability gets worse. This formulation of the buffer index uses a 95th percentile travel time to represent a near-worst case travel time. It represents the extra time a traveler should allow to arrive on-time for 95 percent of all trips. A simple analogy is that a driver who uses a 95 percent reliability indicator would be late only one weekday per month. The reliability measure is most meaningful when applied to an actual trip or segment. As it is applied to an entire corridor in this table, the reliability calculation is applied to segments and then averaged for the corridor. The Buffer Index derived is not so much an actual percent that one would apply to determine reliability at any point on the corridor. Instead, it should be used in this case as an overall indicator of performance.
Table 3-13. Performance Measurements for Selected Corridors: July–December 2012Source: U.S. Department of Transportation, Federal Highway Administration, Office of Freight Management and Operations, Freight Performance Measurement Program, special tabulation, 2013.
45
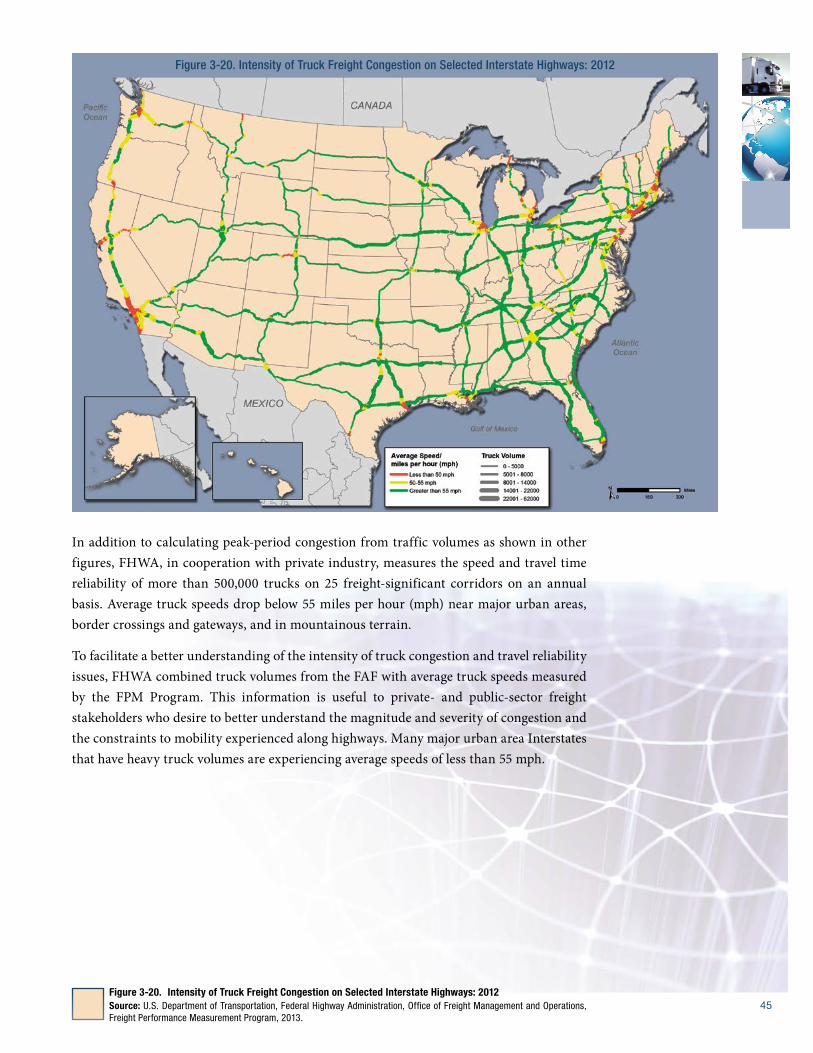
In addition to calculating peak-period congestion from traffic volumes as shown in other figures, FHWA, in cooperation with private industry, measures the speed and travel time reliability of more than 500,000 trucks on 25 freight-significant corridors on an annual basis. Average truck speeds drop below 55 miles per hour (mph) near major urban areas, border crossings and gateways, and in mountainous terrain.
To facilitate a better understanding of the intensity of truck congestion and travel reliability issues, FHWA combined truck volumes from the FAF with average truck speeds measured by the FPM Program. This information is useful to private- and public-sector freight stakeholders who desire to better understand the magnitude and severity of congestion and the constraints to mobility experienced along highways. Many major urban area Interstates that have heavy truck volumes are experiencing average speeds of less than 55 mph.
Figure 3-20. Intensity of Truck Freight Congestion on Selected Interstate Highways: 2012
Figure 3-20. Intensity of Truck Freight Congestion on Selected Interstate Highways: 2012 Source: U.S. Department of Transportation, Federal Highway Administration, Office of Freight Management and Operations, Freight Performance Measurement Program, 2013.
46
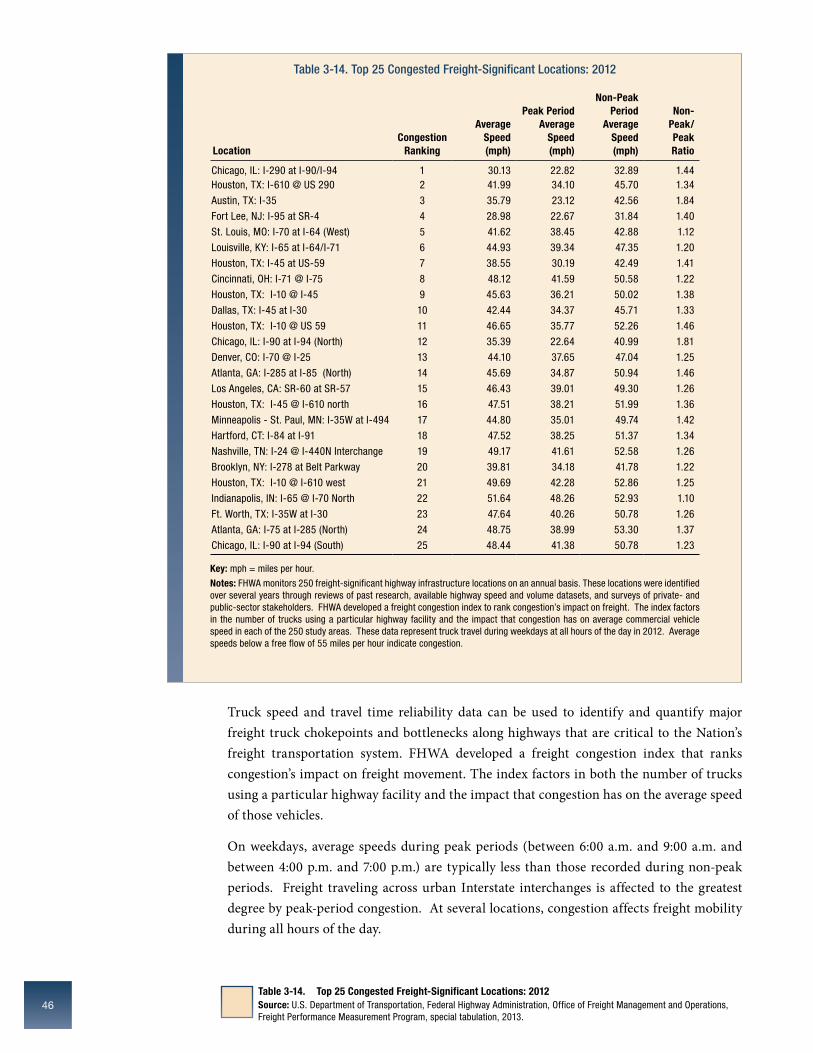
Truck speed and travel time reliability data can be used to identify and quantify major freight truck chokepoints and bottlenecks along highways that are critical to the nation’s freight transportation system. FHWA developed a freight congestion index that ranks congestion’s impact on freight movement. The index factors in both the number of trucks using a particular highway facility and the impact that congestion has on the average speed of those vehicles.
on weekdays, average speeds during peak periods (between 6:00 a.m. and 9:00 a.m. and between 4:00 p.m. and 7:00 p.m.) are typically less than those recorded during non-peak periods. Freight traveling across urban Interstate interchanges is affected to the greatest degree by peak-period congestion. At several locations, congestion affects freight mobility during all hours of the day.
Table 3-14. Top 25 Congested Freight-Significant Locations: 2012Source: U.S. Department of Transportation, Federal Highway Administration, Office of Freight Management and Operations, Freight Performance Measurement Program, special tabulation, 2013.
Table 3-14. Top 25 Congested Freight-Significant Locations: 2012
LocationCongestion
Ranking
Average Speed (mph)
Peak Period Average
Speed (mph)
Non-Peak Period
Average Speed (mph)
Non-Peak/ Peak Ratio
Chicago, IL: I-290 at I-90/I-94 1 30.13 22.82 32.89 1.44Houston, TX: I-610 @ US 290 2 41.99 34.10 45.70 1.34
Austin, TX: I-35 3 35.79 23.12 42.56 1.84
Fort Lee, NJ: I-95 at SR-4 4 28.98 22.67 31.84 1.40
St. Louis, MO: I-70 at I-64 (West) 5 41.62 38.45 42.88 1.12
Louisville, KY: I-65 at I-64/I-71 6 44.93 39.34 47.35 1.20
Houston, TX: I-45 at US-59 7 38.55 30.19 42.49 1.41
Cincinnati, OH: I-71 @ I-75 8 48.12 41.59 50.58 1.22
Houston, TX: I-10 @ I-45 9 45.63 36.21 50.02 1.38
Dallas, TX: I-45 at I-30 10 42.44 34.37 45.71 1.33
Houston, TX: I-10 @ US 59 11 46.65 35.77 52.26 1.46
Chicago, IL: I-90 at I-94 (North) 12 35.39 22.64 40.99 1.81
Denver, CO: I-70 @ I-25 13 44.10 37.65 47.04 1.25
Atlanta, GA: I-285 at I-85 (North) 14 45.69 34.87 50.94 1.46
Los Angeles, CA: SR-60 at SR-57 15 46.43 39.01 49.30 1.26
Houston, TX: I-45 @ I-610 north 16 47.51 38.21 51.99 1.36
Minneapolis - St. Paul, MN: I-35W at I-494 17 44.80 35.01 49.74 1.42
Hartford, CT: I-84 at I-91 18 47.52 38.25 51.37 1.34
Nashville, TN: I-24 @ I-440N Interchange 19 49.17 41.61 52.58 1.26
Brooklyn, NY: I-278 at Belt Parkway 20 39.81 34.18 41.78 1.22
Houston, TX: I-10 @ I-610 west 21 49.69 42.28 52.86 1.25
Indianapolis, IN: I-65 @ I-70 North 22 51.64 48.26 52.93 1.10
Ft. Worth, TX: I-35W at I-30 23 47.64 40.26 50.78 1.26
Atlanta, GA: I-75 at I-285 (North) 24 48.75 38.99 53.30 1.37
Chicago, IL: I-90 at I-94 (South) 25 48.44 41.38 50.78 1.23
Key: mph = miles per hour.
Notes: FHWA monitors 250 freight-significant highway infrastructure locations on an annual basis. These locations were identified over several years through reviews of past research, available highway speed and volume datasets, and surveys of private- and public-sector stakeholders. FHWA developed a freight congestion index to rank congestion’s impact on freight. The index factors in the number of trucks using a particular highway facility and the impact that congestion has on average commercial vehicle speed in each of the 250 study areas. These data represent truck travel during weekdays at all hours of the day in 2012. Average speeds below a free flow of 55 miles per hour indicate congestion.

47
Several monitored locations have recorded noticeable improvements in performance from 2011 to 2012 when considering the averages over 24 hours.
Table 3-15. Largest Improvements in Average Speed for Congested Freight Highway Locations: 2012
Average Speed (mph)Peak Period Average Speed
(mph)Non-Peak Period Average
Speed (mph)
Location 2011 2012
Percent change,
2011-2012 2011 2012
Percent change,
2011-2012 2011 2012
Percent change,
2011-2012
Fairfax County, VA: I-495 at I-66 38.87 43.75 12.5 32.26 38.51 19.4 41.09 45.45 10.6Milwaukee, WI: Mitchell Interchange - 94/894 47.89 53.70 12.1 44.00 51.68 17.5 49.43 54.47 10.2
Spokane, WA: I-90 at SR 195 48.61 54.20 11.5 47.68 54.50 14.3 49.02 54.07 10.3
Louisville, KY: I-65 at I-64/I-71 40.51 44.93 10.9 31.95 39.34 23.1 44.84 47.35 5.6
Buffalo-Niagara Falls, NY: I-90 at I-290 44.04 47.96 8.9 40.98 44.95 9.7 45.51 49.42 8.6
Philadelphia, PA: I-76 at I-476 45.02 48.87 8.6 37.57 41.72 11.0 48.26 51.90 7.5
Dayton, OH: I-75 at U.S. 35 Interchange 46.59 49.98 7.3 40.17 47.93 19.3 49.33 50.76 2.9Los Angeles, CA: I-405 at I-605 45.46 48.48 6.6 36.76 38.73 5.4 50.39 52.76 4.7
Key: mph = miles per hour.
Table 3-15. Largest Improvements in Average Speed for Congested Freight Highway Locations: 2012Source: U.S. Department of Transportation, Federal Highway Administration, Office of Freight Management and Operations, Freight Performance Measurement Program, special tabulation, 2013.
48
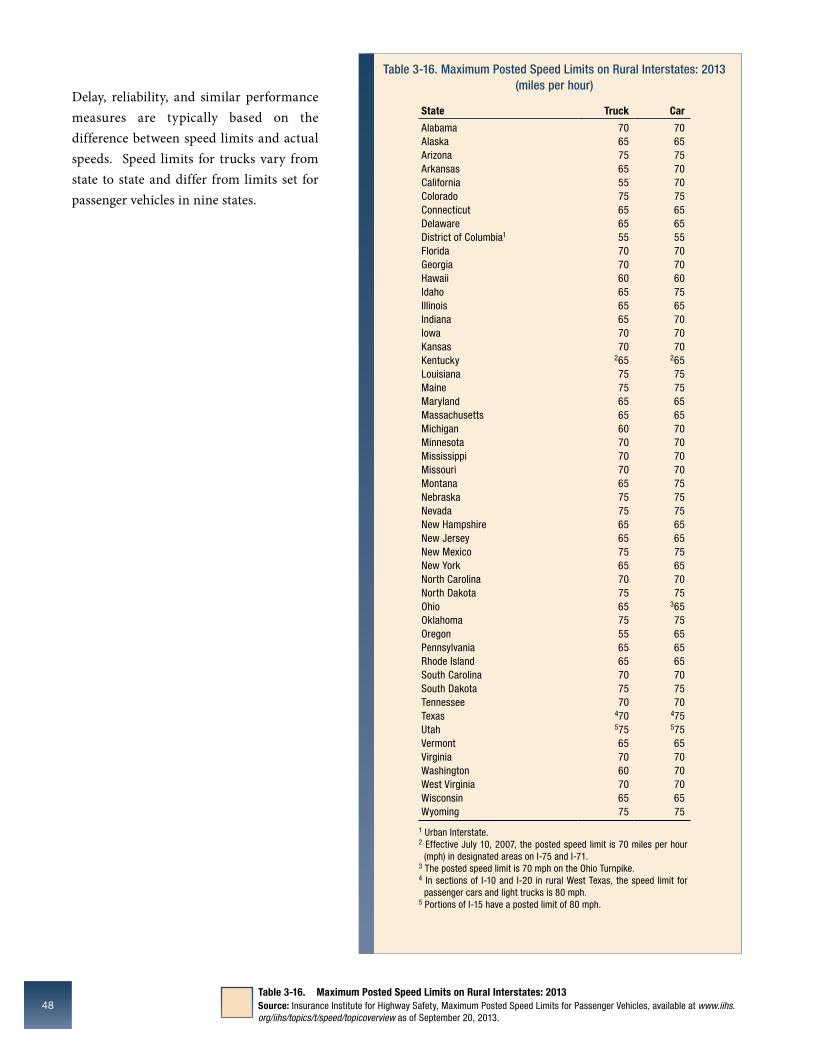
delay, reliability, and similar performance measures are typically based on the difference between speed limits and actual speeds. Speed limits for trucks vary from state to state and differ from limits set for passenger vehicles in nine states.
Table 3-16. Maximum Posted Speed Limits on Rural Interstates: 2013 (miles per hour)
State Truck Car
Alabama 70 70Alaska 65 65Arizona 75 75Arkansas 65 70California 55 70Colorado 75 75Connecticut 65 65Delaware 65 65District of Columbia1 55 55Florida 70 70Georgia 70 70Hawaii 60 60Idaho 65 75Illinois 65 65Indiana 65 70Iowa 70 70Kansas 70 70Kentucky 265 265Louisiana 75 75Maine 75 75Maryland 65 65Massachusetts 65 65Michigan 60 70Minnesota 70 70Mississippi 70 70Missouri 70 70Montana 65 75Nebraska 75 75Nevada 75 75New Hampshire 65 65New Jersey 65 65New Mexico 75 75New York 65 65North Carolina 70 70North Dakota 75 75Ohio 65 365Oklahoma 75 75Oregon 55 65Pennsylvania 65 65Rhode Island 65 65South Carolina 70 70South Dakota 75 75Tennessee 70 70Texas 470 475Utah 575 575Vermont 65 65Virginia 70 70Washington 60 70West Virginia 70 70Wisconsin 65 65Wyoming 75 75
1 Urban Interstate. 2 Effective July 10, 2007, the posted speed limit is 70 miles per hour
(mph) in designated areas on I-75 and I-71.3 The posted speed limit is 70 mph on the Ohio Turnpike.4 In sections of I-10 and I-20 in rural West Texas, the speed limit for
passenger cars and light trucks is 80 mph.5 Portions of I-15 have a posted limit of 80 mph.
Table 3-16. Maximum Posted Speed Limits on Rural Interstates: 2013Source: Insurance Institute for Highway Safety, Maximum Posted Speed Limits for Passenger Vehicles, available at www.iihs.org/iihs/topics/t/speed/topicoverview as of September 20, 2013.
4949
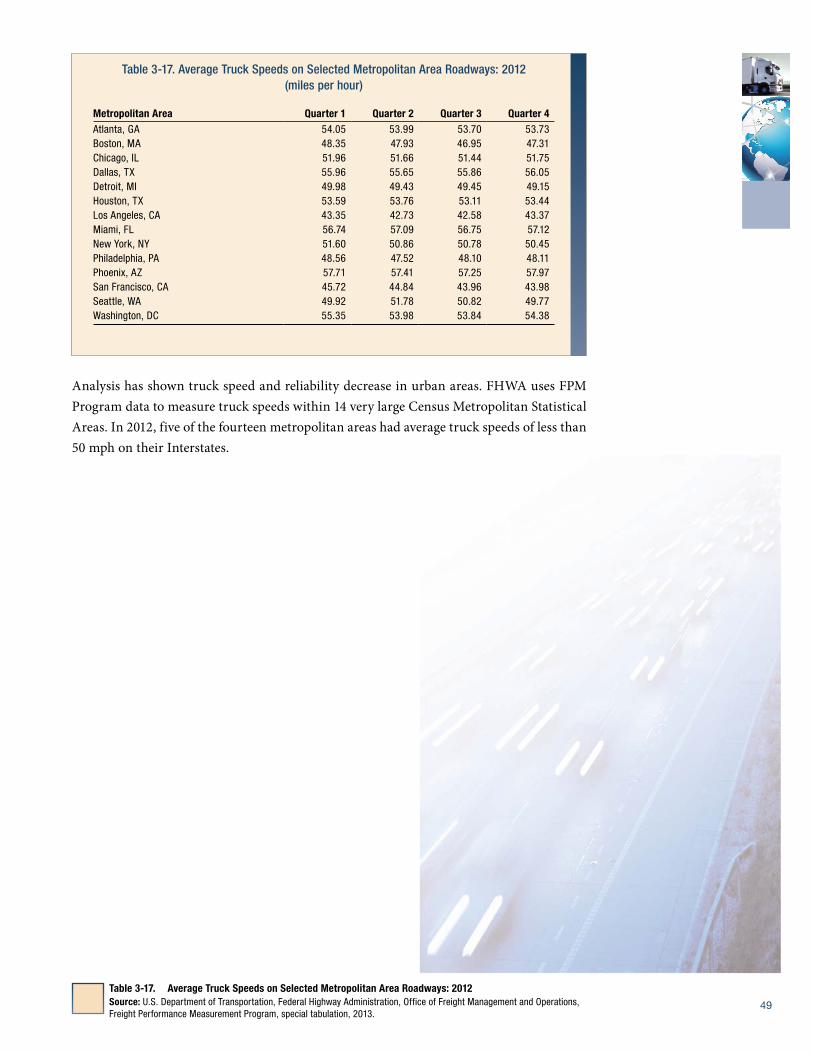
Analysis has shown truck speed and reliability decrease in urban areas. FHWA uses FPM Program data to measure truck speeds within 14 very large Census Metropolitan Statistical Areas. In 2012, five of the fourteen metropolitan areas had average truck speeds of less than 50 mph on their Interstates.
Table 3-17. Average Truck Speeds on Selected Metropolitan Area Roadways: 2012Source: U.S. Department of Transportation, Federal Highway Administration, Office of Freight Management and Operations, Freight Performance Measurement Program, special tabulation, 2013.
Table 3-17. Average Truck Speeds on Selected Metropolitan Area Roadways: 2012 (miles per hour)
Metropolitan Area Quarter 1 Quarter 2 Quarter 3 Quarter 4Atlanta, GA 54.05 53.99 53.70 53.73Boston, MA 48.35 47.93 46.95 47.31Chicago, IL 51.96 51.66 51.44 51.75Dallas, TX 55.96 55.65 55.86 56.05Detroit, MI 49.98 49.43 49.45 49.15Houston, TX 53.59 53.76 53.11 53.44Los Angeles, CA 43.35 42.73 42.58 43.37Miami, FL 56.74 57.09 56.75 57.12New York, NY 51.60 50.86 50.78 50.45Philadelphia, PA 48.56 47.52 48.10 48.11Phoenix, AZ 57.71 57.41 57.25 57.97San Francisco, CA 45.72 44.84 43.96 43.98Seattle, WA 49.92 51.78 50.82 49.77Washington, DC 55.35 53.98 53.84 54.38

50
Intercity travel-time reliability is a key freight performance measure. It influences logistics, operational strategies, and load optimization. FHWA analyzed the truck trip reliability of key city-pair origins and destinations. Travel time between Philadelphia and new york City showed the greatest change, increasing 1 hour and 10 minutes in the northbound direction and more than 1 hour and four minutes in the southbound direction. other city pairs also experienced large negative changes in travel-time reliability.
Table 3-18. Truck Trip Reliability as Indicated by Minimum and Maximum Travel Times Between Selected City-Pairs: 2012
Location
Northbound/ Eastbound
Minimum
Northbound/ Eastbound Maximum
Maximum/Minimum
Percent Difference
Southbound/ Westbound
Minimum
Southbound/ Westbound
Maximum
Maximum/Minimum
Percent Difference
Atlanta, GA - Savannah, GA 4:00:03 4:45:22 17.2 4:00:34 4:37:08 14.1
Chicago, IL - Milwaukee, WI 1:32:29 2:30:45 47.9 1:31:51 3:00:55 65.3
Chicago, IL - Nashville, TN 7:57:04 8:54:44 11.4 7:54:55 8:44:02 9.8
Detroit, MI - Chicago, IL 4:50:10 5:32:07 13.5 4:52:19 5:45:45 16.7
Detroit, MI - Grand Rapids, MI 2:31:51 3:02:20 18.2 2:32:22 3:00:24 16.8
Houston, TX - Beaumont, TX 1:24:46 1:50:50 26.7 1:24:44 1:52:25 28.1
Houston, TX - Dallas, TX 3:46:27 4:38:02 20.5 3:49:07 4:38:58 19.6
Houston, TX - San Antonio, TX 3:20:14 4:24:42 27.7 3:22:44 4:29:22 28.2
Indianapolis, IN - Chicago, IL 3:09:37 4:01:10 23.9 3:07:43 3:43:27 17.4
Las Vegas, NV - Los Angeles, CA 4:19:22 5:49:04 29.5 4:31:46 5:47:41 24.5
Los Angeles, CA - San Francisco, CA 7:09:31 8:29:24 17.0 7:13:36 8:42:18 18.6
Miami, FL - Tampa, FL 4:49:04 6:02:54 22.6 4:49:37 6:00:59 21.9
Nashville, TN - Indianapolis, IN 4:44:25 5:31:29 15.3 4:45:43 5:26:16 13.3
New York, NY - Albany, NY 2:45:54 4:03:50 38.0 2:46:30 3:49:55 32.0
New York, NY - Buffalo, NY 7:32:01 9:08:00 19.2 7:31:49 8:42:38 14.5
New York, NY - Hartford, CT 1:59:23 3:38:55 58.8 2:00:16 3:50:13 62.7
Philadelphia, PA - New York, NY 1:43:58 3:38:29 71.0 1:39:58 3:24:14 68.6
Phoenix, AZ - Los Angeles, CA 6:20:32 7:33:49 17.6 6:33:45 7:48:14 17.3
Phoenix, AZ - Tucson, AZ 1:51:05 2:24:36 26.2 1:51:12 2:26:07 27.1
San Antonio, TX - Austin, TX 1:25:50 2:22:29 49.6 1:26:23 2:30:31 54.2
San Diego, CA - Los Angeles, CA 2:16:10 4:10:51 59.3 2:14:54 4:08:40 59.3
San Francisco, CA - Sacramento, CA 1:37:33 3:04:44 61.8 1:33:42 2:39:18 51.9
Seattle, WA - Portland, OR 2:57:23 4:08:27 33.4 2:56:51 4:00:12 30.4
Tampa, FL - Orlando, FL 1:21:07 2:05:28 42.9 1:23:07 2:03:38 39.2
Washington, DC - Baltimore, MD 0:56:22 1:40:41 56.4 0:55:01 1:46:08 63.4
Notes: Travel times are shown in hours, minutes, and seconds. The trip times were calculated between city centers using Interstate average travel speed data from the Freight Performance Measurement Program.
Table 3-18. Truck Trip Reliability as Indicated by Minimum and Maximum Travel Times Between Selected City-Pairs: 2012Source: U.S. Department of Transportation, Federal Highway Administration, Office of Freight Management and Operations,
Freight Performance Measurement Program, special tabulation, 2013.

51
A large number of trucks and trains carry goods into the United States from Mexico and Canada. In 2012, 5.1 million trucks hauled nearly 3.5 million loaded containers into the United States from Mexico, an increase of 13 percent and 47 percent, respectively, over 2000 levels. This increased traffic reflects a doubling in U.S.-Mexico trade, as discussed in chapter 2. In contrast, the number of incoming trucks and loaded containers from Canada declined by 20 percent and 24 percent, respectively, while incoming loaded rail containers increased by 18 percent between 2000 and 2012.
Table 3-19. Number of Incoming Trucks, Trains, and Loaded Containers Crossing the U.S-Mexico and U.S-Canada Borders: 2000, 2005, and 2009-2012Source: U.S. Department of Transportation, Bureau of Transportation Statistics, based on data from the Department of
Homeland Security, U.S. Customs and Border Protection, Office of Field Operations, available at http://transborder.bts.gov/programs/international/transborder/TBDR_BC/TBDR_BC_Index.html as of October 3, 2013.
Table 3-19. Number of Incoming Trucks, Trains and Loaded Containers Crossing the U.S.-Mexico and U.S.-Canada Borders: 2000, 2005, and 2009-2012
(thousands)
Metropolitan Area 2000 2005 2009 2010 2011 2012
Canadian BorderTrucks 7,048 6,784 5,021 5,444 5,490 5,624
Loaded Truck Containers 5,335 5,819 3,897 4,171 4,049 4,069Trains 33 33 24 26 27 29
Loaded Rail Containers 1,215 1,458 1,023 1,209 1,288 1,432
Mexican BorderTrucks 4,526 4,676 4,291 4,743 4,868 5,104
Loaded Truck Containers 2,350 3,031 2,729 3,174 3,277 3,460Trains 7 9 7 8 8 9
Loaded Rail Containers 266 336 239 318 359 400
Note: Trains include both passenger and freight trains.

52
Border crossings are potential bottlenecks in the freight transportation network. FHWA monitors truck crossing times at 15 U.S.-Canada border crossings. At all but two borders, transit times were longer for inbound U.S. traffic than for travel to Canada.
Table 3-20. Average Time for Commercial Vehicles to Travel One Mile At Selected U.S.-Canada Border Crossings: 2012
Location Direction
Average Minutes per
Mile
Ambassador Bridge - Detroit, MI Inbound 6.1Outbound 4.2
Port Huron, MIInbound 5.4Outbound 3.9
Peace Bridge - Buffalo, NYInbound 5.3Outbound 4.8
Lewiston-Queenston Bridge - Lewiston, NYInbound 4.5Outbound 4.1
Champlain, NYInbound 5.5Outbound 4.0
Blaine, WAInbound 7.8Outbound 6.2
Alexandria Bay, NYInbound 5.5Outbound 4.2
Pembina, NDInbound 5.7Outbound 3.9
Derby, VTInbound 4.5Outbound 3.4
Calais, MEInbound 3.7Outbound 4.0
Sumas, WAInbound 5.4Outbound 5.8
Highgate, VTInbound 3.7Outbound 2.7
Houlton, MEInbound 4.3Outbound 3.4
Sweetgrass, MTInbound 7.4Outbound 5.5
Jackman, MEInbound 5.9Outbound 4.2
Table 3-20. Average Time for Commercial Vehicles to Travel One Mile At Selected U.S.-Canada Border Crossings: 2012Source: U.S. Department of Transportation, Federal Highway Administration, Office of Freight Management and Operations, special
tabulation, 2013.

53
The U.S. department of Transportation in partnership with the Texas department of Transportation also measures transit times from Mexico to the Unites States at the Bridge of the Americas and the Pharr-Reynosa International Bridge. The data are collected using radio frequency identification technology installed at the start of the crossing (typically the end of the queue) and at the vehicle safety inspection station exit (the end of the crossing trip). Vehicle identification information is anonymously collected and time-stamped at each reader station, and travel time is calculated between the reader stations.
Table 3-21. Average Truck Transit Times at Selected U.S.-Mexico Border Crossings: 2012
Month
Bridge of the Americas -
El Paso, Texas (minutes)
Pharr-Reynosa International
Bridge - Pharr, Texas (minutes)
January 53 60February 47 63March 54 62April 57 56May 45 48June 46 43July 48 43August 44 45September 42 45October 42 55November 47 55
December NA NA
Key: NA = not available.
Table 3-21. Average Truck Transit Time at Selected U.S.-Mexico Border Crossings: 2012Source: U.S. Department of Transportation, Federal Highway Administration, Office of Freight Management and Operations; U.S. Department of Transportation, Intelligent Transportation Systems Joint Program Office; and Texas Department of Transportation, 2013.