ii: portfolio theory i 2: measuring portfolio return 3: measuring portfolio risk 4: diversification
TRANSCRIPT

II: Portfolio Theory I
2: Measuring Portfolio Return
3: Measuring Portfolio Risk
4: Diversification

Chapter 2: Measuring Portfolio Return © Oltheten & Waspi 2012
Return & RiskMarkets are efficient only if return exactly compensates
for risk

Chapter 2: Measuring Portfolio Return © Oltheten & Waspi 2012
Measuring Portfolio Return
Holding Period Return Cash Flow Adjusted Rate of Return Time Weighted versus Statistical Rates of
Return Internal Rate of Return

Chapter 2: Measuring Portfolio Return
Holding Period Return
$2,400,000 = $1.20 = $1 + 20%$2,000,000
$1,600,000 = $0.80 = $1 - 20%$2,000,000
For every $ you started with you now have $1.20
$ you started with
+ 20%
For every $ you started with you now have only $0.80
$ you started with
- 20%

Chapter 2: Measuring Portfolio Return © Oltheten & Waspi 2012
Holding Period Return
When you use the alternate formula you are subtracting out the $ you started with at the very beginning
$2,400,000 - $2,000,000 = 1.20 –1 = .20 = +20% $2,000,000
$$ you started with
$ you started with

Chapter 2: Measuring Portfolio Return © Oltheten & Waspi 2012
Cash Flow Adjusted Rate of Return
We want to measure investment returns We adjust so that the rate of return is not
distorted by cash flows over which the investment manager has no control.
flow cash*
dateV
flow cash*date
VrR
3030
301
0
1

Chapter 2: Measuring Portfolio Return © Oltheten & Waspi 2012
Cash Flow Adjusted Rate of Return
Each Investment Manger began the month of September with $1million. At the end of the month Alice: $1m to $1.56 million Bob: $1m to $1.54 million Carol: $1m to $1.50 million

Chapter 2: Measuring Portfolio Return © Oltheten & Waspi 2012
Cash Flow Un-adjusted
0 5 10 15 20 25 30$1.00m
$1.10m
$1.20m
$1.30m
$1.40m
$1.50m
$1.60m
Alice (56%)
Bob (54%)
Carol (50%)
September
Slope of 50%

Chapter 2: Measuring Portfolio Return © Oltheten & Waspi 2012
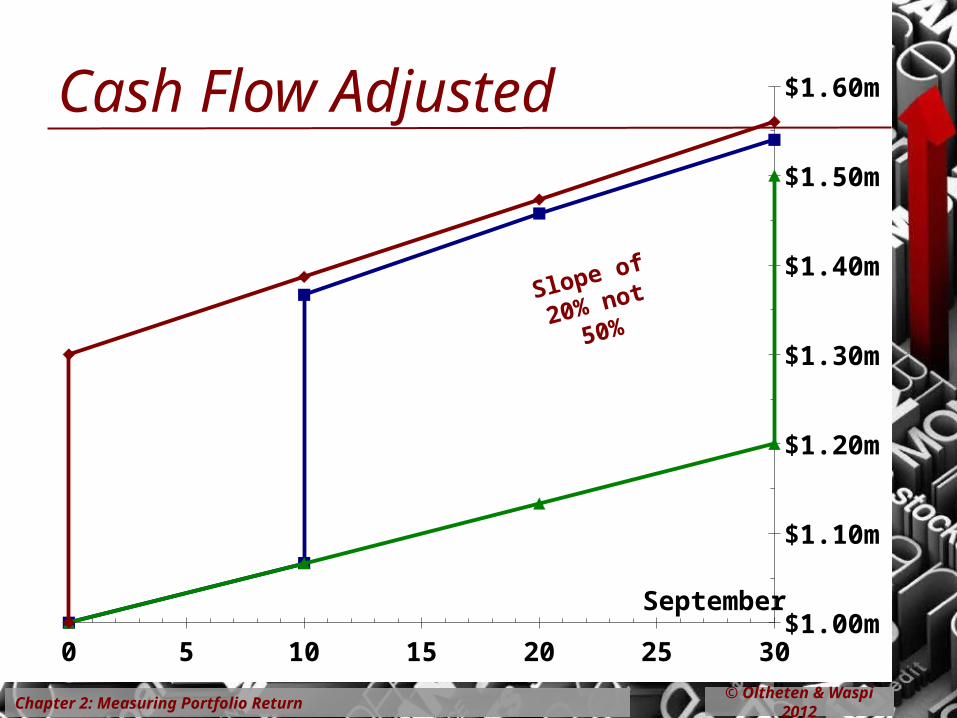
Cash Flow Adjusted
Each investment manager received an additional $300,000 from the client during the month Alice: before the open on the first Bob: on the tenth Carol: after the close on the thirtieth
Cannot measure as a rate of return any money that the investment manager did not generate.

Chapter 2: Measuring Portfolio Return © Oltheten & Waspi 2012
Cash Flow Adjusted Rate of Return
Alice:
Bob:
Carol:
2010003001
0005601
0003003030
0000001
000300300
0005601.
,,$
,,$
,$*,,$
,$*,,$R
2010002001
0004401
0003003020
0000001
0003003010
0005401.
,,$
,,$
,$*,,$
,$*,,$R
2010000001
0002001
000300300
0000001
0003003030
0005001.
,,$
,,$
,$*,,$
,$*,,$R
Chapter 2: Measuring Portfolio Return © Oltheten & Waspi 2012
0 5 10 15 20 25 30$1.00m
$1.10m
$1.20m
$1.30m
$1.40m
$1.50m
$1.60m
September
Cash Flow Adjusted
Slope of 20%
not 50%
Chapter 2: Measuring Portfolio Return © Oltheten & Waspi 2012
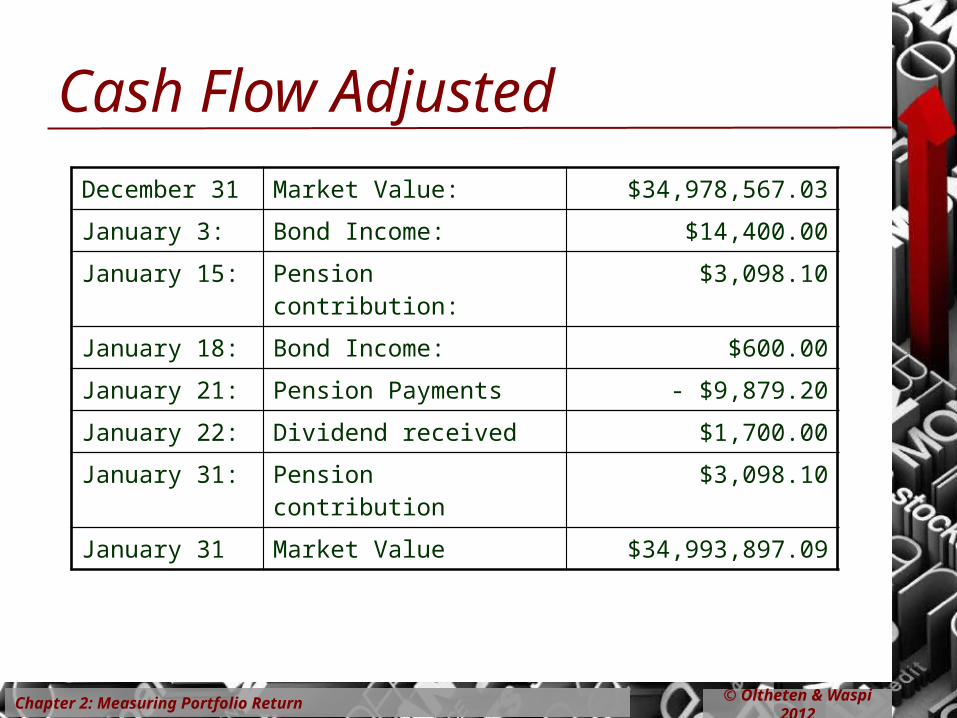
Cash Flow Adjusted
December 31 Market Value: $34,978,567.03
January 3: Bond Income: $14,400.00
January 15: Pension contribution: $3,098.10
January 18: Bond Income: $600.00
January 21: Pension Payments - $9,879.20
January 22: Dividend received $1,700.00
January 31: Pension contribution $3,098.10
January 31 Market Value $34,993,897.09

Chapter 2: Measuring Portfolio Return © Oltheten & Waspi 2012
Time-Weighted verses Statistical
Time Weighted:combines time periods using Geometric totals and averages
Statistical: combines time periods using arithmetic totals and averages

Chapter 2: Measuring Portfolio Return
Time-Weighted verses Statistical
January February March April May June
- 50% +50% -50% +50% -50% +50%
Six month return = ?
© Oltheten & Waspi 2012

Chapter 2: Measuring Portfolio Return © Oltheten & Waspi 2012
Statistical
Total Return =
Average Return =
Variance =
Standard Deviation =

Chapter 2: Measuring Portfolio Return © Oltheten & Waspi 2012
Statistical
Statistical returns assume that the return in one month is independent of the returns of any other month.
February April June
January March May
- 50%- 50%- 50%
+ 50% + 50% + 50%
$1,000,000

Chapter 2: Measuring Portfolio Return © Oltheten & Waspi 2012
Time-Weighted
Total Return =
Average Return =

Chapter 2: Measuring Portfolio Return © Oltheten & Waspi 2012
Time-Weighted
Time Weighted returns assume that returns in one month are reinvested in the following month
$421,875
$1,000,000
$500,000
$281,250
$750,000
$375,000
$562,500
January February March April May June
- 13.4%
Chapter 2: Measuring Portfolio Return © Oltheten & Waspi 2012
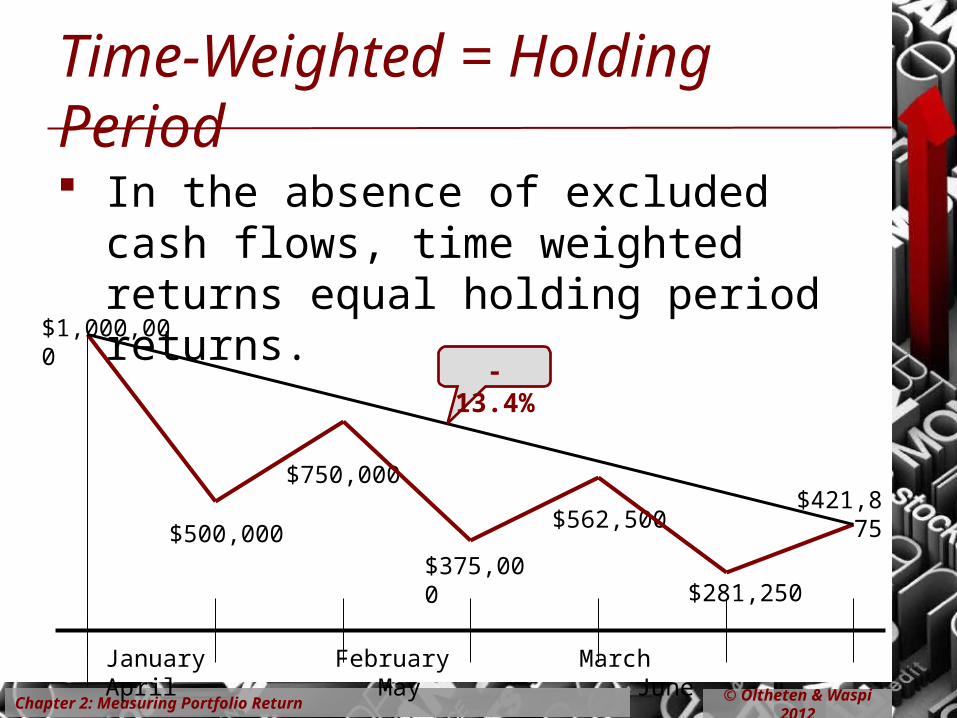
Time-Weighted = Holding Period
In the absence of excluded cash flows, time weighted returns equal holding period returns.
$421,875
$1,000,000
$500,000
$281,250
$750,000
$375,000
$562,500
January February March April May June
- 13.4%
Chapter 2: Measuring Portfolio Return © Oltheten & Waspi 2012
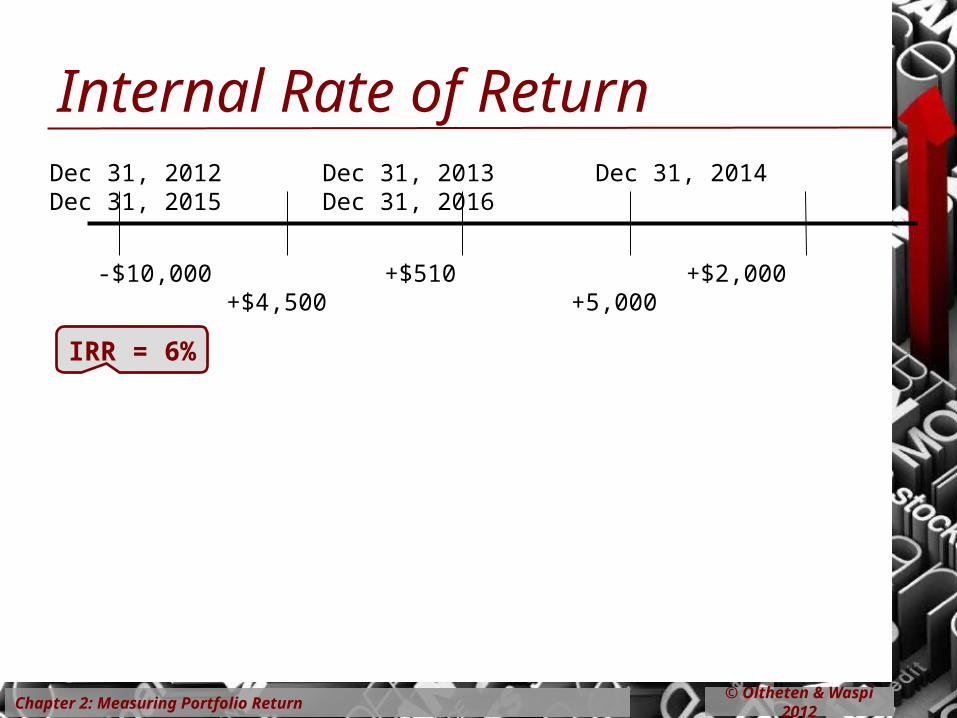
Internal Rate of Return
Internal rate of return (IRR) is the rate of return that renders the Net Present Value (NPV) equal to zero.
Chapter 2: Measuring Portfolio Return © Oltheten & Waspi 2012
Internal Rate of ReturnDec 31, 2012 Dec 31, 2013 Dec 31, 2014 Dec 31, 2015 Dec 31, 2016
-$10,000 +$510 +$2,000 +$4,500 +5,000
IRR = 6%

Chapter 2: Measuring Portfolio Return © Oltheten & Waspi 2012
In Summary: Measuring Return
Holding Period Rate of Return Cash Flow Adjusted Rate of Return Time Weighted vs Statistical Rates of Return Internal Rate of Return

Chapter 3: Measuring Portfolio Risk © Oltheten & Waspi 2012
Measuring Risk
Risk versus Uncertainty Standard Deviation () Coefficient of Variation (CV) Beta (β)
Chapter 3: Measuring Portfolio Risk © Oltheten & Waspi 2012
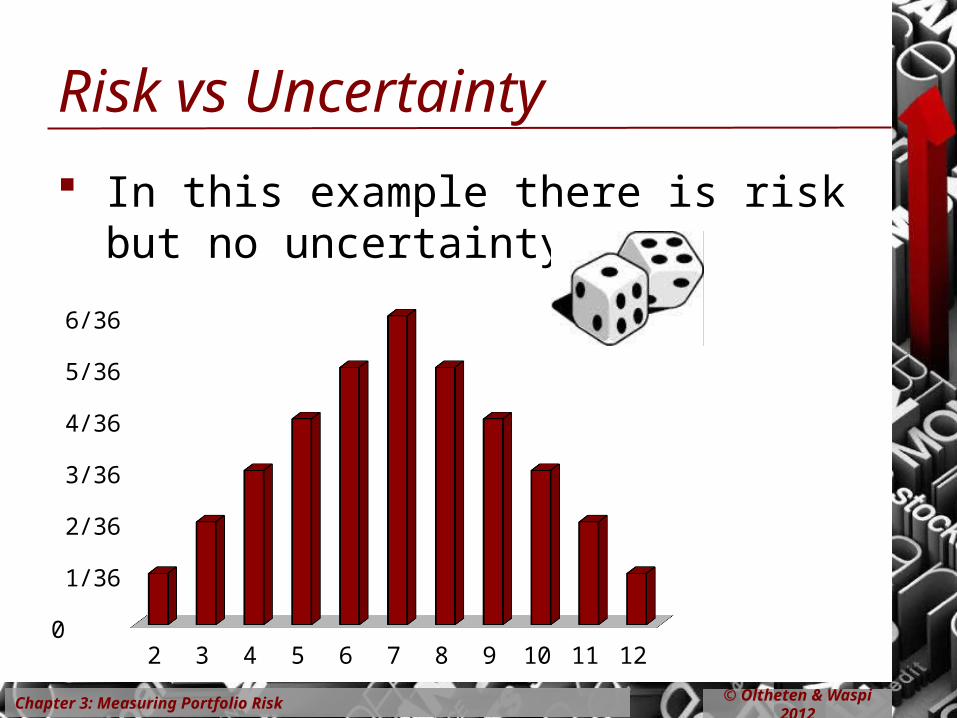
Risk vs Uncertainty
In this example there is risk but no uncertainty
2 3 4 5 6 7 8 9 10 11 120
1/36
2/36
3/36
4/36
5/36
6/36

Chapter 3: Measuring Portfolio Risk © Oltheten & Waspi 2012
-5 -4 -3 -2 -1 0 1 2 3 4 5
Risk vs Uncertainty
Stock returns are normally distributed (more or less) so there is risk, but there is still uncertainty…
5 sigma event
r~ N(0, 1)

Chapter 3: Measuring Portfolio Risk © Oltheten & Waspi 2012
In the normal distribution 99.74% of the observationsare within 3standard deviationsof the mean.
-3 -2 -1 0 1 2 3
68.27%
95.45%
99.73%
Standard Deviation

Chapter 3: Measuring Portfolio Risk © Oltheten & Waspi 2012
-10% -5% 0% 5% 10% 15% 20%
std dev = 5.0%
std dev = 2.5%
Standard Deviation
Easy to visualize
Probability of making a loss
Probability of making a loss
Chapter 3: Measuring Portfolio Risk © Oltheten & Waspi 2012
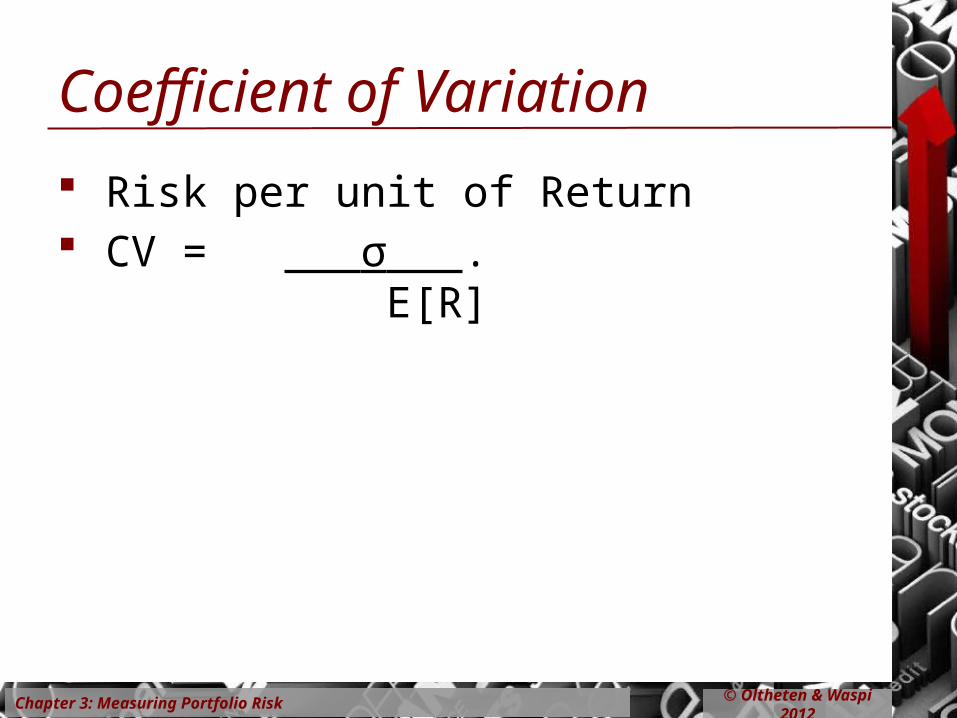
Coefficient of Variation
Risk per unit of Return CV = σ .
E[R]

Chapter 3: Measuring Portfolio Risk © Oltheten & Waspi 2012
-10% -5% 0% 5% 10% 15% 20%
std dev = 5.0%mean = 8.0%
std dev = 2.5%mean = 5.0%
Coefficient of Variation
Is the added return worth the added risk?

Chapter 3: Measuring Portfolio Risk © Oltheten & Waspi 2012
Beta
Captures Market Risk (Market Model)
We will generate the market model through our discussion of diversification

Chapter 3: Measuring Portfolio Risk © Oltheten & Waspi 2012
In Summary: Measuring Risk
Risk versus Uncertainty Standard Deviation Coefficient of Variation Beta

Chapter 3: Measuring Portfolio Risk © Oltheten & Waspi 2012
Risk Preferences
Risk Averse Investors accept risk only if they are compensated
Risk Neutral Investors are blind to risk and simply choose the
highest expected return
Risk Loving Investors actually derive utility from risky behavior
(like gambles)

Chapter 4: Diversification © Oltheten & Waspi 2012
Diversification
Diversification reduces risk exposure when returns are imperfectly correlated.
Covariance & Correlation (review)

Chapter 4: Diversification © Oltheten & Waspi 2012
Covariance
Expectations vs Actual
E[R] Boom Normal Bust
-10%
-5%
0%
5%
10%
15%
20%
25%
30%
11%
28%
12%
-7%
7%
-3%
7%
17%
Stocks: =11%, =14.3062Bonds: =7%, =8.1650

Chapter 4: Diversification © Oltheten & Waspi 2012
Covariance
Deviations for the expected value
E[R] Boom Normal Bust
-20%
-15%
-10%
-5%
0%
5%
10%
15%
20%
0%
17%
1%
-18%
0%
-10%
0%
10%
Stocks: =11%, =14.3062Bonds: =7%, =8.1650

Chapter 4: Diversification © Oltheten & Waspi 2012
Covariance
Variance = average squared deviation: Covariance = average product of the deviations:
Stocks Bonds CombinedSquared Deviation
Dev Deviation2 Dev Deviation2
17% 289 -10% 100 17% * -10% = -170%
1% 1 0% 0 1% * 0% = 0%
-18% 324 10% 100 -18% * 10% = -180%
= =
2 = 2 = Covariance =
= =

Chapter 4: Diversification © Oltheten & Waspi 2012
Correlation
= Covariance (Stocks, Bonds) (Stocks) (Bonds)
= =
= 0Ocean Waves
= +1Scaffold
= -1Teeter-Totter
Chapter 4: Diversification © Oltheten & Waspi 2012
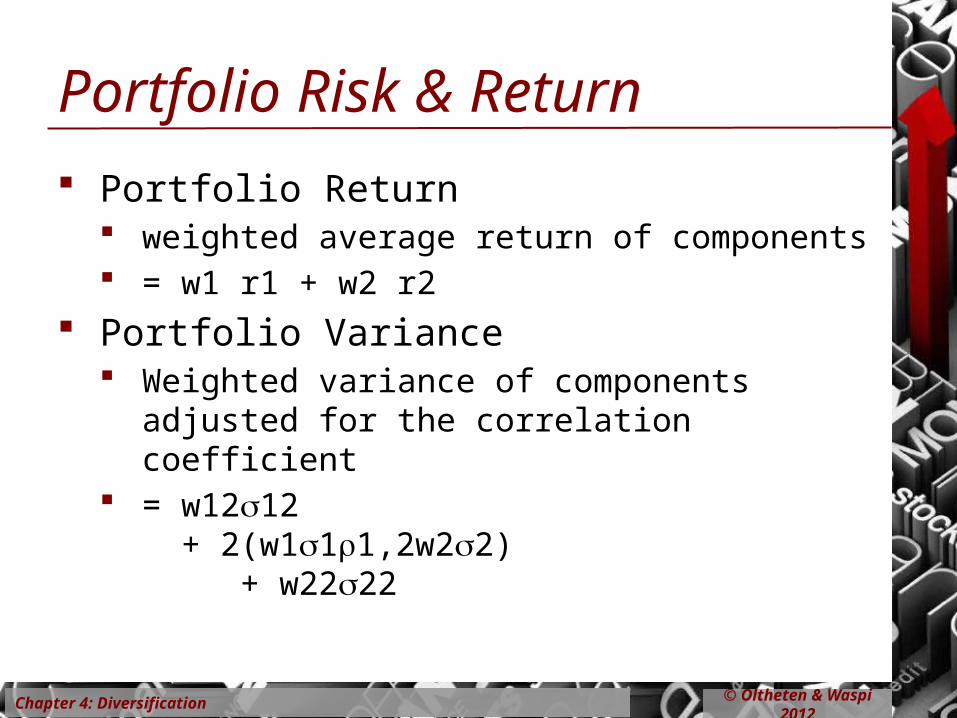
Portfolio Risk & Return
Portfolio Return weighted average return of components = w1 r1 + w2 r2
Portfolio Variance Weighted variance of components adjusted for
the correlation coefficient = w1212
+ 2(w111,2w22) + w2222

Chapter 4: Diversification © Oltheten & Waspi 2012
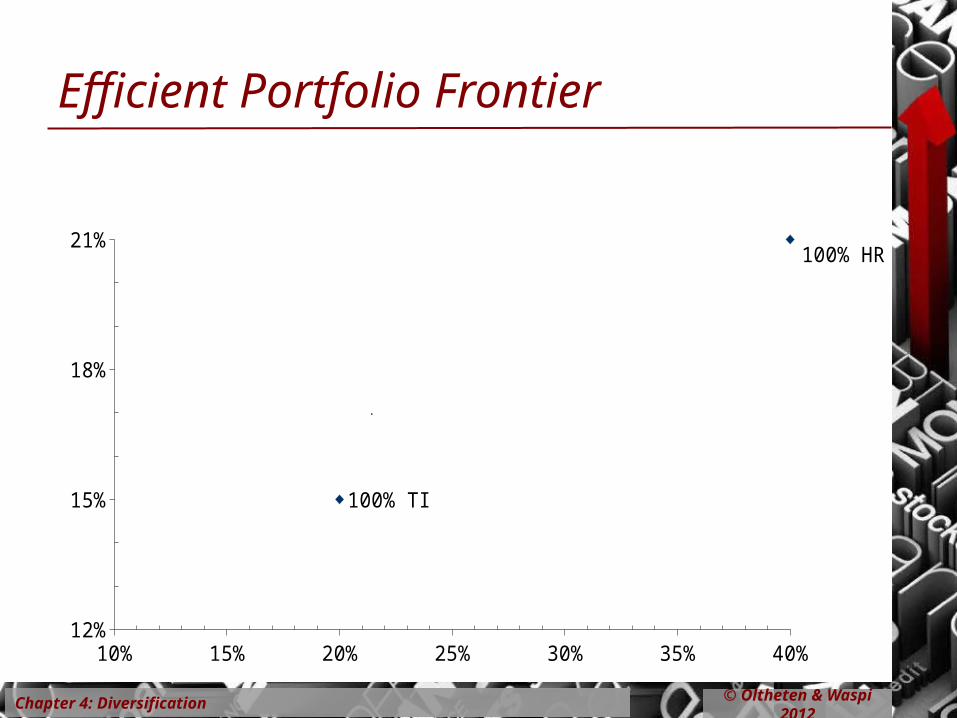
Portfolio Risk & Return: an example
A portfolio of two stocks Tardis Intertemporal
E[r] = 15% = 20% Hypothetical Resources
E[r] = 21% = 40% r = 0.30
Chapter 4: Diversification © Oltheten & Waspi 2012
Efficient Portfolio Frontier
10% 15% 20% 25% 30% 35% 40%12%
15%
18%
21%100% HR
100% TI

Chapter 4: Diversification © Oltheten & Waspi 2012
Efficient Portfolio Frontier (=0.3)
15% 20% 25% 30% 35% 40%12%
15%
18%
21%100% HR
100% TI

Chapter 4: Diversification © Oltheten & Waspi 2012
Efficient Portfolio Frontier
0% 5% 10% 15% 20% 25% 30% 35% 40%14%
15%
16%
17%
18%
19%
20%
21%
ρ=1
100% HR
ρ=-1ρ=0
ρ=0.3
100% TI

Chapter 4: Diversification © Oltheten & Waspi 2012
Efficient Portfolio Frontier (=0.3)
15% 20% 25% 30% 35% 40%12%
15%
18%
21%100% HR
62.6% TI37.4% HR
100% TI
rf = 10%

Chapter 4: Diversification © Oltheten & Waspi 2012
Limits of Diversification
Unsystematic Risk Industry or firm specific – can be diversified away
Systematic Risk Economy wide - cannot be diversified away
0 20 40
Systematic Risk
Unsystematic Risk
market portfolio
Number of Stocks in the portfolio
Sta
ndar
d D
evia
tion

II: Portfolio Theory I