ieee transactions on cloud computing, vol. 1, no. 1 ...sameekhan.org/pub/b_k_2013_tcc.pdf · cloud...
TRANSCRIPT
On the Characterization of the StructuralRobustness of Data Center Networks
Kashif Bilal, Student Member, IEEE, Marc Manzano, Samee U. Khan, Senior Member, IEEE,
Eusebi Calle, Keqin Li, Senior Member, IEEE, and Albert Y. Zomaya, Fellow, IEEE
Abstract—Data centers being an architectural and functional block of cloud computing are integral to the Information and
Communication Technology (ICT) sector. Cloud computing is rigorously utilized by various domains, such as agriculture, nuclear
science, smart grids, healthcare, and search engines for research, data storage, and analysis. A Data Center Network (DCN)
constitutes the communicational backbone of a data center, ascertaining the performance boundaries for cloud infrastructure. The
DCN needs to be robust to failures and uncertainties to deliver the required Quality-of-Service (QoS) level and satisfy service-level
agreement (SLA). In this paper, we analyze robustness of the state-of-the-art DCNs. Our major contributions are: 1) we present
multilayered graph modeling of various DCNs; 2) we study the classical robustness metrics considering various failure scenarios to
perform a comparative analysis; 3) we present the inadequacy of the classical network robustness metrics to appropriately evaluate
the DCN robustness; and 4) we propose new procedures to quantify the DCN robustness. Currently, there is no detailed study
available centering the DCN robustness. Therefore, we believe that this study will lay a firm foundation for the future DCN
robustness research.
Index Terms—Cloud computing, data center networks, multilayer graphs, network analysis, structural robustness
Ç
1 INTRODUCTION
CLOUD computing has emerged as a promising paradigmin various domains of the information and communica-
tion technology (ICT). Recently, cloud computing hasincreasingly been employed to a wide range of applicationsin various research domains, such as agriculture, smart grids,e-commerce, scientific applications, healthcare, and nuclearscience [1]. Data centers being an architectural and opera-tional foundation of cloud, play a vital role in the economicand operational success of cloud computing. Cloud provi-ders need to adhere and comply with the service-levelagreement (SLA) and Quality of Service (QoS) for success.Any violation to the SLA may result in huge revenue andreputation loss. Cloud environment is dynamic and virtua-lized, with a shared pool of resources [2]. Therefore, theresources in the data center are prone to perturbations, faults,and failures. Cloud environment and data center networks(DCNs) need to function properly to deliver required QoSin presence of perturbations and failures [3].
DCNs constitute the communicational backbone of acloud, and hold a pivotal role to ascertain the data centerperformance and integrity [4]. A minor network perfor-mance degradation may result in enormous losses. Googlereported 20 percent revenue loss, when an experimentcaused an additional delay of 500 ms in the response time[5]. Moreover, Amazon reported 1 percent sales decrease foran additional delay of 100 ms in search results [5].Currently, the network robustness quantification of thewidely used DCN architectures is unavailable. Therefore,there is an immense need to carry out such a study toquantify the network behavior in the presence of perturba-tions. A minor failure in the O2 (leading cellular serviceprovider in UK) network affected around seven millioncustomers for three days [6]. Similarly, a core switch failurein the BlackBerry’s network left millions of customerswithout Internet access for three days [6]. The significanceof the interconnection networks is obvious from theaforementioned discussion, providing adequate evidencesfor the robustness requirement of the network. It can beinferred from the discussion that the network robustnessholds a key role to ensure desired level of performance andQoS in cloud computing. In the said perspective, measuringthe robustness of the DCN is crucial to identify the behaviorand level of performance that a network can attain underperturbations and failure-prone circumstances. Therefore,DCN’s robustness is a vital measure for proven perfor-mance and fault tolerance in cloud computing.
Network (or also referred to as topology) robustness is theability of the network to deliver the expected level ofperformance when one or more components of the networkfail [7]. Sydney et al. [8] defined robustness as the “ability ofa network to maintain its total throughput under node andlink removal”. Ali et al. [3] consider a system robust, whenthe system is able to operate as expected in presence of
IEEE TRANSACTIONS ON CLOUD COMPUTING, VOL. 1, NO. 1, JANUARY-JUNE 2013 1
. K. Bilal and S.U. Khan are with the Department of Electrical and ComputerEngineering, 1411 Centennial Blvd, North Dakota State University, Fargo,ND 58102. E-mail: {kashif.bilal, samee.khan}@ndsu.edu.
. M. Manzano and E. Calle are with the P-IV building, BCDS laboratory(204-205), Av. Lluıs Santalo, s/n, 17071-Girona, University of Girona,Girona 17071, Spain.E-mail: [email protected], [email protected].
. K. Li is with the Department of Computer Science, Faculty Office BuildingN-3 ,1 hawk Drive, State University of New York , New Paltz, NY 12561.E-mail: [email protected].
. A.Y. Zomaya is with the School of Information Technologies, Building J12,The University of Sydney, Sydney, NSW 2006, Australia.E-mail: [email protected]
Manuscript received 18 Apr. 2013; revised 28 Aug. 2013; accepted 3 Sept.2013; published online 18 Sept. 2013.Recommended for acceptance by L. Lefevre.For information on obtaining reprints of this article, please send e-mail to:[email protected], and reference IEEECS Log Number TCC-2013-04-0076.Digital Object Identifier no. 10.1109/TCC.2013.6.
2168-7161/13/$31.00 � 2013 IEEE Published by the IEEE CS, ComSoc, PES, CES, & SEN
uncertainties and perturbations. System robustness, andnetwork robustness in particular, has been widely discussedin the literature [7], [8], [9], [10], [11], [12], [13], [14], [15].Network robustness metrics generally consider the graphtheory-based topological features of the network [7]. Severalmetrics, such as the node connectivity, symmetry ratio,shortest path length, diameter, and assortativity coefficientare used to measure network robustness. However, DCNsexhibit various divergences from the conventional randomnetworks and graph models, such as heterogeneity, multi-layered graph model, and connectivity pattern. DCNs followa predefined complex architectural and topological pattern,and are generally composed of various layers, such asThreeTier and FatTree DCNs. Therefore, proper modeling ofDCNs is required to measure the robustness.
In this paper, we evaluate various topological featuresand robustness of the state-of-the-art DCNs namely:1) ThreeTier [16], 2) FatTree [17], and 3) DCell [18]. Ourmajor contributions include:
. modeling DCN topologies using multilayeredgraphs;
. developing a DCN graph topology generation tool;
. measuring several robustness metrics under variousfailure scenarios;
. comparative robustness analysis of the DCN topol-ogies and indicating the inadequacy of the classicalrobustness metrics to evaluate DCNs;
. proposing new robustness metric for the DCNtopologies.
The robustness analysis of the DCN topologies unveilednoteworthy observations. The results revealed that theclassical robustness metrics, such as average nodal degree,algebraic connectivity, and spectral radius are unable toevaluate DCNs appropriately. Most of the metrics onlyconsider the largest connected component for robustnessevaluation. Consequently, the metrics are unable to depictthe factual measurements and robustness of the network.Moreover, none of the DCNs can be declared as morerobust based on the measurements taken: 1) withoutfailure and 2) under various failure scenarios. Therefore,we present a new metric named deterioration to quantifythe DCN robustness.
The remainder of the paper is organized as follows:Section 2 presents a brief overview of the various DCNarchitectures. The multilayered graph modeling for DCNsis presented in Section 3. Section 4 provides an overviewof the various robustness metrics. The simulation scenariosand experimentation methodologies are detailed in Sec-tion 5. The set of networks considered in this work, as wellas a discussion regarding their structural robustness, ispresented in Section 6. Results are reported in Section 7.The deterioration metric for DCNs is detailed in Section7.5. Finally, Section 8 concludes the work with possiblefuture directions.
2 DCN ARCHITECTURES
The network infrastructure holds a focal role in ascertainingthe performance bounds of data centers. DCNs [16], [17],[18], [19], [20], [21], [22] can be classified broadly into:1) switch-centric and 2) server-centric or hybrid models [4].
In the switch-centric models, network devices, such asswitches and routers constitute the network. However, inthe server-centric or hybrid models, computational devicesalso serve as network devices besides performing thecomputational tasks. Various DCN architectures requirespecial routing protocols and possess deployment andmanagement complexities. Details of the various DCNarchitectures, DCN routing protocols, and DCN compara-tive analysis are discussed in detail in [1], [4], [23].
The ThreeTier DCN is the most commonly used DCNarchitecture [16]. The ThreeTier DCN is a switch-centricarchitecture and the network devices are organized inthree layers namely: 1) access, 2) aggregate, and 3) corenetwork layer. The access layer switch connects variouscomputational servers within a rack. Multiple access layerswitches are connected to the aggregate layer switches. Thecore layer switches are used to connect all of the aggregatelayer switches.
Al-Fares et al. [17] used commodity network switchesto design the FatTree DCN architecture. The FatTree DCNis assembled in k modules (called pods). There are knetwork switches arranged in two distinct layers (accessand aggregate) within each of the pods. Each of the podscontains ðk2Þ
2 computational servers that are connected tok/2 access layer switches. The core network layer iscomprised of ðk2Þ
2 core switches. Every core level switchconnects to one of the aggregate layer switches in each ofthe pods.
Guo et al. [18] proposed DCell, a hybrid DCN architec-ture. The DCell architecture is composed of a hierarchy ofmodules called dcells. In dcell0, n servers are connected to acommodity network switch. Dcell0 provides the foundationof the DCell architecture, and higher level dcells areconstructed using dcell0. Each dcelll�1 is connected to allof the other dcellsl�1 within the same dcelll. The computa-tional servers in the DCell architecture also perform packetrouting and forwarding functionality besides performingcomputational tasks.
3 GRAPH DEFINITIONS FOR DCN ARCHITECTURES
3.1 Previous Definitions
Kurant and Thiran proposed a general multi-layered graphmodel in [24]. The authors elaborated that althoughnetworks are deliberated as distinctive objects, these objectsare usually fragments of complex network, where varioustopologies interdependently interact with each other. Theauthors defined two layers of the network: 1) physical G� ¼fV �; E�g and 2) logical G� ¼ fV �; E�g. The physical graphrepresents the lower layer topology, and the logical graphrepresents the upper layer topology. Each logical edge e�
exhibits mapping on the physical graph as a pathMðe�Þ � G�. Because the number of layers is fixed, theproposed model is inapplicable to the DCN architectures.Moreover, none of the layers in DCNs are logical. Therefore,the idea of mapping one layer to the other is incapable tocharacterize DCNs.
Dong et al. in [25], defined a multilayered graph Gcomposed of M layers GðiÞ, i ¼ 1; . . . ;M. Each layer GðiÞ ¼fV ;EðiÞ; !ðiÞg represents an undirected weighted graph,
2 IEEE TRANSACTIONS ON CLOUD COMPUTING, VOL. 1, NO. 1, JANUARY-JUNE 2013
composed of a set of common vertices V and edges EðiÞ
having !ðiÞ associated weights. As the number of nodes(vertices) in each layer needs to be same, the proposal isinapplicable to DCNs. Moreover, the definition lacks theinterconnection information between different layers in theproposal. Because none of the previously proposed graphmodels matches the DCN-based graph definition, wepresent a formal definition for each of the DCN architectures.
3.2 ThreeTier DCN Architecture
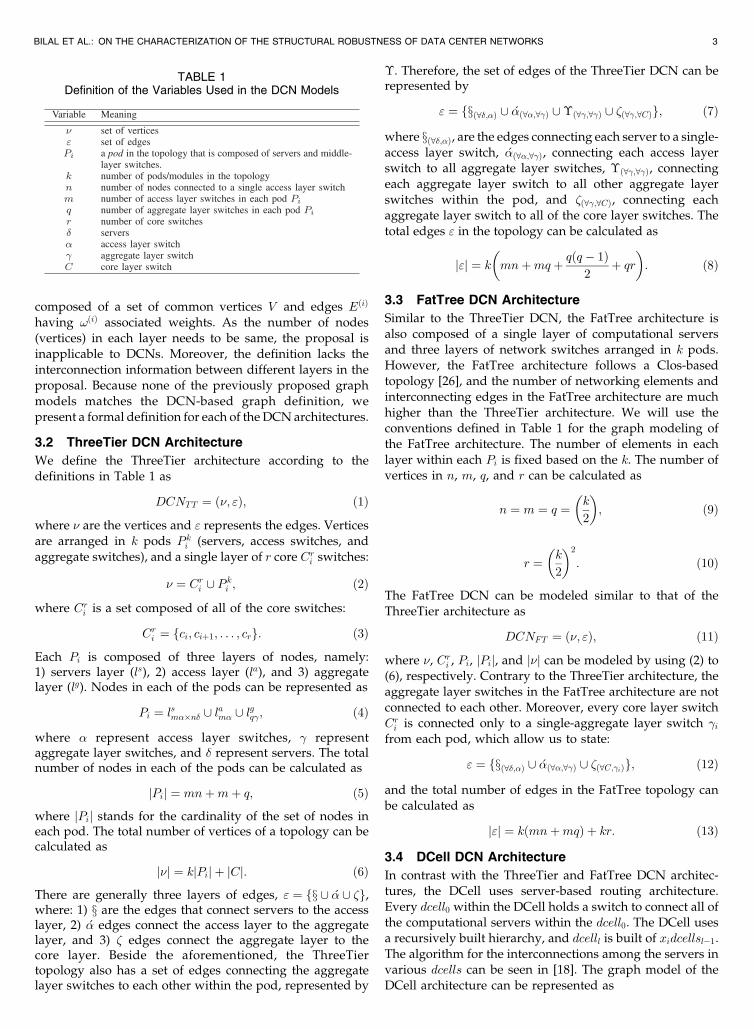
We define the ThreeTier architecture according to thedefinitions in Table 1 as
DCNTT ¼ ð�; "Þ; ð1Þ
where � are the vertices and " represents the edges. Verticesare arranged in k pods Pk
i (servers, access switches, andaggregate switches), and a single layer of r core Cr
i switches:
� ¼ Cri [ Pk
i ; ð2Þ
where Cri is a set composed of all of the core switches:
Cri ¼ fci; ciþ1; . . . ; crg: ð3Þ
Each Pi is composed of three layers of nodes, namely:1) servers layer (ls), 2) access layer (la), and 3) aggregatelayer (lg). Nodes in each of the pods can be represented as
Pi ¼ lsm��n� [ lam� [ lgq�; ð4Þ
where � represent access layer switches, � representaggregate layer switches, and � represent servers. The totalnumber of nodes in each of the pods can be calculated as
jPij ¼ mnþmþ q; ð5Þ
where jPij stands for the cardinality of the set of nodes ineach pod. The total number of vertices of a topology can becalculated as
j�j ¼ kjPij þ jCj: ð6Þ
There are generally three layers of edges, " ¼ fx [ �� [ �g,where: 1) x are the edges that connect servers to the accesslayer, 2) �� edges connect the access layer to the aggregatelayer, and 3) � edges connect the aggregate layer to thecore layer. Beside the aforementioned, the ThreeTiertopology also has a set of edges connecting the aggregatelayer switches to each other within the pod, represented by
�. Therefore, the set of edges of the ThreeTier DCN can berepresented by
" ¼ fxð8�;�Þ [ ��ð8�;8�Þ [�ð8�;8�Þ [ �ð8�;8CÞg; ð7Þ
where xð8�;�Þ, are the edges connecting each server to a single-access layer switch, ��ð8�;8�Þ, connecting each access layerswitch to all aggregate layer switches, �ð8�;8�Þ, connectingeach aggregate layer switch to all other aggregate layerswitches within the pod, and �ð8�;8CÞ, connecting eachaggregate layer switch to all of the core layer switches. Thetotal edges " in the topology can be calculated as
j"j ¼ k mnþmq þ qðq � 1Þ2
þ qr� �
: ð8Þ
3.3 FatTree DCN Architecture
Similar to the ThreeTier DCN, the FatTree architecture isalso composed of a single layer of computational serversand three layers of network switches arranged in k pods.However, the FatTree architecture follows a Clos-basedtopology [26], and the number of networking elements andinterconnecting edges in the FatTree architecture are muchhigher than the ThreeTier architecture. We will use theconventions defined in Table 1 for the graph modeling ofthe FatTree architecture. The number of elements in eachlayer within each Pi is fixed based on the k. The number ofvertices in n, m, q, and r can be calculated as
n ¼ m ¼ q ¼ k
2
� �; ð9Þ
r ¼ k
2
� �2
: ð10Þ
The FatTree DCN can be modeled similar to that of theThreeTier architecture as
DCNFT ¼ ð�; "Þ; ð11Þ
where �, Cri , Pi, jPij, and j�j can be modeled by using (2) to
(6), respectively. Contrary to the ThreeTier architecture, theaggregate layer switches in the FatTree architecture are notconnected to each other. Moreover, every core layer switchCri is connected only to a single-aggregate layer switch �i
from each pod, which allow us to state:
" ¼ fxð8�;�Þ [ ��ð8�;8�Þ [ �ð8C;�iÞg; ð12Þ
and the total number of edges in the FatTree topology canbe calculated as
j"j ¼ kðmnþmqÞ þ kr: ð13Þ
3.4 DCell DCN Architecture
In contrast with the ThreeTier and FatTree DCN architec-tures, the DCell uses server-based routing architecture.Every dcell0 within the DCell holds a switch to connect all ofthe computational servers within the dcell0. The DCell usesa recursively built hierarchy, and dcelll is built of xidcellsl�1.The algorithm for the interconnections among the servers invarious dcells can be seen in [18]. The graph model of theDCell architecture can be represented as
BILAL ET AL.: ON THE CHARACTERIZATION OF THE STRUCTURAL ROBUSTNESS OF DATA CENTER NETWORKS 3
TABLE 1Definition of the Variables Used in the DCN Models
DCNDC ¼ ð�; "Þ; ð14Þ
� ¼ f@i; @iþ1; . . . ; @lg; ð15Þ
where 0 � i � l, and @0 represents the dcell0:
@0 ¼ � [ �; ð16Þ
where � represents the set of servers within dcell0, s is the
number of servers within dcell0, and � is the network switch
connecting s servers within dcell0:
@l ¼ xl@l�1; ð17Þ
where xl is the total number of @l�1 in @l.
@1 ¼ x1@0; ð18Þ
x1 ¼ sþ 1: ð19Þ
Similarly, for l � 2:
xl ¼Yl�1
i¼1
xi � s !
þ 1: ð20Þ
Let xl denote the numbers of dcelll�1 in a dcelll. Let sldenote the numbers of servers in a dcelll. Then, we have:
s0 ¼ 2;x1 ¼ 3; s1 ¼ 2 � 3 ¼ 6;x2 ¼ 7; s2 ¼ 6 � 7 ¼ 42;x3 ¼ 43; s3 ¼ 42 � 43;. . .xl ¼ sl�1 þ 1; sl ¼ xl � sl�1 ¼ ðsl�1 þ 1Þ � sl�1:
ð21Þ
It can be verified by induction that (20) holds and
sl ¼ x1 � x2 � � � � � xl � s: ð22Þ
The DCell DCN is a highly scalable architecture and
supports any level of dcells. However, a 3-level DCell is
sufficient to accommodate millions of servers. The total
number of nodes in a 3-level DCell can be computed as
j�30 j ¼
Xx3
1
Xx2
1
Xx1
1
ðsþ 1Þ; ð23Þ
and the total number of edges in a 3-level DCell are:
��"30
�� ¼Xx3
1
�Xx2
1
��Xx1
1
s
�þ�x1ðx1 � 1Þ
2
��
þ�x2ðx2 � 1Þ
2
��þ�x3ðx3 � 1Þ
2
�:
ð24Þ
The total number of nodes in the l-level DCell, @l0, can be
computed as
j�j ¼Ql
i¼1
Pxi1 ðsþ 1Þ
� �ðsþ 1Þðl�1Þ
!; ð25Þ
and the total number of edges in the l-level DCell, @l0, can be
computed as
j"j ¼Ql
i¼1ðPxi
1 ðsÞÞðsÞðl�1Þ
!þ 1
2
Xlj¼1
Ylk¼j
xk
!ðxj � 1Þ
!" #: ð26Þ
4 ROBUSTNESS METRICS
4.1 Background
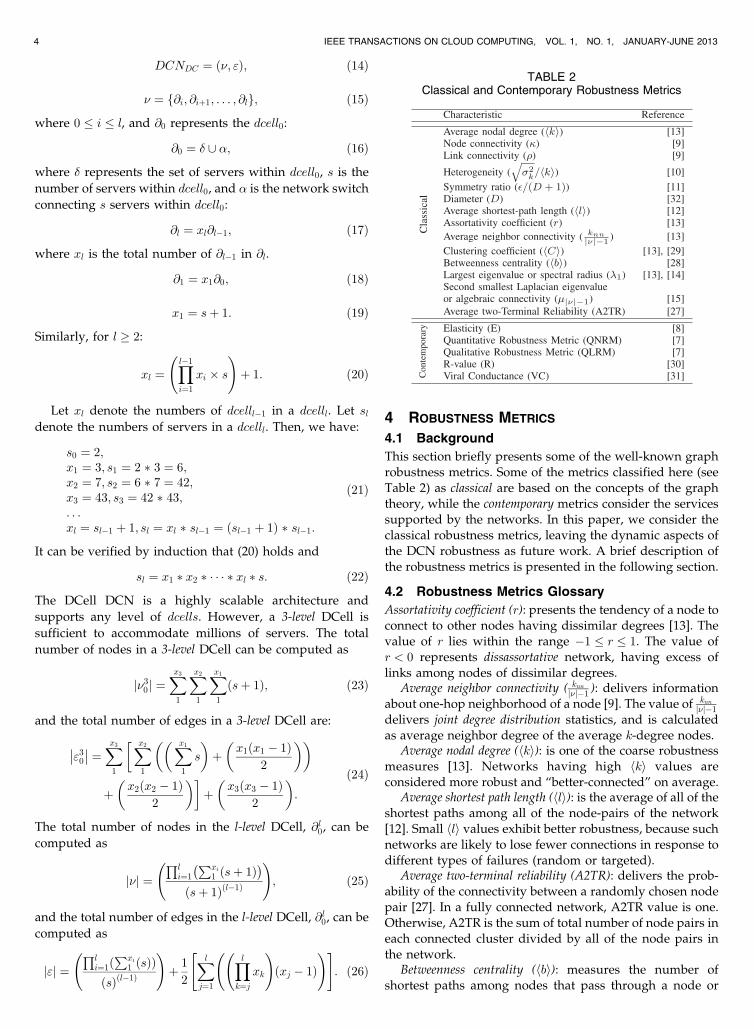
This section briefly presents some of the well-known graphrobustness metrics. Some of the metrics classified here (seeTable 2) as classical are based on the concepts of the graphtheory, while the contemporary metrics consider the servicessupported by the networks. In this paper, we consider theclassical robustness metrics, leaving the dynamic aspects ofthe DCN robustness as future work. A brief description ofthe robustness metrics is presented in the following section.
4.2 Robustness Metrics Glossary
Assortativity coefficient (r): presents the tendency of a node toconnect to other nodes having dissimilar degrees [13]. Thevalue of r lies within the range �1 � r � 1. The value ofr < 0 represents dissassortative network, having excess oflinks among nodes of dissimilar degrees.
Average neighbor connectivity ( knnj�j�1 ): delivers information
about one-hop neighborhood of a node [9]. The value of knnj�j�1
delivers joint degree distribution statistics, and is calculatedas average neighbor degree of the average k-degree nodes.
Average nodal degree (hki): is one of the coarse robustnessmeasures [13]. Networks having high hki values areconsidered more robust and “better-connected” on average.
Average shortest path length (hli): is the average of all of theshortest paths among all of the node-pairs of the network[12]. Small hli values exhibit better robustness, because suchnetworks are likely to lose fewer connections in response todifferent types of failures (random or targeted).
Average two-terminal reliability (A2TR): delivers the prob-ability of the connectivity between a randomly chosen nodepair [27]. In a fully connected network, A2TR value is one.Otherwise, A2TR is the sum of total number of node pairs ineach connected cluster divided by all of the node pairs inthe network.
Betweenness centrality (hbi): measures the number ofshortest paths among nodes that pass through a node or
4 IEEE TRANSACTIONS ON CLOUD COMPUTING, VOL. 1, NO. 1, JANUARY-JUNE 2013
TABLE 2Classical and Contemporary Robustness Metrics
link. Betweenness centrality is used to estimate the prestigeof node/link [28].
Clustering coefficient (hCi): is the percentage of 3-cyclesamong all of the connected node triplets within the network[13], [29]. If two neighbors of a node are connected, then atriangle (3-cycle) is formed by these three nodes.
Diameter (D): is the longest path among all of the shortestpaths of the network. Generally, low D represents higherrobustness.
Elasticity (E): relates to the total throughput in responseto the node removal [8]. The fundamental idea is tosuccessively remove a certain fixed number of nodes r (inthe original definition, r ¼ 1%) and measure the consequentthroughput degradation. The more pronounced and abruptis the throughput drop experienced by a given topology, thelower is the robustness.
Heterogeneity (ffiffiffi2k
phki ): is the standard deviation of the
average node degree divided by the average node degree[10]. The lower heterogeneity value translates to highernetwork robustness.
Largest eigenvalue or spectral radius (�1): is the largesteigenvalue of the adjacency matrix of a network [13], [14].Generally, the networks with the higher eigenvalues havesmall diameter and higher node distinct paths.
Node connectivity (): represents the smallest number ofnodes whose removal results in a disconnected graph [9].The node connectivity is the least number of node-disjointpaths between any two nodes within the network, whichprovides a rough indication of network robustness inresponse to any kind of failures or attacks (random ortargeted). The same definition can be applied to linkconnectivity � when considering links instead of nodes.
Quantitative Robustness Metric (QNRM): analyzes howmultiple failures affect the number of connections estab-lished in a network [7]. The QNRM delivers the number ofthe blocked connections (that cannot be established because offailure).
Qualitative Robustness Metric (QLRM): analyzes thevariation in the quality of service of a network undervarious types of failures [7]. The QLRM measures thevariation of the average shortest path length of theestablished connections.
R-value (R): computes the robustness of a topology underone or more topological features [30]. The obtained value isnormalized to [0, 1], where R ¼ 0 represents minimumrobustness, and R ¼ 1 reflects the perfect robustness.
Second smallest Laplacian eigenvalue or algebraic connectivity(�j�j�1): depicts how difficult it is to break the network intoislands or individual components [15]. The higher the valueof �j�j�1, the better the robustness.
Symmetry ratio ( Dþ1 ): is the quotient between the distinct
eigenvalues of the network adjacency matrix and thenetwork diameter [11]. The networks with low symmetryratio are considered more robust to random failures ortargeted attacks.
Viral Conductance (VC): measures the network robustnessin case of epidemic scenarios (propagation/spreading offailures) [31]. The VC is measured by considering the areaunder the curve that provides the fraction of infected nodesin steady-state for a range of epidemic intensities.
5 SIMULATION SCENARIOS AND METHODOLOGIES
This section details the simulation scenarios and methodol-ogies used in this work. To generalize the robustnessanalysis of the state-of-the-art DCNs, we performedextensive simulations considering four node failure scenar-ios to measure the various robustness metrics, namely:
1. random failures,2. targeted failures,3. network-only (failures introduced only in the net-
work devices), and4. real DCN failures (using real DCN failure data
collected over a period of one year).
To do so, we consider six DCN networks, which arepresented in Section 6. For the first three failure scenarios,we analyzed the robustness of each DCN by introducing thefailures within a range from 0.1 to 10 percent of the networksize. With the purpose of providing a detailed robustnessevaluation, we analyzed the robustness metrics by introdu-cing 0.1 to 2.5 percent of failures with an increment of 0.1,whereas from 3 to 10 percent the increment was equal to 1.
In the real DCN failures case, we used the observationsreported in [33]. Gill et al. analyzed the network failure logscollected over a period of around one year from tens of datacenters. The authors derived the failure probability forvarious network components by dividing the number offailures observed in a specific network device type, such asaccess layer or aggregate layer switches, with the totalpopulation of the devices in the given device type. We usedthe frequentist probability to derive the number of failuresin three DCN architectures. We analyzed the variousrobustness metrics under real failure scenario by instigatingthe derived failures at each layer. As the number of networkelements in the FatTree is much higher than the ThreeTierarchitecture, the number of failed nodes is around fivetimes in the FatTree as compared to the ThreeTierarchitecture.
We introduced random failures in data center nodes(including the computational servers) within a range of 0.1to 10 percent of the network size, as discussed in thevarious studies, such as [7], [34], [35]. The node failures aredistributed among the nodes at each layer and dcell levelwithin a range of 31-3,266 nodes. Besides instigatingfailures randomly in the whole network, we also consid-ered the scenario of the network-only node failure, asdiscussed in [33]. Another significant scenario to measurethe system robustness is by introducing the targetedattacks [35], [36], [37]. In the targeted failures case, weconsidered the betweenness centrality of the nodes tointroduce the node failures.
6 NETWORK TOPOLOGIES
In this section, we present six representative topologies ofthe DCN architectures. Moreover, robustness is discussedaccording to the characteristics of each of the DCNarchitectures. The selected topologies represent connectedand symmetric DCN networks.
DCN architectures follow a complex interconnectiontopology that entails a detailed understanding of thearchitecture to generate the DCN topology. Therefore,
BILAL ET AL.: ON THE CHARACTERIZATION OF THE STRUCTURAL ROBUSTNESS OF DATA CENTER NETWORKS 5
generating the representative DCN synthetic topologies is adifficult task. There is presumably no publically availableDCN topology generation tool. We developed a DCNtopology generator for custom and flexible creation ofvarious DCN topologies. Based on various input para-meters, such as number of pods for the FatTree, dcell levels,and number of nodes in dcell0 for the DCell, and number ofnodes and switches in various layers in the ThreeTier DCNarchitecture, the DCN topology generator engenders thenetwork topology in various popular graph formats. Wegenerated two representative network topologies for each ofthe DCN architectures:
. three large networks (DCell30K, FatTree30K, andThreeTier30K),
. three smaller networks (DCell2K, FatTree2K, andThreeTier2K).
Increasing a single server in the DCell topologyexponentially expands the network. A 3-level DCell withtwo servers in dcell0 constitute a network of 2,709 nodes. Anincrease in the number of servers to three in dcell0 results ina network of 32,656 nodes. Therefore, the consideredtopologies are 2K and 30K networks.
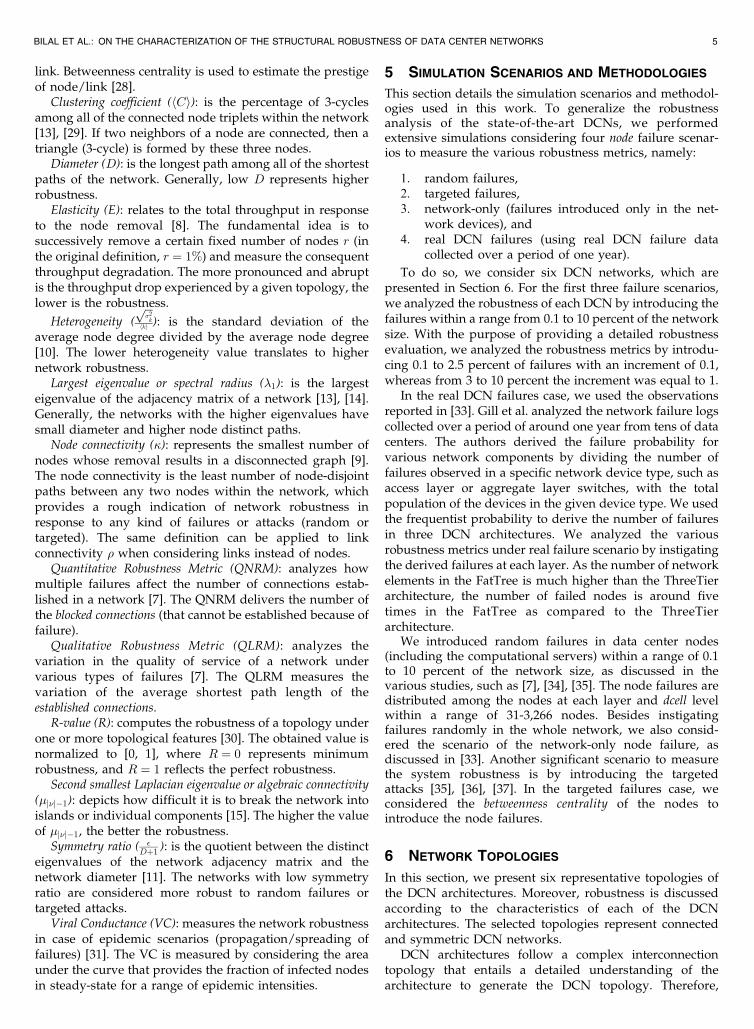
Table 3 depicts some of the features of the three largenetworks. As observed, all of the topologies have more than30,000 nodes. The FatTree30K has the largest number ofedges among the considered set of large networks. Thedensity 2�j"j
ðj�j�ðj�j�1ÞÞ of the FatTree30K is around three timeshigher than the ThreeTier30K. The higher number of edgesand density exhibit better resilience to failures. The value ofthe average shortest path length hli for the FatTree30K andThreeTier30K is less than six, whereas the DCell30K has ahigher path length (11). A higher hli means that thecommunication between the end hosts in the DCell30K ismore susceptible to be affected by a failure than in theFatTree30K or ThreeTier30K. This is due to the fact that
such a communication is going to be routed (in average)through a longer path. The higher the number of links andnodes involved in a path, the higher is the probability to beaffected by failures. Similarly, the DCell30K diameter Dpresents a value four times higher than the FatTree30K andThreeTier30K (both have D ¼ 6). However, the DCell30Kpossesses high-average nodal degree hki that depicts strongresilience against failures. Moreover, all of the threenetworks exhibit dissassortativity and have negative valueof the assortativity coefficient. It means that all of the threenetworks have an excess of links among nodes withdissimilar degrees.
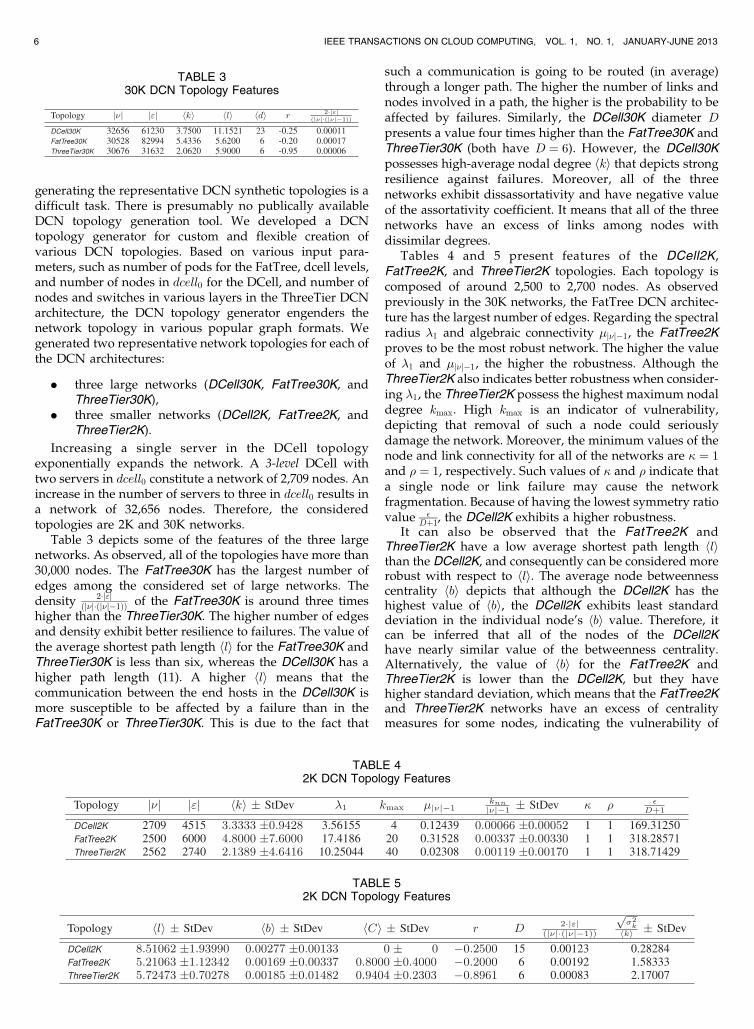
Tables 4 and 5 present features of the DCell2K,FatTree2K, and ThreeTier2K topologies. Each topology iscomposed of around 2,500 to 2,700 nodes. As observedpreviously in the 30K networks, the FatTree DCN architec-ture has the largest number of edges. Regarding the spectralradius �1 and algebraic connectivity �j�j�1, the FatTree2Kproves to be the most robust network. The higher the valueof �1 and �j�j�1, the higher the robustness. Although theThreeTier2K also indicates better robustness when consider-ing �1, the ThreeTier2K possess the highest maximum nodaldegree kmax. High kmax is an indicator of vulnerability,depicting that removal of such a node could seriouslydamage the network. Moreover, the minimum values of thenode and link connectivity for all of the networks are ¼ 1and � ¼ 1, respectively. Such values of and � indicate thata single node or link failure may cause the networkfragmentation. Because of having the lowest symmetry ratiovalue
Dþ1, the DCell2K exhibits a higher robustness.It can also be observed that the FatTree2K and
ThreeTier2K have a low average shortest path length hlithan the DCell2K, and consequently can be considered morerobust with respect to hli. The average node betweennesscentrality hbi depicts that although the DCell2K has thehighest value of hbi, the DCell2K exhibits least standarddeviation in the individual node’s hbi value. Therefore, itcan be inferred that all of the nodes of the DCell2Khave nearly similar value of the betweenness centrality.Alternatively, the value of hbi for the FatTree2K andThreeTier2K is lower than the DCell2K, but they havehigher standard deviation, which means that the FatTree2Kand ThreeTier2K networks have an excess of centralitymeasures for some nodes, indicating the vulnerability of
6 IEEE TRANSACTIONS ON CLOUD COMPUTING, VOL. 1, NO. 1, JANUARY-JUNE 2013
TABLE 52K DCN Topology Features
TABLE 330K DCN Topology Features
TABLE 42K DCN Topology Features
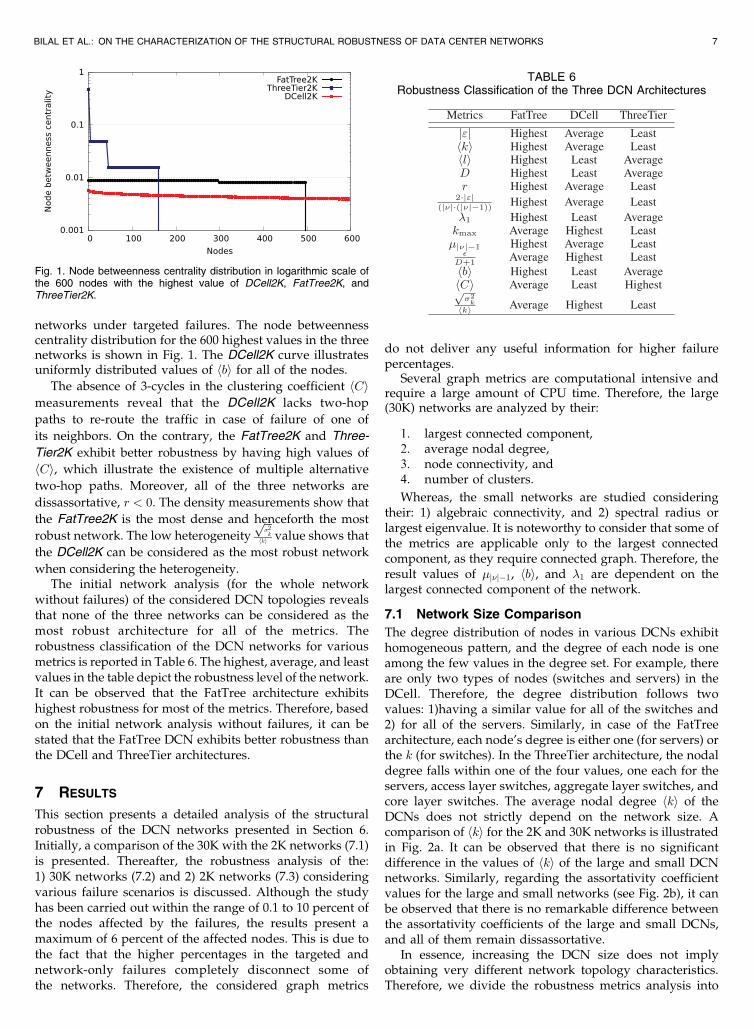
networks under targeted failures. The node betweennesscentrality distribution for the 600 highest values in the threenetworks is shown in Fig. 1. The DCell2K curve illustratesuniformly distributed values of hbi for all of the nodes.
The absence of 3-cycles in the clustering coefficient hCimeasurements reveal that the DCell2K lacks two-hop
paths to re-route the traffic in case of failure of one of
its neighbors. On the contrary, the FatTree2K and Three-
Tier2K exhibit better robustness by having high values of
hCi, which illustrate the existence of multiple alternative
two-hop paths. Moreover, all of the three networks are
dissassortative, r < 0. The density measurements show that
the FatTree2K is the most dense and henceforth the most
robust network. The low heterogeneityffiffiffi2k
phki value shows that
the DCell2K can be considered as the most robust network
when considering the heterogeneity.The initial network analysis (for the whole network
without failures) of the considered DCN topologies revealsthat none of the three networks can be considered as themost robust architecture for all of the metrics. Therobustness classification of the DCN networks for variousmetrics is reported in Table 6. The highest, average, and leastvalues in the table depict the robustness level of the network.It can be observed that the FatTree architecture exhibitshighest robustness for most of the metrics. Therefore, basedon the initial network analysis without failures, it can bestated that the FatTree DCN exhibits better robustness thanthe DCell and ThreeTier architectures.
7 RESULTS
This section presents a detailed analysis of the structuralrobustness of the DCN networks presented in Section 6.Initially, a comparison of the 30K with the 2K networks (7.1)is presented. Thereafter, the robustness analysis of the:1) 30K networks (7.2) and 2) 2K networks (7.3) consideringvarious failure scenarios is discussed. Although the studyhas been carried out within the range of 0.1 to 10 percent ofthe nodes affected by the failures, the results present amaximum of 6 percent of the affected nodes. This is due tothe fact that the higher percentages in the targeted andnetwork-only failures completely disconnect some ofthe networks. Therefore, the considered graph metrics
do not deliver any useful information for higher failurepercentages.
Several graph metrics are computational intensive andrequire a large amount of CPU time. Therefore, the large(30K) networks are analyzed by their:
1. largest connected component,2. average nodal degree,3. node connectivity, and4. number of clusters.
Whereas, the small networks are studied consideringtheir: 1) algebraic connectivity, and 2) spectral radius orlargest eigenvalue. It is noteworthy to consider that some ofthe metrics are applicable only to the largest connectedcomponent, as they require connected graph. Therefore, theresult values of �j�j�1, hbi, and �1 are dependent on thelargest connected component of the network.
7.1 Network Size Comparison
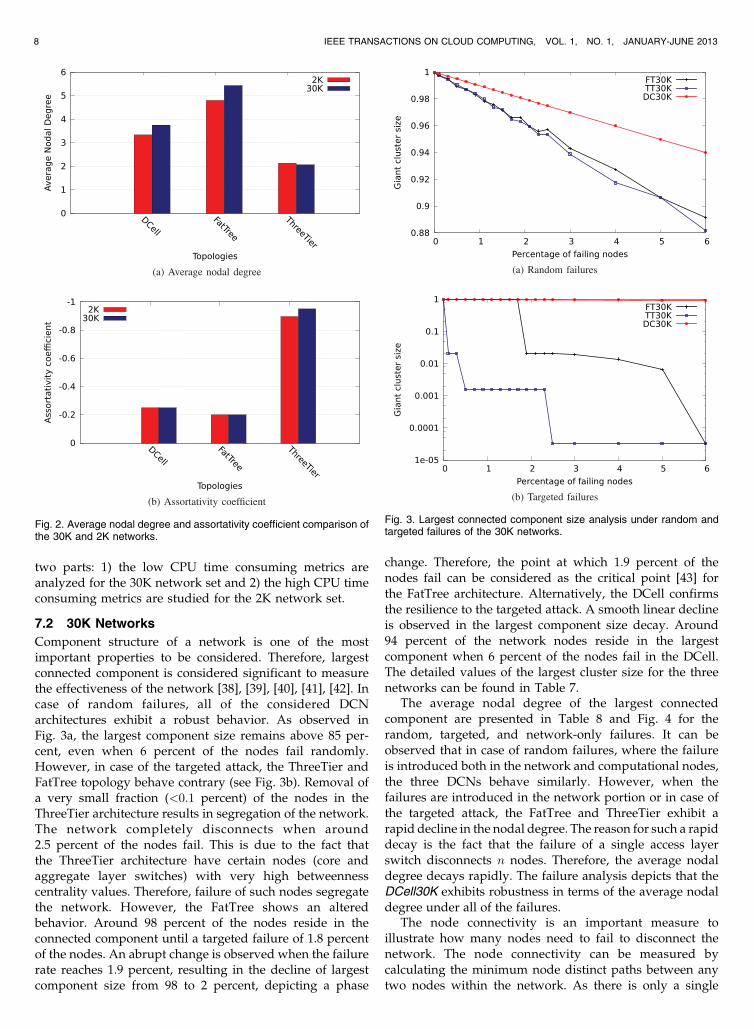
The degree distribution of nodes in various DCNs exhibithomogeneous pattern, and the degree of each node is oneamong the few values in the degree set. For example, thereare only two types of nodes (switches and servers) in theDCell. Therefore, the degree distribution follows twovalues: 1)having a similar value for all of the switches and2) for all of the servers. Similarly, in case of the FatTreearchitecture, each node’s degree is either one (for servers) orthe k (for switches). In the ThreeTier architecture, the nodaldegree falls within one of the four values, one each for theservers, access layer switches, aggregate layer switches, andcore layer switches. The average nodal degree hki of theDCNs does not strictly depend on the network size. Acomparison of hki for the 2K and 30K networks is illustratedin Fig. 2a. It can be observed that there is no significantdifference in the values of hki of the large and small DCNnetworks. Similarly, regarding the assortativity coefficientvalues for the large and small networks (see Fig. 2b), it canbe observed that there is no remarkable difference betweenthe assortativity coefficients of the large and small DCNs,and all of them remain dissassortative.
In essence, increasing the DCN size does not implyobtaining very different network topology characteristics.Therefore, we divide the robustness metrics analysis into
BILAL ET AL.: ON THE CHARACTERIZATION OF THE STRUCTURAL ROBUSTNESS OF DATA CENTER NETWORKS 7
Fig. 1. Node betweenness centrality distribution in logarithmic scale ofthe 600 nodes with the highest value of DCell2K, FatTree2K, andThreeTier2K.
TABLE 6Robustness Classification of the Three DCN Architectures
two parts: 1) the low CPU time consuming metrics areanalyzed for the 30K network set and 2) the high CPU timeconsuming metrics are studied for the 2K network set.
7.2 30K Networks
Component structure of a network is one of the mostimportant properties to be considered. Therefore, largestconnected component is considered significant to measurethe effectiveness of the network [38], [39], [40], [41], [42]. Incase of random failures, all of the considered DCNarchitectures exhibit a robust behavior. As observed inFig. 3a, the largest component size remains above 85 per-cent, even when 6 percent of the nodes fail randomly.However, in case of the targeted attack, the ThreeTier andFatTree topology behave contrary (see Fig. 3b). Removal ofa very small fraction (<0:1 percent) of the nodes in theThreeTier architecture results in segregation of the network.The network completely disconnects when around2.5 percent of the nodes fail. This is due to the fact thatthe ThreeTier architecture have certain nodes (core andaggregate layer switches) with very high betweennesscentrality values. Therefore, failure of such nodes segregatethe network. However, the FatTree shows an alteredbehavior. Around 98 percent of the nodes reside in theconnected component until a targeted failure of 1.8 percentof the nodes. An abrupt change is observed when the failurerate reaches 1.9 percent, resulting in the decline of largestcomponent size from 98 to 2 percent, depicting a phase
change. Therefore, the point at which 1.9 percent of thenodes fail can be considered as the critical point [43] forthe FatTree architecture. Alternatively, the DCell confirmsthe resilience to the targeted attack. A smooth linear declineis observed in the largest component size decay. Around94 percent of the network nodes reside in the largestcomponent when 6 percent of the nodes fail in the DCell.The detailed values of the largest cluster size for the threenetworks can be found in Table 7.
The average nodal degree of the largest connectedcomponent are presented in Table 8 and Fig. 4 for therandom, targeted, and network-only failures. It can beobserved that in case of random failures, where the failureis introduced both in the network and computational nodes,the three DCNs behave similarly. However, when thefailures are introduced in the network portion or in case ofthe targeted attack, the FatTree and ThreeTier exhibit arapid decline in the nodal degree. The reason for such a rapiddecay is the fact that the failure of a single access layerswitch disconnects n nodes. Therefore, the average nodaldegree decays rapidly. The failure analysis depicts that theDCell30K exhibits robustness in terms of the average nodaldegree under all of the failures.
The node connectivity is an important measure toillustrate how many nodes need to fail to disconnect thenetwork. The node connectivity can be measured bycalculating the minimum node distinct paths between anytwo nodes within the network. As there is only a single
8 IEEE TRANSACTIONS ON CLOUD COMPUTING, VOL. 1, NO. 1, JANUARY-JUNE 2013
Fig. 3. Largest connected component size analysis under random andtargeted failures of the 30K networks.
Fig. 2. Average nodal degree and assortativity coefficient comparison ofthe 30K and 2K networks.
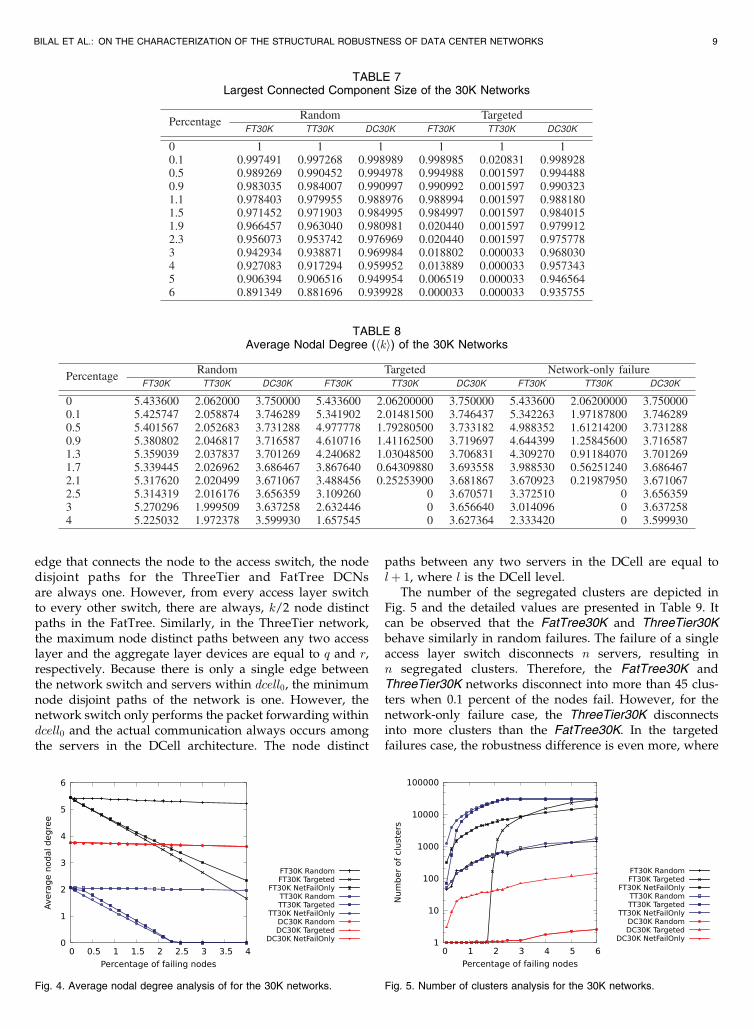
edge that connects the node to the access switch, the nodedisjoint paths for the ThreeTier and FatTree DCNsare always one. However, from every access layer switchto every other switch, there are always, k/2 node distinctpaths in the FatTree. Similarly, in the ThreeTier network,the maximum node distinct paths between any two accesslayer and the aggregate layer devices are equal to q and r,respectively. Because there is only a single edge betweenthe network switch and servers within dcell0, the minimumnode disjoint paths of the network is one. However, thenetwork switch only performs the packet forwarding withindcell0 and the actual communication always occurs amongthe servers in the DCell architecture. The node distinct
paths between any two servers in the DCell are equal tolþ 1, where l is the DCell level.
The number of the segregated clusters are depicted inFig. 5 and the detailed values are presented in Table 9. Itcan be observed that the FatTree30K and ThreeTier30Kbehave similarly in random failures. The failure of a singleaccess layer switch disconnects n servers, resulting inn segregated clusters. Therefore, the FatTree30K andThreeTier30K networks disconnect into more than 45 clus-ters when 0.1 percent of the nodes fail. However, for thenetwork-only failure case, the ThreeTier30K disconnectsinto more clusters than the FatTree30K. In the targetedfailures case, the robustness difference is even more, where
BILAL ET AL.: ON THE CHARACTERIZATION OF THE STRUCTURAL ROBUSTNESS OF DATA CENTER NETWORKS 9
TABLE 8Average Nodal Degree (hki) of the 30K Networks
Fig. 4. Average nodal degree analysis of for the 30K networks. Fig. 5. Number of clusters analysis for the 30K networks.
TABLE 7Largest Connected Component Size of the 30K Networks
the FatTree30K remains connected until 1.9 percent of thenodes fail. This is due to the fact that the FatTree networkhas a considerable portion of the nodes (ðk2Þ
2 core switches)with similar high betweenness centrality values (see thebetweenness centrality distribution in Section 6). Therefore,the topology remains fully connected until ððk2Þ
2 � 1Þ nodesfail in the FatTree30K. It is noteworthy to mention thatbecause of nearly similar betweenness centrality distribu-tion among the nodes, the DCell30K outperforms the othertwo 30K networks. The DCell portrays high robustness inrandom or network-only failures, and remains connecteduntil 4 percent of the nodes are affected. However, thenetwork disconnects with only 0.1 percent of the nodesfailure in case of the targeted attack. Nonetheless, thenumber of segregated cluster remains much less than thecounterparts. In any of the failure cases, the DCell30Kcan be considered as the most robust network in terms ofnumber of isolated clusters among all of the DCNarchitectures.
7.3 2K Networks
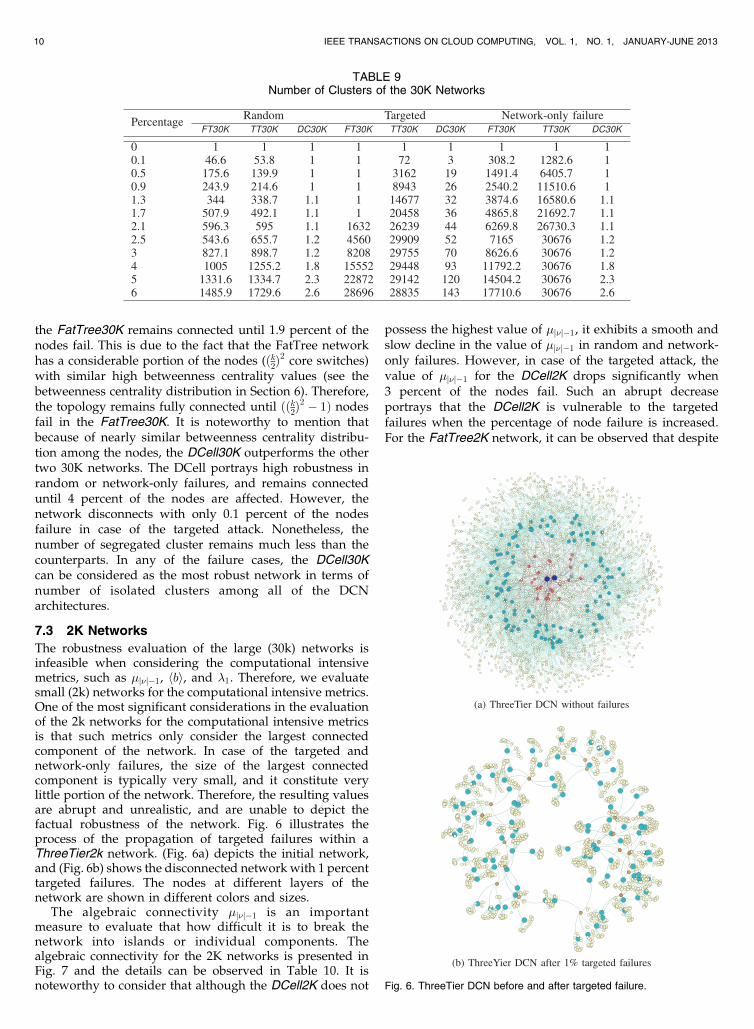
The robustness evaluation of the large (30k) networks isinfeasible when considering the computational intensivemetrics, such as �j�j�1, hbi, and �1. Therefore, we evaluatesmall (2k) networks for the computational intensive metrics.One of the most significant considerations in the evaluationof the 2k networks for the computational intensive metricsis that such metrics only consider the largest connectedcomponent of the network. In case of the targeted andnetwork-only failures, the size of the largest connectedcomponent is typically very small, and it constitute verylittle portion of the network. Therefore, the resulting valuesare abrupt and unrealistic, and are unable to depict thefactual robustness of the network. Fig. 6 illustrates theprocess of the propagation of targeted failures within aThreeTier2k network. (Fig. 6a) depicts the initial network,and (Fig. 6b) shows the disconnected network with 1 percenttargeted failures. The nodes at different layers of thenetwork are shown in different colors and sizes.
The algebraic connectivity �j�j�1 is an importantmeasure to evaluate that how difficult it is to break thenetwork into islands or individual components. Thealgebraic connectivity for the 2K networks is presented inFig. 7 and the details can be observed in Table 10. It isnoteworthy to consider that although the DCell2K does not
possess the highest value of �j�j�1, it exhibits a smooth andslow decline in the value of �j�j�1 in random and network-only failures. However, in case of the targeted attack, thevalue of �j�j�1 for the DCell2K drops significantly when3 percent of the nodes fail. Such an abrupt decreaseportrays that the DCell2K is vulnerable to the targetedfailures when the percentage of node failure is increased.For the FatTree2K network, it can be observed that despite
10 IEEE TRANSACTIONS ON CLOUD COMPUTING, VOL. 1, NO. 1, JANUARY-JUNE 2013
Fig. 6. ThreeTier DCN before and after targeted failure.
TABLE 9Number of Clusters of the 30K Networks
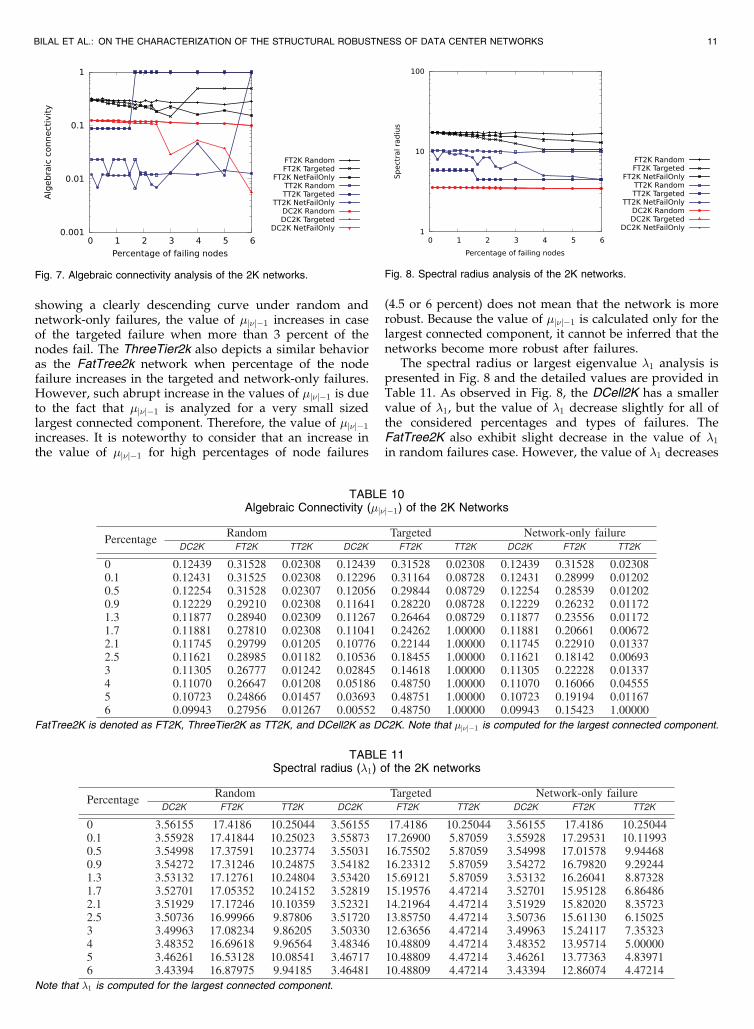
showing a clearly descending curve under random andnetwork-only failures, the value of �j�j�1 increases in caseof the targeted failure when more than 3 percent of thenodes fail. The ThreeTier2k also depicts a similar behavioras the FatTree2k network when percentage of the nodefailure increases in the targeted and network-only failures.However, such abrupt increase in the values of �j�j�1 is dueto the fact that �j�j�1 is analyzed for a very small sizedlargest connected component. Therefore, the value of �j�j�1
increases. It is noteworthy to consider that an increase inthe value of �j�j�1 for high percentages of node failures
(4.5 or 6 percent) does not mean that the network is morerobust. Because the value of �j�j�1 is calculated only for thelargest connected component, it cannot be inferred that thenetworks become more robust after failures.
The spectral radius or largest eigenvalue �1 analysis ispresented in Fig. 8 and the detailed values are provided inTable 11. As observed in Fig. 8, the DCell2K has a smallervalue of �1, but the value of �1 decrease slightly for all ofthe considered percentages and types of failures. TheFatTree2K also exhibit slight decrease in the value of �1
in random failures case. However, the value of �1 decreases
BILAL ET AL.: ON THE CHARACTERIZATION OF THE STRUCTURAL ROBUSTNESS OF DATA CENTER NETWORKS 11
Fig. 8. Spectral radius analysis of the 2K networks.Fig. 7. Algebraic connectivity analysis of the 2K networks.
TABLE 11Spectral radius (�1) of the 2K networks
Note that �1 is computed for the largest connected component.
TABLE 10Algebraic Connectivity (�j�j�1) of the 2K Networks
FatTree2K is denoted as FT2K, ThreeTier2K as TT2K, and DCell2K as DC2K. Note that �j�j�1 is computed for the largest connected component.
almost linearly under network-only and targeted failures inthe FatTree2K. The ThreeTier2K is significantly affected bythe targeted failure, and the value of �1 divides almost tohalf with only 0.1 percent of the nodes failure.
The robustness analysis of the DCN architecturesconsidering various failure types and percentages revealsthe vulnerability of the ThreeTier and FatTree DCNarchitectures to the targeted and network-only failures.However, the DCell architecture exhibits graceful and littlevariation of the metric values in response to all of thefailure types and percentages. Therefore, it can be inferredfrom the failure analysis that the DCell exhibits betterrobustness than the ThreeTier and FatTree architectures.Moreover, the results drawn from the initial robustnessanalysis of the DCN networks without failure (see Table 6)proves invalid. In contrary to the values reported inTable 6, the failure analysis reveals that the DCellarchitecture exhibits better robustness. Therefore, it isevident that the classical robustness metrics are inadequateto evaluate the DCN robustness.
7.4 Real Failures in DCNs
This section presents the robustness measurements ob-tained from the largest connected components of the sixnetworks (three 30K and three 2K), when the real failureswithin the DCNs are produced. As defined in Section 5, aspecific number of nodes from each layer of networktopology (based on the failure logs of various data centers)have been selected to fail, and the graph metrics have beencomputed for the resulting largest connected component.
The Table 12 presents the results of the real failures. Allof the networks possess more than 90 percent of the nodesin the largest connected component in response to the realfailures, as indicated by the value of maxð�Þ. The resultsobtained from the real failures illustrate that the averagenodal degree decreases slightly in all of the networks. Theaverage shortest path length and diameter exhibit minorincrease in all of the three networks. The assortativitycoefficient value also depicts minor change for all of theDCN architecture. The value of hbi increases for all ofthe networks, indicating the increased vulnerability of thenetworks. The value of �j�j�1 exhibits comparatively higherdecrease for the FatTree2K and ThreeTier2K than theDCell2K network. Similarly, the value of �1 also decreasessignificantly for the FatTree2K and ThreeTier2K as com-pared to the DCell2K. Therefore, the DCell2K network canbe considered more robust network in case of the realfailures while considering �j�j�1 and �1.
All of the considered networks exhibit robust behavior inresponse to the real failures. However, the DCell architec-ture depicts graceful and minor variations in all of theobserved metrics as compared to the ThreeTier and FatTreearchitectures. Therefore, the DCell DCN can be consideredas the most robust architecture in case of the real failures.
7.5 Deterioration of DCNs
It has been observed that depending on the: 1) DCNarchitecture, 2) type of failure (whether it is random,targeted, network-only, or real), and (3) specific percentageof the nodes failed, the level of robustness according to aspecific graph metric, computed from the largest connectedcomponent might be different. Moreover, the results forthe various metrics exhibit strong dependence on thelargest connected component, as observed in Section 7.Furthermore, the failure analysis depicts that the initialmetric measurements are unable to quantify the DCNrobustness appropriately (see Table 6 and Section 7.3).Therefore, we propose deterioration metric, a procedure forthe quantification of the DCN robustness based on thepercentage change in various graph metrics.
Deterioration M , for any metric M can be calculated asthe difference between the metric value for the wholenetwork M0, and the average of the metric values at variousfailure percentages Mi, divided by M0.
M ¼1
M0
Pni¼1 Mi
n�M0
� ���������; ð27Þ
where Mi is measurement of the metric M at i percent of thenodes failure, and M0 is the metric value for the whole ofthe network (without failure). To demonstrate that ourproposed metric is able to quantify network robustness, wecompute M for:
1. six graph metrics namely:
a. cluster size,b. average shortest-path length,c. nodal degree,d. algebraic connectivity,e. symmetry ratio, andf. spectral radius,
2. for the random, targeted, and real failures, takinginto the account 1 to 6 percent of the nodes failure.
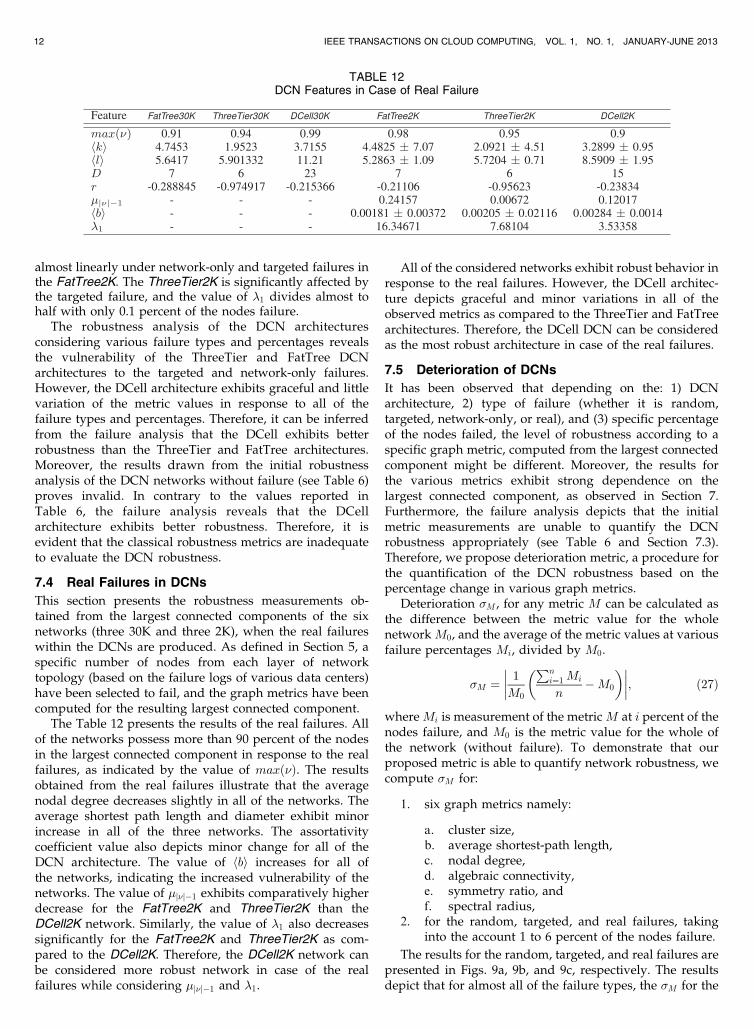
The results for the random, targeted, and real failures arepresented in Figs. 9a, 9b, and 9c, respectively. The resultsdepict that for almost all of the failure types, the M for the
12 IEEE TRANSACTIONS ON CLOUD COMPUTING, VOL. 1, NO. 1, JANUARY-JUNE 2013
TABLE 12DCN Features in Case of Real Failure
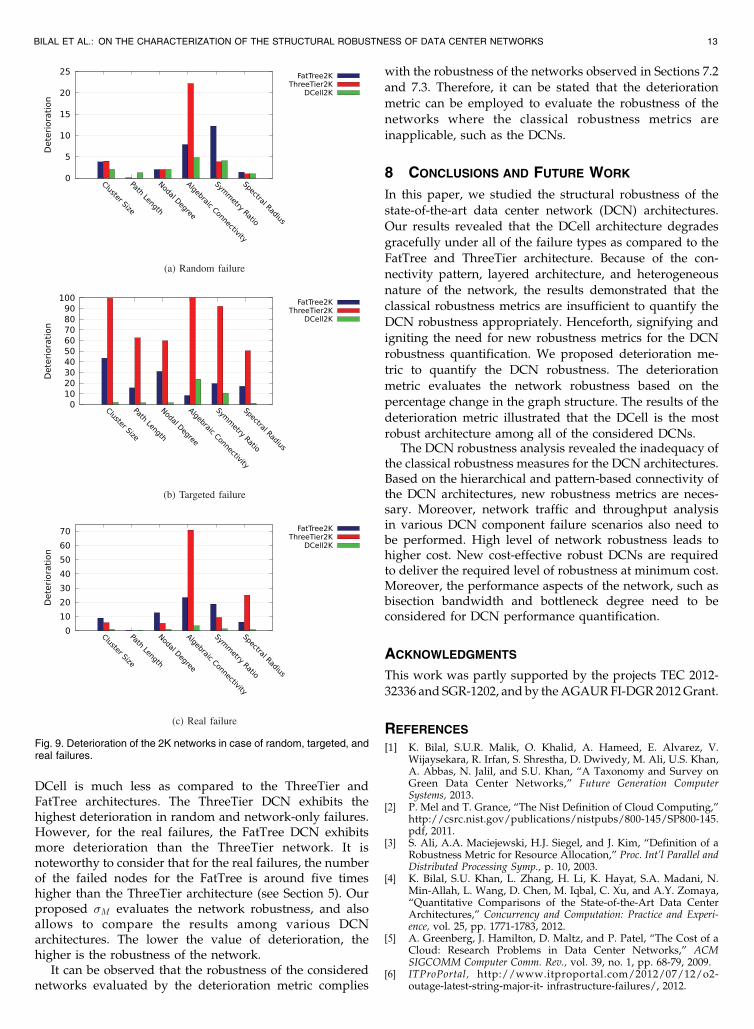
DCell is much less as compared to the ThreeTier andFatTree architectures. The ThreeTier DCN exhibits thehighest deterioration in random and network-only failures.However, for the real failures, the FatTree DCN exhibitsmore deterioration than the ThreeTier network. It isnoteworthy to consider that for the real failures, the numberof the failed nodes for the FatTree is around five timeshigher than the ThreeTier architecture (see Section 5). Ourproposed M evaluates the network robustness, and alsoallows to compare the results among various DCNarchitectures. The lower the value of deterioration, thehigher is the robustness of the network.
It can be observed that the robustness of the considerednetworks evaluated by the deterioration metric complies
with the robustness of the networks observed in Sections 7.2
and 7.3. Therefore, it can be stated that the deterioration
metric can be employed to evaluate the robustness of the
networks where the classical robustness metrics are
inapplicable, such as the DCNs.
8 CONCLUSIONS AND FUTURE WORK
In this paper, we studied the structural robustness of the
state-of-the-art data center network (DCN) architectures.
Our results revealed that the DCell architecture degrades
gracefully under all of the failure types as compared to the
FatTree and ThreeTier architecture. Because of the con-
nectivity pattern, layered architecture, and heterogeneous
nature of the network, the results demonstrated that the
classical robustness metrics are insufficient to quantify the
DCN robustness appropriately. Henceforth, signifying and
igniting the need for new robustness metrics for the DCN
robustness quantification. We proposed deterioration me-
tric to quantify the DCN robustness. The deterioration
metric evaluates the network robustness based on the
percentage change in the graph structure. The results of the
deterioration metric illustrated that the DCell is the most
robust architecture among all of the considered DCNs.The DCN robustness analysis revealed the inadequacy of
the classical robustness measures for the DCN architectures.Based on the hierarchical and pattern-based connectivity ofthe DCN architectures, new robustness metrics are neces-sary. Moreover, network traffic and throughput analysisin various DCN component failure scenarios also need tobe performed. High level of network robustness leads tohigher cost. New cost-effective robust DCNs are requiredto deliver the required level of robustness at minimum cost.Moreover, the performance aspects of the network, such asbisection bandwidth and bottleneck degree need to beconsidered for DCN performance quantification.
ACKNOWLEDGMENTS
This work was partly supported by the projects TEC 2012-
32336 and SGR-1202, and by the AGAUR FI-DGR 2012 Grant.
REFERENCES
[1] K. Bilal, S.U.R. Malik, O. Khalid, A. Hameed, E. Alvarez, V.Wijaysekara, R. Irfan, S. Shrestha, D. Dwivedy, M. Ali, U.S. Khan,A. Abbas, N. Jalil, and S.U. Khan, “A Taxonomy and Survey onGreen Data Center Networks,” Future Generation ComputerSystems, 2013.
[2] P. Mel and T. Grance, “The Nist Definition of Cloud Computing,”http://csrc.nist.gov/publications/nistpubs/800-145/SP800-145.pdf, 2011.
[3] S. Ali, A.A. Maciejewski, H.J. Siegel, and J. Kim, “Definition of aRobustness Metric for Resource Allocation,” Proc. Int’l Parallel andDistributed Processing Symp., p. 10, 2003.
[4] K. Bilal, S.U. Khan, L. Zhang, H. Li, K. Hayat, S.A. Madani, N.Min-Allah, L. Wang, D. Chen, M. Iqbal, C. Xu, and A.Y. Zomaya,“Quantitative Comparisons of the State-of-the-Art Data CenterArchitectures,” Concurrency and Computation: Practice and Experi-ence, vol. 25, pp. 1771-1783, 2012.
[5] A. Greenberg, J. Hamilton, D. Maltz, and P. Patel, “The Cost of aCloud: Research Problems in Data Center Networks,” ACMSIGCOMM Computer Comm. Rev., vol. 39, no. 1, pp. 68-79, 2009.
[6] ITProPortal, http://www.itproportal.com/2012/07/12/o2-outage-latest-string-major-it- infrastructure-failures/, 2012.
BILAL ET AL.: ON THE CHARACTERIZATION OF THE STRUCTURAL ROBUSTNESS OF DATA CENTER NETWORKS 13
Fig. 9. Deterioration of the 2K networks in case of random, targeted, andreal failures.
[7] M. Manzano, E. Calle, and D. Harle, “Quantitative and QualitativeNetwork Robustness Analysis under Different Multiple FailureScenarios,” Proc. Third Int’l Workshop Reliable Networks Design andModeling (RNDM ’11), pp. 1-7, 2011.
[8] A. Sydney, C. Scoglio, P. Schumm, and R.E. Kooij, “Elasticity:Topological Characterization of Robustness in Complex Net-works,” Proc. Third Int’l Conf. Bio-Inspired Models of Network,pp. 19:1-19:8, 2008.
[9] A.H. Dekker and B.D. Colbert, “Network Robustness andGraph Topology,” Proc. 27th Australasian Conf. Computer Science,pp. 359-368, 2004.
[10] J. Dong and S. Horvath, “Understanding Network Concepts inModules,” BMC Systems Biology, vol. 1, no. 1, pp. 1-24, 2007.
[11] A.H. Dekker and B.D. Colbert, “The Symmetry Ratio of aNetwork,” Proc. Australasian Symp. Theory of Computing, pp. 13-20, 2005.
[12] C. Shannon and D. Moore, “The Spread of the Witty Worm,” IEEESecurity and Privacy, vol. 2, no. 4, pp. 46-50, July 2004.
[13] P. Mahadevan, D. Krioukov, M. Fomenkov, X. Dimitropoulos,K.C. Claffy, and A. Vahdat, “The Internet AS-Level Topology:Three Data Sources and One Definitive Metric,” SIGCOMMComputer Comm. Rev., vol. 36, pp. 17-26, Jan. 2006.
[14] D. Chakrabarti, Y. Wang, C. Wang, J. Leskovec, and C. Faloutsos,“Epidemic Thresholds in Real Networks,” ACM Trans. Informationand System Security, vol. 10, no. 4, pp. 1-26, 2008.
[15] A. Jamakovic and S. Uhlig, “Influence of the Network Structure onRobustness,” Proc. 15th IEEE Int’l Conf. Networks (ICON ’07),pp. 278-283, 2007.
[16] Cisco Data Center Infrastructure 2.5 Design Guide, Cisco, 2010.[17] M. Al-Fares, A. Loukissas, and A. Vahdat, “A Scalable, Commod-
ity Data Center Network Architecture,” ACM SIGCOMM Compu-ter Comm. Rev., vol. 38, no. 4, pp. 63-74, 2008.
[18] C. Guo, H. Wu, K. Tan, L. Shi, Y. Zhang, and S. Lu, “DCell: AScalable and Fault-Tolerant Network Structure for Data Centers,”SIGCOMM Computer Comm. Rev., vol. 38, no. 4, pp. 75-86, Aug.2008.
[19] L. Gyarmati and T.A. Trinh, “Scafida: A Scale-Free NetworkInspired Data Center Architecture,” ACM SIGCOMM ComputerComm. Rev., vol. 40, no. 5, pp. 4-12, 2010.
[20] L. Gyarmati, A. Gulyas, B. Sonkoly, T.A. Trinh, and G. Biczok,“Free-Scaling Your Data Center,” Computer Networks, vol. 57,pp. 1758-1773, 2013.
[21] J. Kim, W.J. Dally, and D. Abts, “Flattened Butterfly: A Cost-Efficient Topology for High-Radix Networks,” ACM SIGARCHComputer Architecture News, vol. 35, no. 2, pp. 126-137, 2007.
[22] D. Li, C. Guo, H. Wu, K. Tan, Y. Zhang, and S. Lu, “FiConn: UsingBackup Port for Server Interconnection in Data Centers,” Proc.IEEE INFOCOM, pp. 2276-2285, 2009.
[23] K. Bilal, S.U. Khan, J. Kolodziej, L. Zhang, K. Hayat, S. Madani, N.Min-Allah, L. Wang, and D. Chen, “A Comparative Study of DataCenter Network Architectures,” Proc. 26th European Conf. Modelingand Simulation, pp. 526-532, May 2012.
[24] M. Kurant and P. Thiran, “Layered Complex Networks,” PhysicalRev. Letters, vol. 96, p. 138701, 2006.
[25] X. Dong, P. Frossard, P. Vandergheynst, and N. Nefedov,“Clustering with Multi-Layer Graphs: A Spectral Perspective,”CoRR, vol. abs/1106.2233, 2011.
[26] C. Clos, “A Study of Non-Blocking Switching Networks,” BellSystem Technical J., vol. 32, no. 2, pp. 406-424, 1953.
[27] S. Neumayer and E. Modiano, “Network Reliability withGeographically Correlated Failures,” Proc. INFOCOM, pp. 1658-1666, 2010.
[28] L.C. Freeman, “A Set of Measures of Centrality Based UponBetweenness,” Sociometry, vol. 40, no. 1, pp. 35-41, 1977.
[29] B. Bollobas, Random Graphs. vol. 73, Cambridge Univ. Press, 2001.[30] P.V. Mieghem, C. Doerr, H. Wang, J.M. Hernandez, D. Hutchison,
M. Karaliopoulos, and R.E. Kooij, “A Framework for ComputingTopological Network Robustness,” 2010.
[31] M. Youssef, R. Kooij, and C. Scoglio, “Viral Conductance:Quantifying the Robustness of Networks with Respect to Spreadof Epidemics,” J. Computer Science, vol. 2, no. 3, pp. 286-298, 2011.
[32] E. Weisstein, http://mathworld.wolfram.com/GraphDiameter.html, 2013.
[33] P. Gill, N. Jain, and N. Nagappan, “Understanding NetworkFailures in Data Centers: Measurement Analysis, and Implica-tions,” Proc. ACM SIGCOMM, 2011.
[34] R. Albert, H. Jeong, and A. Barabasi, “Error and Attack Toleranceof Complex Networks,” Letters to Nature, vol. 406, pp. 378-382,2000.
[35] J. Guillaume, M. Latapy, and C. Magnien, “Comparison ofFailures and Attacks on Random and Scale-free Networks,” Proc.Eight Int’l Conf. Principles of Distributed Systems, 2005.
[36] P. Holme, B. Kim, C. Yoon, and S. Han, “Attack Vulnerability ofComplex Networks,” Physical Rev. E, vol. 65, no. 5, p. 056109, 2002.
[37] M. Manzano, V. Torres-Padrosa, and E. Calle, “Vulnerability ofCore Networks under Different Epidemic Attacks,” Proc. FourthInt’l Workshop Reliable Networks Design and Modeling, 2012.
[38] A. Broder, R. Kumar, F. Maghoul, P. Raghavan, S. Rajagopalan, R.Stata, A. Tomkins, and J. Wiener, “Graph Structure in the Web,”Computer Networks, vol. 33, nos. 1-6, pp. 309-320, 2000.
[39] D. Callaway, M. Newman, S. Strogatz, and D. Watts, “NetworkRobustness and Fragility: Percolation on Random Graphs,”Physical Rev. Letters, vol. 85, no. 25, 2000.
[40] R. Cohen, K. Erez, D. ben Avraham, and S. Havlin, “Resilience ofthe Internet to Random Breakdowns,” Physical Rev. Letters, vol. 85,no. 21, p. 3, 2000.
[41] S.N. Dorogovtsev, J.F.F. Mendes, and A.N. Samukhin, “GiantStrongly Connected Component of Directed Networks,” PhysicalRev. E, vol. 64, no. 2 Pt 2, p. 4, 2001.
[42] M. Newman, S. Strogatz, and D. Watts, “Random Graphs withArbitrary Degree Distributions and their Applications,” PhysicalRev. E, vol. 64, no. 2, p. 19, 2000.
[43] B. Luque and R. Sole, “Phase Transitions in Random Networks:Simple Analytic Determination of Critical Points,” Physical Rev. E,vol. 55, no. 1, pp. 257-260, 1997.
Kashif Bilal is working toward the PhD degree in electrical andcomputer engineering at the North Dakota State University. His researchinterests include data center networks, distributed computing, andenergy efficiency. He is a student member of the IEEE.
Marc Manzano is currently working toward the PhD degree at theUniversity of Girona. His main research interests include the modelingand analysis of complex networks, the robustness of such networksunder multiple failure scenarios.
Samee U. Khan is an assistant professor at the North Dakota StateUniversity. His research interest include encompasses topics, such assustainable computing, social networking, and reliability. He haspublished more than 200 papers. He is a senior member of IEEE, anda fellow of IET and BCS.
Eusebi Calle is an associate professor at the University of Girona(UdG). He is a member of the research and teaching staff of theBroadband Communications and Distributed System Group at the UdG,where he develops his research in GMPLS fault management, routing,and network science.
Keqin Li is an SUNY distinguished professor. His research interestsinclude mainly in the areas of design and analysis of algorithms, paralleland distributed computing, and computer networking. He has publishedmore than 225 journal articles, book chapters, and research papers inrefereed international conference proceedings. He is a senior memeberof the IEEE.
Albert Y. Zomaya is currently the chair professor of high performancecomputing and networking in the School of Information Technologies,The University of Sydney. He is the author/coauthor of seven books,more than 400 papers, and the editor of nine books and 11 conferenceproceedings. He is a fellow of IEEE, IET, and AAAS.
. For more information on this or any other computing topic,please visit our Digital Library at www.computer.org/publications/dlib.
14 IEEE TRANSACTIONS ON CLOUD COMPUTING, VOL. 1, NO. 1, JANUARY-JUNE 2013