idescat. figures of catalonia 2017 · macromagnitudes 2015 catalonia spain eu-28 gross domestic...
TRANSCRIPT
PAPER ECOLÒGIC
201720170172017217201720
20172017017201721720172072017201
20172017017201721720172072017201
20172017017201721720172072017201
20172017017201721720172072017201
20172017017201721720172072017201
20172017017201721720172072017201
20172017017201721720172072017201
20172017017201721720172072017201
20172017017201721720172072017201
20172017017201721720172072017201
1720172072017201
201720170172017217201720
201720170172017217201720
201720170172017217201720
201720170172017217201720
201720170172017217201720
201720170172017217201720
201720170172017217201720
20172017017201721720172072017201
20172017017201721720172072017201
20172017017201721720172072017201
20172017017201721720172072017201
20172017017201721720172072017201
20172017017201721720172072017201
20172017017201721720172072017201
20172017017201721720172072017201
20172017017201721720172072017201
20172017017201721720172072017201
20172017017201721720172072017201
20172017017201721720172072017201
20172017017201721720172072017201
20172017017201721720172072017201
20172017017201721720172072017201
20172017017201721720172072017201
20172017017201721720172072017201
1720172072017201
20172017017201721720172072017201
20172017017201721720172072017201
20172017017201721720172072017201
20172017017201721720172072017201
20172017017201721720172072017201
20172017017201721720172072017201
20172017
1720172072017201
20172017
1720172072017201
20172017017201721720172072017201
20172017017201721720172072017201
20172017017201721720172072017201
20172017017201721720172072017201
20172017017201721720172072017201
017201721720172072017201
017201721720172072017201
20172017017201721720172072017201
20172017017201721720172072017201
20172017017201721720172072017201
20172017017201721720172072017201
20172017017201721720172072017201
20172017017201721720172072017201
20172017017201721720172072017201
20172017017201721720172072017201
20172017017201721720172072017201
20172017017201721720172072017201
20172017017201721720172072017201
20172017017201721720172072017201
2017201701720172
72017201
2017201701720172
72017201
20172017017201721720172072017201
20172017017201721720172072017201
20172017017201721720172072017201
20172017017201721720172072017201
20172017017201721720172072017201
20172017017201721720172072017201
20172017017201721720172072017201
20172017017201721720172072017201
20172017017201721720172072017201
20172017017201721720172072017201
20172017017201721720172072017201
20172017017201721720172072017201
20172017017201721720172072017201
20172017017201721720172072017201
20172017017201721720172072017201
20172017017201721720172072017201
20172017017201721720172072017201
20172017017201721720172072017201
20172017017201721720172072017201
20172017017201721720172072017201
20172017017201721720172072017201
20172017017201721720172072017201
20172017017201721720172072017201
1720172072017201
1720172072017201
1720172072017201
1720172072017201
1720172072017201
1720172072017201
1720172072017201
Generalitat de CatalunyaGovernment of Catalonia
www.idescat.cat
201720170172017217201720
201720170172017217201720
201720170172017217201720
201720170172017217201720
20172017017201721720172072017201
201720170172017217201720
20172017017201721720172072017201
20172017017201721720172072017201
72017201 72017201
201720170172017217201720
201720170172017217201720
201720170172017217201720
201720170172017217201720
20172017017201721720172072017201
2017201701720172
2017201701720172
20172017017201721720172072017201
720172017201720172017201
2017201701720172
2017201701720172
017201721720172072017201
017201721720172072017201
017201721720172072017201
017201721720172072017201
201720170172017217201720
2017201720172017
20172017017201721720172072017201
20172017017201721720172072017201
017201721720172072017201
1720172072017201
7201720172017201
Figures ofCatalonia
% %5 4 3 2 1 0 0 1 2 3 4 5
0 - 4
5 - 9
10 - 14
15 - 19
20 - 24
25 - 29
30 - 34
35 - 39
40 - 44
45 - 49
50 - 54
55 - 59
60 - 64
65 - 69
70 - 74
75 - 79
80 - 84
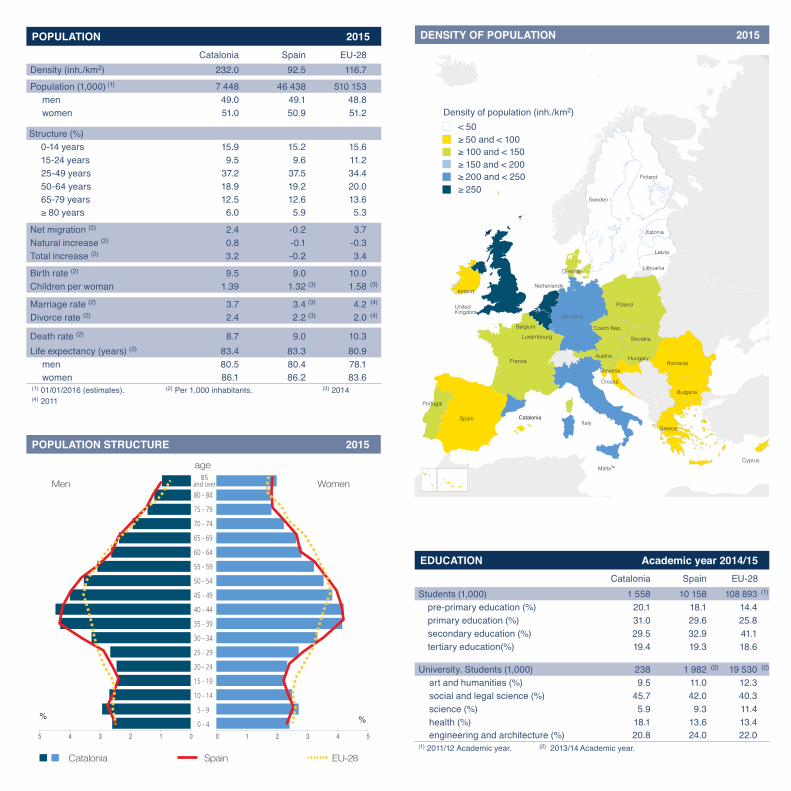
Catalonia Spain EU-28
Men
age
Women85
and over
DENSITY OF POPULATION 2015
POPULATION STRUCTURE 2015
Belgium
Slovakia
France
Spain Catalonia
Portugal
Ireland
Poland
Lithuania
Latvia
Estonia
Finland
Sweden
Denmark
Czech Rep.
Austria Hungary
SloveniaRomania
Greece
Bulgaria
Luxembourg
Cyprus
Italy
Germany
Malta
UnitedKingdom
Netherlands
Croatia
POPULATION 2015Catalonia Spain EU-28
Density (inh./km2) 232.0 92.5 116.7
Population (1,000) (1) 7 448 46 438 510 153
men 49.0 49.1 48.8women 51.0 50.9 51.2
Structure (%)
0-14 years 15.9 15.2 15.6
15-24 years 9.5 9.6 11.2
25-49 years 37.2 37.5 34.4
50-64 years 18.9 19.2 20.0
65-79 years 12.5 12.6 13.6
≥ 80 years 6.0 5.9 5.3
Net migration (2) 2.4 -0.2 3.7
Natural increase (2) 0.8 -0.1 -0.3
Total increase (2) 3.2 -0.2 3.4
Birth rate (2) 9.5 9.0 10.0
Children per woman 1.39 1.32 (3) 1.58 (3)
Marriage rate (2) 3.7 3.4 (3) 4.2 (4)
Divorce rate (2) 2.4 2.2 (3) 2.0 (4)
Death rate (2) 8.7 9.0 10.3
Life expectancy (years) (3) 83.4 83.3 80.9
men 80.5 80.4 78.1
women 86.1 86.2 83.6
(1) 01/01/2016 (estimates). (2) Per 1,000 inhabitants. (3) 2014(4) 2011
EDUCATION Academic year 2014/15 Catalonia Spain EU-28
Students (1,000) 1 558 10 158 108 893 (1)
pre-primary education (%) 20.1 18.1 14.4primary education (%) 31.0 29.6 25.8secondary education (%) 29.5 32.9 41.1tertiary education(%) 19.4 19.3 18.6
University. Students (1,000) 238 1 982 (2) 19 530 (2)
art and humanities (%) 9.5 11.0 12.3social and legal science (%) 45.7 42.0 40.3science (%) 5.9 9.3 11.4health (%) 18.1 13.6 13.4engineering and architecture (%) 20.8 24.0 22.0
(1) 2011/12 Academic year. (2) 2013/14 Academic year.
Density of population (inh./km2)< 50≥ 50 and < 100≥ 100 and < 150≥ 150 and < 200≥ 200 and < 250≥ 250
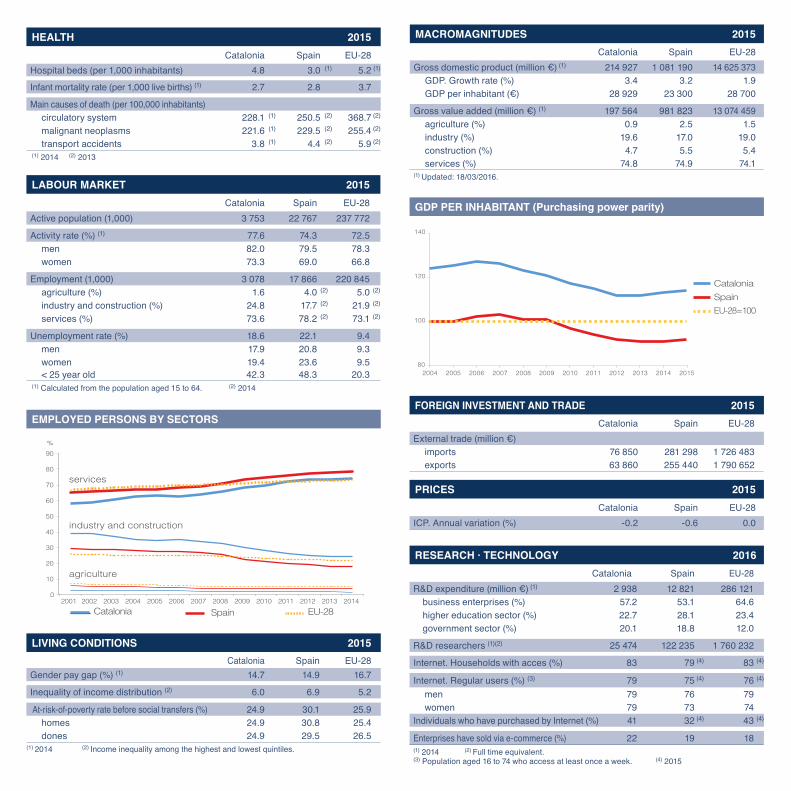
FOREIGN INVESTMENT AND TRADE 2015Catalonia Spain EU-28
External trade (million €)imports 76 850 281 298 1 726 483exports 63 860 255 440 1 790 652
PRICES 2015Catalonia Spain EU-28
ICP. Annual variation (%) -0.2 -0.6 0.0
RESEARCH · TECHNOLOGY 2016Catalonia Spain EU-28
R&D expenditure (million €) (1) 2 938 12 821 286 121business enterprises (%) 57.2 53.1 64.6higher education sector (%) 22.7 28.1 23.4government sector (%) 20.1 18.8 12.0
R&D researchers (1)(2) 25 474 122 235 1 760 232
Internet. Households with acces (%) 83 79 (4) 83 (4)
Internet. Regular users (%) (3) 79 75 (4) 76 (4)
men 79 76 79women 79 73 74
Individuals who have purchased by Internet (%) 41 32 (4) 43 (4)
Enterprises have sold via e-commerce (%) 22 19 18(1) 2014 (2) Full time equivalent. (3) Population aged 16 to 74 who access at least once a week. (4) 2015
%
0
10
20
30
40
50
60
70
80
90
2001 2002 2003 2004 2005 2006 2007 2008 2009 2010 2011 2012 2013 2014
services
industry and construction
agriculture
Catalonia Spain EU-28
EMPLOYED PERSONS BY SECTORS
GDP PER INHABITANT (Purchasing power parity)
MACROMAGNITUDES 2015Catalonia Spain EU-28
Gross domestic product (million €) (1) 214 927 1 081 190 14 625 373GDP. Growth rate (%) 3.4 3.2 1.9GDP per inhabitant (€) 28 929 23 300 28 700
Gross value added (million €) (1) 197 564 981 823 13 074 459agriculture (%) 0.9 2.5 1.5industry (%) 19.6 17.0 19.0construction (%) 4.7 5.5 5.4services (%) 74.8 74.9 74.1
(1) Updated: 18/03/2016.LABOUR MARKET 2015
Catalonia Spain EU-28Active population (1,000) 3 753 22 767 237 772
Activity rate (%) (1) 77.6 74.3 72.5men 82.0 79.5 78.3women 73.3 69.0 66.8
Employment (1,000) 3 078 17 866 220 845agriculture (%) 1.6 4.0 (2) 5.0 (2)
industry and construction (%) 24.8 17.7 (2) 21.9 (2)
services (%) 73.6 78.2 (2) 73.1 (2)
Unemployment rate (%) 18.6 22.1 9.4men 17.9 20.8 9.3women 19.4 23.6 9.5< 25 year old 42.3 48.3 20.3
(1) Calculated from the population aged 15 to 64. (2) 2014
LIVING CONDITIONS 2015Catalonia Spain EU-28
Gender pay gap (%) (1) 14.7 14.9 16.7
Inequality of income distribution (2) 6.0 6.9 5.2
At-risk-of-poverty rate before social transfers (%) 24.9 30.1 25.9homes 24.9 30.8 25.4dones 24.9 29.5 26.5
(1) 2014 (2) Income inequality among the highest and lowest quintiles.
HEALTH 2015Catalonia Spain EU-28
Hospital beds (per 1,000 inhabitants) 4.8 3.0 (1) 5.2 (1)
Infant mortality rate (per 1,000 live births) (1) 2.7 2.8 3.7
Main causes of death (per 100,000 inhabitants)circulatory system 228.1 (1) 250.5 (2) 368.7 (2)
malignant neoplasms 221.6 (1) 229.5 (2) 255.4 (2)
transport accidents 3.8 (1) 4.4 (2) 5.9 (2)
(1) 2014 (2) 2013
80
100
120
140
2004 2005 2006 2007 2008 2009 2010 2011 2012 2013 2014 2015
CataloniaSpainEU-28=100
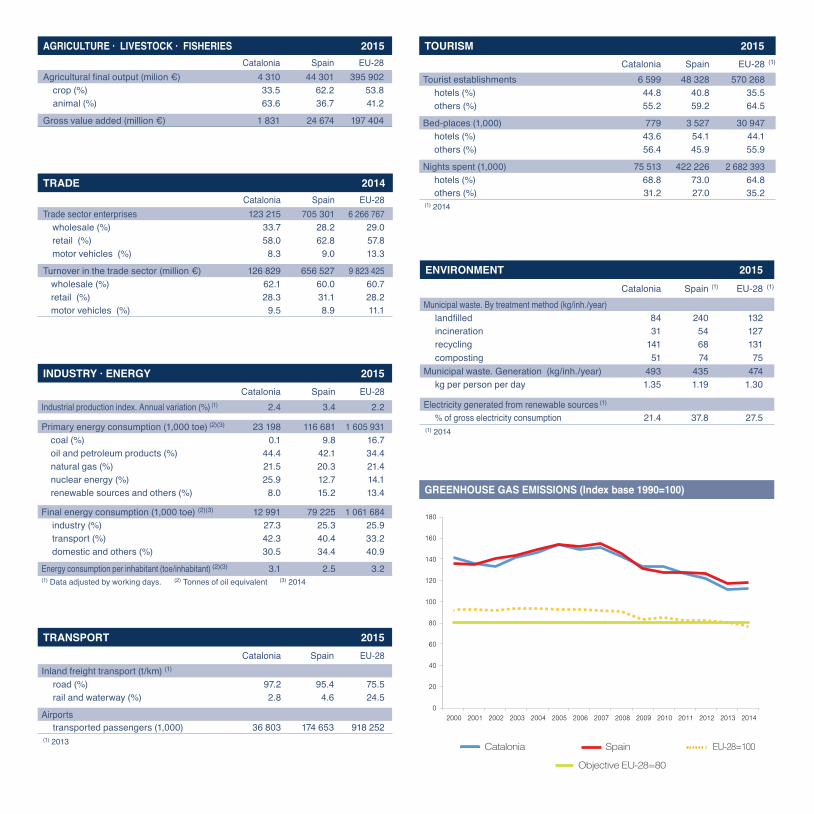
ENVIRONMENT 2015Catalonia Spain (1) EU-28 (1)
Municipal waste. By treatment method (kg/inh./year) 84 240 132
incineration 31 54 127recycling 141 68 131composting 51 74 75
Municipal waste. Generation (kg/inh./year) 493 435 474kg per person per day 1.35 1.19 1.30
Electricity generated from renewable sources (1)
% of gross electricity consumption 21.4 37.8 27.5(1) 2014
TOURISM 2015Catalonia Spain EU-28 (1)
Tourist establishments 6 599 48 328 570 268hotels (%) 44.8 40.8 35.5others (%) 55.2 59.2 64.5
Bed-places (1,000) 779 3 527 30 947hotels (%) 43.6 54.1 44.1others (%) 56.4 45.9 55.9
Nights spent (1,000) 75 513 422 226 2 682 393hotels (%) 68.8 73.0 64.8others (%) 31.2 27.0 35.2
(1) 2014
TRANSPORT 2015Catalonia Spain EU-28
Inland freight transport (t/km) (1)
road (%) 97.2 95.4 75.5rail and waterway (%) 2.8 4.6 24.5
Airportstransported passengers (1,000) 36 803 174 653 918 252
(1) 2013
AGRICULTURE · LIVESTOCK · FISHERIES 2015Catalonia Spain EU-28
4 310 44 301 395 902crop (%) 33.5 62.2 53.8animal (%) 63.6 36.7 41.2
Gross value added (million €) 1 831 24 674 197 404
TRADE 2014Catalonia Spain EU-28
Trade sector enterprises 123 215 705 301 6 266 767wholesale (%) 33.7 28.2 29.0retail (%) 58.0 62.8 57.8motor vehicles (%) 8.3 9.0 13.3
Turnover in the trade sector (million €) 126 829 656 527 9 823 425wholesale (%) 62.1 60.0 60.7retail (%) 28.3 31.1 28.2motor vehicles (%) 9.5 8.9 11.1
INDUSTRY · ENERGY 2015Catalonia Spain EU-28
Industrial production index. Annual variation (%) (1) 2.4 3.4 2.2
Primary energy consumption (1,000 toe) (2)(3) 23 198 116 681 1 605 931coal (%) 0.1 9.8 16.7oil and petroleum products (%) 44.4 42.1 34.4natural gas (%) 21.5 20.3 21.4nuclear energy (%) 25.9 12.7 14.1renewable sources and others (%) 8.0 15.2 13.4
Final energy consumption (1,000 toe) (2)(3) 12 991 79 225 1 061 684industry (%) 27.3 25.3 25.9transport (%) 42.3 40.4 33.2domestic and others (%) 30.5 34.4 40.9
Energy consumption per inhabitant (toe/inhabitant) (2)(3) 3.1 2.5 3.2(1) Data adjusted by working days. (2) Tonnes of oil equivalent (3) 2014
0
20
40
60
80
100
120
140
160
180
2000 2001 2002 2003 2004 2005 2006 2007 2008 2009 2010 2011 2012 2013 2014
Objective EU-28=80
Catalonia Spain EU-28=100
GREENHOUSE GAS EMISSIONS (Index base 1990=100)
PAPER ECOLÒGIC
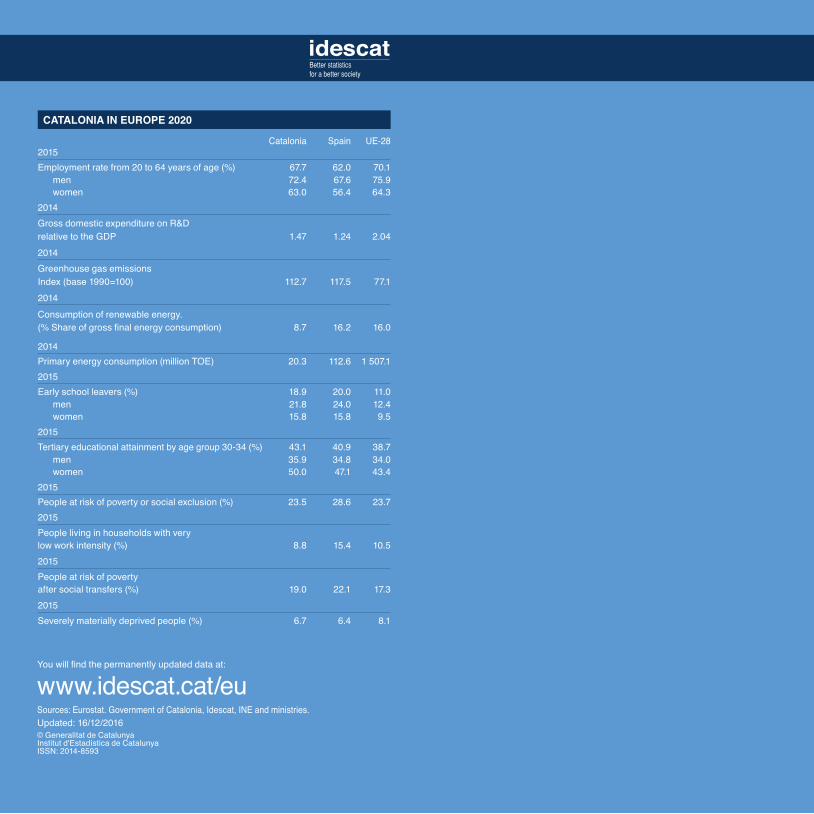
CATALONIA IN EUROPE 2020
Catalonia Spain UE-282015Employment rate from 20 to 64 years of age (%) 67.7 62.0 70.1
men 72.4 67.6 75.9women 63.0 56.4 64.3
2014Gross domestic expenditure on R&D relative to the GDP 1.47 1.24 2.042014Greenhouse gas emissionsIndex (base 1990=100) 112.7 117.5 77.12014Consumption of renewable energy.(% Share of gross final energy consumption) 8.7 16.2 16.0
2014Primary energy consumption (million TOE) 20.3 112.6 1 507.12015Early school leavers (%) 18.9 20.0 11.0
men 21.8 24.0 12.4women 15.8 15.8 9.5
2015Tertiary educational attainment by age group 30-34 (%) 43.1 40.9 38.7
men 35.9 34.8 34.0women 50.0 47.1 43.4
2015People at risk of poverty or social exclusion (%) 23.5 28.6 23.72015People living in households with verylow work intensity (%) 8.8 15.4 10.52015People at risk of poverty after social transfers (%) 19.0 22.1 17.32015Severely materially deprived people (%) 6.7 6.4 8.1
idescatBetter statisticsfor a better society
You will find the permanently updated data at: www.idescat.cat/euSources: Eurostat. Government of Catalonia, Idescat, INE and ministries.Updated: 16/12/2016© Generalitat de CatalunyaInstitut d'Estadística de CatalunyaISSN: 2014-8593