identifying, categorizing, and evaluating health … · identifying, categorizing, and evaluating...
TRANSCRIPT
Final Report Identifying, Categorizing, and Evaluating Health Care Efficiency Measures Prepared for: Agency for Healthcare Research and Quality U.S. Department of Health and Human Services 540 Gaither Road Rockville, MD 20850 www.ahrq.gov Contract No. 282-00-0005-21 Prepared by: Southern California Evidence-based Practice Center—RAND Corporation, Santa Monica, CA Principal Investigator: Elizabeth A. McGlynn, Ph.D. Evidence-based Practice Center Director: Paul G. Shekelle, M.D., Ph.D.
Task Order Coordinator: Susan Chen, B.A. Economists: Dana Goldman, Ph.D. John Romley, Ph.D. Content Experts: Peter Hussey, Ph.D. Han de Vries, M.Sc., M.Phil. Margaret Wang, Ph.D.
Programmer: Martha Timmer, M.S. Database Manager: Jason Carter, B.A. Staff Assistant: Carlo Tringale, B.A Librarian: Roberta Shanman, M.S.
AHRQ Publication No. 08-0030 April 2008
This report is based on research conducted by the Southern California Evidence-based Practice Center—RAND Corporation under contract to the Agency for Healthcare Research and Quality (AHRQ), Rockville, MD (Contract No. 282-00-0005-21). The findings and conclusions in this document are those of the author(s), who are responsible for its content, and do not necessarily represent the views of AHRQ. No statement in this report should be construed as an official position of AHRQ or of the U.S. Department of Health and Human Services. In addition, although the document has been reviewed for proper grammar and syntax, any editorial errors are the responsibility of the author(s). The information in this report is intended to help clinicians, employers, policymakers, and others make informed decisions about the provision of health care services. This report is intended as a reference and not as a substitute for clinical judgment. This report may be used, in whole or in part, as the basis for the development of clinical practice guidelines and other quality enhancement tools, or as a basis for reimbursement and coverage policies. AHRQ or U.S. Department of Health and Human Services endorsement of such derivative products may not be stated or implied.
ii
This document is in the public domain and may be used and reprinted without permission except those copyrighted materials noted for which further reproduction is prohibited without the specific permission of copyright holders. Suggested Citation: McGlynn, EA. Identifying, Categorizing, and Evaluating Health Care Efficiency Measures. Final Report (prepared by the Southern California Evidence-based Practice Center—RAND Corporation, under Contract No. 282-00-0005-21). AHRQ Publication No. 08-0030. Rockville, MD: Agency for Healthcare Research and Quality. April 2008.
None of the investigators has any affiliations or financial involvement that conflicts with the material presented in this report.
iii
Preface
By now it has become a truism to say that you can only improve those things that you can measure. In the world of quality, we have made significant progress in measurement. For many years, researchers, stakeholders, payers, and quality improvement and accrediting organizations have been laboring to get past the methodological, philosophical, and “small-p” political issues hampering common quality metrics. While there is much work to be done, we have made a lot of progress.
But when it comes to measuring efficiency—one of the six domains of quality identified by the Institute of Medicine—we have seen much less light than heat. There is a lot of recent activity, but little agreement about how to measure efficiency, much less how to improve it. We commissioned this report, modeled after AHRQ’s Evidence Review series, as a comprehensive and impartial review of the evidence on efficiency measurement. Our goal was to identify, analyze, and classify current definitions, lay out a linguistic roadmap to help illuminate discussions, and identify some next steps. To accomplish this task, we enlisted a multidisciplinary team at RAND, supported by a very diverse and active Technical Advisory Group and countless other reviewers representing all stakeholder groups.
The Executive Summary, report, and appendices which follow lay out the approach, methodology, and findings. In this brief preface, we would like to highlight four of the most significant findings, and in particular to identify the implications for present use and future work: How can the findings from this report help improve our use and communication about current measures? What do they suggest about ways to improve the measurement of efficiency in the future?
Findings, Lessons, and Implications
The Multiplicity of Perspectives on Efficiency
One major finding is that definitions of efficiency differ greatly depending on perspective, i.e., one’s role as a payer, provider, consumer, etc.—proof of the adage that “where you stand depends on where you sit.” In most cases, individuals and firms will define efficiency as a relationship between what it costs them and what service or outcome they receive, rather than as a trait inherent in the provider. This difference in perspectives has important implications for transparency: Users of data on efficiency may not share the same perspective as those who generated the data. To facilitate communication under these circumstances, it would seem best to refer directly to the specific measure—cost per discharge, cost per episode, etc.—rather than using the term “efficiency” at all, and to be clear about whose costs are included in the calculation. The Gap Between Peer-Reviewed Measures and Those in Use
A second finding is that there is almost no cross-over between the measures and methodologies in the fairly extensive peer-reviewed literature and the measures and methodologies in use. This finding presents a clear challenge to an agency such as AHRQ
iv
whose primary focus is facilitating creation and use of evidence-based measures, data, and information to improve care. An important priority for us in the next year will be finding ways to close the gap between research and practice in this particular domain. The Silence of Quality in the Measures
A third finding of the report is that virtually none of efficiency measures, whether in the peer-reviewed literature, the grey literature, or the vendor products, includes the quality dimension. Quality is “assumed,” or is otherwise absent. This absence of a quality component, in fact, has led some such as the AQA to recommend using the word “cost” rather than efficiency to describe such measures. Regardless of whether one calls these measures cost (per the AQA definition) or efficiency (per the definition in this report), the implications are the same: When using these measures, it would seem most productive to pair each with its parallel quality measure. If there is no quality measure, and there is no quality dimension to the efficiency measure, it would be helpful to be clear and direct about this as well. The Dearth of Validation for all Measures
A fourth finding is that the measures developed by researchers and those in common use do have one significant feature in common: a lack of validation or evaluation. This finding points to a clear need for more validation and evaluation of measures and their use.
Next Steps
The widespread availability of credible and clear information on cost and efficiency is a critical component of transparency, and is also essential for improving efficiency within and across health care institutions and providers. A critical first step will be achieving clear and credible metrics. We hope this report helps establish some of the groundwork for this enterprise, and we look forward to working with all stakeholders on next steps. In the meantime, we also welcome your comments, suggestions, and input. They may be sent by mail to the Task Order Officer named below at: Agency for Healthcare Research and Quality, 540 Gaither Road, Rockville, MD 20850, or by e-mail to [email protected]. Carolyn M. Clancy, M.D. Director Agency for Healthcare Research and Quality Herbert S. Wong, Ph.D. Task Order Officer Center for Delivery, Organization and
Markets
Irene Fraser, Ph.D. Director Center for Delivery, Organization and
Markets Agency for Healthcare Research and Quality
Agency for Healthcare Research and Quality
v
Contents Executive Summary .........................................................................................................................1 Final Report..................................................................................................................................11 Chapter 1. Introduction ................................................................................................................13 Chapter 2. Methods.......................................................................................................................15
Analytic Framework—A Typology of Efficiency...................................................................15 Perspective .........................................................................................................................15 Outputs...............................................................................................................................17 Inputs..................................................................................................................................19 An Example .......................................................................................................................19
Applying the Typology............................................................................................................21 Cost per Episode ................................................................................................................22 Cost per Discharge.............................................................................................................23 Cost per Covered Life........................................................................................................23 Cost per Health Improvement............................................................................................23 Labor Utilization................................................................................................................23 Productivity........................................................................................................................24 Generic Prescribing Rate ...................................................................................................24
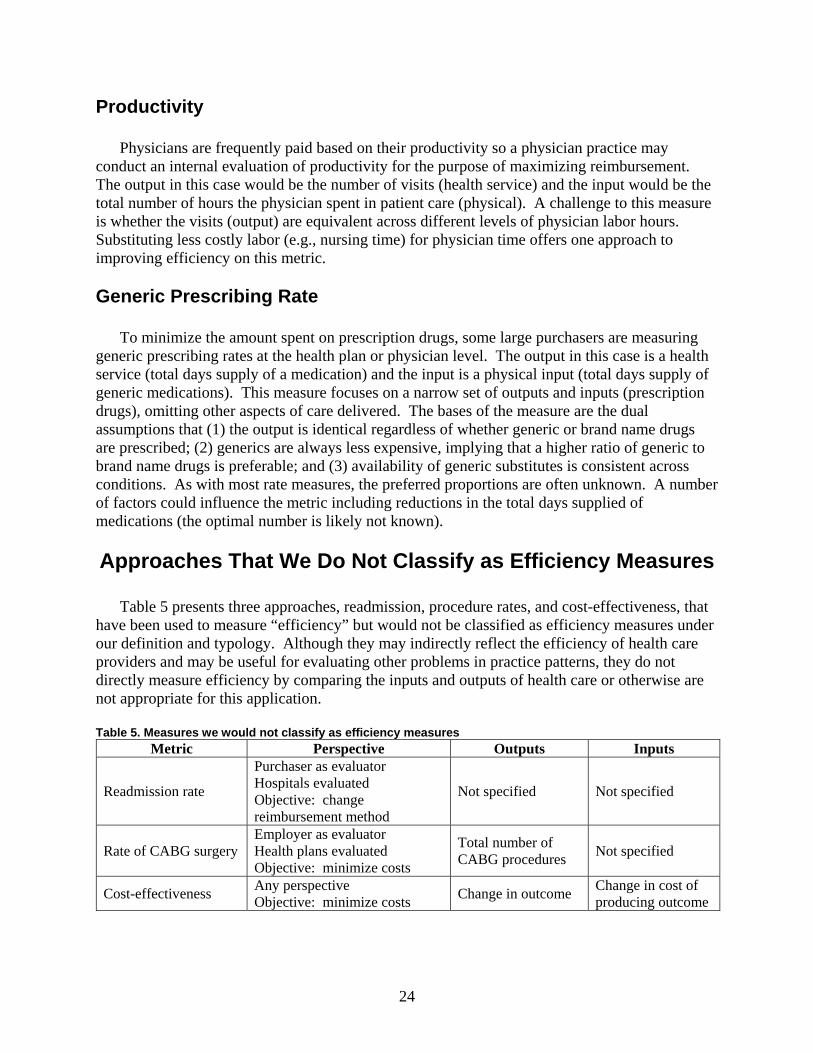
Approaches That We Do Not Classify as Efficiency Measures ..............................................24 Readmissions .....................................................................................................................25 Procedure Rates .................................................................................................................25 Cost-Effectiveness .............................................................................................................25
Economic Efficiency for Society as a Whole ..........................................................................25 Evidence Sources and Searches ...............................................................................................27
Literature Searches/Search Strategy ..................................................................................27 Vendors and Stakeholder Interviews .................................................................................27
Technical Expert Panel ............................................................................................................28 Title Screening, Article Review, and Selection of Individual Studies ....................................28
Study Selection ..................................................................................................................28 Data Abstraction ................................................................................................................29
Peer Review Process ................................................................................................................29 Chapter 3. Results .........................................................................................................................31
Literature Flow.........................................................................................................................31 Overview of Article Abstraction..............................................................................................31
Outputs...............................................................................................................................33 Inputs..................................................................................................................................33 Methodology......................................................................................................................33 Hospital Efficiency ............................................................................................................35 Physician Efficiency ..........................................................................................................36 Health Plans .......................................................................................................................37
vi
Nurses ................................................................................................................................38 Other Categories ................................................................................................................38
Additional Observations on Measurement Methods................................................................39 Data Sources ......................................................................................................................39 Sample Size........................................................................................................................39 Explanatory Variables........................................................................................................39 Time Frame........................................................................................................................40 Sensitivity Analysis and Testing of Reliability and Validity.............................................40
Overview of Vendors and Stakeholder Interviews ..................................................................40 Efficiency Measures Identified Through the Grey Literature Review ....................................41 A Sample of Stakeholders’ Perspectives .................................................................................46
Definition of Efficiency .....................................................................................................46 Measurement-Related Issues .............................................................................................48 Other Issues........................................................................................................................48
Chapter 4. Evaluation of Health Care Efficiency Measures .........................................................53
Important..................................................................................................................................53 Scientifically Sound.................................................................................................................54 Feasible ....................................................................................................................................56 Actionable ................................................................................................................................56 Application of Efficiency Measures ........................................................................................57
Chapter 5. Discussion ...................................................................................................................61
Limitations ...............................................................................................................................61 Publication Bias .................................................................................................................61 Study Quality .....................................................................................................................61
Conclusions..............................................................................................................................61 Future Research .......................................................................................................................62
Filling Gaps in Existing Measures.....................................................................................62 Evaluating and Testing Scientific Soundness ....................................................................62 Evaluating and Improving Feasibility................................................................................62 Making Measures More Actionable...................................................................................63
References and Included Studies ...................................................................................................65 List of Acronyms/Abbreviations....................................................................................................69 Figures Figure 1. Typology of efficiency measures .................................................................................16 Figure 2. Literature flow..............................................................................................................32 Boxes Box 1. Explanation of methods ...............................................................................................34
vii
Tables Table 1. Definitions of efficiency ..............................................................................................13 Table 2. An example of efficiency measures where outputs are identical.................................20 Table 3. An example of efficiency measures where outputs vary .............................................21 Table 4. Some common approaches to efficiency measurement ...............................................22 Table 5. Measures we would not classify as efficiency measures.............................................24 Table 6. Summary of efficiency measures abstracted from the peer-reviewed literature .........33 Table 7. Efficiency measures developed by vendors.................................................................43 Table 8. List of contacted stakeholders......................................................................................47 Table 9. Summary of stakeholder inputs ...................................................................................50 Table 10. Application of efficiency measures .............................................................................59 Appendixes Appendix A: Technical Typology Appendix B: Search Methodology Appendix C: Abstraction Tools Appendix D: Technical Expert Panel and Peer Reviewers Appendix E: Blinded Reviewer Comments Appendix F: List of Excluded Studies Appendix G: Evidence Tables Appendixes for this report are provided electronically at http://www.ahrq.gov/downloads/pub/evidence/pdf/efficiency/efficiency.pdf.

1
Executive Summary
The measurement of health care efficiency has lagged behind the measurement of health care quality. Providers, payers, purchasers, consumers, and regulators all could benefit from more information on value for money in health care. Purchasers, particularly large employers, have been demanding that health plans incorporate economic profiling into their products and information packages. Despite the importance, there has not been a systematic and rigorous process in place to develop and improve efficiency measurement as there has been for other domains of performance. Recognizing the importance of improving efficiency measurement, the Agency for Healthcare Research and Quality (AHRQ) has sponsored this systematic review and analysis of available measures. Our work was designed to reach a wide variety of stakeholders, each of which faces different pressures and values in the selection and application of efficiency measures. Thus, we anticipate that some sections of the report will be less useful to some readers than others. This report should be viewed as the first of several steps that are necessary to create agreement among stakeholders about the adequacy of tools to measure efficiency.
Methods
Typology
Because we found that many stakeholders attach different meanings to the word “efficiency,” we first developed a definition of efficiency. We believe that being explicit about how the term is being used is helpful in advancing the dialogue among stakeholders. In this report, we define efficiency as an attribute of performance that is measured by examining the relationship between a specific product of the health care system (also called an output) and the resources used to create that product (also called inputs). Under our definition, a provider in the health care system (e.g., hospital, physician) would be efficient if it was able to maximize output for a given set of inputs or to minimize inputs used to produce a given output.
Building on this definition, we created a typology of efficiency measures. The purpose of the typology is to make explicit the content and use of a measure of efficiency. Our typology has three levels:
• Perspective: who is evaluating the efficiency of what entity and what is their objective? • Outputs: what type of product is being evaluated? • Inputs: what resources are used to produce the output?
The first tier in the typology, perspective, requires an explicit identification of the entity that
is evaluating efficiency, the entity that is being evaluated, and the objective or rationale for the assessment. We distinguish between four different types of entities:
2
• Health care providers (e.g., physicians, hospitals, nursing homes) that deliver health care services
• Intermediaries (e.g., health plans, employers) who act on behalf of collections of either providers or individuals (and, potentially, their own behalf) but do not directly deliver health care services
• Consumers/patients who use health care services • Society, which encompasses the first three.
Each of these types of entities has different objectives for considering efficiency, has control
over a particular set of resources or inputs, and may seek to deliver or purchase a different set of products. Efficiency for society as a whole, or “social efficiency,” refers to the allocation of available resources; social efficiency is achieved when it is not possible to make a person or group in society better off without making another person or group worse off. The perspective from which efficiency is measured has strong implications for the measurement approach, because what looks efficient from one perspective may look inefficient from another. For example, a physician may produce CT scans efficiently in her office, but the physician may not appear efficient to a health plan if a less expensive diagnostic test could have been substituted in some cases. The intended application of an efficiency measure (e.g., pay-for-performance, quality improvement) offers another way of assessing perspective.
The second tier of the typology identifies the outputs of interest and how those will be measured. We distinguish between two types of outputs: health services (e.g., visits, drugs, admissions) and health outcomes (e.g., preventable deaths, functional status, clinical outcomes such as blood pressure or blood sugar control). The typology addresses the role of quality (or effectiveness) metrics in the assessment of efficiency. A key issue that arises in external evaluations of efficiency is whether the outputs are comparable. Threats to comparability arise when there is (perceived or real) heterogeneity in the content of a single service, the mix of services in a bundle, and the mix of patients seeking or receiving services. Pairing quality measures with efficiency measures is one approach that has been suggested by AQA and others to assess comparability directly.
In this typology, we do not require that the health service outputs be constructed as quality/effectiveness metrics. For example, an efficiency measure could consider the relative cost of a procedure without evaluating whether the use of the procedure was appropriate. Similarly, an efficiency measure could evaluate the relative cost of a hospital stay for a condition without considering whether the admission was preventable or appropriate. However, the typology allows for health service outputs to be defined with reference to quality criteria. That is, the typology is broad enough to include either definition of health services. We deliberately constructed the typology in this way to facilitate dialogue among stakeholders with different perspectives on this issue.
The third tier of the typology identifies the inputs that are used to produce the output of interest. Inputs can be measured as counts by type (e.g., nursing hours, bed days, days supply of drugs) or they can be monetized (real or standardized dollars assigned to each unit). We refer to these, respectively, as physical inputs or financial inputs. The way in which inputs are measured may influence the way the results are used. Efficiency measures that count the amounts of different inputs used to produce an output (physical inputs) help to answer questions about whether the output could be produced faster, with fewer people, less time from people, or fewer supplies. In economic terms, the focus is on whether the output is produced with the minimum
3
amount of each input and is called technical efficiency. Efficiency measures that monetize the inputs (financial inputs) help to answer questions about whether the output could be produced less expensively—whether the total cost of labor, supplies, and other capital could be reduced. A focus on cost minimization corresponds to the economic concept of productive efficiency, which incorporates considerations related to the optimal mix of inputs (e.g., could we substitute nursing labor for physician labor without changing the amount and quality of the output?) and the total cost of inputs.
This typology provides a framework within which stakeholders can have an explicit discussion about the intended use of measures, the choice and measurement of outputs, and the choice and measurement of inputs. Requesting that groups use a standard format, such as that suggested by the typology, allows stakeholders to systematically examine what is being measured and whether the measure (and available data) is appropriate for the purpose. Evidence Sources and Searches
We searched Medline® and EconLit for articles published between 1990 and 2005 describing measures of health care efficiency. Titles, abstracts and articles were reviewed by two independent reviewers, with consensus resolution. We focused on studies reporting efficiency of U.S. health care, and excluded studies focusing on other countries. Data were abstracted onto Evidence Tables and also summarized narratively.
Because we expected some of the most commonly used efficiency measures might not appear in the published literature, we developed a list of organizations that we knew had developed or were considering developing their own efficiency measures. We contacted key people at these organizations in an attempt to collect the information necessary to describe and compare their efficiency measures to others we abstracted from articles.
A Technical Expert Panel (TEP) advised the project staff on the typology and sources of information, and reviewed a draft of this report. The TEP is listed in Appendix D* of this report.
Results
We found little overlap between the peer-reviewed literature that describes the development, testing, and application of efficiency measures and the vendor-based efficiency metrics that are most commonly used. From the perspective of policymakers and purchasers, the published literature provides little guidance for solving current challenges to managing rising health care costs. From the perspective of measurement experts, the vendor-based metrics are largely untested and as such the results may be problematic to interpret accurately. These observations have implications for the recommendations we make at the end of the report regarding future research.
* Appendixes for this report are provided electronically at http://www.ahrq.gov/downloads/pub/evidence/pdf/efficiency/efficiency.pdf.
4
Published Literature
In total, RAND reviewers examined 4,324 titles for the draft version of this report. Of these, 563 articles were retrieved and reviewed. There were 158 articles describing measures of health care efficiency in the United States.
The majority of peer-reviewed literature on health care efficiency has been related to the production of hospital care. Of the 158 priority articles abstracted, 93 articles (59%) measured the efficiency of hospitals. Studies of physician efficiency were second most common (33 articles, 21%), followed by fewer articles on the efficiency of nurses, health plans, other providers, or other entities. None of the abstracted articles reported the efficiency of health care at the national level, although two articles examined efficiency in the Medicare program.
Almost all of the measures abstracted from the articles used health services as outputs. Common health service types used as inputs included inpatient stays, physician visits, and procedures. Only four measures were found that included health outcomes as outputs. In addition, none of the outputs explicitly accounted for the quality of service provided. A small subset of measures attempted to account for quality by including it as an explanatory variable in a regression model in which efficiency was the dependent variable. Some articles also conducted analyses of outcomes separately from analyses of efficiency.
The health care efficiency measures abstracted were divided between measures using physical or financial inputs. There were more articles that used physical inputs than financial inputs. No articles were found containing measures of social efficiency.
Most of the measures abstracted from the peer-reviewed literature used econometric or mathematical programming methodologies for measuring health care efficiency. Two approaches were most common: data envelopment analysis (DEA) and stochastic frontier analysis (SFA). DEA is a non-parametric deterministic approach that solves a linear programming problem in order to define efficient behavior. SFA is a parametric approach that defines efficient behavior by specifying a stochastic (or probabilistic) model of output and maximizing the probability of the observed outputs given the model. These techniques can explicitly account for multiple inputs and multiple outputs. For example, DEA and SFA could be used to measure the efficiency of hospitals that use nursing labor and supplies to produce inpatient stays and ambulatory visits. DEA and SFA differ in a number of respects. DEA makes fewer assumptions than SFA about how inputs are related to outputs. DEA compares the efficiency of an entity to that of its peers (rather than an absolute benchmark) and typically ignores statistical noise in the observed relationship between inputs and outputs.
Some measures were ratio-based. Ratios were more common for physician efficiency measures than hospital efficiency measures. The main difference between the various measurement approaches is that ratio-based measures include only single inputs and outputs (although various elements are sometimes aggregated to a single quantity), whereas SFA, DEA, and regression-based approaches explicitly account for multiple inputs and outputs.
An example of a measure that uses multiple physical inputs and multiple health services outputs comes from Grosskopf.1 This DEA-based measure used the following inputs (counts): physicians; nurses; other personnel; and hospital beds. As outputs it used (again, counts): outpatient procedures; inpatient procedures; physician visits in outpatient clinics; hospital discharges; and emergency visits. In comparison, a typical example of a measure that uses a single physical input and health services output (ratio) was the number of hospital days (input) divided by the number of discharges (output)—the average length of stay.2
5
Vendors and Stakeholder Interviews
Thirteen organizations were selected using a purposive reputational sampling approach. The results presented here are based on information gathered from eight vendors and five stakeholders who responded to our request for an interview. The TEP, which included various stakeholders and experts on efficiency measurement, also provided input into the search and reviewed this report. The TEP members are listed in Appendix D*.
Most of the measures used by purchasers and payers are proprietary. The main application of these measures by purchasers and plans is to reduce costs through pay-for-performance, tiered product offerings, public report, and feedback for performance improvement. These measures, for the purpose of assessing efficiency, generally take the form of a ratio, such as observed-to-expected ratios of costs per episode of care, adjusting for risk severity and case-mix. Efforts to validate and test the reliability of these algorithms as tools to create relevant clinical groupings for comparison are documented in either internal reports or white papers. External evaluations of performance characteristics of these measures are beginning to emerge from the Medicare Payment Advisory Commission (MedPAC), the Centers for Medicare and Medicaid Services (CMS), and other research groups including RAND. Our scan identified seven major developers of proprietary software packages for measuring efficiency, with other vendors providing additional analytic tools, solution packages, applications, and consulting services that build on top of these existing platforms.
The proprietary measures fall into two main categories: episode-based or population-based. An episode-based approach to measuring efficiency uses diagnosis and procedure codes from claims/encounter data to construct discrete episodes of care, which are a series of temporally contiguous health care services related to the treatment of a specific acute illness, a set time period for the management of a chronic disease, or provided in response to a specific request by the patient or other relevant entity. On the other hand, a population-based approach to efficiency measurement classifies a patient population according to morbidity burden in a given period (e.g., one year).
We contacted a sample of stakeholders to seek their insights on efficiency measurement. We used their input to cross-validate our selection of vendors described above. Our sample included two coalitions on the national level; two coalitions on the state level; and an accrediting agency. We asked these stakeholders to provide the definition of efficiency they used to guide their efforts; describe desirable attributes they considered as they searched for available measures; comment on their interest or objectives in developing and/or implementing efficiency measures; and list proprietary measures they have considered.
While the stakeholders used different definitions of “efficiency,” they shared a number of common concerns related to efficiency measurement. Many concerns were related to methodological issues such as data quality, attribution of responsibility for care to providers, risk adjustment, and identification of outliers. The stakeholders also shared a number of concerns related to the use of efficiency measures, including the perceptions of providers and patients, and the cost of using proprietary measures and transparency of the methods used to construct the measures.
* Appendixes for this report are provided electronically at http://www.ahrq.gov/downloads/pub/evidence/pdf/efficiency/efficiency.pdf.
6
Evaluation
Measures of any construct can rarely be evaluated in the abstract. The evaluation must take into account the purpose or application of the measure; some measures that work well for research, for example, may be unusable for internal quality improvement.
We suggest that measures of health care efficiency be evaluated using the same framework as measures of quality:
• Important—is the measure assessing an aspect of efficiency that is important to providers, payers, and policymakers? Has the measure been applied at the level of interest to those planning to use the measure? Is there an opportunity for improvement? Is the measure under the control of the provider or health system?
• Scientifically sound—is the measure reliable and reproducible? Does the measure appear to capture the concept of interest? Is there evidence of face, construct, or predictive validity?
• Feasible—are the data necessary to construct this measure available? Is the cost and burden of measurement reasonable?
• Actionable—are the results interpretable? Can the intended audience use the information to make decisions or take action?
An ideal health care efficiency measure does not exist, and therefore the selection of
measures will involve tradeoffs between these criteria. We summarize the results of our review of measures below. Important
The measurement of efficiency meets the test of importance because of the interest and intent among stakeholders in finding and implementing such measures for policy and operations. Although we found differences in the content of measures from peer-reviewed versus vendor-developed sources, they have in common the specification of one or more outputs and one or more inputs in constructing a measure.
The “importance” of measures abstracted from peer-reviewed literature appears low because these have not generally been used in practice and there is no apparent consensus in the academic literature of an optimal method for measuring efficiency. Some academic experts have indicated skepticism that the construct can be adequately measured. Although many peer-reviewed articles identified factors that were found to influence efficiency, the findings appear to be difficult to translate into policy. We found no clear evidence that efficiency measures developed by academics had influenced policy decisions made by providers or policymakers.
The vendor-developed measures meet the importance criterion because they are being widely used by purchasers and plans to inform operational decisions. Some of the vendor-developed measures are based on methods originally developed in the academic world (e.g., Adjusted Clinical Groups).
7
Scientifically Sound
Very little research on the scientific soundness of efficiency measures has been published to date. This includes measures developed by vendors as well as those published in the peer-reviewed literature. Although academics are more likely to publish articles evaluating scientific soundness, we found little peer-reviewed literature on the reliability and validity of efficiency measures. Several studies have examined some of the measurement properties of vendor-developed measures, but the amount of evidence available is still limited at this time. Vendors typically supply tools (e.g., methods for aggregating claims to construct episodes of care or methods for aggregating the costs of care for a population) from which measures can be constructed; thus, the assessment of scientific soundness requires an evaluation of the application as well as the underlying tools. Significant questions about the scientific soundness of efficiency measures have been raised. The lack of testing of the scientific soundness of efficiency measures reflects in part the pressure to develop tools that can be used quickly and with relative ease of implementation. Feasible
The focus of vendor-developed measures is on producing tools that are feasible for routine operational use. Most of the measures abstracted from the peer-reviewed literature were based on available secondary data sources (i.e., claims data). These measures could feasibly be reconstructed at little cost and measurement burden. The vendor-developed measures also rely largely on claims data. Most of the vendor-developed measures require that the user obtain and pay for a license either directly or through a value added reseller. This has prompted some organizations to begin developing open-source, public domain measures of efficiency. This work is at an early stage. Actionable
For efficiency metrics to have the effects intended by users, the information produced from measures must be actionable. We found little research on the degree to which the intended audiences for these measures (e.g., consumers, physicians, hospitals) were able to readily use the information to choose or deliver care differently.
Conclusions
We found little overlap between the measures published in the peer-reviewed literature and
those in the grey literature suggesting that the driving forces behind research and practice result in very different choices of measure. We found gaps in some measurement areas, including: no established measures of social efficiency, few measures that evaluated health outcomes as the output, and few measures of providers other than hospitals and physicians.
Efficiency measures have been subjected to relatively few rigorous evaluations of their performance characteristics, including reliability (over time, by entity), validity, and sensitivity to methods used. Measurement scientists would prefer that steps be taken to improve these metrics in the laboratory before implementing them in operational uses. Purchasers and health

8
plans are willing to use measures without such testing under the belief that the measures will improve with use.
The lack of consensus among stakeholders in defining and accepting efficiency measures that motivated this study was evident in the interviews we conducted. An ongoing process to develop consensus among those demanding and using efficiency measures will likely improve the products available for use. A major goal of the AQA has been to develop a consensus around use of language in describing measures of economic constructs. The National Quality Forum is similarly working to achieve consensus on criteria for evaluating measures. Both groups support the use of clear language in describing particular metrics, which may be easier to implement than a consensus definition of efficiency.
Future Research
Research is already underway to evaluate vendor-developed tools for scientific soundness, feasibility, and actionability. For example, we identified studies being done or funded by the General Accounting Office, MedPAC, CMS, Department of Labor, Massachusetts Medical Society, and the Society of Actuaries. A research agenda is needed in this area to build on this work. We summarize some of the key areas for future research here but do not intend to signal a prioritization of needed work. Filling Gaps in Existing Measures
Several stakeholders recognize the importance of using efficiency and effectiveness metrics together but relatively little research has been done on the options for constructing such approaches to measurement. Much of the developmental work currently underway at AQA is focused on this gap.
We found few measures of efficiency that used health outcomes as the output measure. Physicians and patients are likely to be interested in measures that account for the costs of producing desirable outcomes. We highlight some of the challenges of doing this that are parallel to the challenges of using outcomes measures in other accountability applications; thus, a program of research designed to advance both areas would be welcome.
We found a number of gaps in the availability of efficiency measures within the classification system of our typology. For example, we found no measures of social efficiency, which might reflect the choice of U.S.-based research. Nonetheless, such measures may advance discussions related to equity and resource allocation choices as various cost containment strategies are evaluated. Evaluating and Testing Scientific Soundness
There are a variety of methodological questions that should be investigated to better understand the degree to which efficiency measures are producing reliable and valid information. Some of the key issues include whether there is enough information to evaluate performance (e.g., do available sample sizes allow for robust scores to be constructed?); whether the information is reliable over time and in different purchaser data sets (e.g., does one get the same result when examining performance in the commercial versus the Medicare market?); methods
9
for constructing appropriate comparison groups for physicians, hospitals, health plans, markets; methods for assigning responsibility (attribution) for costs to different entities; and the use of different methods for assigning prices to services. Remarkably little is known about these various methodological issues and a program of systematic research to answer these questions is critical given their increasing use in operational applications. Evaluating and Improving Feasibility
One area of investigation is the opportunities for creating easy-to-use products based on methods such as DEA or SFA. This would require work to bridge from tools used for academic research to tools that could be used in operational applications.
Another set of investigations is identifying data sources or variables useful for expanding inputs and outputs measured (e.g., measuring capital requirements or investment, accounting for teaching status or charity care). Making Measures More Actionable
Considerable research needs to be conducted to develop and test tools for decisionmakers to use for improving health care efficiency (e.g., relative drivers of costs, best practices in efficient care delivery, feedback and reporting methods) and for making choices among providers and plans. Research could also identify areas for national focus on reducing waste and inefficiency in health care. The relative utility of measurement and reporting on efficiency versus other methods (Toyota’s Lean approach, Six Sigma) could also be worthwhile for setting national priorities.


Final Report

13
Chapter 1. Introduction
The Institute of Medicine (IOM) outlined six aims for the 21st-century health system in Crossing the Quality Chasm: health care should be safe, effective, patient-centered, timely, efficient, and equitable.3 In a subsequent IOM report providing the basis for the National Healthcare Quality Report,4 a matrix is provided for categorizing quality measures in five of those domains. Efficiency was not included in the matrix because it was judged to fall outside of the scope of the Quality Report and because of the “considerable methodological and measurement issues involved.”4
Since the publication of the IOM reports, there has been substantial progress in measuring and reporting progress in health care quality. The National Healthcare Quality Report and the National Healthcare Disparities Report present current performance in the areas of effectiveness, patient centeredness, safety, timeliness, and equity. Many other groups, such as accrediting bodies (NCQA, JCAHO), government agencies (AHRQ, CMS), public-private alliances (Leapfrog, AQA, National Quality Forum, AMA Physician Consortium for Performance Improvement), and various research groups have also made a great deal of progress in defining and measuring various domains of health care quality. The measurement of efficiency has lagged behind.
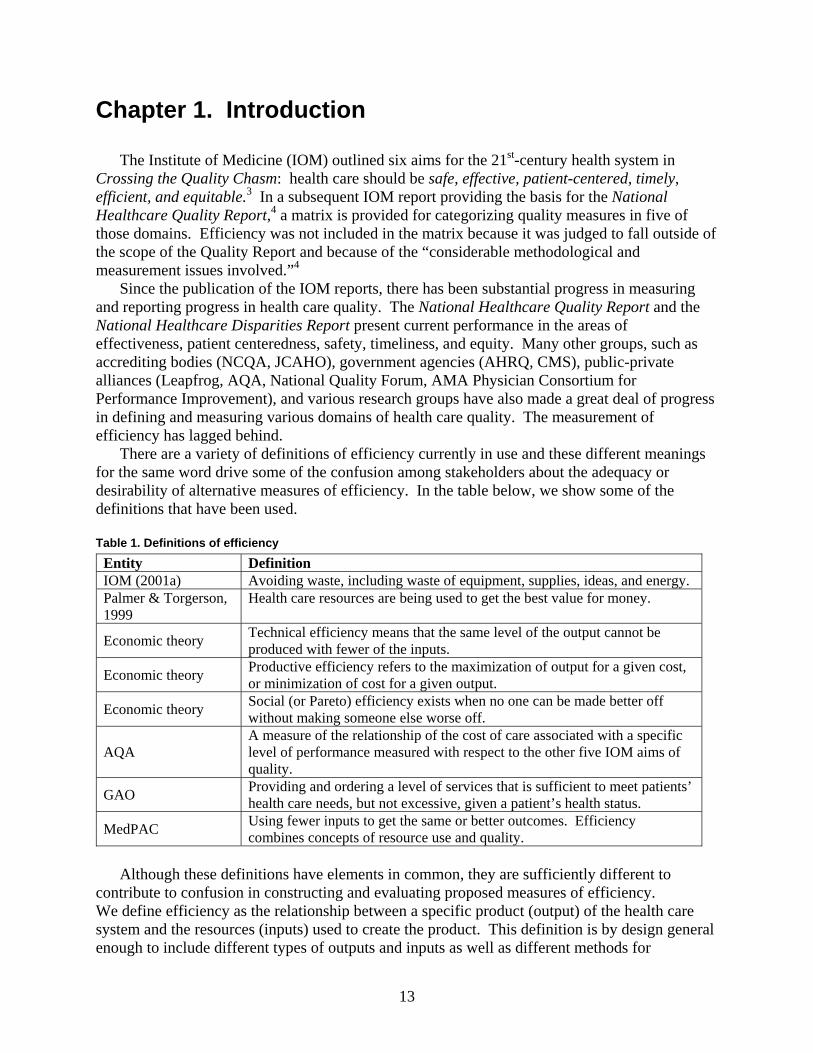
There are a variety of definitions of efficiency currently in use and these different meanings for the same word drive some of the confusion among stakeholders about the adequacy or desirability of alternative measures of efficiency. In the table below, we show some of the definitions that have been used. Table 1. Definitions of efficiency
Entity Definition IOM (2001a) Avoiding waste, including waste of equipment, supplies, ideas, and energy. Palmer & Torgerson, 1999
Health care resources are being used to get the best value for money.
Economic theory Technical efficiency means that the same level of the output cannot be produced with fewer of the inputs.
Economic theory Productive efficiency refers to the maximization of output for a given cost, or minimization of cost for a given output.
Economic theory Social (or Pareto) efficiency exists when no one can be made better off without making someone else worse off.
AQA A measure of the relationship of the cost of care associated with a specific level of performance measured with respect to the other five IOM aims of quality.
GAO Providing and ordering a level of services that is sufficient to meet patients’ health care needs, but not excessive, given a patient’s health status.
MedPAC Using fewer inputs to get the same or better outcomes. Efficiency combines concepts of resource use and quality.
Although these definitions have elements in common, they are sufficiently different to
contribute to confusion in constructing and evaluating proposed measures of efficiency. We define efficiency as the relationship between a specific product (output) of the health care system and the resources (inputs) used to create the product. This definition is by design general enough to include different types of outputs and inputs as well as different methods for
14
describing the relationship between these two critical components. We developed a typology of efficiency measures, described in the next chapter, designed to facilitate a discussion among interested parties about what is being evaluated under the category of efficiency and whether the available data and methods support the construct.
Despite the methodological difficulties, it is important to improve the current state of knowledge in measuring health care efficiency. Providers, payers, purchasers, consumers, and regulators all could benefit from information on the value derived from spending additional money on health care. Health care spending has continued to increase rapidly, without a clear understanding of whether the spending is increasing the value of care delivered.5 Despite its importance, there has not been a systematic and rigorous process in place to improve efficiency measurement as there has been for other domains of quality. As a result, organizations have proceeded with separate ad-hoc measurement approaches.6 Purchasers, particularly large employers, have been demanding that health plans incorporate economic profiling into their products and information packages. However, there is little information currently available about the approaches each of these entities is taking.
Recognizing the importance of improving efficiency measurement, the Agency for Healthcare Research and Quality (AHRQ) has requested that the Southern California Evidence-Based Practice Center (EPC) develop a typology of efficiency measures and conduct a systematic review and analysis of available measures.
15
Chapter 2. Methods
A principal task was to create an analytic framework, or typology, of efficiency. The typology serves two major functions: (1) to provide a structured way to consider the content and use of efficiency measures; (2) to guide our literature review. Additional information can be found in Appendix A*.
Analytic Framework—A Typology of Efficiency
We begin with a definition. Efficiency is an attribute of performance that is measured by examining the relationship between a specific product of the health care system (also called an output) and the resources used to create that product (also called inputs). A provider in the health care system (e.g., hospital, physician) would be efficient if it was able to maximize output for a given set of inputs or to minimize inputs used to produce a given output.
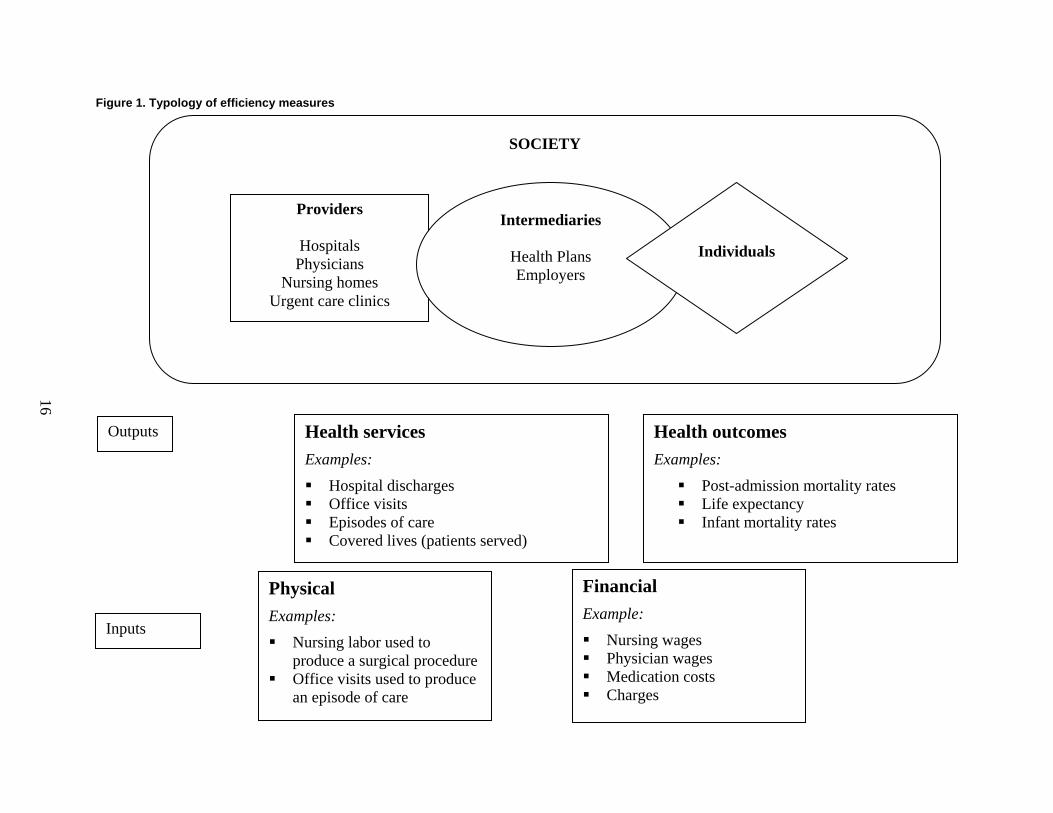
Building on this definition, we created a typology of efficiency measures. The purpose of this typology is to make explicit the content and use of a measure of efficiency. Our typology has three levels (see Figure 1):
• Perspective: who is evaluating the efficiency of what entity and what is their objective? • Outputs: what type of product is being evaluated? • Inputs: what resources are used to produce the output?
Considering each of these questions in turn will clarify the intended use of an efficiency
measure, the definitions of the key elements, and the validity of the metrics that are proposed for use. Perspective
The first tier in the typology requires an explicit identification of the entity that is evaluating efficiency, the entity that is being evaluated, and the objective or rationale for the assessment. The diagram illustrates four different types of entities:
• Health care providers (e.g., physicians, hospitals, nursing homes) that deliver health care services
• Intermediaries (e.g., health plans, employers) who act on behalf of collections of either providers or individuals (and, potentially, their own behalf) but do not directly deliver health care services
• Consumers/patients who use health care services • Society, which encompasses the first three.
* Appendixes for this report are provided electronically at http://www.ahrq.gov/downloads/pub/evidence/pdf/efficiency/efficiency.pdf.
SOCIETY
Providers
Hospitals Physicians
Nursing homes Urgent care clinics
Intermediaries
Health Plans Employers
Individuals
Health services
Examples:
Hospital discharges Office visits Episodes of care Covered lives (patients served)
Physical Examples:
Nursing labor used to produce a surgical procedure
Office visits used to produce an episode of care
Financial Example:
Nursing wages Physician wages Medication costs Charges
Health outcomes Examples:
Post-admission mortality rates Life expectancy Infant mortality rates
Inputs
Outputs
Figure 1. Typology of efficiency measures
16
17
Each of these types of entities has different objectives for considering efficiency, has control over a particular set of resources or inputs, and may seek to deliver or purchase a different set of products. Health care providers can act directly to change the way in which different products are produced whereas intermediaries can typically just change how much is paid or what will be purchased. Individuals often operate through intermediaries to access the products delivered by providers; they are two steps removed from the production process of the health care providers. (High deductible health plans are designed in part to make consumers more cost conscious in their decisionmaking.) Society as a whole includes the perspectives of all providers, intermediaries and consumers. Efficiency for society as a whole, or “social efficiency,” refers to the allocation of available resources; social efficiency is achieved when it is not possible to make a person or group in society better off without making another person or group worse off. Thus, perspective is the lens through which an entity views efficiency; entities will select measures that reflect their objectives, the outputs of interest, and the inputs necessary to produce those outputs.
Performance on efficiency may be evaluated internally by a firm (could we perform better?) or be externally driven by agents and individuals (could we get a better deal?). Stating the purpose or intended use of the results of an evaluation is critical for evaluating the utility and appropriateness of measures. The requirements for conducting a fair internal evaluation are often less demanding than those for an external evaluation.
The perspective from which efficiency is evaluated has strong implications for the measurement approach, because what is efficient from one perspective may not be efficient from another. For example, a physician may produce CT scans efficiently in her office, but the physician may not appear efficient to a health plan if a less expensive diagnostic could have been substituted for some cases. We will illustrate how these different perspectives operate in the examples provided later. Outputs
Efficiency measures should explicitly identify the outputs of interest and how those will be measured. We distinguish between two types of outputs: health services (e.g., visits, drugs, admissions) and health outcomes (e.g., preventable deaths, functional status, blood pressure control). Both represent reasonable ways of defining the products of the health care system. Health care services can be considered an intermediate output in the production of health outcomes.7
Health service outputs can be measured in a variety of ways:
• Individual units of service (e.g., procedures, prescriptions) • Bundles of services within a single entity (e.g., hospital stay) • Bundles of related services provided by one or more entities (e.g., episodes of care).
In this typology, we do not require that the health service outputs be constructed as
quality/effectiveness metrics. For example, an efficiency measure could consider the relative cost of a procedure without evaluating whether the use of the procedure was appropriate. Similarly, an efficiency measure could evaluate the relative cost of a hospital stay for a condition without considering whether the admission was preventable or appropriate. However, the typology allows for health service outputs to be defined with reference to quality criteria. That

18
is, the typology is broad enough to include either definition of health services. We deliberately constructed the typology in this way to facilitate dialogue among stakeholders with different perspectives on this issue.
More recently, suggestions have been made about incorporating other quality measures (i.e., effectiveness of care or patient experience) into efficiency assessments. The AQA, a consortium of physician professional groups, insurance plans, and others, has adopted a principle that measures can only be labeled “efficiency of care” if they incorporate a quality metric; those without quality incorporated are labeled “cost of care” measures.8 The AQA has noted the potential unintended consequences of measurement focusing solely on one dimension or the other of quality.
The methods for incorporating quality into efficiency measurement are not well developed at this time, however. The most common (and simplest) approach has been to perform comparisons of quality measures alongside comparisons of efficiency measures for the same provider, medical condition treated, or procedure. For example, blood glucose monitoring frequency for diabetic patients could be reported in conjunction with the cost of an episode of diabetes care. Another (more difficult) approach would be to adjust the outputs of efficiency measures for quality by directly incorporating quality metrics into the specification of the output. The method would be analogous to how quality-adjusted life years (QALYs) weight years of life using a health-related quality of life scale. For example, comparisons of the efficiency of producing coronary artery bypass graft surgical procedures would give less weight to procedures resulting in complications. This approach poses significant methodological challenges and is not well-developed at this time.
Health outcome outputs may include health status at a point in time, changes in health status over a period of time, or changes in health status associated with a particular intervention (e.g., mortality following surgery). The use of health outcomes measures as outputs more directly incorporates quality metrics into efficiency measurement. For many clinicians, this information is important for assessing whether efficient patterns of care (e.g., relatively high rates of generic drugs used for treatment of hypertension) are also effective (e.g., as measured by the proportion of the population with good blood pressure control).
A number of methodological challenges arise in using health outcomes as outputs, including: defining the time period for evaluation (i.e., whether the time frame for costs and outcomes must be identical), identifying the responsible entities, taking account of the role of individuals in “producing” their own health outcomes, adjusting for the expected trajectory of the patient (particularly for outputs measured over a longer period of time), and accounting for factors outside the scope of the health delivery system (e.g., air pollution, education). For many of the same reasons that outcomes measures can be challenging to develop for quality measurement, they are likely to be challenging to use in evaluating efficiency. Although we focus in this section on health outcomes, an extension of this typology could include customer satisfaction.
The approach to measurement may be influenced by the way in which the output is purchased. For example, if physician services are paid fee-for-service, then the purchaser may consider an evaluation of efficiency at the service unit level. If a hospital is paid for a bundle of services, such as under the Medicare inpatient prospective payment system, then the purchaser may be more likely to evaluate efficiency for the bundle. Thus, the perspective of the evaluator may be shaped by the way in which the outputs of interest are paid for.
A key issue that arises in external evaluations of efficiency is whether the outputs are comparable. Threats to comparability arise when there is (perceived or real) heterogeneity in the
19
content of a single service, the mix of services in a bundle, and the mix of patients seeking or receiving services. Thus, one way to evaluate efficiency measures is by determining whether the methods used truly allow for apples-to-apples comparisons. Some of the methods used today include peer-to-peer comparisons (e.g., by specialty for physicians, by bed size and/or location for hospitals, by profit vs. non-profit status for health plans), geographical controls, case-mix or severity adjustments for heterogeneity among patients, and consistent inclusion/exclusion criteria for constructing bundles of services. Whether or not these approaches adequately define comparable groups is an ongoing area for research. For example, a common way to identify physician peer groups is by specialty but this fails to account for the heterogeneity of practice within specialty (e.g., cardiologists who specialize in electrophysiology versus those with a general practice). Suggestions have been made to define peer groups empirically on the basis of patterns of practice but these approaches have not been fully developed or tested. Inputs
Efficiency measures must also explicitly identify the inputs that are used (or will be counted) to produce the output of interest. Inputs can be measured as counts by type (e.g., nursing hours, bed days, days supply of drugs) or they can be monetized (real or standardized dollars assigned to each unit). We refer to these, respectively, as physical inputs or financial inputs. The measurement objectives should guide the method for measuring inputs.
Efficiency measures that count the amounts of different inputs used to produce an output (physical inputs) help to answer questions about whether the output could be produced faster, with fewer people, less time from people, or fewer supplies. In economic terms, the focus is on whether the output is produced with the minimum amount of each input and is called technical efficiency.
Efficiency measures that monetize the inputs (financial inputs) help to answer questions about whether the output could be produced less expensively—could the total cost of labor, supplies, and other capital be reduced? A focus on cost minimization corresponds to the economic concept of productive efficiency, which incorporates considerations related to the optimal mix of inputs (e.g., could we substitute nursing labor for physician labor without changing the amount and quality of the output?) and the total cost of inputs.
Questions similar to those discussed in the section on outputs have been raised regarding the comparability of inputs. For example, the method of paying physicians or other providers (e.g., fee-for-service versus capitation) may affect the comparability of the input costs. The allocation of dollars across services can vary considerably depending on the cost structure of the medical group, hospital or physician practice. For this reason, many users have elected to create standardized prices based on fee schedules or some other method that are applied to utilization patterns to remove variable pricing or differential cost structures from an evaluation. An Example
To make the typology more concrete, we offer a simple example shown in Table 2. Let’s assume that a health plan has decided to create a tiered network where patients who see physicians in the top tier pay 20 percent of charges and patients who see physicians in the bottom tier pay 50 percent of charges. Physicians are assigned to tiers based on efficiency metrics. The health plan is evaluating the performance of physicians with the objective of steering patients to
20
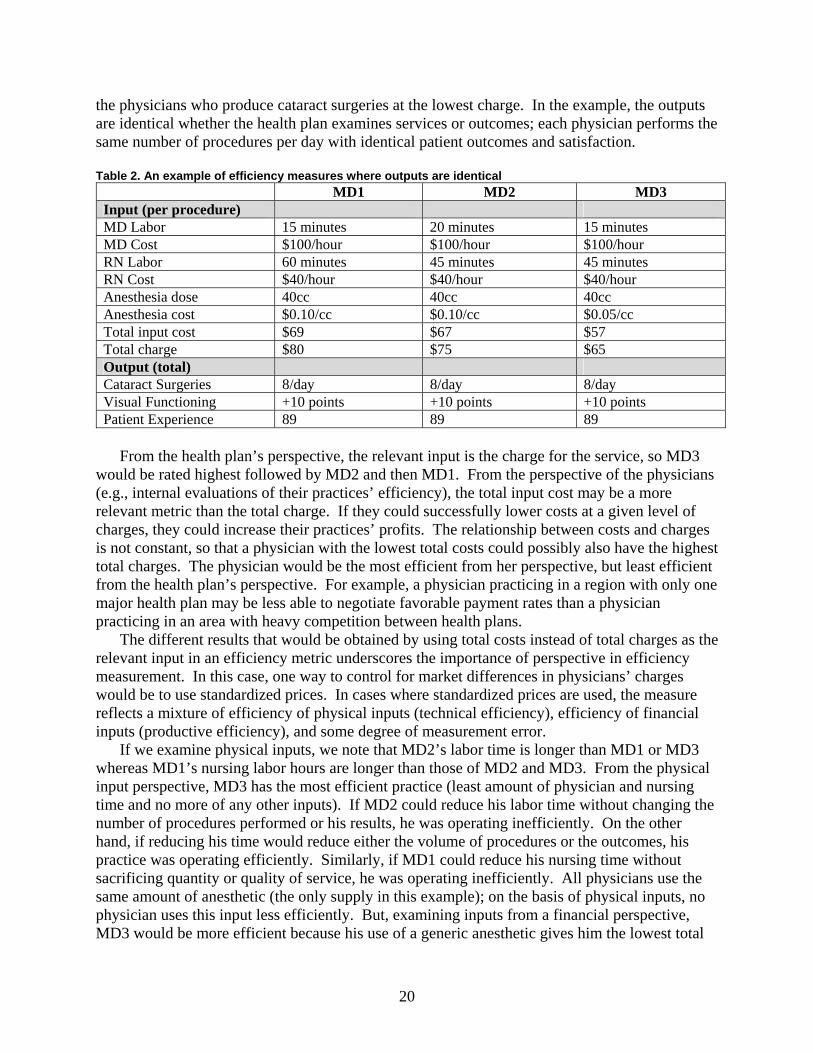
the physicians who produce cataract surgeries at the lowest charge. In the example, the outputs are identical whether the health plan examines services or outcomes; each physician performs the same number of procedures per day with identical patient outcomes and satisfaction. Table 2. An example of efficiency measures where outputs are identical
MD1 MD2 MD3 Input (per procedure) MD Labor 15 minutes 20 minutes 15 minutes MD Cost $100/hour $100/hour $100/hour RN Labor 60 minutes 45 minutes 45 minutes RN Cost $40/hour $40/hour $40/hour Anesthesia dose 40cc 40cc 40cc Anesthesia cost $0.10/cc $0.10/cc $0.05/cc Total input cost $69 $67 $57 Total charge $80 $75 $65 Output (total) Cataract Surgeries 8/day 8/day 8/day Visual Functioning +10 points +10 points +10 points Patient Experience 89 89 89
From the health plan’s perspective, the relevant input is the charge for the service, so MD3
would be rated highest followed by MD2 and then MD1. From the perspective of the physicians (e.g., internal evaluations of their practices’ efficiency), the total input cost may be a more relevant metric than the total charge. If they could successfully lower costs at a given level of charges, they could increase their practices’ profits. The relationship between costs and charges is not constant, so that a physician with the lowest total costs could possibly also have the highest total charges. The physician would be the most efficient from her perspective, but least efficient from the health plan’s perspective. For example, a physician practicing in a region with only one major health plan may be less able to negotiate favorable payment rates than a physician practicing in an area with heavy competition between health plans.
The different results that would be obtained by using total costs instead of total charges as the relevant input in an efficiency metric underscores the importance of perspective in efficiency measurement. In this case, one way to control for market differences in physicians’ charges would be to use standardized prices. In cases where standardized prices are used, the measure reflects a mixture of efficiency of physical inputs (technical efficiency), efficiency of financial inputs (productive efficiency), and some degree of measurement error.
If we examine physical inputs, we note that MD2’s labor time is longer than MD1 or MD3 whereas MD1’s nursing labor hours are longer than those of MD2 and MD3. From the physical input perspective, MD3 has the most efficient practice (least amount of physician and nursing time and no more of any other inputs). If MD2 could reduce his labor time without changing the number of procedures performed or his results, he was operating inefficiently. On the other hand, if reducing his time would reduce either the volume of procedures or the outcomes, his practice was operating efficiently. Similarly, if MD1 could reduce his nursing time without sacrificing quantity or quality of service, he was operating inefficiently. All physicians use the same amount of anesthetic (the only supply in this example); on the basis of physical inputs, no physician uses this input less efficiently. But, examining inputs from a financial perspective, MD3 would be more efficient because his use of a generic anesthetic gives him the lowest total
21
input cost. Note that in this example we have not assumed substitution across inputs, but in many real world circumstances this would be another way to achieve efficiency.
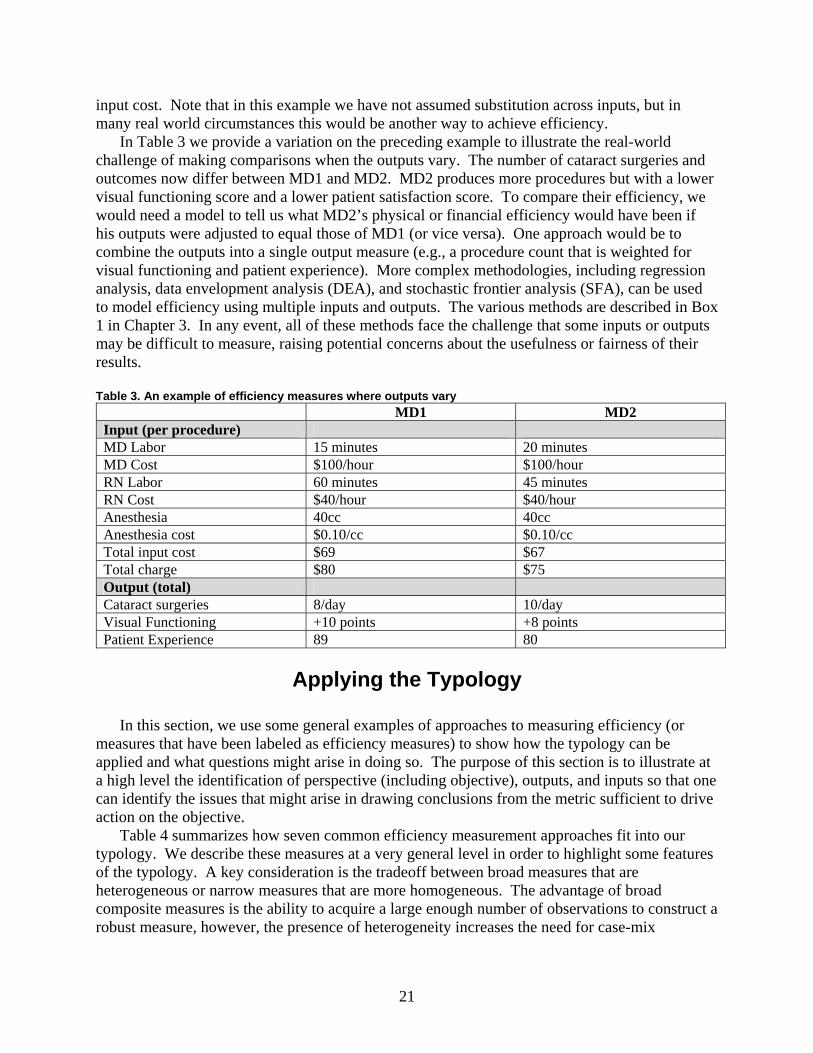
In Table 3 we provide a variation on the preceding example to illustrate the real-world challenge of making comparisons when the outputs vary. The number of cataract surgeries and outcomes now differ between MD1 and MD2. MD2 produces more procedures but with a lower visual functioning score and a lower patient satisfaction score. To compare their efficiency, we would need a model to tell us what MD2’s physical or financial efficiency would have been if his outputs were adjusted to equal those of MD1 (or vice versa). One approach would be to combine the outputs into a single output measure (e.g., a procedure count that is weighted for visual functioning and patient experience). More complex methodologies, including regression analysis, data envelopment analysis (DEA), and stochastic frontier analysis (SFA), can be used to model efficiency using multiple inputs and outputs. The various methods are described in Box 1 in Chapter 3. In any event, all of these methods face the challenge that some inputs or outputs may be difficult to measure, raising potential concerns about the usefulness or fairness of their results. Table 3. An example of efficiency measures where outputs vary
MD1 MD2 Input (per procedure) MD Labor 15 minutes 20 minutes MD Cost $100/hour $100/hour RN Labor 60 minutes 45 minutes RN Cost $40/hour $40/hour Anesthesia 40cc 40cc Anesthesia cost $0.10/cc $0.10/cc Total input cost $69 $67 Total charge $80 $75 Output (total) Cataract surgeries 8/day 10/day Visual Functioning +10 points +8 points Patient Experience 89 80
Applying the Typology
In this section, we use some general examples of approaches to measuring efficiency (or
measures that have been labeled as efficiency measures) to show how the typology can be applied and what questions might arise in doing so. The purpose of this section is to illustrate at a high level the identification of perspective (including objective), outputs, and inputs so that one can identify the issues that might arise in drawing conclusions from the metric sufficient to drive action on the objective.
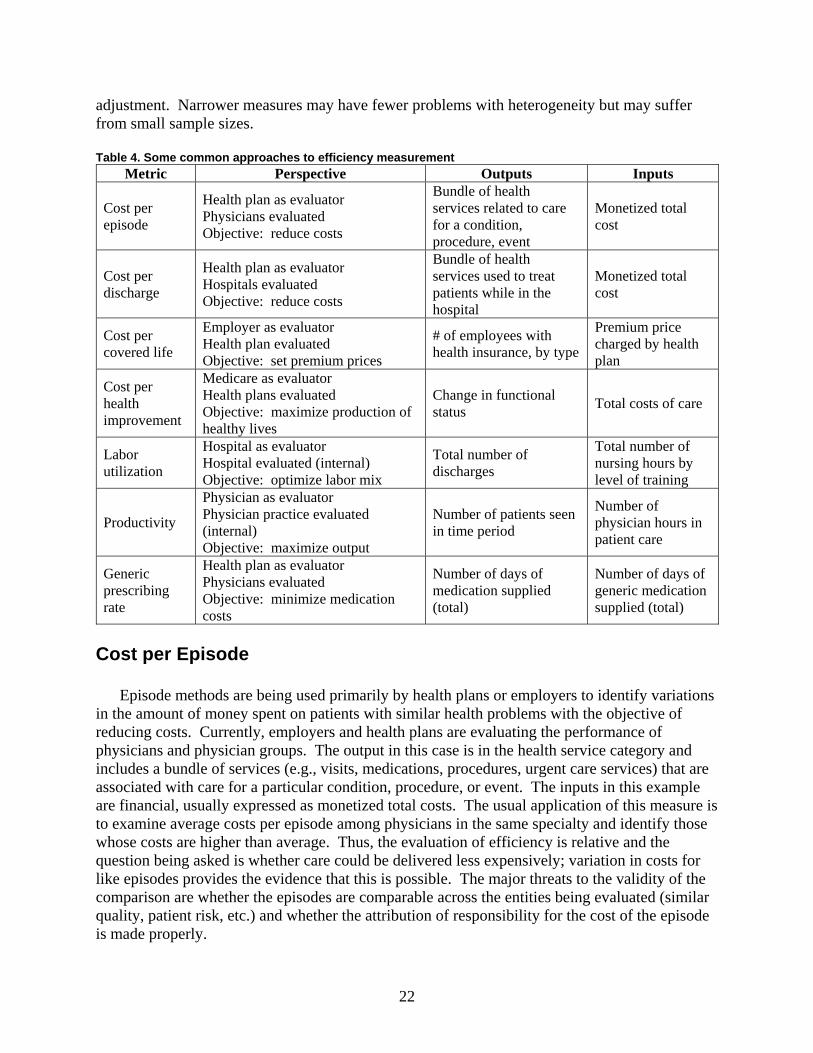
Table 4 summarizes how seven common efficiency measurement approaches fit into our typology. We describe these measures at a very general level in order to highlight some features of the typology. A key consideration is the tradeoff between broad measures that are heterogeneous or narrow measures that are more homogeneous. The advantage of broad composite measures is the ability to acquire a large enough number of observations to construct a robust measure, however, the presence of heterogeneity increases the need for case-mix
22
adjustment. Narrower measures may have fewer problems with heterogeneity but may suffer from small sample sizes. Table 4. Some common approaches to efficiency measurement
Metric Perspective Outputs Inputs
Cost per episode
Health plan as evaluator Physicians evaluated Objective: reduce costs
Bundle of health services related to care for a condition, procedure, event
Monetized total cost
Cost per discharge
Health plan as evaluator Hospitals evaluated Objective: reduce costs
Bundle of health services used to treat patients while in the hospital
Monetized total cost
Cost per covered life
Employer as evaluator Health plan evaluated Objective: set premium prices
# of employees with health insurance, by type
Premium price charged by health plan
Cost per health improvement
Medicare as evaluator Health plans evaluated Objective: maximize production of healthy lives
Change in functional status Total costs of care
Labor utilization
Hospital as evaluator Hospital evaluated (internal) Objective: optimize labor mix
Total number of discharges
Total number of nursing hours by level of training
Productivity
Physician as evaluator Physician practice evaluated (internal) Objective: maximize output
Number of patients seen in time period
Number of physician hours in patient care
Generic prescribing rate
Health plan as evaluator Physicians evaluated Objective: minimize medication costs
Number of days of medication supplied (total)
Number of days of generic medication supplied (total)
Cost per Episode
Episode methods are being used primarily by health plans or employers to identify variations in the amount of money spent on patients with similar health problems with the objective of reducing costs. Currently, employers and health plans are evaluating the performance of physicians and physician groups. The output in this case is in the health service category and includes a bundle of services (e.g., visits, medications, procedures, urgent care services) that are associated with care for a particular condition, procedure, or event. The inputs in this example are financial, usually expressed as monetized total costs. The usual application of this measure is to examine average costs per episode among physicians in the same specialty and identify those whose costs are higher than average. Thus, the evaluation of efficiency is relative and the question being asked is whether care could be delivered less expensively; variation in costs for like episodes provides the evidence that this is possible. The major threats to the validity of the comparison are whether the episodes are comparable across the entities being evaluated (similar quality, patient risk, etc.) and whether the attribution of responsibility for the cost of the episode is made properly.
23
Cost per Discharge
Health plans may evaluate the average cost they pay different hospitals for a discharge with the objective of reducing costs. In this case, the output is the bundle of services used to treat patients while in the hospital (health service) and the input is the price paid by the health plan for the discharge (financial input). If the health plan is undertaking this evaluation alone, the price paid will reflect any discounts that have been negotiated with hospitals. Because this is an external evaluation, the actual costs to the hospital of producing the discharge are not part of the assessment. If the discharges are bundled together (average cost across all discharges), then the measure can be affected by the mix of types of discharges, which might vary by hospital. Cost per Covered Life
Employers may evaluate the costs of providing different types of health insurance coverage for their employees and dependents with the intent of minimizing the total cost of labor as an input to their own production processes. The output in this example is the number of health plan enrollees and the input is the premium price charged by the health plan. If the benefit package across plans is identical, the employer might conclude that lower premium prices signal greater efficiency. Large national employers may have some difficulty accounting for differences in market prices and state mandated benefit packages that affect the actuarial value of the package and thus the premium charged. Cost per Health Improvement
Medicare could evaluate the health improvement and costs of beneficiaries enrolled in private Medicare Advantage health plans, potentially comparing the efficiency of the plans to traditional fee-for-service Medicare, with the objective of maximizing the health of the Medicare population at current funding levels. The output in this example is the change in physical functioning of beneficiaries over a given period of time and the input is the amount Medicare spends for those beneficiaries over the time period. One measurement challenge would be to ensure that the Medicare beneficiaries in the different comparison groups were similar. Labor Utilization
Hospitals may evaluate their use of nursing labor to produce discharges with the intent of minimizing labor costs (generally the largest component of hospital costs). The output in this case would be discharges (health service) and the input would be the total number of nurse labor hours or days used (physical). From an efficiency perspective, the question is whether the same number of discharges could be produced with fewer nursing hours (with the caveat that the results would have to be the same, say functional status at discharge). Another use of such measures would be to consider whether a different mix (by level of training) of nursing hours could produce equivalent outcomes.
24
Productivity
Physicians are frequently paid based on their productivity so a physician practice may conduct an internal evaluation of productivity for the purpose of maximizing reimbursement. The output in this case would be the number of visits (health service) and the input would be the total number of hours the physician spent in patient care (physical). A challenge to this measure is whether the visits (output) are equivalent across different levels of physician labor hours. Substituting less costly labor (e.g., nursing time) for physician time offers one approach to improving efficiency on this metric. Generic Prescribing Rate
To minimize the amount spent on prescription drugs, some large purchasers are measuring generic prescribing rates at the health plan or physician level. The output in this case is a health service (total days supply of a medication) and the input is a physical input (total days supply of generic medications). This measure focuses on a narrow set of outputs and inputs (prescription drugs), omitting other aspects of care delivered. The bases of the measure are the dual assumptions that (1) the output is identical regardless of whether generic or brand name drugs are prescribed; (2) generics are always less expensive, implying that a higher ratio of generic to brand name drugs is preferable; and (3) availability of generic substitutes is consistent across conditions. As with most rate measures, the preferred proportions are often unknown. A number of factors could influence the metric including reductions in the total days supplied of medications (the optimal number is likely not known). Approaches That We Do Not Classify as Efficiency Measures
Table 5 presents three approaches, readmission, procedure rates, and cost-effectiveness, that
have been used to measure “efficiency” but would not be classified as efficiency measures under our definition and typology. Although they may indirectly reflect the efficiency of health care providers and may be useful for evaluating other problems in practice patterns, they do not directly measure efficiency by comparing the inputs and outputs of health care or otherwise are not appropriate for this application. Table 5. Measures we would not classify as efficiency measures
Metric Perspective Outputs Inputs
Readmission rate
Purchaser as evaluator Hospitals evaluated Objective: change reimbursement method
Not specified Not specified
Rate of CABG surgery Employer as evaluator Health plans evaluated Objective: minimize costs
Total number of CABG procedures Not specified
Cost-effectiveness Any perspective Objective: minimize costs Change in outcome Change in cost of
producing outcome
25
Readmissions
Large purchasers such as Medicare have used readmissions (admission to a hospital for the same diagnosis within a short time period following a discharge) as a measure of efficiency. While readmissions are certainly a signal of a quality problem (for example, premature discharge) and represent a cost to Medicare, it is less clear how they can be used as an efficiency measure. Neither the output nor the input is clearly specified and the readmission itself is only one sign of a problem (death prior to readmission or admission to an urgent care or other facility being two other examples). In our typology, these measures would not be included as efficiency measures. Procedure Rates
To minimize costs, purchasers have requested information from health plans on the rates at which certain high cost procedures (e.g., coronary artery bypass graft surgery) are performed. The rate may be constructed within age groups in the population. The surgical procedure rate could be considered the output, but no inputs are specified. Purchasers may intend to interpret higher rates as being a sign of an efficiency problem. Alternatively, purchasers may interpret higher rates as indicators of economies of scale. The rate, by itself, is difficult to interpret. Previous work has shown no relationship between the rates at which procedures are performed and the proportion of such procedures that are clinically inappropriate.9 Cost-Effectiveness
We specifically did not include cost-effectiveness as a type of efficiency measure. The methods for assessing cost-effectiveness typically answer the question—is this technology a good value relative to the alternatives? The judgment is made by reference to a standard threshold such as $200,000 spent per life year saved and the evaluation is generally done on a narrow question (procedure A versus medication B for condition C) for a particular setting or set of assumptions. The answer may be monetary (the dollars spent per life year saved) or dichotomous (yes or no). But within that general framework the analysis does not produce information about whether one institution or provider does the intervention more efficiently than another. The results of a CEA analysis could be used to construct an efficiency measure, for example, “the proportion of people with an episode of care for condition C who are treated with procedure A instead of medication B” where the input is the use of either procedure A or medication B and the output is an episode of care for condition C, and the specifications for A, B, and C are all defined. We did not believe that an assessment of the large literature on CEA would provide new measurement tools.
Economic Efficiency for Society as a Whole
Thus far we have focused on efficiency from the perspective of specific entities within society. Efficiency for society as a whole, or “social efficiency,” means that some entity can be better off only if some other entity is made worse off,10 that is, it concerns the allocation of resources across the entire society.
26
Efficiency from the perspective of each individual provider and intermediary is necessary for social efficiency, but it is not enough. Consider again the preceding example of the health plan and physicians. MD3 views himself as efficient because his total input cost is lowest among the three doctors. The health plan also views MD3 as efficient, because his charge to the plan is lowest. Nevertheless, the charge exceeds the input cost, perhaps because MD3 has a strong reputation and charges accordingly. This difference between charges and costs is a potential source of inefficiency for society as a whole. The delivery of additional services at a price above input costs and below current charges could be a win-win situation for the plan and doctors if the services are necessary and appropriate. Similarly, the price that employers are charged for health-plan coverage may exceed the plan’s cost.
Society also includes those who need to consume health care. Consumers desire good health and hence value high-quality outcomes. Their interests diverge from those of providers and intermediaries in financial matters; consumers prefer to pay less for good health, so as to enjoy more of other goods (e.g., housing). Whether consumers obtain more or less of the value created by health care is not the issue, however.
The test for social efficiency is whether imperfect relations between various entities lead to situations in which the value to be shared among entities is less than was possible. The issue is whether society fails to make the most of win-win opportunities. Some examples are again helpful.
Providers may supply less output than is ideal for society as a whole. Take for example the “scale” of a hospital’s operations. Higher volume is associated in some instances with better outcomes.11 If “practice makes perfect,” a hospital may nevertheless opt for a scale too small to exploit these benefits because reimbursement is not adequate or access to capital markets is limited. The hospital’s perspective would not be aligned with that of society.
On the other hand, a hospital may supply more output than is ideal. Some observers believe that under the old paradigm of cost-based reimbursement, hospitals could make profits by investing in specialty services such as open heart surgery centers (see the literature review in Dranove and Satterthwaite, 200012). The costs to society of redundant facilities were arguably not justified by their benefits. Evaluating the efficient supply of outputs raises an interesting question about perspective; taking the perspective of the nation, we might conclude that supply is excessive. If, however, one looks at a smaller geographic unit (state, county, metropolitan area), one might reach a different conclusion about the relationship between supply and societal need.
There could also be too much output due to consumer behavior. Consider a vision-impaired patient with a modest desire for cataract eye surgery. With generous vision insurance, the patient would opt for the surgery, because the benefit he experiences outweighs the cost he faces. It seems likely, however, that the costs to purchasers and society at large exceed the benefit.13 These examples demonstrate that the relationship between output and social efficiency is uncertain in general.
Moving beyond output, the fragmented structure of health financing in the U.S. has raised concerns about the system’s administrative burden. This may be an issue of social rather than provider/intermediary efficiency. There is some evidence that billing-and-insurance-related costs are indeed substantial.14 A health plan probably does not weigh the impact of its decision to participate in a market on providers’ administrative costs. There may therefore be more plans than is good for society as a whole. Working in the other direction, competition in the market for health insurance can lower prices, benefiting purchasers and consumers. Moreover, policies that “simplify insurance product design” may significantly restrict consumer choice.15

27
As a final example, consider the adoption of health information technology, such as computer physician order entry. This technology is expensive for doctors and its benefits vis-à-vis higher quality and reduced cost are often shared with other entities. Thus, doctors will tend to invest less in health-information technology than would be desirable (efficient) for society as a whole. Some have followed this logic in advocating Medicare subsidies for adoption, suggesting that Medicare’s perspective is closely aligned with that of society overall.16 Although any particular doctor plays a limited role in the health system and sometimes even in a patient’s overall care, Medicare is involved in its beneficiaries’ care across providers and over an extended period.
Taken together, these examples suggest that there are many reasons, unrelated to inefficiency from the perspectives of individual providers and intermediaries, why health care may be socially inefficient. Indeed, it has long been believed that this perspective is relatively problematic.17
Despite the importance of social efficiency in this context, we were unable to identify existing measures, as the next chapter explains. A potential explanation is that measuring social efficiency is quite challenging. In particular, a measure must account for the benefits and costs of a situation to all entities in society.
To the extent that entities desire to evaluate social efficiency, the development of adequate measures would need to be part of a future research agenda.
Evidence Sources and Searches Literature Searches/Search Strategy
The RAND Library staff performed the searches on Medline® and EconLit for articles. Members of the project team worked closely with the TEP and the librarians to refine the search strategy. We searched published articles in the English language, appearing in journals between the years 1990 and 2005, and involving human subjects. We also performed “reference mining” by searching the bibliographies of retrieved articles for additional relevant publications. All of these searches were conducted during December 2005. The search strategies can be found in Appendix B*. Vendors and Stakeholder Interviews
Because we expected some of the most well known efficiency measures might not appear in the published literature, we developed a list of organizations that we knew had developed or were considering developing their own efficiency measures. We used a purposive reputational sampling approach. This identified the eight leading vendors of proprietary efficiency measures and five national or regional leaders in quality and efficiency measurements and improvements. We contacted key people at these organizations in an attempt to collect the information necessary to describe and compare their efficiency measure to those we abstracted from articles.
* Appendixes for this report are provided electronically at http://www.ahrq.gov/downloads/pub/evidence/pdf/efficiency/efficiency.pdf.
28
The vendor organizations selected are major developers of proprietary software used as efficiency measurement tools. The stakeholder organizations selected are either national leaders in quality and efficiency measurement and improvement (e.g., The Leapfrog Group, AQA, and NCQA) or regional coalitions with a history of performance measurement and reporting (e.g., IHA in California and the Employer Health Care Alliance Cooperative, also known as The Alliance, in Wisconsin).
Technical Expert Panel
This report was guided by a Technical Expert Panel (TEP). We invited a distinguished group of stakeholders and experts to participate in the TEP for this report. The TEP conference call was held in February 2005 and subsequent one-on-one conversations occurred between the project team and individual TEP members throughout the project. The TEP provided valuable feedback on the typology and possible organizations to contact. The TEP reviewed the final draft of this report. A list of the TEP members can be found in Appendix D*.
Title Screening, Article Review, and Selection of Individual Studies
Study Selection
Two researcher reviewers conducted the study selection process and selected studies for further review. Each reviewer independently reviewed the documents or studies and disagreements were resolved by consensus. Dual review was used at all stages of the project. The principal investigators and the experts involved in the project resolved any questions or needs for clarification that arose throughout the literature review. Reviewers screened all titles found through our Medline® and EconLit searches or that were submitted by content experts for pertinence to the key questions and therefore their relevance to this project.
We adopted the following exclusion criteria that were applied at both the title/abstract and article screening phases:
• Cost-effectiveness of treatment or product • Effect of health on labor productivity • Efficiency is not stated as an outcome but implications of findings for efficiency are
discussed.
Approved titles moved on to the article screening phase. We ordered all articles that were accepted and sent them out for further review based on topic area.
* Appendixes for this report are provided electronically at http://www.ahrq.gov/downloads/pub/evidence/pdf/efficiency/efficiency.pdf.
29
Data Abstraction
We designed a one-page data collection instrument specifically for this project and pilot-tested it with all reviewers. This screener (see Appendix C*) contained questions about the focus of the document, research topic, proprietary efficiency measures, location, and the type of paper. The article screener phase included the same exclusion criteria as the title review stage. Therefore, we excluded abstracts that clearly dealt with topics other than efficiency of the following entities:
• Clinicians (individual or group) • Hospitals • Nursing homes • Long-term care hospital wards • Primary health centers • Systems (plans, medical groups, hospital chains, VA) • Countries • Other providers.
Articles that focused on background or were reviews/meta-analyses were marked for separate
examination, as described below. Project staff entered data from the forms into an electronic database and tracked all studies through the screening process.
Articles accepted at the screening stage were subjected to full abstraction using a standardized abstraction form. Some studies or documents described only measure development whereas others described use in an actual population. Due to the volume of articles accepted at the screening stage, the team only abstracted articles or documents accepted in the first round of screening that focused on efficiency measures in the United States exclusively. We did not include efficiency measures that were used to compare the United States with other countries.
Peer Review Process
We identified 15 potential stakeholders who would be interested in using efficiency measures, and sent them a draft document for review. In addition, each TEP member was asked to review the draft. The list of reviewers and organizations can be found in Appendix D*. A blinded list of all comments received, organized by section of the report, is presented in Appendix E*, accompanied by our response to each comment.
* Appendixes for this report are provided electronically at http://www.ahrq.gov/downloads/pub/evidence/pdf/efficiency/efficiency.pdf.

31
Chapter 3. Results
Literature Flow
The electronic literature search identified 4,324 titles (Figure 2). An additional five articles were suggested from a conference attended by the principal investigator. Reference mining identified another 113 potentially relevant titles.
Of the titles identified through our electronic literature search, 3,692 were rejected as not relevant to our project, leaving 632 total from all sources. Repeat review by the research team excluded an additional 62 titles. Seven titles could not be located even after contracting with Infotrieve, a private service that specializes in locating obscure and foreign scientific publications. A total of 563 articles were retrieved and reviewed.
Screening of retrieved articles/reports resulted in exclusion of 245: 145 due to research topic (research topic was not health care efficiency measurement); 93 that did not report the results of an efficiency measure); 6 duplicate articles that were accidentally ordered; and 1 article with duplicate data. The remaining 318 articles were accepted for detailed review. Because of the volume of articles, we considered as first priority only those studies that reported efficiency using U.S. data sources. There were 158 such articles. (For a list of excluded studies, please refer to Appendix F*).
Overview of Article Abstraction
The focus of the majority of articles on health care efficiency has been the production of hospital care. Of the 158 priority articles abstracted, 93 articles (59%) containing 155 measures examined the efficiency of hospitals. Studies of physician efficiency were second most common (33 articles, 21%, 45 measures), followed by much smaller numbers of articles focusing on the efficiency of nurses, health plans, other providers, or other entities. None of the abstracted articles reported the efficiency of health care at the national level, although two articles focused on efficiency in the Medicare program.
Articles were considered to contain an efficiency measure if they met our definition presented earlier—i.e., they included a measurement of the inputs used to produce a health care output. We abstracted 250 efficiency measures, summarized in Table 6 and listed in detail in Appendix G*. The measures are organized according to the typology presented above: by perspective, outputs, and inputs. However, perspective—which asks who is the evaluator, who is being evaluated, and what are the objectives—could not be abstracted adequately from most articles, and is represented by unit of analysis in Table 6 and the discussion.
* Appendixes for this report are provided electronically at http://www.ahrq.gov/downloads/pub/evidence/pdf/efficiency/efficiency.pdf.
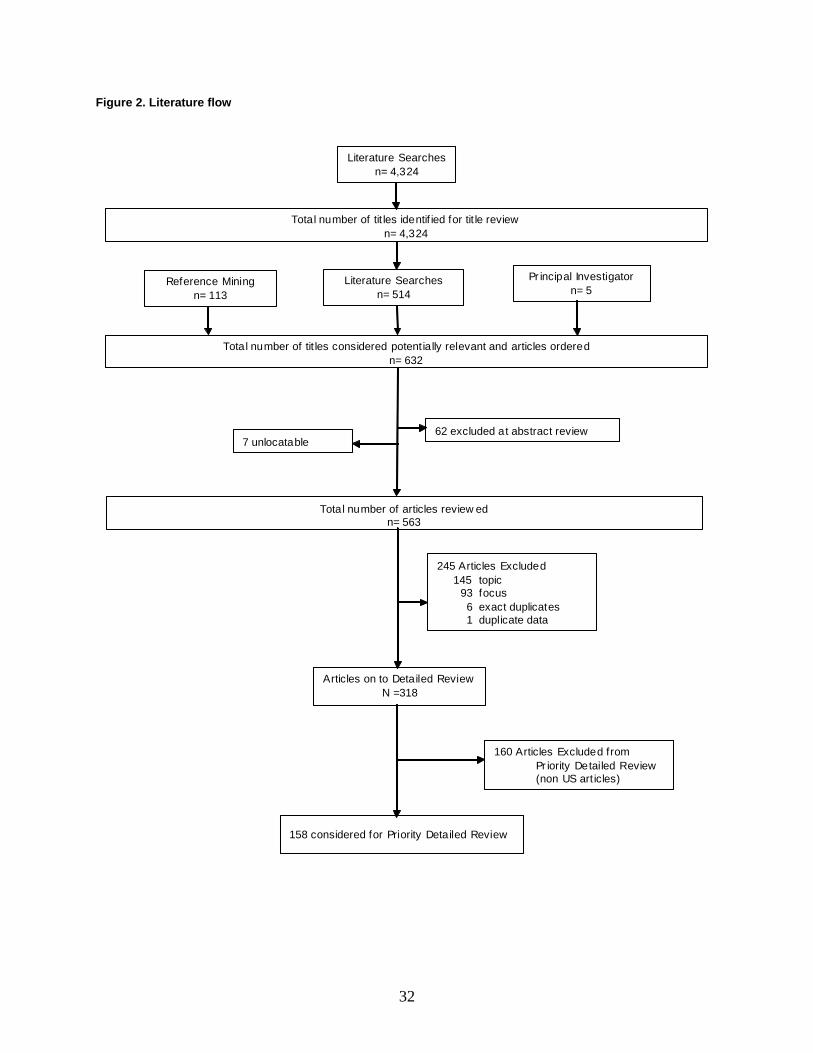
32
Figure 2. Literature flow
Total number of tit les identif ied for tit le reviewn= 4,324
Reference Miningn= 113
Literature Searchesn= 4,324
Literature Searches n= 514
245 Articles Excluded145 topic
93 focus6 exact duplicates1 duplicate data
Total number of articles review edn= 563
62 excluded at abstract review7 unlocatable
Pr incipal Investigatorn= 5
158 considered for Priority Detailed Review
Figure 2. Literature Flow
Articles on to Detailed ReviewN =318
Total number of tit les considered potentially relevant and articles orderedn= 632
160 Articles Excluded from Pr iority Detailed Review (non US art icles)
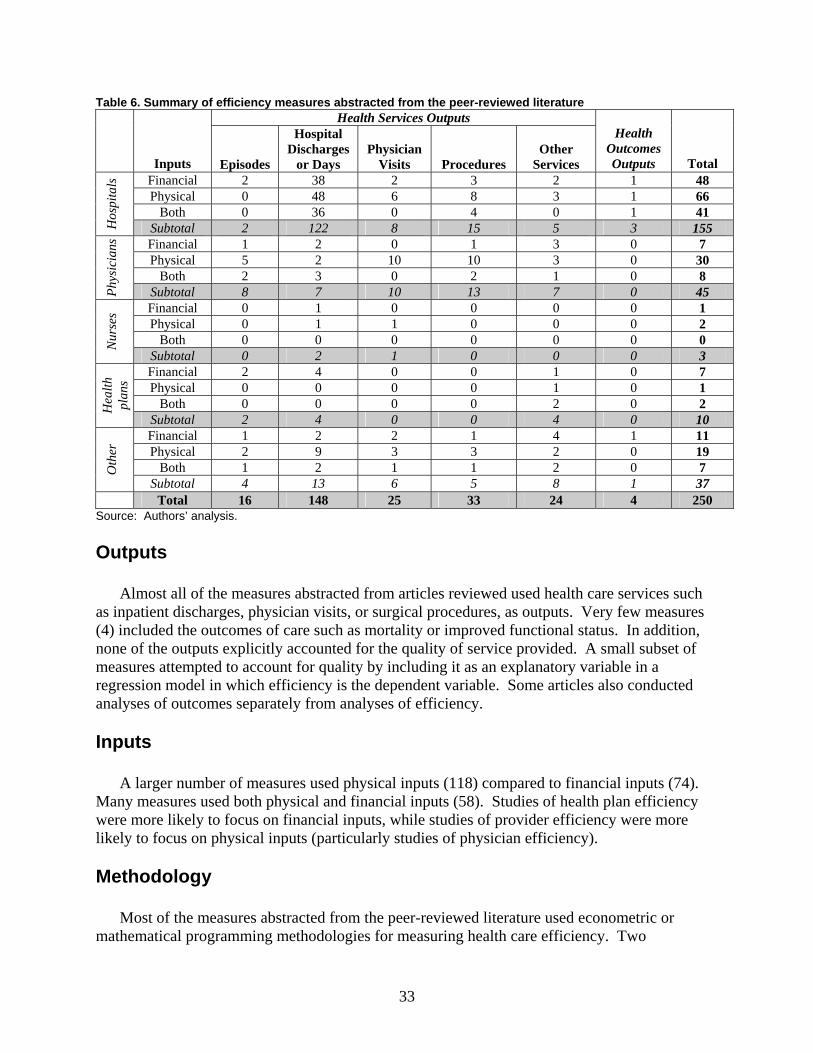
33
Table 6. Summary of efficiency measures abstracted from the peer-reviewed literature Health Services Outputs
Inputs Episodes
Hospital Discharges
or Days Physician
Visits Procedures Other
Services
Health Outcomes Outputs Total
Financial 2 38 2 3 2 1 48 Physical 0 48 6 8 3 1 66
Both 0 36 0 4 0 1 41
Hos
pita
ls
Subtotal 2 122 8 15 5 3 155 Financial 1 2 0 1 3 0 7 Physical 5 2 10 10 3 0 30
Both 2 3 0 2 1 0 8
Phys
icia
ns
Subtotal 8 7 10 13 7 0 45 Financial 0 1 0 0 0 0 1 Physical 0 1 1 0 0 0 2
Both 0 0 0 0 0 0 0 Nur
ses
Subtotal 0 2 1 0 0 0 3 Financial 2 4 0 0 1 0 7 Physical 0 0 0 0 1 0 1
Both 0 0 0 0 2 0 2 Hea
lth
plan
s
Subtotal 2 4 0 0 4 0 10 Financial 1 2 2 1 4 1 11 Physical 2 9 3 3 2 0 19
Both 1 2 1 1 2 0 7 Oth
er
Subtotal 4 13 6 5 8 1 37 Total 16 148 25 33 24 4 250
Source: Authors’ analysis. Outputs
Almost all of the measures abstracted from articles reviewed used health care services such as inpatient discharges, physician visits, or surgical procedures, as outputs. Very few measures (4) included the outcomes of care such as mortality or improved functional status. In addition, none of the outputs explicitly accounted for the quality of service provided. A small subset of measures attempted to account for quality by including it as an explanatory variable in a regression model in which efficiency is the dependent variable. Some articles also conducted analyses of outcomes separately from analyses of efficiency. Inputs
A larger number of measures used physical inputs (118) compared to financial inputs (74). Many measures used both physical and financial inputs (58). Studies of health plan efficiency were more likely to focus on financial inputs, while studies of provider efficiency were more likely to focus on physical inputs (particularly studies of physician efficiency). Methodology
Most of the measures abstracted from the peer-reviewed literature used econometric or mathematical programming methodologies for measuring health care efficiency. Two
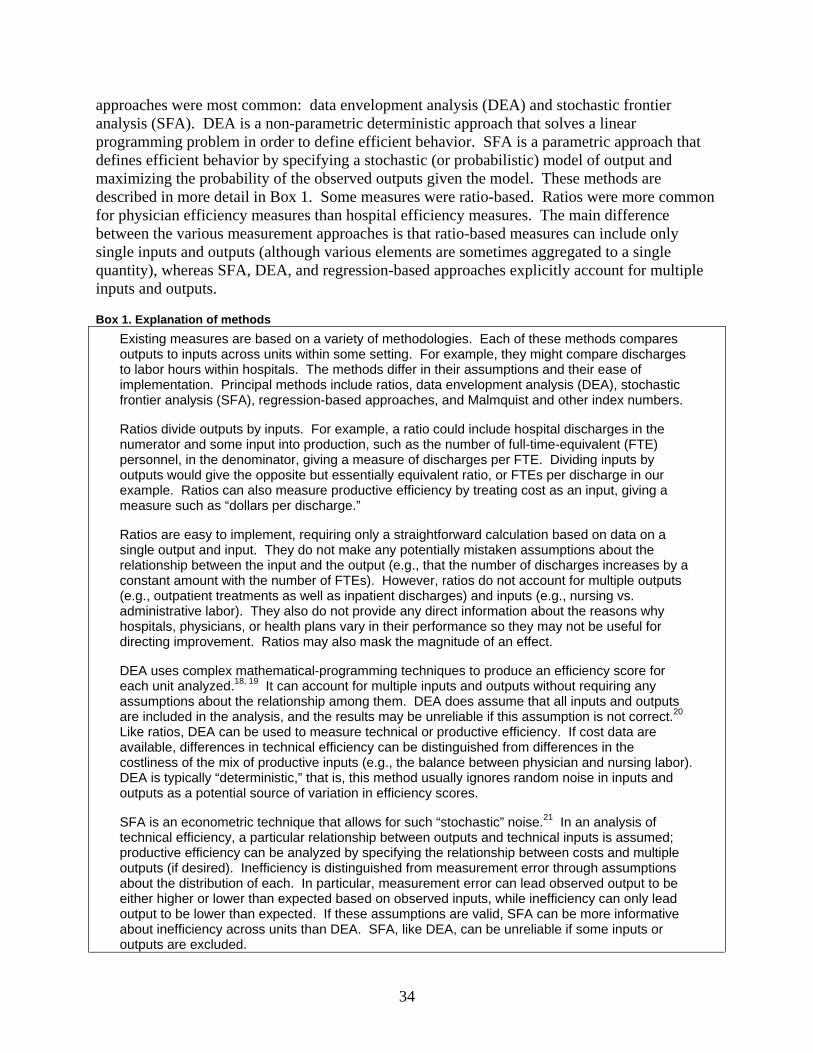
34
approaches were most common: data envelopment analysis (DEA) and stochastic frontier analysis (SFA). DEA is a non-parametric deterministic approach that solves a linear programming problem in order to define efficient behavior. SFA is a parametric approach that defines efficient behavior by specifying a stochastic (or probabilistic) model of output and maximizing the probability of the observed outputs given the model. These methods are described in more detail in Box 1. Some measures were ratio-based. Ratios were more common for physician efficiency measures than hospital efficiency measures. The main difference between the various measurement approaches is that ratio-based measures can include only single inputs and outputs (although various elements are sometimes aggregated to a single quantity), whereas SFA, DEA, and regression-based approaches explicitly account for multiple inputs and outputs. Box 1. Explanation of methods
Existing measures are based on a variety of methodologies. Each of these methods compares outputs to inputs across units within some setting. For example, they might compare discharges to labor hours within hospitals. The methods differ in their assumptions and their ease of implementation. Principal methods include ratios, data envelopment analysis (DEA), stochastic frontier analysis (SFA), regression-based approaches, and Malmquist and other index numbers. Ratios divide outputs by inputs. For example, a ratio could include hospital discharges in the numerator and some input into production, such as the number of full-time-equivalent (FTE) personnel, in the denominator, giving a measure of discharges per FTE. Dividing inputs by outputs would give the opposite but essentially equivalent ratio, or FTEs per discharge in our example. Ratios can also measure productive efficiency by treating cost as an input, giving a measure such as “dollars per discharge.” Ratios are easy to implement, requiring only a straightforward calculation based on data on a single output and input. They do not make any potentially mistaken assumptions about the relationship between the input and the output (e.g., that the number of discharges increases by a constant amount with the number of FTEs). However, ratios do not account for multiple outputs (e.g., outpatient treatments as well as inpatient discharges) and inputs (e.g., nursing vs. administrative labor). They also do not provide any direct information about the reasons why hospitals, physicians, or health plans vary in their performance so they may not be useful for directing improvement. Ratios may also mask the magnitude of an effect. DEA uses complex mathematical-programming techniques to produce an efficiency score for each unit analyzed.18, 19 It can account for multiple inputs and outputs without requiring any assumptions about the relationship among them. DEA does assume that all inputs and outputs are included in the analysis, and the results may be unreliable if this assumption is not correct.20 Like ratios, DEA can be used to measure technical or productive efficiency. If cost data are available, differences in technical efficiency can be distinguished from differences in the costliness of the mix of productive inputs (e.g., the balance between physician and nursing labor). DEA is typically “deterministic,” that is, this method usually ignores random noise in inputs and outputs as a potential source of variation in efficiency scores. SFA is an econometric technique that allows for such “stochastic” noise.21 In an analysis of technical efficiency, a particular relationship between outputs and technical inputs is assumed; productive efficiency can be analyzed by specifying the relationship between costs and multiple outputs (if desired). Inefficiency is distinguished from measurement error through assumptions about the distribution of each. In particular, measurement error can lead observed output to be either higher or lower than expected based on observed inputs, while inefficiency can only lead output to be lower than expected. If these assumptions are valid, SFA can be more informative about inefficiency across units than DEA. SFA, like DEA, can be unreliable if some inputs or outputs are excluded.
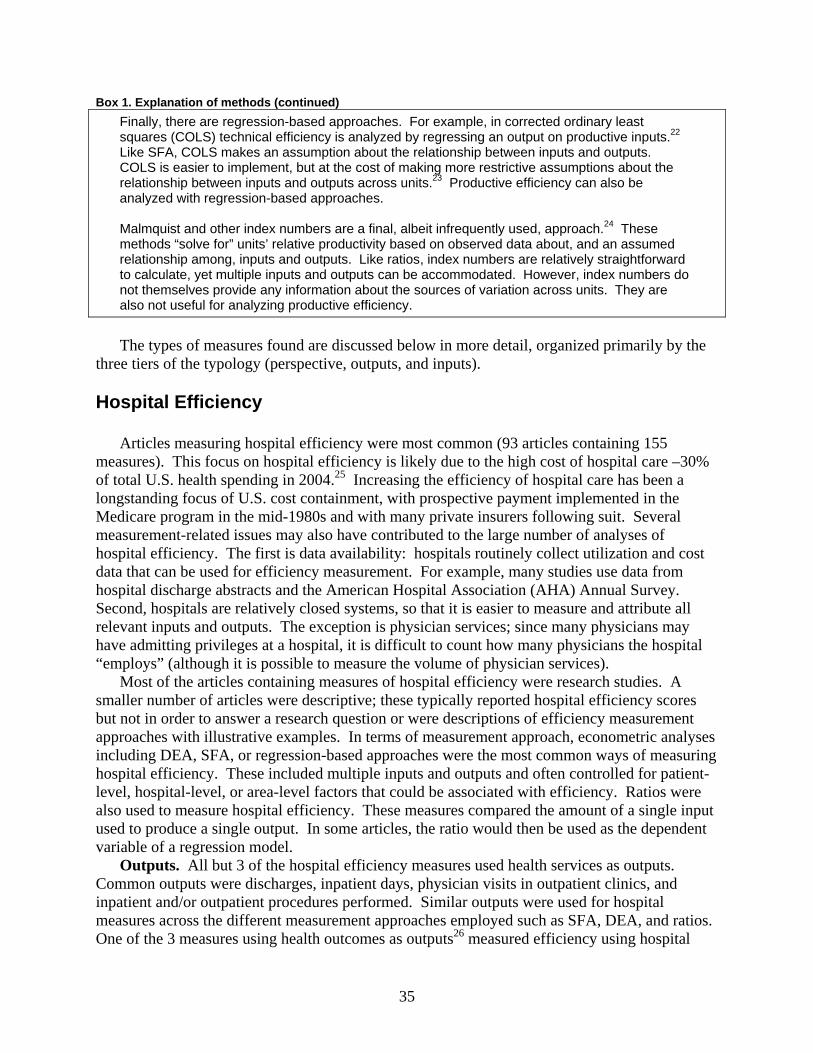
35
Box 1. Explanation of methods (continued) Finally, there are regression-based approaches. For example, in corrected ordinary least squares (COLS) technical efficiency is analyzed by regressing an output on productive inputs.22 Like SFA, COLS makes an assumption about the relationship between inputs and outputs. COLS is easier to implement, but at the cost of making more restrictive assumptions about the relationship between inputs and outputs across units.23 Productive efficiency can also be analyzed with regression-based approaches. Malmquist and other index numbers are a final, albeit infrequently used, approach.24 These methods “solve for” units’ relative productivity based on observed data about, and an assumed relationship among, inputs and outputs. Like ratios, index numbers are relatively straightforward to calculate, yet multiple inputs and outputs can be accommodated. However, index numbers do not themselves provide any information about the sources of variation across units. They are also not useful for analyzing productive efficiency.
The types of measures found are discussed below in more detail, organized primarily by the
three tiers of the typology (perspective, outputs, and inputs). Hospital Efficiency
Articles measuring hospital efficiency were most common (93 articles containing 155 measures). This focus on hospital efficiency is likely due to the high cost of hospital care –30% of total U.S. health spending in 2004.25 Increasing the efficiency of hospital care has been a longstanding focus of U.S. cost containment, with prospective payment implemented in the Medicare program in the mid-1980s and with many private insurers following suit. Several measurement-related issues may also have contributed to the large number of analyses of hospital efficiency. The first is data availability: hospitals routinely collect utilization and cost data that can be used for efficiency measurement. For example, many studies use data from hospital discharge abstracts and the American Hospital Association (AHA) Annual Survey. Second, hospitals are relatively closed systems, so that it is easier to measure and attribute all relevant inputs and outputs. The exception is physician services; since many physicians may have admitting privileges at a hospital, it is difficult to count how many physicians the hospital “employs” (although it is possible to measure the volume of physician services).
Most of the articles containing measures of hospital efficiency were research studies. A smaller number of articles were descriptive; these typically reported hospital efficiency scores but not in order to answer a research question or were descriptions of efficiency measurement approaches with illustrative examples. In terms of measurement approach, econometric analyses including DEA, SFA, or regression-based approaches were the most common ways of measuring hospital efficiency. These included multiple inputs and outputs and often controlled for patient-level, hospital-level, or area-level factors that could be associated with efficiency. Ratios were also used to measure hospital efficiency. These measures compared the amount of a single input used to produce a single output. In some articles, the ratio would then be used as the dependent variable of a regression model.
Outputs. All but 3 of the hospital efficiency measures used health services as outputs. Common outputs were discharges, inpatient days, physician visits in outpatient clinics, and inpatient and/or outpatient procedures performed. Similar outputs were used for hospital measures across the different measurement approaches employed such as SFA, DEA, and ratios. One of the 3 measures using health outcomes as outputs26 measured efficiency using hospital
36
payments per life saved for patients in a single DRG (tracheostomy except for mouth, larynx, and pharynx disorder). Few of the outputs used in the measures accounted for differences in the quality or outcomes of the hospital care provided (i.e., quality was assumed to be equivalent). Several articles (e.g., Zuckerman, 199427) attempted to adjust for quality by entering it as an explanatory variable in regression models of hospital efficiency. Many measures adjusted for the case-mix of the outputs.
Inputs. The hospital efficiency measures were divided between measures using physical inputs and financial inputs, with more measures using physical inputs.
Physical inputs. About two thirds of the hospital efficiency measures (107 of 155 measures from 93 articles) included physical inputs. There were 66 measures that included only physical inputs and 41 measures that included both physical and financial inputs. These measures typically were used to compare the amount of labor, capital, and other resources used to produce outputs such as discharges and outpatient visits. The specific inputs used in the hospital efficiency measures varied widely between measures. There were 40 different inputs used. The average measure used four different inputs. Common physical inputs included:
• Physician labor—number of physicians (usually FTEs) or hours worked—can be difficult to measure since many physicians may have admitting privileges but generally a few account for the majority of admissions
• Nursing labor—number of nurses (usually FTEs) or hours worked—often split into various categories such as RNs and LPNs
• Administrative, technical, or other labor categories—number of personnel (usually FTEs) or hours worked
• Beds—the number of beds was used as the most common indicator of capital stock • Depreciation of assets—a measure of capital, calculated in various ways.
An example of a measure that uses multiple physical inputs and multiple health services
outputs comes from Grosskopf.1 This DEA-based measure used the following inputs (counts): physicians; nurses; other personnel; and hospital beds. As outputs it used (again, counts): outpatient procedures; inpatient procedures; physician visits in outpatient clinics; hospital discharges; and emergency visits. In comparison, a typical example of a measure that uses a single physical input and health services output (ratio) was the number of hospital days (input) divided by the number of discharges (output)—the average length of stay.2
Financial inputs. About one half of the hospital efficiency measures included financial inputs. These measures typically compare the cost of producing health services outputs such as discharges and outpatient visits. For example, Rosko et al.28, 29 measured the total cost, including the costs of labor and capital separately, to produce case-mix-adjusted discharges and physician visits in hospital clinics, adjusting for provider- and area-level characteristics and estimated using SFA. A common example of a ratio-based measure using financial inputs is the total cost (inputs) used to produce case-mix-adjusted discharges (outputs).
Physician Efficiency
Physician efficiency measures constituted the second most common category (33 articles containing 45 measures). One possible explanation for the paucity of physician efficiency measures relative to hospital efficiency measures is that the methodology for measuring
37
physician efficiency has developed more recently (e.g., methods of grouping episodes of care to use as outputs). Data sources covering physician care across multiple settings and types of care, including pharmaceuticals, are more difficult to collect and aggregate than data covering hospital stays.
Compared with the literature on hospital efficiency measurement, the physician efficiency literature included more descriptive articles. Approximately half of the articles containing physician efficiency measures were descriptive and half were research. Ratios were the most common methodology used in the physician efficiency measures, although multivariate approaches such as SFA and DEA were also common.
Outputs. All of the physician efficiency measures used health services as outputs. Similar to the hospital efficiency literature, none of the measures of physician efficiency accounted for the quality or outcome of the care provided. The types of health services used as outputs varied widely between measures, depending on the focus of the article. Common outputs included episodes of care and relative value units.
Inputs. Most of the physician efficiency measures (30 of 45) used physical inputs only. There were 7 measures that used financial inputs and 8 that used both physical and financial inputs.
Physical inputs. Ratio-based physician measures using physical inputs often compared the amount of service output produced per physician over a period of time. An example of a typical measure30 would be the relative value units of care provided per physician per month. Another common ratio-based physician measure using physical inputs was the number of visits per physician per week or month (e.g., Garg, 199131).
DEA was used for six measures using physical inputs. An example32 used DEA to measure the amount of drugs, physician visits, ER visits, and lab/diagnostic tests used to produce an episode of care.
Financial inputs. There were 7 physician measures using only financial inputs. Three measures used ratios to compare the efficiency of physicians. A typical ratio-based measure33 using financial inputs compared per-member per-year costs (input: costs, output: covered lives) for physicians with responsibility for a defined patient population, controlling for case-mix and other patient characteristics. In this article, the ratio was then used as the dependent variable of a regression to examine the association between payment methods and efficiency. Another article34 measured total costs per episode; it used a regression-based approach to examine the effect of risk adjustment on efficiency measurement using Episode Treatment Groups.
Health Plans
There were nine articles containing ten measures focusing on health plan efficiency. The small number of articles focusing on health plan efficiency is surprising given the rapid increases in health plan premiums that employers and other purchasers of health insurance have faced in recent years. All nine of the articles containing health plan efficiency measures were research articles.
There was very little consistency in the approaches used to measure health plan efficiency. The most common approach was to compare the average amount of physical inputs (e.g., physician visits, hospital days) used by health plan beneficiaries over a period of time. Econometric methods, mostly DEA, were used in all of the measures except one ratio-based measure. The one ratio-based measure was the cost per episode of care.35
38
Outputs. Four of the health plan efficiency measures used covered lives as the sole output. Two articles, both by Cutler and colleagues,35, 36 used episodes of care, focusing on a specific condition (acute myocardial infarction). The three remaining articles used utilization counts as outputs, including multiple types of services such as physician visits and hospital days.
Inputs. Seven of the health plan efficiency measures used financial inputs. Only one measure used only physical inputs; two used both physical and financial inputs.
The three measures including physical inputs all used DEA (one article also used SFA and another regression-based approach) to analyze the production of covered lives using multiple inputs. Two of these articles used utilization counts as inputs (hospital days, physician visits, etc.). These same variables were used as outputs in several measures of productive efficiency in health plans.
Four measures using only financial inputs used DEA or a regression-based approach to compare the total costs of producing multiple outputs (hospital days, physician visits, etc.). One article used SFA to measure cost per covered life. Finally, two measures used by Cutler et al. (described above) used either ratios35 or regressions36 to compare costs per episodes of care for a specific medical condition. Nurses
There were three articles containing three measures focusing on nursing efficiency. The measures described in these articles were all based on ratios, with two articles providing a descriptive, rather than a model based, analysis. One article was unique in the sense that it used a simulation approach, rather than empirical data. Two articles used the number of hospital discharges as the output; the third used the number of non-physician visits. Commonly used inputs included the number of nurses, nurses’ time, and labor cost. Other Categories
Geographic Areas. Two articles37, 38 compared the efficiency of hospital care between geographic areas. Both were by the same primary author and used DEA to measure the amount of various physical inputs used to produce physician visits and hospital discharges. These measures were similar to those used in hospital-focused articles, but were aggregated to the regional level.
Medicare. Two articles examined the efficiency of the Medicare program. One article39 reported on an analysis of trends in costs per hospital discharge and average length of hospital stay in hospitals paid by Medicare over time. Another article40 contained an analysis of the efficiency of the Medicare program using an area-level analysis, building on information from the Dartmouth Atlas of Health Care. The efficiency measure was a comparison of Medicare expenditures (inputs) used to produce survival (outputs) between regions. A simple comparison shows a negative relationship—areas with lower survival rates have higher Medicare expenditures. However, this comparison has a problem of reverse causation. Regions with a more severe case mix are expected to have higher spending, but higher spending is also expected to increase survival (other things being equal). In order to address this issue, an instrumental variables approach was used (intensity of care in the last six months of life was used as the primary instrument) to model regional survival rates as a function of Medicare expenditures.
39
Integrated Delivery Systems. Two articles, both by the same primary author, compared the efficiency of integrated delivery systems. One article included multiple measures of physical inputs;41 the other included one measure using physical inputs and one measure using financial inputs.42 The article with multiple measures included two ratios (average length of stay and days of care per bed) and one DEA-based measure. The DEA measure included beds, ambulatory surgical centers, and total facilities as inputs, and inpatient/outpatient procedures and discharges as outputs. The second article included a similar DEA measure and a ratio-based measure using financial inputs, costs per hospital discharge.
Other Units. There were several units of observation where efficiency was measured in only one article. These included articles focusing on efficiency in community-based youth services,43 physician assistants,44 general practice medical residents,45 area agencies on aging,46 community mental health centers,47 hospital cost centers,48 dialysis centers,49 hospital pharmacies,50 medical groups,51 mental health care programs,52 organ procurement organizations,53 outpatient substance abuse treatment organizations,54 and cancer detection programs.55
Additional Observations on Measurement Methods
In this section we will describe the methods behind the efficiency measures abstracted from articles in some more detail. In doing so, we will not distinguish between the units of observations as we did in the previous section. Data Sources
Most of the measures abstracted from the peer-reviewed literature were based on available secondary data sources, most commonly claims or other administrative data. Of the 158 articles containing efficiency measures, 109 used available secondary data sources. The remaining articles collected primary data for the purpose of efficiency measurement (38 articles) or did not report their data source (11 articles). Sample Size
Seventy-eight percent of the articles examined data at the level of the unit of observation for which efficiency was estimated (e.g., the physician or hospital). Fourteen percent, in addition, examined data on the individual-patient level. Sample sizes varied between 1 and 6,353 for the former, and 57 and 1,661,674 for the latter. Explanatory Variables
The majority of articles (70%) examined one or more explanatory variables, either to control for certain confounding variables (e.g., case-mix, market concentration), or to explain efficiency differences by some observed characteristic (e.g., whether the hospital was under public or private ownership).56 In 52% of the articles, at least one measure was used in combination with provider characteristics as explanatory variables. Similarly, 29% used area characteristics as
40
explanatory variables, 14% of the articles included (diagnosis-unrelated) patient characteristics such as age and gender, and 42% included diagnosis-based case-mix information. Time Frame
The time frame used by each study varied; 46% of articles examined efficiency at one point in time and based their findings on a single year of data (cross-sectional study design) and 54% of the articles used data from multiple years, and in some cases tracked efficiency over time (longitudinal design). Sensitivity Analysis and Testing of Reliability and Validity
Thirty-six percent of the articles tested the robustness of their findings against alternative specifications of the models used. This approach, commonly known as sensitivity analysis, can provide helpful insights as the choice of a particular model is often somewhat arbitrary. In this regard, the number of articles that examined the sensitivity of their findings is surprisingly low. In addition, only four of the articles attempted to estimate the reliability and/or validity of the measures used.
Overview of Vendors and Stakeholder Interviews
The grey literature included efficiency measures developed and used by private groups that were otherwise not adequately captured in the peer-reviewed literature. We supplemented the information available in the grey literature with interviews of vendors and stakeholders. Ten organizations were contacted using a purposive reputational sampling approach. We identified organizations that had either developed measures of health care efficiency, were in the process of developing such measures, or were evaluating and choosing measures. These organizations were selected based on nominations by members of the study team, by the TEP, or by other interviewed stakeholders and vendors. Participation in a meeting on efficiency sponsored by AHRQ and The Alliance, convened in Madison, Wisconsin, in May 2006, also aided in the identification of potential developers of efficiency measures.
Eight of these organizations are vendors marketing proprietary measures. The other five organizations represent stakeholders who have been exploring the use of in-house or vendor-developed measures. The vendor organizations included major developers of proprietary software used as efficiency measurement tools. The stakeholder organizations selected were either national leaders in quality and efficiency measurement and improvement (e.g., The Leapfrog Group, AQA, and NCQA) or regional coalitions with a long history of performance measurement and reporting (e.g., IHA in California and the Employer Health Care Alliance Cooperative, also known as The Alliance, in Wisconsin).
The results presented here are based on information gathered from eight vendors and five stakeholders who responded to our request for an interview.
41
Efficiency Measures Identified Through the Grey Literature Review
Our scan identified eight major developers of proprietary software packages for measuring
efficiency. Other vendors (not included in our study) provide additional analytic tools, solution packages, applications, and consulting services that build on top of these platforms. Although some of the vendors’ measures were mainly developed for other purposes (e.g., risk adjustment) they all have been commonly used by payers and purchasers to profile the efficiency of provider organizations (e.g., hospitals, medical groups) and individual physicians. They have also been used in the selection of provider networks. In some cases they have also been used to create tiered insurance products, where patients are required to pay larger co-payments for visits to providers with lower efficiency scores. Activities to link provider profiling to pay-for-performance initiatives are underway.
These measures, for the purpose of assessing efficiency, generally take the form of a ratio, such as observed-to-expected ratios of costs per episode of care, adjusting for patient risk. None of these measures used SFA, DEA, or other multiple input, multiple output regression-based measurement approaches common in the efficiency measures abstracted from the peer-reviewed literature. Almost all of these measures rely on insurance claims data.
The measures fall into two main categories: episode-based or population-based. An episode-based approach to measuring efficiency uses diagnosis and procedure codes from claims/encounter data to construct discrete episodes of care, which are series of temporally contiguous health care services related to the treatment of a specific acute illness, a set time period for the management of a chronic disease, or provided in response to a specific request by the patient or other relevant entity.57 Efficiency is measured by comparing the physical and/or financial resources used to produce an episode of care. Attribution rules based on the amount of care provided by each provider are typically applied to attribute episodes to particular providers, after applying additional risk adjustment. Examples of episode-based approaches include:
• IHCIS-Symmetry of Ingenix: Episode Treatment Groups (ETGs) Episode Treatment Groups (ETGs), developed by IHCIS-Symmetry of Ingenix, create distinct episodes of care and categorize them based on the relevant clinical condition and the severity of that condition. An episode of care is the unique occurrence of a condition for an individual and the services involved in diagnosing, managing, and treating that condition. ETGs use the diagnosis and procedural information on an individual’s billed claims for medical and pharmacy services to identify distinct episodes of care for the individual.
• Thomson Medstat: Medstat Episode Groups (MEG) Medstat Episode Groups (MEGs), developed by Thomson Medstat, apply the disease staging approach to classify discrete episodes of care into disease stages. The disease staging criteria define levels of biological severity or pathophysiologic manifestations for specific medical conditions—episodes of care. Staging is driven by the natural history of
42
the disease. Contrary to the ETGs, treatments, whether medical or surgical, are not part of the disease staging classification of the MEGs.
• Cave Consulting Group: Cave Grouper The CCGroup Marketbasket System™ compares physician efficiency and effectiveness to a specialty-specific peer group using a standardized set of prevalent medical condition episodes with the intent of minimizing the influence of patient case mix (or health status) differences and methodology statistical errors. The Cave Grouper™ groups over 14,000 unique ICD-9 diagnosis codes into 526 meaningful medical conditions. The CCGroup EfficiencyCare™ Module takes the output from the Cave Grouper™ and develops specialty-specific physician efficiency scores that compare individual physician efficiency (or physician group efficiency) against the efficiency of a peer group of interest.
A population-based approach to efficiency measurement classifies a patient population
according to morbidity burden in a given period (e.g., one year). Efficiency is measured by comparing the costs or resources used to care for that risk-adjusted patient population for a given period. This approach is used when a single entity, such as a designated primary care provider or an insurance plan, can be assumed to be responsible for the efficiency of a defined patient population’s care for a given period. Examples of population-based approaches include:
• The Johns Hopkins University: Adjusted Clinical Groups (ACGs) The Adjusted Clinical Groups (ACGs), developed by researchers at the Johns Hopkins University, are used to evaluate efficiency with respect to the total health experience of a risk-adjusted population over a given period of time. The ACG system uses automated claims, encounter, and discharge abstracts data to characterize the level of overall morbidity in patients and populations. This person-focused approach assigns each individual to a single mutually exclusive ACG category, defined by patterns of morbidity over time, age, and sex.
• 3M Health Information Systems: Clinical Risk Grouping (CRG)
The Clinical Risk Grouping was developed by 3M Health Information Systems to classify patients into severity-adjusted clinically homogeneous groups. The CRG classification system can be used prospectively and retrospectively for both inpatient and ambulatory encounters. It uses demographic data, diagnostic codes and procedural codes to assign each individual to a single mutually exclusive risk group that relates the historical clinical and demographic characteristics of the individual to the amount and type of health care resources that individual will consume in the future.
• DxCG: Diagnostic Cost Groups (DCGs)
DxCG models work by classifying administrative data into coherent clinical groupings based on age, sex, diagnoses, and drug codes and applying hierarchies and interactions to create an aggregated, empirically valid measure of expected resource use. The measure, called a “relative risk score,” is calculated at the individual patient level and quantifies

43
the financial implications of the patient’s “illness burden” or morbidity. The classification systems are freely available and transparent.
• Health Dialog: Provider Performance Measurement System Provider Performance Measurement System examines the systematic effects of health services resources a person at a given level of comorbidity uses over a predetermined period of time (usually one year). Based on John Wennberg’s work, PPMS assesses and attributes unwarranted variations in the system with respect to three dimensions: (1) effective care; (2) preference sensitive care; and (3) supply sensitive care.
Table 7 provides a summary of key attributes of these vendor-developed measures. With
both episode- and population-based measures, the focus of measure development has mainly been on defining the output of the efficiency measures (the second level of our typology presented above). To be used as efficiency measures, vendors then customize and construct inputs by adding either or both the costs and resources used in the production of that output, pending specification needs of the users representing various perspectives (e.g., payers, health plans). Cost-based inputs can be constructed using either standardized pricing (e.g., Medicare pricing) or allowing the price to vary according to users’ specification.
These tools have had other uses in addition to efficiency measurement. For example, most of these tools have been used as methods for adjusting risk and case-mix. In addition, researchers use these grouping algorithms to risk adjust for resource utilization prediction, provider profiling, and outcomes assessment. Efforts to validate and test the reliability of these algorithms as tools to create relevant clinical groupings for comparison are documented in either internal reports or white papers. However, there is very little information available on efforts to validate and test the reliability of these algorithms specifically as efficiency measures (the available evidence is summarized in the next section). Table 7. Efficiency measures developed by vendors
Organization
Efficiency Measure Name Approach Description
IHCIS-Symmetry of Ingenix
Episode Treatment Groups (ETG)
Episode-based
The ETG™ methodology identifies and classifies episodes of care, defined as unique occurrences of clinical conditions for individuals and the services involved in diagnosing, managing, and treating that condition. Based on inpatient and ambulatory care, including pharmaceutical services, the ETG classification system groups diagnosis, procedure, and pharmacy (NDC) codes into 574 clinically homogenous groups, which can serve as analytic units for assessing and benchmarking health care utilization, demand, and management.
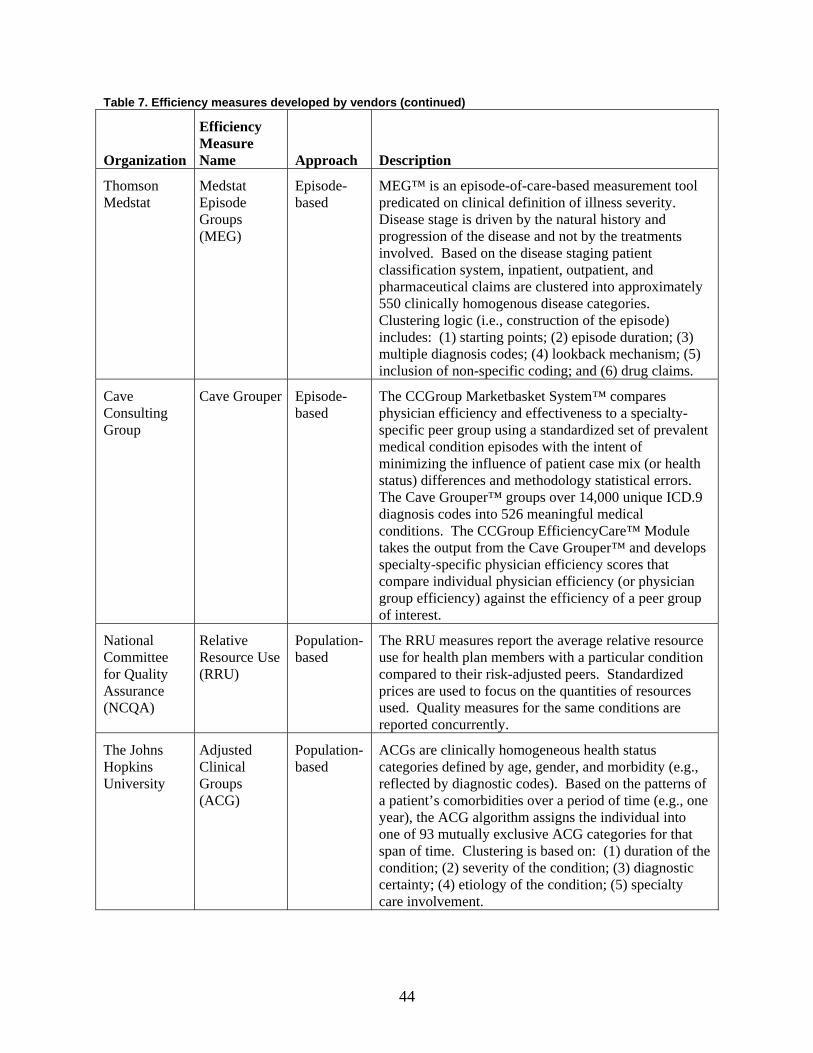
44
Table 7. Efficiency measures developed by vendors (continued)
Organization
Efficiency Measure Name Approach Description
Thomson Medstat
Medstat Episode Groups (MEG)
Episode-based
MEG™ is an episode-of-care-based measurement tool predicated on clinical definition of illness severity. Disease stage is driven by the natural history and progression of the disease and not by the treatments involved. Based on the disease staging patient classification system, inpatient, outpatient, and pharmaceutical claims are clustered into approximately 550 clinically homogenous disease categories. Clustering logic (i.e., construction of the episode) includes: (1) starting points; (2) episode duration; (3) multiple diagnosis codes; (4) lookback mechanism; (5) inclusion of non-specific coding; and (6) drug claims.
Cave Consulting Group
Cave Grouper Episode-based
The CCGroup Marketbasket System™ compares physician efficiency and effectiveness to a specialty-specific peer group using a standardized set of prevalent medical condition episodes with the intent of minimizing the influence of patient case mix (or health status) differences and methodology statistical errors. The Cave Grouper™ groups over 14,000 unique ICD.9 diagnosis codes into 526 meaningful medical conditions. The CCGroup EfficiencyCare™ Module takes the output from the Cave Grouper™ and develops specialty-specific physician efficiency scores that compare individual physician efficiency (or physician group efficiency) against the efficiency of a peer group of interest.
National Committee for Quality Assurance (NCQA)
Relative Resource Use (RRU)
Population-based
The RRU measures report the average relative resource use for health plan members with a particular condition compared to their risk-adjusted peers. Standardized prices are used to focus on the quantities of resources used. Quality measures for the same conditions are reported concurrently.
The Johns Hopkins University
Adjusted Clinical Groups (ACG)
Population-based
ACGs are clinically homogeneous health status categories defined by age, gender, and morbidity (e.g., reflected by diagnostic codes). Based on the patterns of a patient’s comorbidities over a period of time (e.g., one year), the ACG algorithm assigns the individual into one of 93 mutually exclusive ACG categories for that span of time. Clustering is based on: (1) duration of the condition; (2) severity of the condition; (3) diagnostic certainty; (4) etiology of the condition; (5) specialty care involvement.
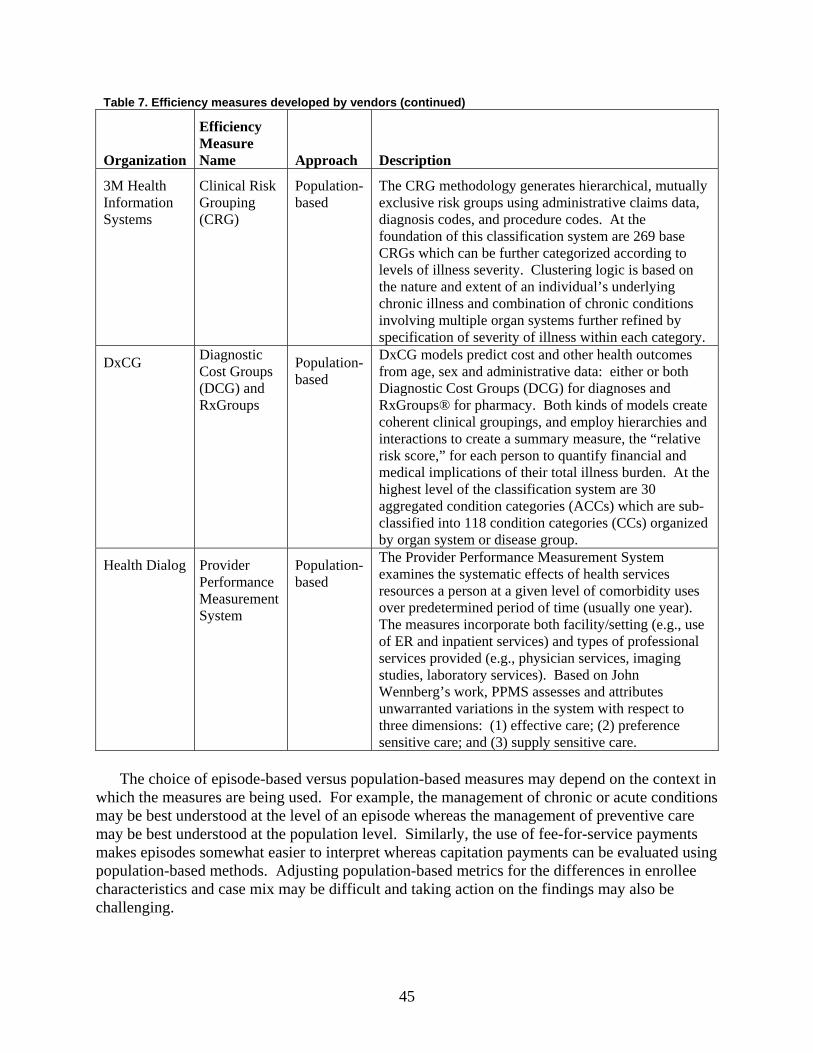
45
Table 7. Efficiency measures developed by vendors (continued)
Organization
Efficiency Measure Name Approach Description
3M Health Information Systems
Clinical Risk Grouping (CRG)
Population-based
The CRG methodology generates hierarchical, mutually exclusive risk groups using administrative claims data, diagnosis codes, and procedure codes. At the foundation of this classification system are 269 base CRGs which can be further categorized according to levels of illness severity. Clustering logic is based on the nature and extent of an individual’s underlying chronic illness and combination of chronic conditions involving multiple organ systems further refined by specification of severity of illness within each category.
DxCG Diagnostic Cost Groups (DCG) and RxGroups
Population-based
DxCG models predict cost and other health outcomes from age, sex and administrative data: either or both Diagnostic Cost Groups (DCG) for diagnoses and RxGroups® for pharmacy. Both kinds of models create coherent clinical groupings, and employ hierarchies and interactions to create a summary measure, the “relative risk score,” for each person to quantify financial and medical implications of their total illness burden. At the highest level of the classification system are 30 aggregated condition categories (ACCs) which are sub-classified into 118 condition categories (CCs) organized by organ system or disease group.
Health Dialog Provider Performance Measurement System
Population-based
The Provider Performance Measurement System examines the systematic effects of health services resources a person at a given level of comorbidity uses over predetermined period of time (usually one year). The measures incorporate both facility/setting (e.g., use of ER and inpatient services) and types of professional services provided (e.g., physician services, imaging studies, laboratory services). Based on John Wennberg’s work, PPMS assesses and attributes unwarranted variations in the system with respect to three dimensions: (1) effective care; (2) preference sensitive care; and (3) supply sensitive care.
The choice of episode-based versus population-based measures may depend on the context in
which the measures are being used. For example, the management of chronic or acute conditions may be best understood at the level of an episode whereas the management of preventive care may be best understood at the population level. Similarly, the use of fee-for-service payments makes episodes somewhat easier to interpret whereas capitation payments can be evaluated using population-based methods. Adjusting population-based metrics for the differences in enrollee characteristics and case mix may be difficult and taking action on the findings may also be challenging.
46
A Sample of Stakeholders’ Perspectives
We contacted a sample of stakeholders to seek their insights on efficiency measurement based on their efforts in scanning, developing, and/or implementing efficiency measures. We also used their input to cross-validate our selection of vendors described in the above section. Our sample included two coalitions on the national level; two coalitions on the state level; and an accrediting agency. These stakeholders are listed in Table 8. We asked these stakeholders to provide the definition of efficiency they used to guide their efforts; describe desirable attributes they considered as they searched for available measures; comment on their interest or objectives in developing and/or implementing efficiency measures; and list proprietary measures they have considered. Desirable attributes described by these stakeholders are incorporated in the next section as criteria for assessing efficiency measures. Table 9 summarizes comments we obtained from these stakeholders. The TEP, which included various stakeholders and experts on efficiency measurement, also provided input into the search and reviewed this report. The TEP members are listed in Appendix D*.
While the stakeholders used different definitions of “efficiency,” they shared a number of common concerns related to efficiency measurement. Many concerns were related to methodological issues such as data quality, attribution of responsibility for care to providers, risk adjustment, and identification of outliers. The stakeholders also shared a number of concerns related to the use of efficiency measures such as the appropriate way to make comparisons, how measures will be perceived by providers and patients, and the cost burden and transparency of measures. All of the stakeholders had been through decision processes about whether to use vendor-developed measures or develop their own measures in-house, with different conclusions reached. Definition of Efficiency
Responses from stakeholder informants reflected the diversity of perspectives and definitions of health care efficiency. While some stakeholders considered efficiency as an input-output relationship (e.g., resources used for a given condition), others conceptualized it as costs relative to one’s peers. There is wide recognition of the importance of integrating efficiency measurement with quality measurement, particularly for pay-for-performance initiatives. Most stakeholder informants noted that they had considered proprietary software marketed by at least one of the vendors described in Table 8, typically through a request for information (RFI)/request for proposal (RFP) process. Informants also shared with us that the process of identifying, endorsing, and implementing an efficiency measure(s) involved multiple stakeholder inputs, especially at the early stage of development.
* Appendixes for this report are provided electronically at http://www.ahrq.gov/downloads/pub/evidence/pdf/efficiency/efficiency.pdf.
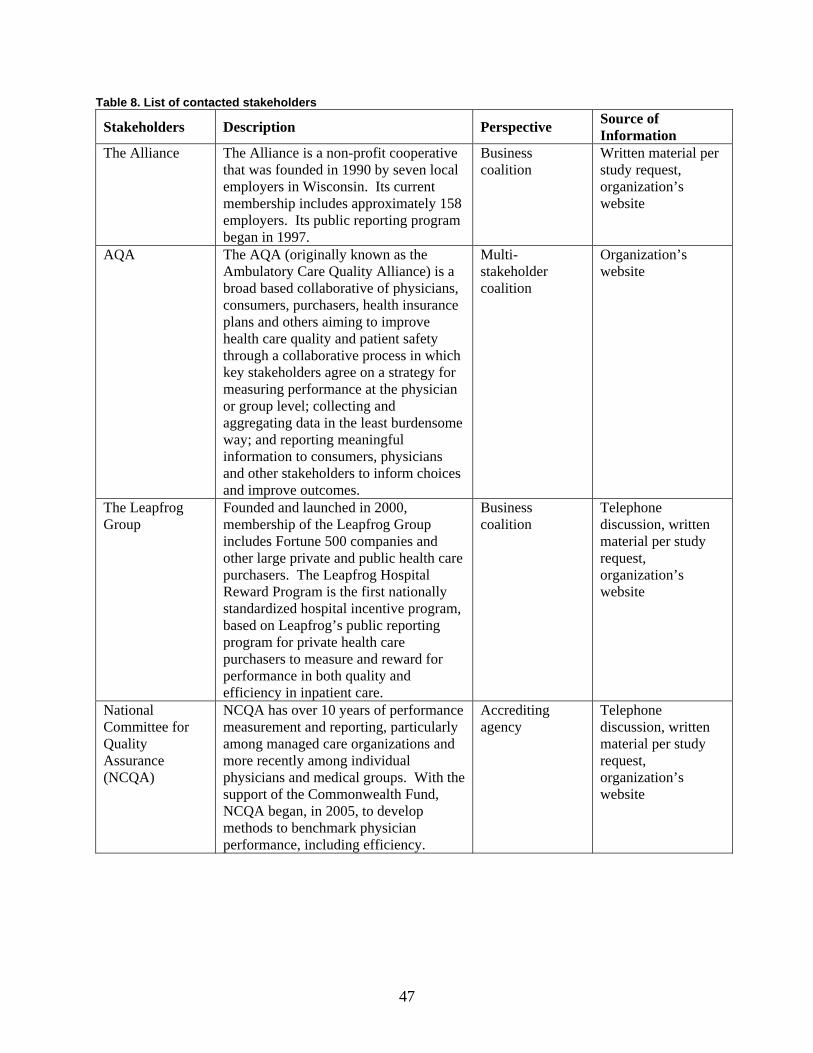
47
Table 8. List of contacted stakeholders
Stakeholders Description Perspective Source of Information
The Alliance The Alliance is a non-profit cooperative that was founded in 1990 by seven local employers in Wisconsin. Its current membership includes approximately 158 employers. Its public reporting program began in 1997.
Business coalition
Written material per study request, organization’s website
AQA The AQA (originally known as the Ambulatory Care Quality Alliance) is a broad based collaborative of physicians, consumers, purchasers, health insurance plans and others aiming to improve health care quality and patient safety through a collaborative process in which key stakeholders agree on a strategy for measuring performance at the physician or group level; collecting and aggregating data in the least burdensome way; and reporting meaningful information to consumers, physicians and other stakeholders to inform choices and improve outcomes.
Multi-stakeholder coalition
Organization’s website
The Leapfrog Group
Founded and launched in 2000, membership of the Leapfrog Group includes Fortune 500 companies and other large private and public health care purchasers. The Leapfrog Hospital Reward Program is the first nationally standardized hospital incentive program, based on Leapfrog’s public reporting program for private health care purchasers to measure and reward for performance in both quality and efficiency in inpatient care.
Business coalition
Telephone discussion, written material per study request, organization’s website
National Committee for Quality Assurance (NCQA)
NCQA has over 10 years of performance measurement and reporting, particularly among managed care organizations and more recently among individual physicians and medical groups. With the support of the Commonwealth Fund, NCQA began, in 2005, to develop methods to benchmark physician performance, including efficiency.
Accrediting agency
Telephone discussion, written material per study request, organization’s website
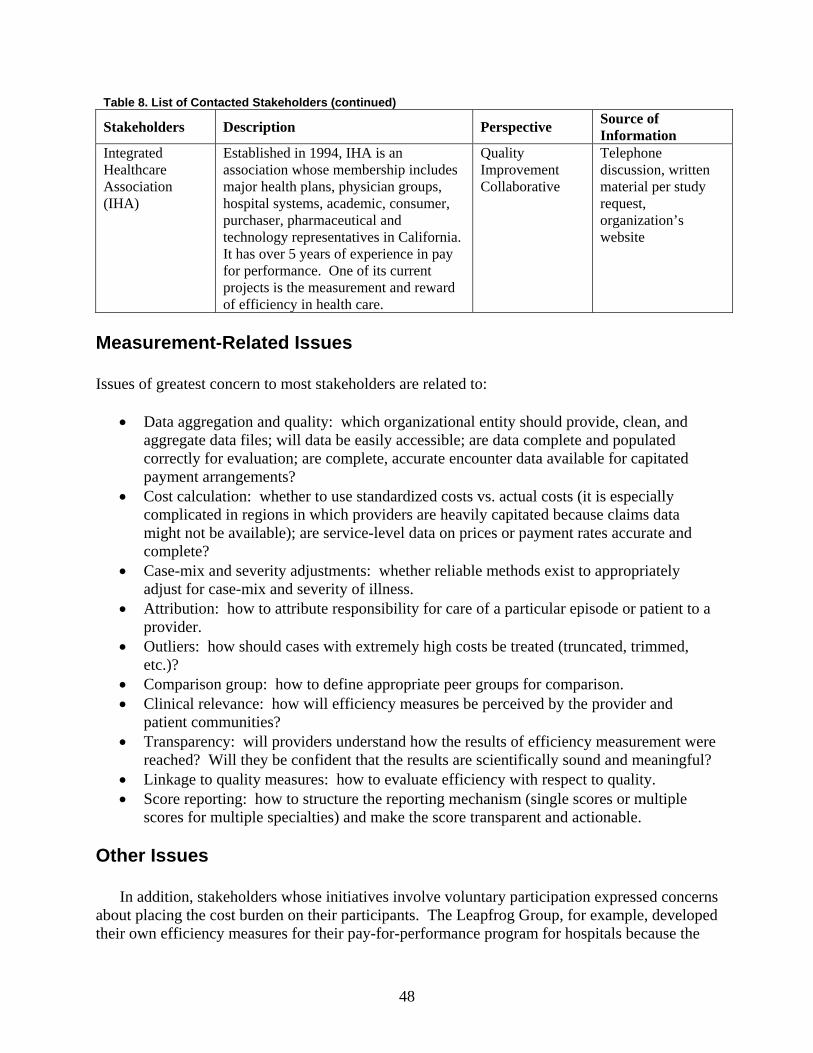
48
Table 8. List of Contacted Stakeholders (continued)
Stakeholders Description Perspective Source of Information
Integrated Healthcare Association (IHA)
Established in 1994, IHA is an association whose membership includes major health plans, physician groups, hospital systems, academic, consumer, purchaser, pharmaceutical and technology representatives in California. It has over 5 years of experience in pay for performance. One of its current projects is the measurement and reward of efficiency in health care.
Quality Improvement Collaborative
Telephone discussion, written material per study request, organization’s website
Measurement-Related Issues Issues of greatest concern to most stakeholders are related to:
• Data aggregation and quality: which organizational entity should provide, clean, and aggregate data files; will data be easily accessible; are data complete and populated correctly for evaluation; are complete, accurate encounter data available for capitated payment arrangements?
• Cost calculation: whether to use standardized costs vs. actual costs (it is especially complicated in regions in which providers are heavily capitated because claims data might not be available); are service-level data on prices or payment rates accurate and complete?
• Case-mix and severity adjustments: whether reliable methods exist to appropriately adjust for case-mix and severity of illness.
• Attribution: how to attribute responsibility for care of a particular episode or patient to a provider.
• Outliers: how should cases with extremely high costs be treated (truncated, trimmed, etc.)?
• Comparison group: how to define appropriate peer groups for comparison. • Clinical relevance: how will efficiency measures be perceived by the provider and
patient communities? • Transparency: will providers understand how the results of efficiency measurement were
reached? Will they be confident that the results are scientifically sound and meaningful? • Linkage to quality measures: how to evaluate efficiency with respect to quality. • Score reporting: how to structure the reporting mechanism (single scores or multiple
scores for multiple specialties) and make the score transparent and actionable. Other Issues
In addition, stakeholders whose initiatives involve voluntary participation expressed concerns about placing the cost burden on their participants. The Leapfrog Group, for example, developed their own efficiency measures for their pay-for-performance program for hospitals because the
49
purchase of vendor-developed software might impose financial barriers to participation. On the other hand, several stakeholders shared with us that they considered vendors because many vendor-developed tools are already used to measure efficiency and they did not need to reinvent the wheel.
Stakeholder informants noted that by and large, efforts to measure and reward health care efficiency are still at a nascent and developmental stage, with most initiatives currently collecting baseline information and assessing feasibility. There are several examples of more mature initiatives, however, including the Massachusetts Group Insurance Commission’s Clinical Performance Improvement project and the efforts of some individual health plans, including Blue Cross Blue Shield of Texas, Regence Blue Cross Blue Shield, United Healthcare’s Premium Designation Program, and Aetna’s Aexcel.
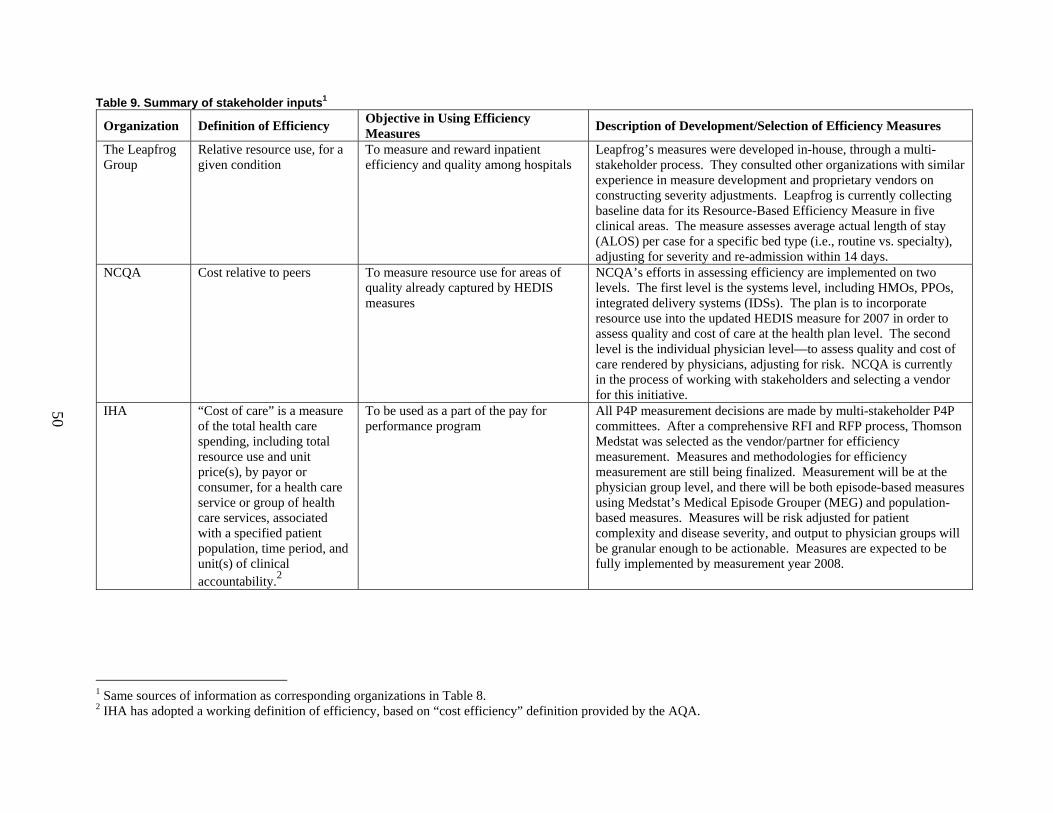
50
Table 9. Summary of stakeholder inputs1
Organization Definition of Efficiency Objective in Using Efficiency Measures Description of Development/Selection of Efficiency Measures
The Leapfrog Group
Relative resource use, for a given condition
To measure and reward inpatient efficiency and quality among hospitals
Leapfrog’s measures were developed in-house, through a multi-stakeholder process. They consulted other organizations with similar experience in measure development and proprietary vendors on constructing severity adjustments. Leapfrog is currently collecting baseline data for its Resource-Based Efficiency Measure in five clinical areas. The measure assesses average actual length of stay (ALOS) per case for a specific bed type (i.e., routine vs. specialty), adjusting for severity and re-admission within 14 days.
NCQA Cost relative to peers To measure resource use for areas of quality already captured by HEDIS measures
NCQA’s efforts in assessing efficiency are implemented on two levels. The first level is the systems level, including HMOs, PPOs, integrated delivery systems (IDSs). The plan is to incorporate resource use into the updated HEDIS measure for 2007 in order to assess quality and cost of care at the health plan level. The second level is the individual physician level—to assess quality and cost of care rendered by physicians, adjusting for risk. NCQA is currently in the process of working with stakeholders and selecting a vendor for this initiative.
IHA “Cost of care” is a measure of the total health care spending, including total resource use and unit price(s), by payor or consumer, for a health care service or group of health care services, associated with a specified patient population, time period, and unit(s) of clinical accountability.2
To be used as a part of the pay for performance program
All P4P measurement decisions are made by multi-stakeholder P4P committees. After a comprehensive RFI and RFP process, Thomson Medstat was selected as the vendor/partner for efficiency measurement. Measures and methodologies for efficiency measurement are still being finalized. Measurement will be at the physician group level, and there will be both episode-based measures using Medstat’s Medical Episode Grouper (MEG) and population-based measures. Measures will be risk adjusted for patient complexity and disease severity, and output to physician groups will be granular enough to be actionable. Measures are expected to be fully implemented by measurement year 2008.
1 Same sources of information as corresponding organizations in Table 8. 2 IHA has adopted a working definition of efficiency, based on “cost efficiency” definition provided by the AQA.
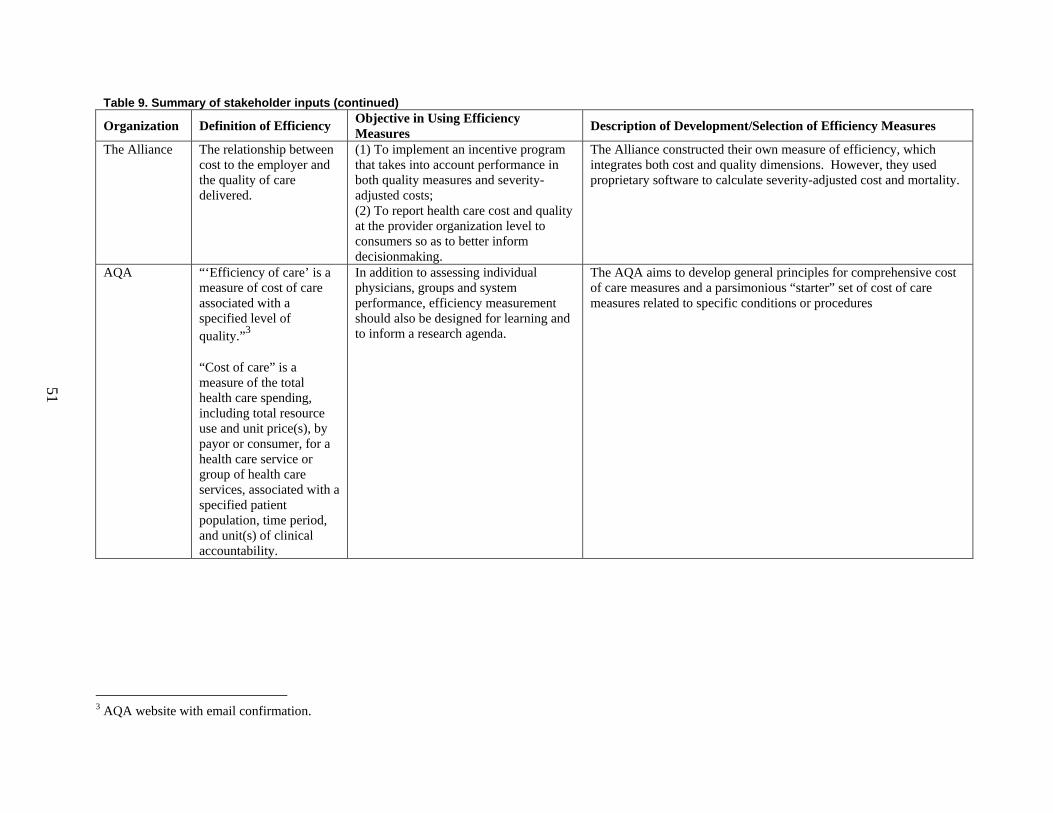
Table 9. Summary of stakeholder inputs (continued)
Organization Definition of Efficiency Objective in Using Efficiency Measures Description of Development/Selection of Efficiency Measures
The Alliance The relationship between cost to the employer and the quality of care delivered.
(1) To implement an incentive program that takes into account performance in both quality measures and severity-adjusted costs; (2) To report health care cost and quality at the provider organization level to consumers so as to better inform decisionmaking.
The Alliance constructed their own measure of efficiency, which integrates both cost and quality dimensions. However, they used proprietary software to calculate severity-adjusted cost and mortality.
AQA “‘Efficiency of care’ is a measure of cost of care associated with a specified level of quality.”3 “Cost of care” is a measure of the total health care spending, including total resource use and unit price(s), by payor or consumer, for a health care service or group of health care services, associated with a specified patient population, time period, and unit(s) of clinical accountability.
In addition to assessing individual physicians, groups and system performance, efficiency measurement should also be designed for learning and to inform a research agenda.
The AQA aims to develop general principles for comprehensive cost of care measures and a parsimonious “starter” set of cost of care measures related to specific conditions or procedures
3 AQA website with email confirmation.
51

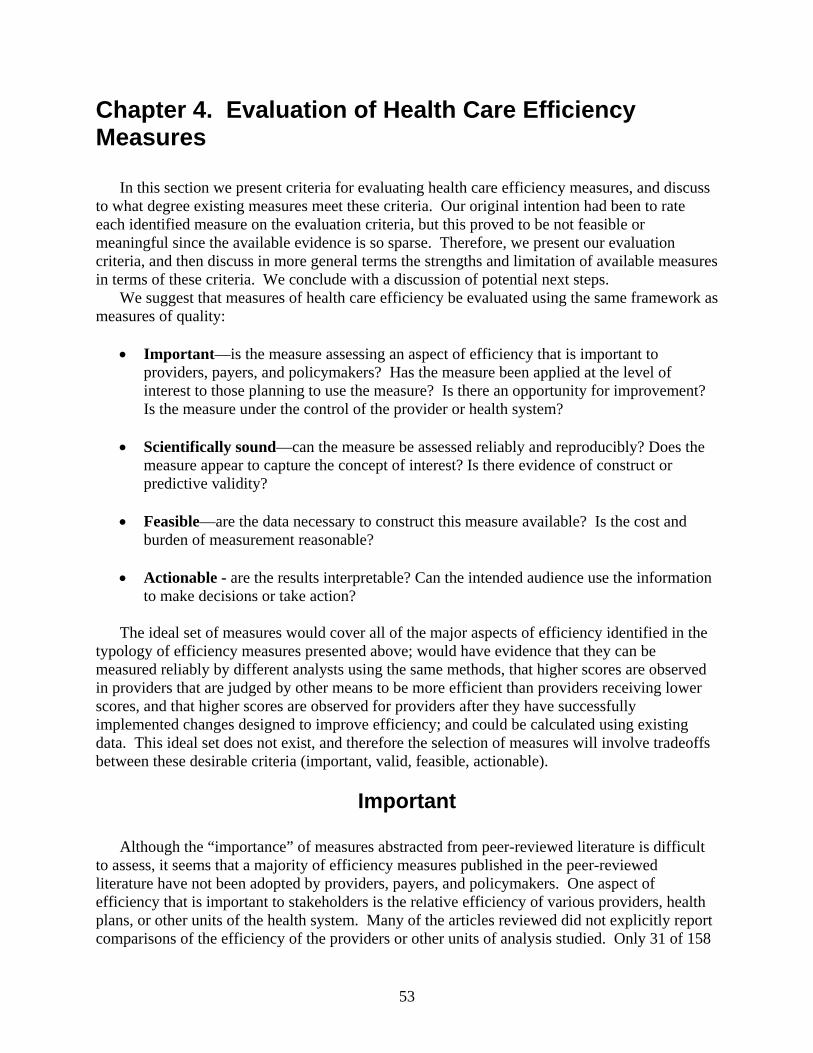
53
Chapter 4. Evaluation of Health Care Efficiency Measures
In this section we present criteria for evaluating health care efficiency measures, and discuss to what degree existing measures meet these criteria. Our original intention had been to rate each identified measure on the evaluation criteria, but this proved to be not feasible or meaningful since the available evidence is so sparse. Therefore, we present our evaluation criteria, and then discuss in more general terms the strengths and limitation of available measures in terms of these criteria. We conclude with a discussion of potential next steps.
We suggest that measures of health care efficiency be evaluated using the same framework as measures of quality:
• Important—is the measure assessing an aspect of efficiency that is important to providers, payers, and policymakers? Has the measure been applied at the level of interest to those planning to use the measure? Is there an opportunity for improvement? Is the measure under the control of the provider or health system?
• Scientifically sound—can the measure be assessed reliably and reproducibly? Does the
measure appear to capture the concept of interest? Is there evidence of construct or predictive validity?
• Feasible—are the data necessary to construct this measure available? Is the cost and
burden of measurement reasonable?
• Actionable - are the results interpretable? Can the intended audience use the information to make decisions or take action?
The ideal set of measures would cover all of the major aspects of efficiency identified in the
typology of efficiency measures presented above; would have evidence that they can be measured reliably by different analysts using the same methods, that higher scores are observed in providers that are judged by other means to be more efficient than providers receiving lower scores, and that higher scores are observed for providers after they have successfully implemented changes designed to improve efficiency; and could be calculated using existing data. This ideal set does not exist, and therefore the selection of measures will involve tradeoffs between these desirable criteria (important, valid, feasible, actionable).
Important
Although the “importance” of measures abstracted from peer-reviewed literature is difficult to assess, it seems that a majority of efficiency measures published in the peer-reviewed literature have not been adopted by providers, payers, and policymakers. One aspect of efficiency that is important to stakeholders is the relative efficiency of various providers, health plans, or other units of the health system. Many of the articles reviewed did not explicitly report comparisons of the efficiency of the providers or other units of analysis studied. Only 31 of 158
54
articles reported such a comparison. The other 127 articles reported efficiency at a grouped level, and often studied the effect of a factor or factor(s) on group efficiency. For example, an article might compare the relative efficiency of non-profit versus for-profit hospitals.
This type of analysis could potentially be used to answer another question of importance to stakeholders—how can efficiency be improved? Although many articles studied factors that were found to influence efficiency, it was unclear if any findings of factors associated with improved efficiency were strong enough to influence policy. At the same time the utility of existing efficiency measures for policy has been questioned, most explicitly by Newhouse.20 The vendor-developed measures that are most commonly used differ substantially from measures reported in the peer-reviewed literature, suggesting that stakeholders found the measures developed in the academic world inadequate for answering the questions most important to them. We note, however, that many of the vendor-developed measures are based on methods originally developed in the academic world (e.g., Adjusted Clinical Groups). The measures developed in the academic world are more complex to implement than vendor-developed measures. These measures often present and test sophisticated statistical or mathematical approaches for constructing a multi-input, multi-output efficiency frontier, but focus relatively little on the specification of inputs and outputs, often using whatever variables are readily available in existing data sources. In contrast, the vendor-developed measures often include a more complex specification of the outputs used, such as episodes of care. It is not clear that one approach is necessarily superior to the other. A critical question in evaluating importance of a measure is whether it satisfies the intended use.
The vendor-developed measures seem to reflect areas of importance to payers, purchasers, and providers based on how they have been used. The measures have been used by payers and purchasers to profile providers to include in their networks. In addition, a number of these measures are currently under consideration for various pay-for-performance initiatives. These measures assess efficiency both at the organizational level (e.g., hospitals or medical groups) and at the individual physician level. They offer both a global perspective on the drivers of total costs and resource utilization, as well as drilled down specifics for individual clinical areas and providers. In this respect, efficiency measures commonly used by health plans and purchasers respond to the perceived needs in the market.
One area of importance that is poorly reflected by existing measures is social efficiency. Despite a widespread acceptance that the allocation of resources in the current health care system is very inefficient, there appear to be no accepted measures of efficiency in this important area.
Scientifically Sound
Very little research on the reliability and validity of efficiency measures has been published to date. This includes measures developed by vendors as well as those published in the peer-reviewed literature. Of the 158 peer-reviewed articles found containing efficiency measures, only three reported any evidence of the validity of the measures and one reported evidence of reliability. It was slightly more common for articles to test the specifications of SFA or other regression models or DEA models using sensitivity analyses; 59 of 137 measures using DEA, SFA, or other regression-based approaches reported the results of sensitivity analyses. Vendors typically supply tools (e.g., methods for aggregating claims to construct episodes of care or methods for aggregating the costs of care for a population) from which measures can be
55
constructed; thus, the assessment of scientific soundness requires an evaluation of the application as well as the underlying tools.
Several studies have examined some of the measurement properties of vendor-developed measures, but the amount of evidence available is still limited at this time. Thomas, Grazier, and Ward58 tested the consistency of 6 groupers (some episode-based and some population-based) for measuring the efficiency of primary care physicians. They found “moderate to high” agreement between physician efficiency rankings using the various measures (weighted kappa = .51 to .73). Thomas and Ward59 tested the sensitivity of measures of specialist physician efficiency to episode attribution methodology and cost outlier methodology. Thomas60 also tested the effect of risk adjustment on an ETG-based efficiency measure. He found that episode risk scores were generally unrelated to costs and concluded that risk adjustment of ETG-based efficiency measures may be unnecessary. MedPAC61 compared episode-based measures and population-based measures for area-level analyses and found that they can produce different results. For example, Miami was found to have lower average per-episode costs for coronary artery disease episodes than Minneapolis but higher average per-capita costs due to lower episode volume.
The lack of testing of the scientific soundness of efficiency measures reflects in part the pressure to develop tools that can be used quickly and with relative ease in implementation. One major measurement problem in efficiency measures is the difficulty in observing the full range of outputs a hospital, physician, or other unit produces. As described in the results section, many measures capture the quantity of health care delivered, but very few are able to capture the quality or outcomes of this care. Most measures are not able to capture the full range of quantities of interest. As we would expect, most measures are based on quantities that are readily observable in existing datasets: hospital days, discharges, physician hours, etc. In some cases the way these variables are described to “proxy” for the real quantities of interest is questionable. For example, in some studies the number of beds is used as a proxy measure for capital, while no further evidence is presented on the correlation between these two.
A second area that concerns validity is the specification of the econometric models underlying the measures. The literature shows a wide variation here, with some articles estimating just one single model, and others estimating a whole range of models using various combinations of inputs, outputs, and methods. At a minimum, authors have made some very basic assumptions about the existence and nature of a random component to outputs. It has been shown that efficiency ratings can be very sensitive to the model chosen.62 When there are conflicting results under different models, it is often not obvious which model and results are preferable.
A third area of potential assessment is the reliability and validity of efficiency measures when implemented in different administrative data sets. This becomes particularly challenging when data sets are aggregated or when data from different entities (e.g., health plans, hospitals) are compared for evaluative purposes. Data sets from multiple insurers may need to be aggregated for the purposes of developing larger samples of patients. Some of the key challenges include: the effect of benefit design differences, the impact of different methods of paying physicians, use of local codes, differential use of carve out/contracted providers, missing data, and so on. Administrative/billing data are the most common source of information for constructing efficiency measures but users should be aware of the threats to validity when comparing different entities.
56
A fourth area is whether the measures take into account and adjust for both case mix (i.e., the nature and volume of the types of patients being treated) and risks (i.e., severity of illness of the patients), such as other co-morbidities.
A final area revolves around the implicit assumptions about the comparability of the outputs measured, particularly with regard to quality of care. While most users of efficiency measures are likely to use separate methods for evaluating quality, the methodological work to link these two constructs has not been done. In the absence of explicit approaches to measuring quality, the efficiency measures assume that the quality of the output is equivalent. In most cases this assumption is likely not valid.
Feasible
Since most of the efficiency measures abstracted in the literature review are based on existing public-use data sources, they could feasibly be reconstructed. Most articles appeared to specify the best possible measure given the limitations of existing public-use data, rather than collect or compile data sets to construct the best possible measure. That is, the measures in the peer-reviewed literature generally seemed primarily shaped by feasibility, and secondarily by scientific soundness.
All of the efficiency measures identified through the grey literature also rely on existing data (e.g., insurance claims). Most of the efficiency measures identified through the grey literature have been developed by vendors with feasibility of use by their clients in mind. However, most vendor-developed measures are proprietary, and therefore may impose cost barriers during implementation. In fact, one of the stakeholders interviewed specifically mentioned feasibility related to the cost of purchasing vendor-developed product as one of the primary reasons for their organization creating their own efficiency measure.
Existing public-use data sets available for research use may pose several difficulties for the specification of scientifically sound, important efficiency measures, however. For example, it may be difficult to assign responsibility for measures to specific providers based on claims, or it may be difficult to group claims into episodes or other units.
MedPAC has tested the feasibility of using episode-based efficiency measures in the Medicare program. They tested MEG and ETG based measures using 100% Medicare claims files for 6 geographic areas. They found that most Medicare claims could be assigned to episodes, most episodes can be assigned to physicians, and outlier physicians can be identified, although each of these processes is sensitive to the criteria used. The percentage of claims that can be assigned to episodes and the percentage of episodes that can be assigned to physicians were consistent between the 2 measures.
Actionable
Stakeholders are using efficiency measures for a variety of applications including internal quality improvement, pay-for-performance, public reporting, and construction of product lines that include differential copayments (tiering) for different providers. Each of these applications requires that the results of the measures be transmitted in a way that facilitates both understanding and appropriate action on the part of the target audience (actionability). However, relatively little research has been done to understand the ability of different audiences to interpret
57
and use the information. Two examples are provided here based on interviews with stakeholders.
• Flexible pricing—measures should be flexible to allow plans or groups to add their own pricing information if the measure was originally constructed using standardized prices. In many cases, standardized prices are used instead of the actual prices paid. This approach eliminates differences in prices paid by different providers, which providers often argue are not under their control. Insurers or provider groups may also favor standardized pricing so that they do not reveal the prices they have negotiated with suppliers. However, some users may wish to apply actual prices for certain applications and desire this flexibility.
• Clinical relevance—measures need to provide actionable information to guide
improvements in clinical practice. Measures cannot be a “black box” of statistics that lack transparency.
Application of Efficiency Measures
Table 10 presents a matrix framework for evaluation of efficiency measures based on their
applications and their importance, scientific soundness, and feasibility. The columns are ordered to reflect the hierarchy of decisionmaking about measures:
• Important—if it is not important, why go any further? • Scientifically sound—if it is important but not sound then one cannot have confidence in
the data. • Feasible—if it is important and scientifically sound, is it feasible to implement this
measure? • Actionable—if it is important, scientifically sound, and feasible can the target audiences
understand and act on the information provided?
Reflecting this hierarchy, these four domains are listed from left to right in the columns of the evaluation framework presented in Table 10.
Some applications of measures have a stronger requirement for the availability of rigorous information in these four domains than others because of a greater possibility of unintended consequences. The rows of Table 10 are ordered to reflect the increasing need for rigor across all four domains. When using a measure for provider network selection or tiered copayments in a health plan, it is more important to ensure that the measure is scientifically sound, actionable, etc., due to the potential effects on provider payment, patient choice, and other potential unintended consequences. In contrast, using a measure for internal review and improvement or research has less potential for unintended consequences and thus has less stringent requirements for information on measure properties as measures are in the process of being evaluated. As measures are tested in these applications, further information on their properties will be available that can be used to assess their appropriateness in other applications. For example, if a new measure is developed that assesses physician efficiency, it should first be used for research and possibly internal review and improvement while information on its scientific soundness is
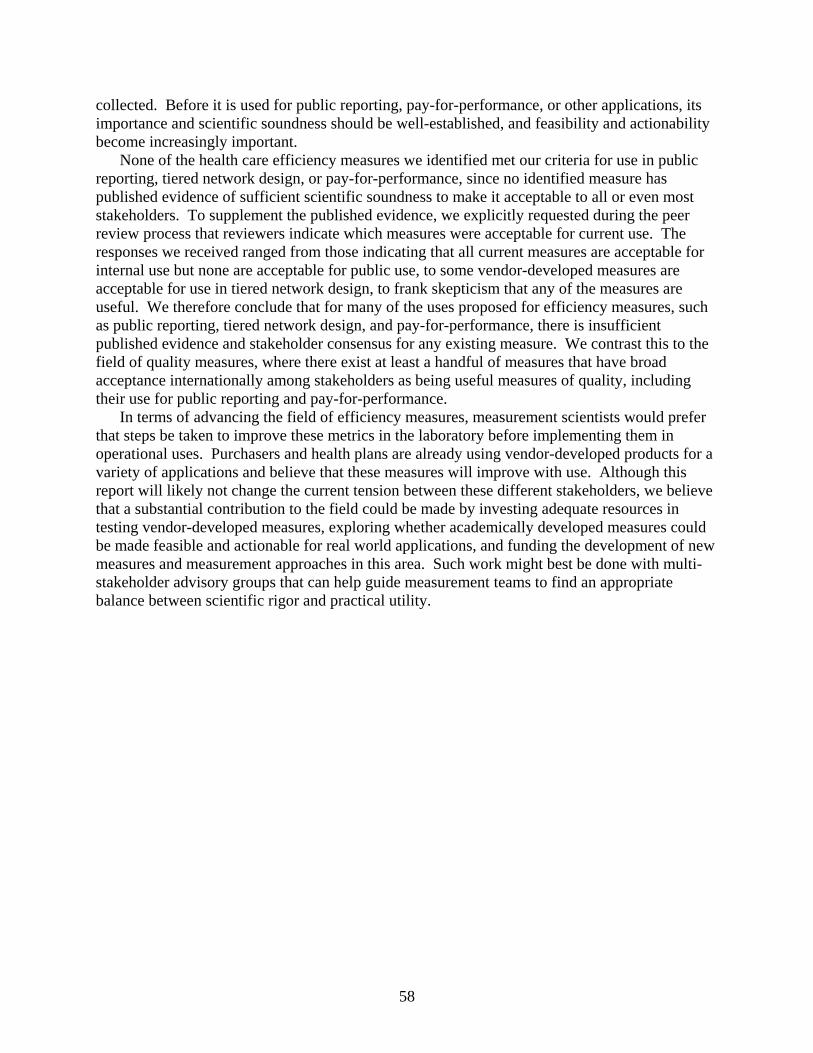
58
collected. Before it is used for public reporting, pay-for-performance, or other applications, its importance and scientific soundness should be well-established, and feasibility and actionability become increasingly important.
None of the health care efficiency measures we identified met our criteria for use in public reporting, tiered network design, or pay-for-performance, since no identified measure has published evidence of sufficient scientific soundness to make it acceptable to all or even most stakeholders. To supplement the published evidence, we explicitly requested during the peer review process that reviewers indicate which measures were acceptable for current use. The responses we received ranged from those indicating that all current measures are acceptable for internal use but none are acceptable for public use, to some vendor-developed measures are acceptable for use in tiered network design, to frank skepticism that any of the measures are useful. We therefore conclude that for many of the uses proposed for efficiency measures, such as public reporting, tiered network design, and pay-for-performance, there is insufficient published evidence and stakeholder consensus for any existing measure. We contrast this to the field of quality measures, where there exist at least a handful of measures that have broad acceptance internationally among stakeholders as being useful measures of quality, including their use for public reporting and pay-for-performance.
In terms of advancing the field of efficiency measures, measurement scientists would prefer that steps be taken to improve these metrics in the laboratory before implementing them in operational uses. Purchasers and health plans are already using vendor-developed products for a variety of applications and believe that these measures will improve with use. Although this report will likely not change the current tension between these different stakeholders, we believe that a substantial contribution to the field could be made by investing adequate resources in testing vendor-developed measures, exploring whether academically developed measures could be made feasible and actionable for real world applications, and funding the development of new measures and measurement approaches in this area. Such work might best be done with multi-stakeholder advisory groups that can help guide measurement teams to find an appropriate balance between scientific rigor and practical utility.
59
Table 10. Application of efficiency measures Application Important Scientifically Sound Feasible Actionable
Inte
rpre
tabi
lity
Opp
ortu
nity
for
impr
ovem
ent
Attr
ibut
able
to
& d
iffer
entia
tes
betw
een
prov
ider
s/ fi
rms
Sam
ple
size
, in
clud
es n
eede
d da
ta e
lem
ents
Adj
ustm
ents
for
case
-mix
, pr
ovid
er
char
acte
ristic
s, et
c.
Dat
a av
aila
bilit
y
Cos
t of
mea
sure
men
t
Tran
spar
ency
of
met
hods
Und
erst
anda
ble
and
usab
le fo
r ta
rget
aud
ienc
e
Research Internal review & improvement
Health plans Hospitals Physicians Public reporting Regions Health plans Hospitals Physicians Pay-for-performance
Hospitals Physicians Health plan selection (purchasers)
Provider network selection (health plans)
Tiered copayments (health plans)

61
Chapter 5. Discussion
Limitations
Publication Bias
Our literature search procedures were extensive and included canvassing experts from academia, industry, and our peer reviewers regarding studies we may have missed. However, we can never be sure that we identified all the relevant published literature. We also excluded studies from non-U.S. data sources, primarily because we judged the studies done on U.S. data would be most relevant. It is possible, however, that adding the non-U.S. literature would have identified additional measures of potential interest. Study Quality
An important limitation common to systematic reviews is the quality of the original studies. A substantial amount of work has been done to identify criteria in the design and execution of the studies of the effectiveness of health care interventions, and these criteria are routinely used in systematic reviews of interventions. However, we are unaware of any such agreed-upon criteria that assess the design or execution of a study of a health care efficiency measure. We did evaluate whether or not studies assessed the scientific soundness of their measures (and found this mostly lacking).
Conclusions
We found little overlap between the measures published in the peer-reviewed literature and those in the grey literature suggesting that the driving forces behind research and practice result in very different choices of measure. We found gaps in some measurement areas including: no established measures of social efficiency, few measures that evaluated health outcomes as the output, and few measures of providers other than hospitals and physicians.
Efficiency measures have been subjected to relatively few rigorous evaluations of their performance characteristics, including reliability (over time, by entity), validity, and sensitivity to methods used. Measurement scientists would prefer that steps be taken to improve these metrics in the laboratory before implementing them in operational uses. Purchasers and health plans are willing to use measures without such testing under the belief that the measures will improve with use.
The lack of consensus among stakeholders in defining and accepting efficiency measures that motivated this study remained evident through the interviews we conducted. An ongoing process to develop consensus among those demanding and using efficiency measures will likely improve the products available for use.
62
Future Research
Research is already underway to evaluate vendor-developed tools for scientific soundness, feasibility, and actionability. For example, we identified studies being done or funded by the General Accounting Office, MedPAC, CMS, Department of Labor, Massachusetts Medical Society, and the Society of Actuaries. A research agenda is needed in this area to build on this work. We summarize some of the key areas for future research but do not intend the order to signal any particular priority. Filling Gaps in Existing Measures
Several stakeholders recognize the importance of using efficiency and effectiveness metrics together but relatively little research has been done on the options for constructing such approaches to measurement.
We found few measures of efficiency that used health outcomes as the output measure. Physicians and patients are likely to be interested in measures that account for the costs of producing desirable outcomes. We highlight some of the challenges of doing this that are parallel to the challenges of using outcomes measures in other accountability applications; thus, a program of research designed to advance both areas would be welcome.
We found a number of gaps in the availability of efficiency measures within the classification system of our typology. For example, we found no measures of social efficiency, which might reflect the choice of U.S.-based research. Nonetheless, such measures may advance discussions related to equity and resource allocation choices as various cost containment strategies are evaluated. Evaluating and Testing Scientific Soundness
There are a variety of methodological questions that should be investigated to better understand the degree to which efficiency measures are producing reliable and valid information. Some of the key issues include whether there is enough information to evaluate performance (e.g., sample sizes); whether the information is reliable over time and in different purchaser data sets (e.g., does one get the same result when examining performance in the commercial versus the Medicare market?); methods for constructing appropriate comparison groups for physicians, hospitals, health plans, markets; methods for assigning responsibility (attribution) for costs to different entities; and the use of different methods for assigning prices to services. Evaluating and Improving Feasibility
One area of investigation is the opportunities for creating easy-to-use products based on methods such as DEA or SFA. This would require work to bridge from tools used for academic research to tools that could be used in operational applications.
Another set of investigations is identifying data sources or variables useful for expanding inputs and outputs measured (e.g., measuring capital requirements or investment, accounting for teaching status or charity care).
63
Making Measures More Actionable
Considerable research needs to be conducted to develop and test tools for decision makers to use for improving health care efficiency (e.g., relative drivers of costs, best practices in efficient care delivery, feedback and reporting methods) and for making choices among providers and plans. Research could also identify areas for national focus on reducing waste and inefficiency in health care. The relative utility of measurement and reporting on efficiency versus other methods (Toyota’s Lean approach, Six Sigma) could also be worthwhile for setting national priorities.


65
References and Included Studies
1. Grosskopf S, Margaritis D, Valdmanis V.
Comparing teaching and non-teaching hospitals: a frontier approach (teaching vs. non-teaching hospitals). Health Care Manag Sci 2001; 4(2):83-90.
2. Phillips JF. Do managerial efficiency and social responsibility drive long-term financial performance of not-for-profit hospitals before acquisition? J Health Care Finance 1999;25(4):67-76.
3. Institute of Medicine. Crossing the Quality Chasm. Washington, DC: National Academies Press; 2001.
4. Institute of Medicine. Envisioning the National Health Care Quality Report. Washington, DC: National Academies Press; 2001.
5. Hussey PS, Anderson GF, Osborn R, et al. How does the quality of care compare in five countries? Health Aff (Millwood) 2004;23(3):89-99.
6. The Leapfrog Group and Brides to Excellence. Measuring Provider Efficiency: Version 1.0. available at URL: http://www.bridgestoexcellence.org/bte/pdf/Measuring_Provider_Effficiency_Version1_12-31-2004.pdf. Accessed 8/5/2005.
7. Palmer S, Torgerson DJ. Economic notes: definitions of efficiency. BMJ 1999;318(7191):1136.
8. AQA. AQA principles of “efficiency” measures. available at URL: http://www.aqaalliance.org/files/PrinciplesofEfficiencyMeasurementApril2006.doc. Accessed 2/14/2007.
9. Chassin MR, Kosecoff J, Park RE, et al. Does inappropriate use explain geographic variations in the use of health care services? A study of three procedures. JAMA 1987;258(18):2533-7.
10. Jacobson JM. Promoting and measuring productivity in the HMO. Top Health Care Financ 1992;19( 2):75-82.
11. Halm EA, Lee C, Chassin MR. Is volume related to outcome in health care? A systematic review and methodologic critique of the literature. Ann Intern Med 2002;137(6):511-20.
12. Dranove D, Satterthwaite MA. The industrial Organization of Health-Care Markets. In: Culyer AJ, Newhouse JP. (Editors) Handbook of Health Economics. New York: Elsevier; 2000.
13. Zweifel PMW. Moral Hazard and Consumer Incentives in Health Care. In: Culyer AJ, Newhouse JP. Handbook of Health Economics. New York: Elsevier; 2000.
14. Kahn JG, Kronick R, Kreger M, et al. The cost of health insurance administration in California: estimates for insurers, physicians, and hospitals. Health Aff (Millwood) 2005;24(6):1629-39.
15. Medical Group Management Association. Administrative Simplification for Medical Group Practices. 2005.
16. Hackbarth G, Milgate K. Using quality incentives to drive physician adoption of health information technology. Medicare should help physicians overcome the barriers to adoption but should not simply pay the bill. Health Aff (Millwood) 2005;24(5):1147-9.
17. Arrow K. Uncertainty and the Welfare Economics of Medical Care. American Economic Review 1963;53:941-73.
18. Charnes A, Cooper WW, Rhodes E. Measuring the Efficiency of Decision Making Units. European Journal of Operational Research 1978;2:429-44.
19. Farrell MJ. The Measurement of Productive Efficiency. Journal of the Royal Statistical Society 1957;Series A(120):253-90.
20. Newhouse JP. Frontier estimation: how useful a tool for health economics? J Health Econ 1994;13( 3):317-22.
21. Aigner D, Lovell CK, Schmidt P. Formulation and estimation of stochastic frontier production function models. Journal of Econometrics 1977;6:21-37.
22. Greene W. Maximum likelihood estimation of econometric frontier functions. Journal of Econometrics 1980;13:27-56.
23. Greene W. The econometric approach to efficiency analysis. In: Fried HO, Knox Lovell CA, Schmidt SS. (Editors) The Measurement of Productive Efficiency. New York: Oxford University Press; 1992.
24. Caves DW, Christensen LR, Diewert EW. The economic theory of index numbers and the measurement of input, output, and productivity. Econometrica 1982;50(6):1393-1414.
25. Smith C, Cowan C, Heffler S, et al. National health spending in 2004: recent slowdown led by prescription drug spending. Health Aff (Millwood) 2006;25(1):186-96.

66
26. Dewar DM, Lambrinos J. Does managed care more efficiently allocate resources to older patients in critical care settings? Cost Qual 2000;6(2): 18-26, 37.
27. Zuckerman S, Hadley J, Iezzoni L. Measuring Hospital Efficiency with Frontier Cost Functions. Journal of Health Economics 1994;13(3):255-80.
28. Rosko MD, Chilingerian JA. Estimating hospital inefficiency: does case mix matter? J Med Syst 1999;23(1):57-71.
29. Rosko MD. Impact of internal and external environmental pressures on hospital inefficiency. Health Care Manag Sci 1999;2(2):63-74.
30. Albritton TA, Miller MD, Johnson MH, et al. Using relative value units to measure faculty clinical productivity. J Gen Intern Med 1997;12(11):715-7.
31. Garg ML, Boero JF, Christiansen RG, et al. Primary care teaching physicians’ losses of productivity and revenue at three ambulatory-care centers. Acad Med 1991;66(6):348-53.
32. Ozcan YA. Physician benchmarking: measuring variation in practice behavior in treatment of otitis media. Health Care Manag Sci 1998;1(1):5-17.
33. Kralewski JE, Rich EC, Feldman R, et al. The effects of medical group practice and physician payment methods on costs of care. Health Serv Res 2000;35(3):591-613.
34. Thomas JW. Should episode-based economic profiles be risk adjusted to account for differences in patients’ health risks? Health Services Research 2006;41(2):581-98.
35. Cutler DM, McClellan M, Newhouse JP. How does managed care do it? Rand J Econ 2000;31(3):526-48.
36. Cutler DMMM, Newhouse JP. Price and Productivity in Managed Care Insurance. 1998.
37. Ozcan YA. Efficiency of hospital-service production in local markets - the balance-sheet of U.S. medical armament. Socio-Economic Planning Sciences 1995;29(2):139-50.
38. Ozcan YA, Yeh SC, McCollum D, et al. Trends in labor efficiency among American hospital markets. Annals of Operations Research 1996;67:61-81.
39. Ashby J, Guterman S, Greene T. An analysis of hospital productivity and product change. Health Aff (Millwood) 2000;19(5):197-205.
40. Skinner J, Fisher E, Wennberg JE. The Efficiency of Medicare. 2001.
41. Wan TT, Wang BB. Integrated healthcare networks’ performance: a growth curve modeling approach. Health Care Manag Sci 2003;6(2):117-24.
42. Wan TT, Lin BY, Ma A. Integration mechanisms and hospital efficiency in integrated health care delivery systems. J Med Syst 2002;26(2):127-43.
43. Yeh J, White KR, Ozcan YA. Efficiency evaluation of community-based youth services in Virginia. Community Ment Health J 1997;33(6):487-99.
44. Larson EH, Hart LG, Ballweg R. National estimates of physician assistant productivity. J Allied Health 2001;30(3):146-52.
45. Boston DW. Clinical productivity indicators for a dental general practice residency program. Spec Care Dentist 1991;11(5):173-8.
46. Ozcan YA, Cotter JJ. An assessment of efficiency of area agencies on aging in Virginia through data envelopment analysis. Gerontologist 1994;34(3):363-70.
47. Tyler LH, Ozcan YA, Wogen SE. Mental health case management and technical efficiency. J Med Syst 1995;19(5):413-23.
48. DiJerome L, Dunham-Taylor J, Ash D, et al. Evaluating cost center productivity. Nurs Econ 1999;17(6):334-40.
49. Ozgen H, Ozcan YA. A national study of efficiency for dialysis centers: an examination of market competition and facility characteristics for production of multiple dialysis outputs. Health Serv Res 2002;37(3):711-32.
50. Okunade AA. Cost-Output Relation, Technological Progress, and Clinical Activity Mix of U.S. Hospital Pharmacies. Journal of Productivity Analysis 2001;16(2):167-93.
51. Andes S, Metzger LM, Kralewski J, et al. Measuring efficiency of physician practices using data envelopment analysis. Manag Care 2002; 11(11):48-54.
52. Schinnar AP, Kamis-Gould E, Delucia N, et al. Organizational determinants of efficiency and effectiveness in mental health partial care programs. Health Serv Res 1990;25(2):387-420.
53. Ozcan YA, Begun JW, McKinney MM. Benchmarking organ procurement organizations: a national study. Health Serv Res 1999;34(4):855-74; discussion 875-8.
54. Alexander JA, Wheeler JR, Nahra TA, et al. Managed care and technical efficiency in outpatient substance abuse treatment units. J Behav Health Serv Res 1998;25(4):377-96.
55. Mansley EC, Dunet DO, May DS, et al. Variation in average costs among federally sponsored state-organized cancer detection programs: economies of scale? Med Decis Making 2002;22(5 Suppl):S67-79.
67
56. Valdmanis VG. Ownership and technical efficiency of hospitals. Med Care 1990;28(6):552-61.
57. Iezzoni LI. Risk adjustment for measuring health care outcomes. Ann Arbor, MI: Health Administration Press; 1994.
58. Thomas JW, Grazier KW, Ward K. Economic profiling of primary care physicians: consistency among risk-adjusted measures. Health Services Research 2004;39(4 Pt 1):985-1003.
59. Thomas JW, Ward K. Economic profiling of physician specialists: use of outlier treatment and episode attribution rules. Inquiry 2006;43(3):271-82.
60. Thomas JW. Should episode-based economic profiles be risk adjusted to account for differences in patients’ health risks? Health Services Research 2006;41(2):581-98.
61. Medicare Payment Advisory Commission (MEDPAC). Report to the Congress: Increasing the Value of Medicare. Accessed 2/14/2007.
62. Bryce CL, Engberg JB, Wholey DR. Comparing the agreement among alternative models in evaluating HMO efficiency. Health Serv Res 2000;35(2):509-28.

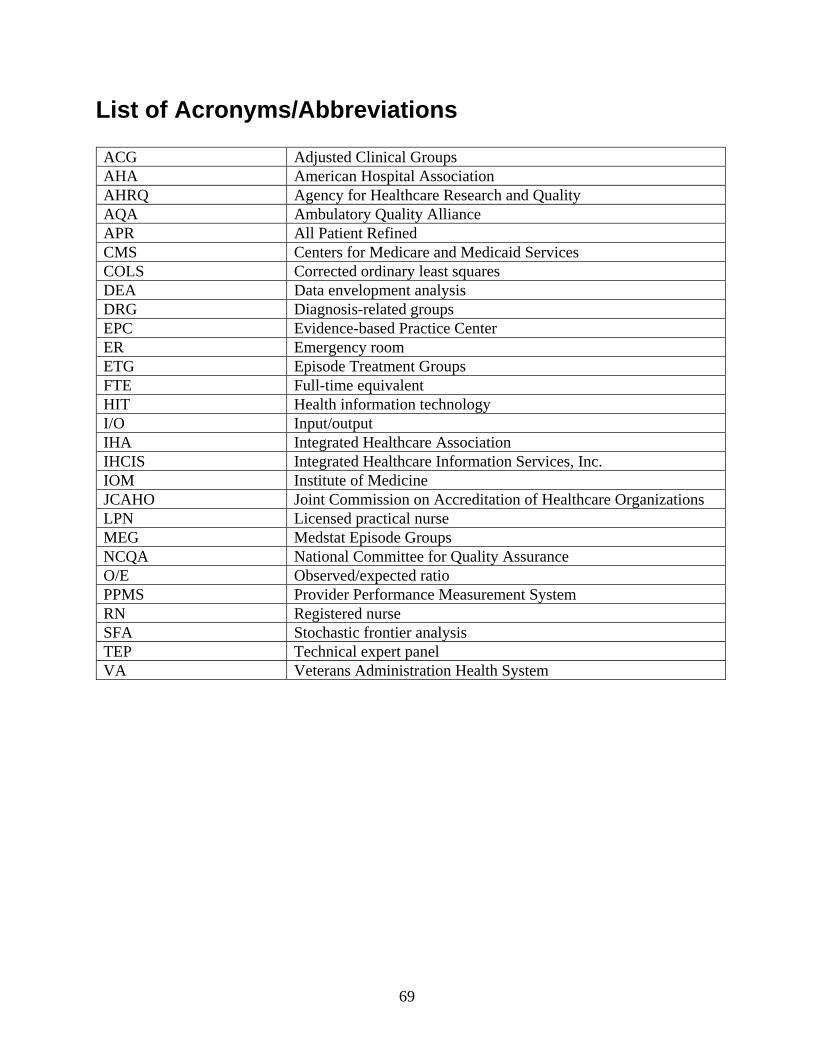
69
List of Acronyms/Abbreviations
ACG Adjusted Clinical Groups AHA American Hospital Association AHRQ Agency for Healthcare Research and Quality AQA Ambulatory Quality Alliance APR All Patient Refined CMS Centers for Medicare and Medicaid Services COLS Corrected ordinary least squares DEA Data envelopment analysis DRG Diagnosis-related groups EPC Evidence-based Practice Center ER Emergency room ETG Episode Treatment Groups FTE Full-time equivalent HIT Health information technology I/O Input/output IHA Integrated Healthcare Association IHCIS Integrated Healthcare Information Services, Inc. IOM Institute of Medicine JCAHO Joint Commission on Accreditation of Healthcare Organizations LPN Licensed practical nurse MEG Medstat Episode Groups NCQA National Committee for Quality Assurance O/E Observed/expected ratio PPMS Provider Performance Measurement System RN Registered nurse SFA Stochastic frontier analysis TEP Technical expert panel VA Veterans Administration Health System


Appendixes


Appendix A Technical Typology

A-1
Intellectual History of Efficiency in Economics
In the first half of the 20th century, microeconomic theory approached the efficiency concept from a Pareto perspective. The Pareto criterion is satisfied if no person can be made better off without making someone else worse off. The classic first welfare theorem holds that Pareto efficiency obtains if and only if:
• Markets exist for all possible goods • Markets are perfectly competitive • Transaction costs are negligible • There are no externalities.
The implicit assumption was that firms always make optimal decisions on the use of inputs, and that any inefficiencies in an economy have their origin in the way resources are allocated across firms, rather than within firms. Two main threats to efficiency in this paradigm were monopolies and (international) trade restrictions.1 In the second half of the 20th century, the assumption that firms always make optimal input decisions was challenged. It became accepted that besides the original “social” or “allocative” efficiency, the efficiency within firms was worthy to be analyzed as well. This had traditionally been an operations research (OR) field, concerned with “activity analysis,” where the manager was the subject of interest; hence the term “managerial efficiency.” During the 50’s, several scholars2-4 tried to formalize both types of efficiency. These are sometimes referred to as the neo-Walrasian school. Within the neo-Walrasian school the seminal paper on the measurement of efficiency is Farrell.4 Farrell’s definition of productive efficiency was inspired by Koopmans’ work on “activity analysis,”3 and his measure of technical efficiency is similar to Debreu’s “coefficient of resource utilization.”2 The novelty of Farrell’s approach is that his efficiency measure explicitly allows the inclusion of multiple inputs and outputs, whereas previous work (e.g., index numbers) was often limited to single inputs or outputs (e.g., the average productivity of labor). Farrell’s definition of the efficient firm is “its success in producing as large as possible an output from a given set of inputs.” Farrell introduces the efficient production function as a special case of the traditional (Paretian) production function, defined as “the output that a perfectly efficient firm could obtain from any given combination of inputs.”4 Farrell distinguishes between technical-, price-, and overall efficiency. Technical efficiency is defined as a firm’s success in producing maximum output from a given set of inputs, i.e., producing on the “technical frontier.” Price efficiency is defined as the firm’s success in choosing an optimal set of inputs, i.e., the set that would minimize cost if the firm were producing on the technical frontier. Overall efficiency (commonly known as productive efficiency) is the product of price and technical efficiency. Technical and price inefficiency each imply overall inefficiency (as Farrell defines the term).
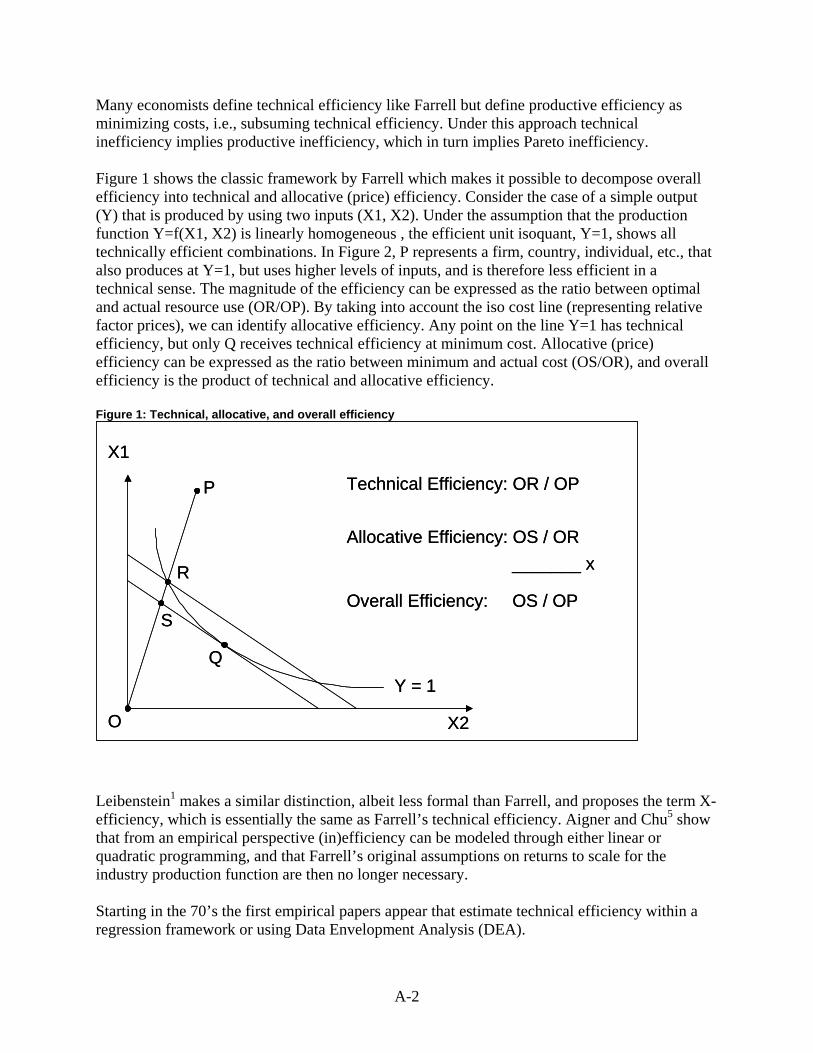
A-2
Many economists define technical efficiency like Farrell but define productive efficiency as minimizing costs, i.e., subsuming technical efficiency. Under this approach technical inefficiency implies productive inefficiency, which in turn implies Pareto inefficiency. Figure 1 shows the classic framework by Farrell which makes it possible to decompose overall efficiency into technical and allocative (price) efficiency. Consider the case of a simple output (Y) that is produced by using two inputs (X1, X2). Under the assumption that the production function Y=f(X1, X2) is linearly homogeneous , the efficient unit isoquant, Y=1, shows all technically efficient combinations. In Figure 2, P represents a firm, country, individual, etc., that also produces at Y=1, but uses higher levels of inputs, and is therefore less efficient in a technical sense. The magnitude of the efficiency can be expressed as the ratio between optimal and actual resource use (OR/OP). By taking into account the iso cost line (representing relative factor prices), we can identify allocative efficiency. Any point on the line Y=1 has technical efficiency, but only Q receives technical efficiency at minimum cost. Allocative (price) efficiency can be expressed as the ratio between minimum and actual cost (OS/OR), and overall efficiency is the product of technical and allocative efficiency. Figure 1: Technical, allocative, and overall efficiency
Source: OECD Health Data
Allocative Efficiency: OS / OR
Overall Efficiency: OS / OP
_______ x
S
X2
X1
P
Y = 1
R
O
Technical Efficiency: OR / OP
Q
Source: OECD Health Data
Allocative Efficiency: OS / OR
Overall Efficiency: OS / OP
_______ x
S
X2
X1
P
Y = 1
R
O
Technical Efficiency: OR / OP
Q
Leibenstein1 makes a similar distinction, albeit less formal than Farrell, and proposes the term X-efficiency, which is essentially the same as Farrell’s technical efficiency. Aigner and Chu5 show that from an empirical perspective (in)efficiency can be modeled through either linear or quadratic programming, and that Farrell’s original assumptions on returns to scale for the industry production function are then no longer necessary. Starting in the 70’s the first empirical papers appear that estimate technical efficiency within a regression framework or using Data Envelopment Analysis (DEA).
A-3
Efficiency, particularly technical efficiency, is most commonly associated with measurements taken at a single point in time. Changes over time in the technical frontier are usually studied within the framework of productivity, which in its modern form has its origin in the 50’s as well. References
1. Leibenstein H. Allocative efficiency vs “X-efficiency.” The American Economic Review 1966;53(3):392-415. 2. Debreu G. The coefficient of resource utilization. Econometrica 1951;19(3):273-92. 3. Koopmans TC. Efficient allocation of resources. Econometrica 1951;19(4):455-65. 4. Farrell MJ. The measurment of productive efficiency. Journal of the Royal Statistical Society Series A
1957;120(3):253-90. 5. Aigner DJ, Chu SF. On estimating the Industry Production Function. The American Economic Review
1968;58(4):826-839.


Appendix B Search Methodology

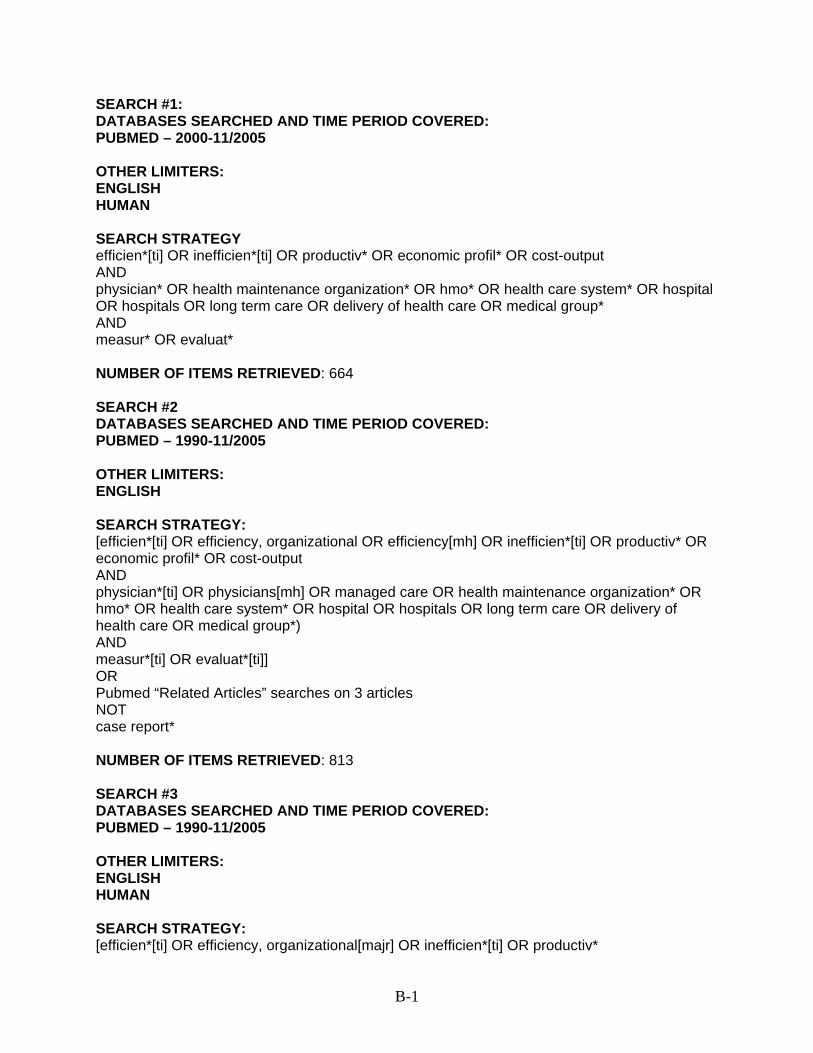
B-1
SEARCH #1: DATABASES SEARCHED AND TIME PERIOD COVERED: PUBMED – 2000-11/2005 OTHER LIMITERS: ENGLISH HUMAN SEARCH STRATEGY efficien*[ti] OR inefficien*[ti] OR productiv* OR economic profil* OR cost-output AND physician* OR health maintenance organization* OR hmo* OR health care system* OR hospital OR hospitals OR long term care OR delivery of health care OR medical group* AND measur* OR evaluat* NUMBER OF ITEMS RETRIEVED: 664 SEARCH #2 DATABASES SEARCHED AND TIME PERIOD COVERED: PUBMED – 1990-11/2005 OTHER LIMITERS: ENGLISH SEARCH STRATEGY: [efficien*[ti] OR efficiency, organizational OR efficiency[mh] OR inefficien*[ti] OR productiv* OR economic profil* OR cost-output AND physician*[ti] OR physicians[mh] OR managed care OR health maintenance organization* OR hmo* OR health care system* OR hospital OR hospitals OR long term care OR delivery of health care OR medical group*) AND measur*[ti] OR evaluat*[ti]] OR Pubmed “Related Articles” searches on 3 articles NOT case report* NUMBER OF ITEMS RETRIEVED: 813 SEARCH #3 DATABASES SEARCHED AND TIME PERIOD COVERED: PUBMED – 1990-11/2005 OTHER LIMITERS: ENGLISH HUMAN SEARCH STRATEGY: [efficien*[ti] OR efficiency, organizational[majr] OR inefficien*[ti] OR productiv*
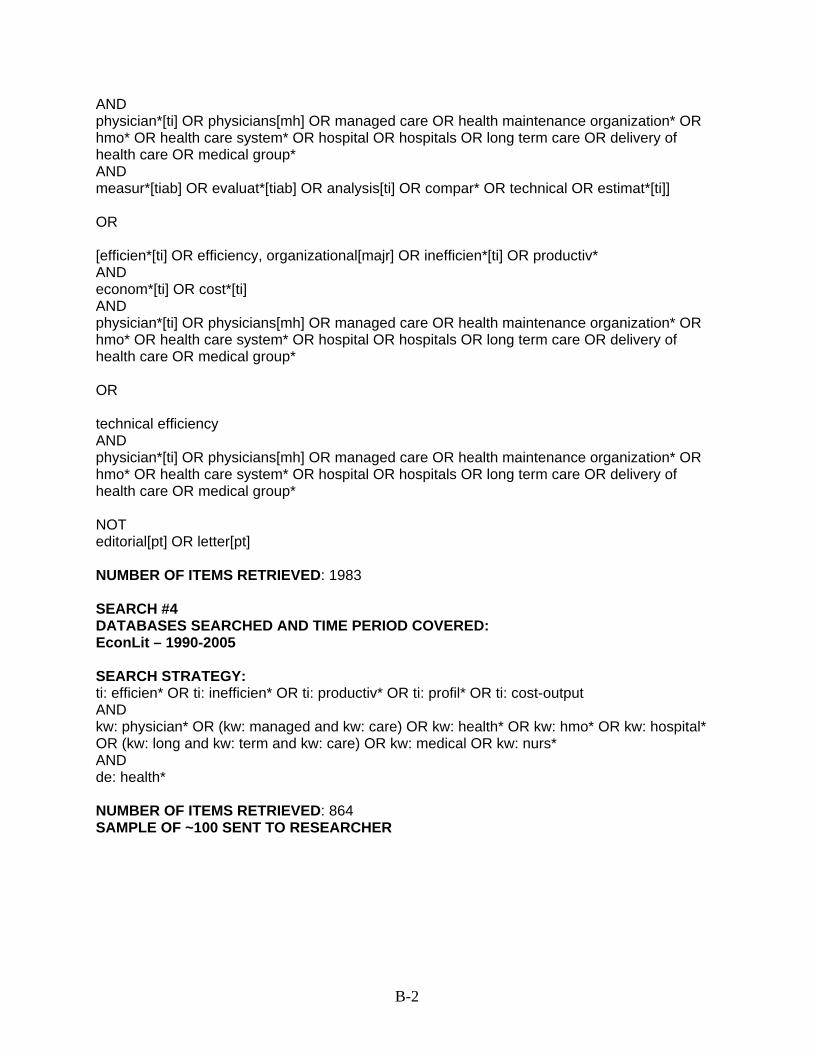
B-2
AND physician*[ti] OR physicians[mh] OR managed care OR health maintenance organization* OR hmo* OR health care system* OR hospital OR hospitals OR long term care OR delivery of health care OR medical group* AND measur*[tiab] OR evaluat*[tiab] OR analysis[ti] OR compar* OR technical OR estimat*[ti]] OR [efficien*[ti] OR efficiency, organizational[majr] OR inefficien*[ti] OR productiv* AND econom*[ti] OR cost*[ti] AND physician*[ti] OR physicians[mh] OR managed care OR health maintenance organization* OR hmo* OR health care system* OR hospital OR hospitals OR long term care OR delivery of health care OR medical group* OR technical efficiency AND physician*[ti] OR physicians[mh] OR managed care OR health maintenance organization* OR hmo* OR health care system* OR hospital OR hospitals OR long term care OR delivery of health care OR medical group* NOT editorial[pt] OR letter[pt] NUMBER OF ITEMS RETRIEVED: 1983 SEARCH #4 DATABASES SEARCHED AND TIME PERIOD COVERED: EconLit – 1990-2005 SEARCH STRATEGY: ti: efficien* OR ti: inefficien* OR ti: productiv* OR ti: profil* OR ti: cost-output AND kw: physician* OR (kw: managed and kw: care) OR kw: health* OR kw: hmo* OR kw: hospital* OR (kw: long and kw: term and kw: care) OR kw: medical OR kw: nurs* AND de: health* NUMBER OF ITEMS RETRIEVED: 864 SAMPLE OF ~100 SENT TO RESEARCHER

Appendix C Abstraction Tools

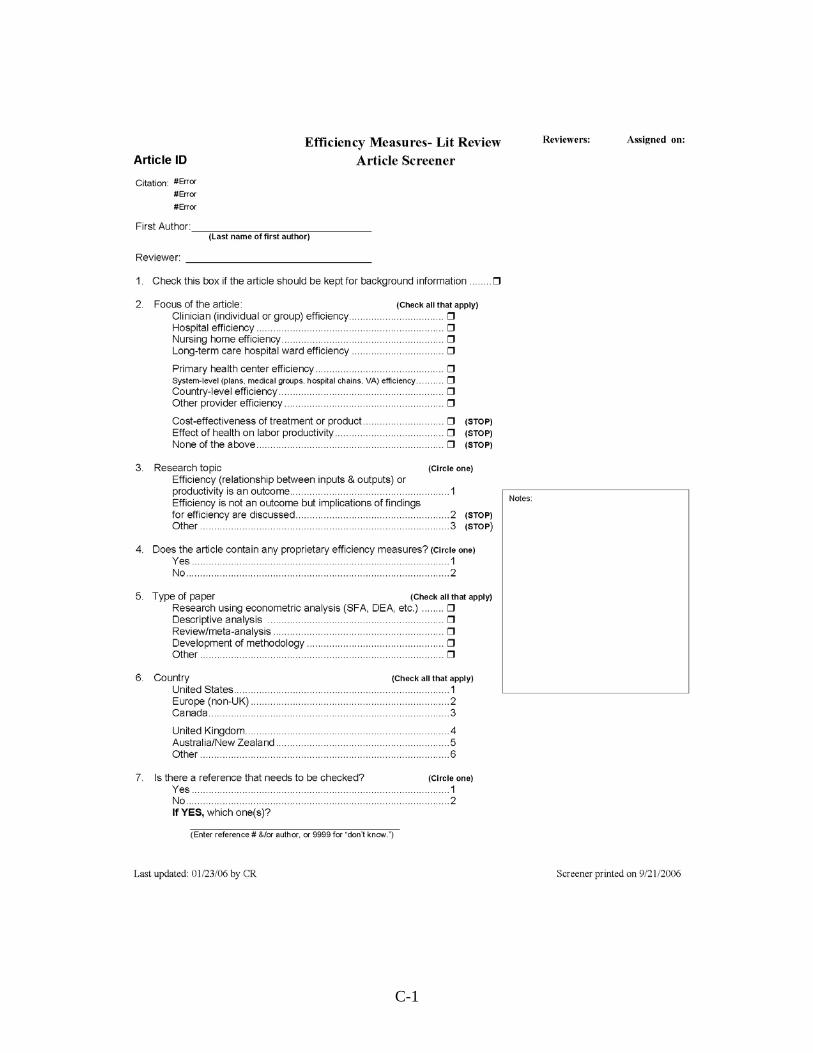
C-1
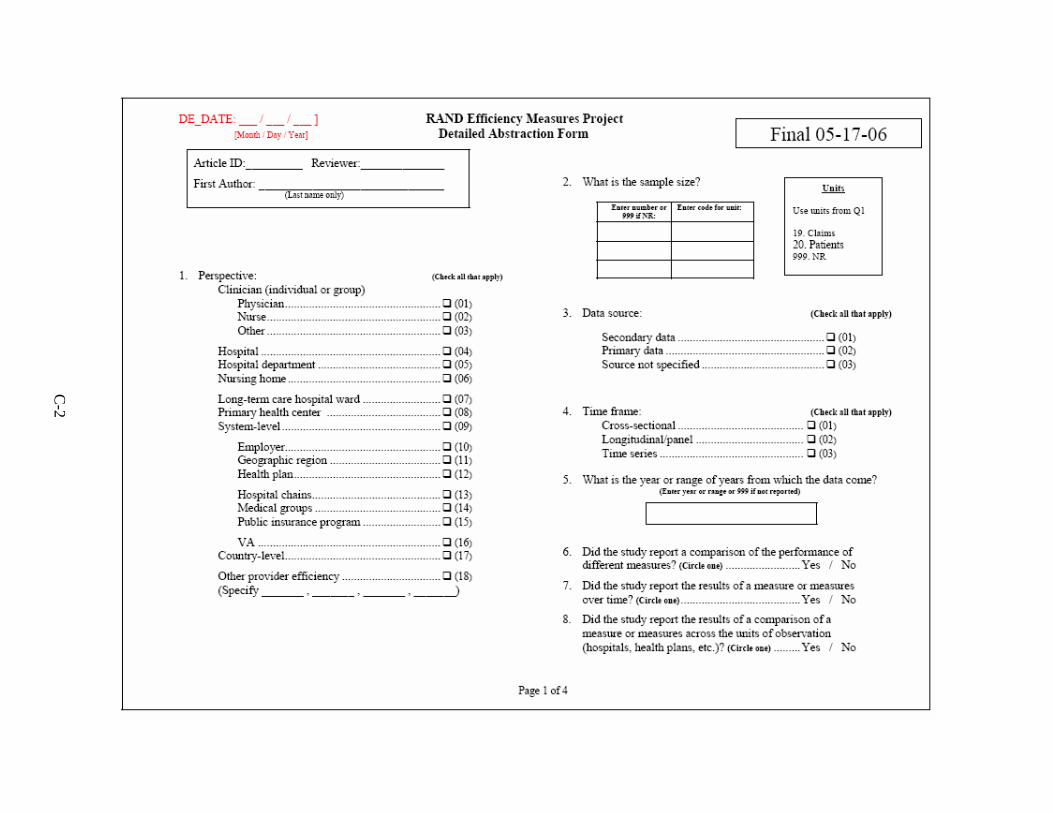
C-2
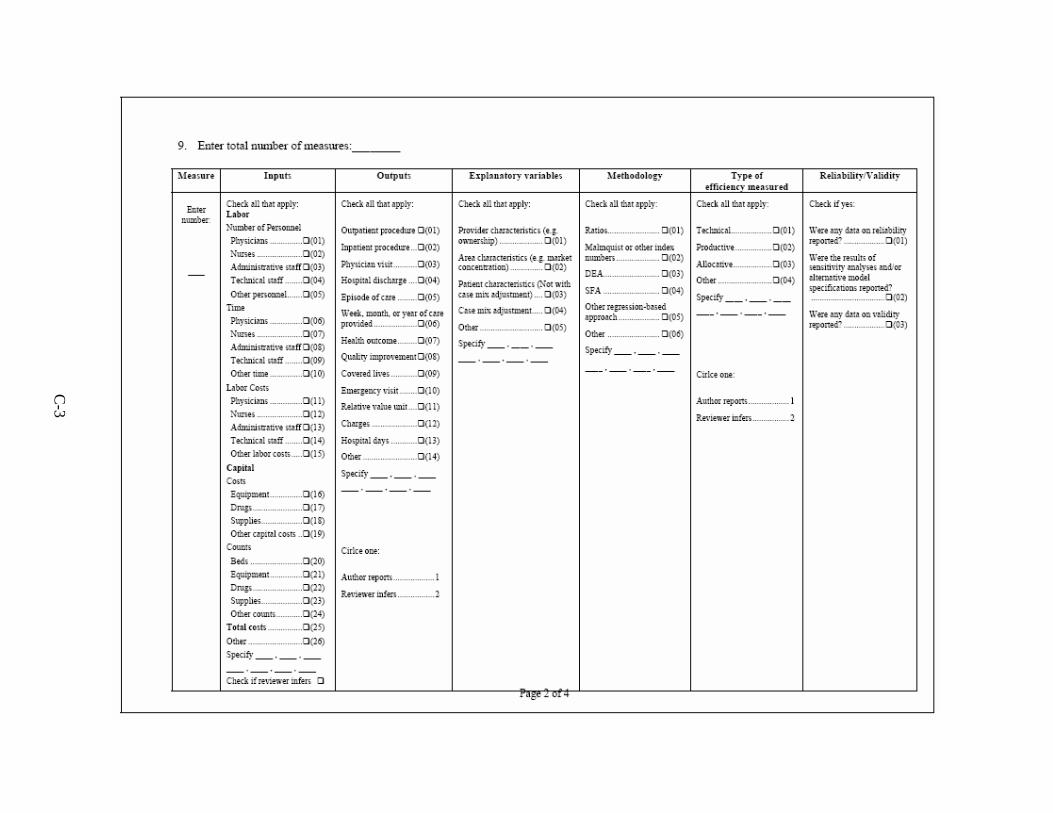
C-3
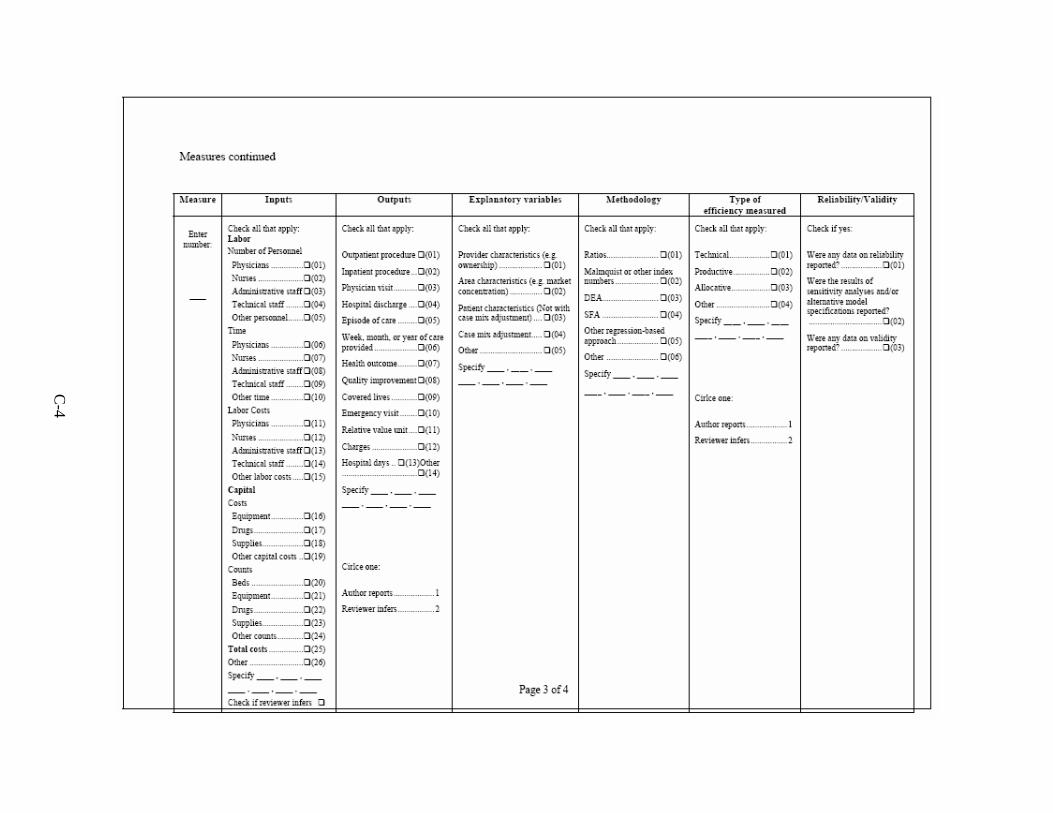
C-4
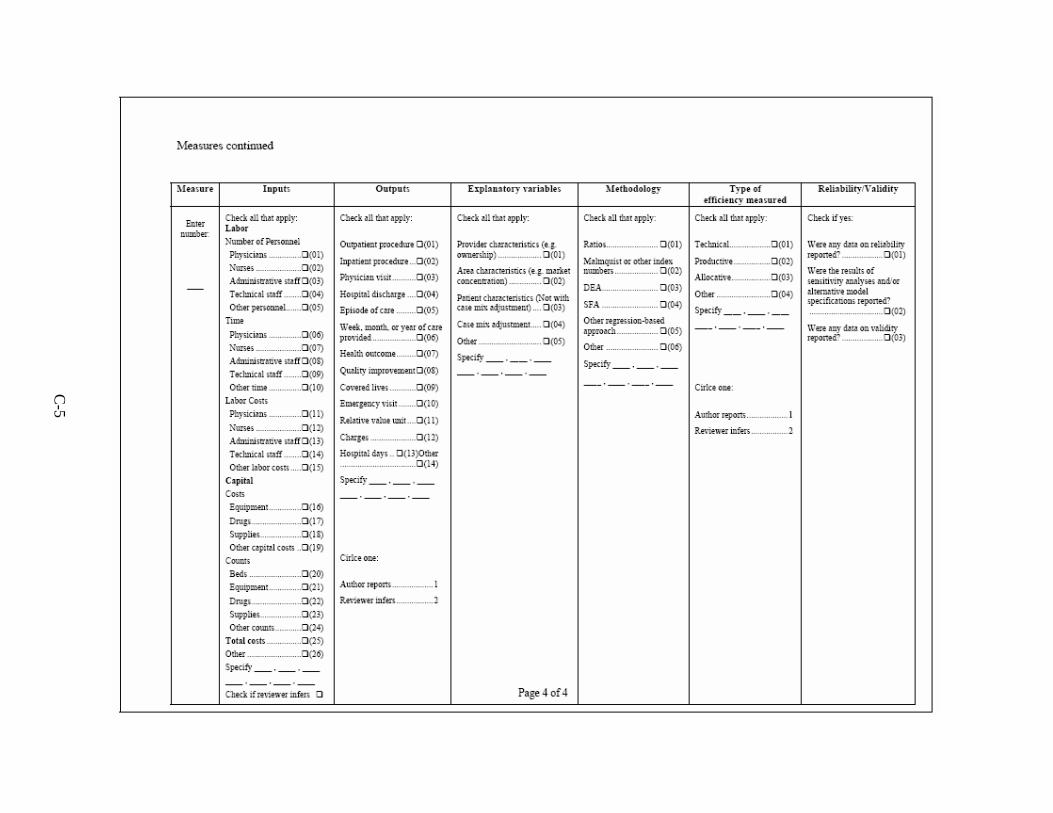
C-5


Appendix D Technical Expert Panel and Peer Reviewers

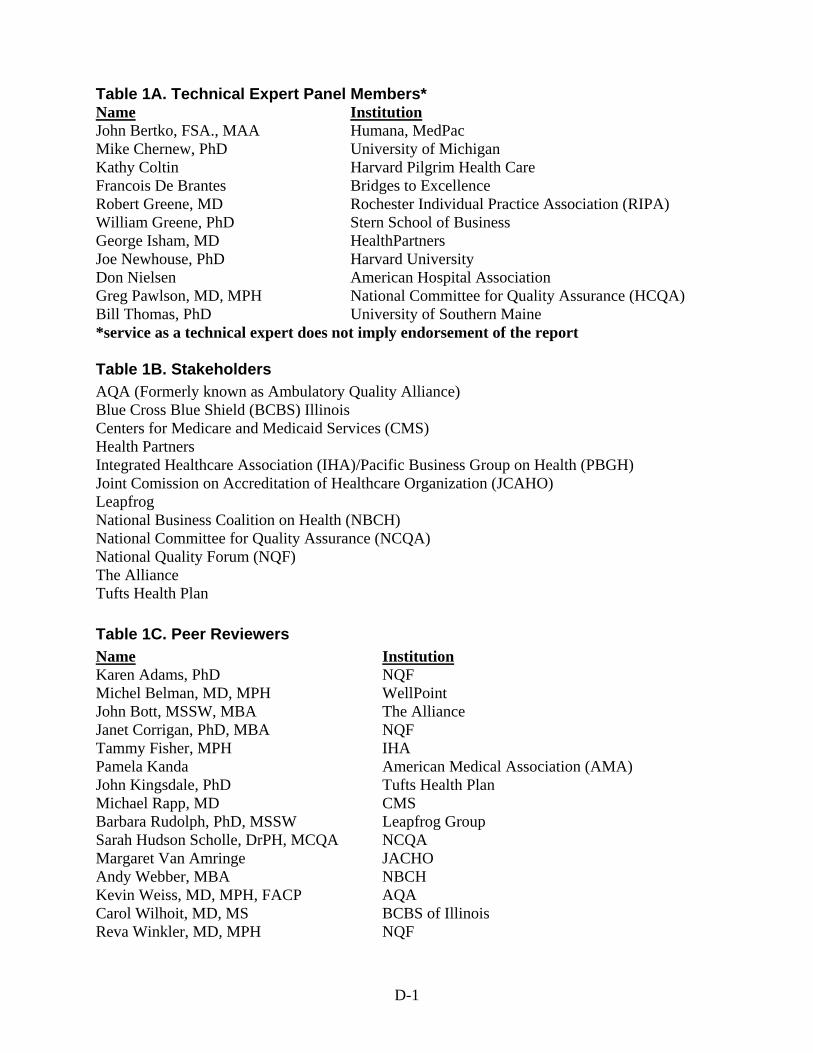
D-1
Table 1A. Technical Expert Panel Members* Name Institution John Bertko, FSA., MAA Humana, MedPac Mike Chernew, PhD University of Michigan Kathy Coltin Harvard Pilgrim Health Care Francois De Brantes Bridges to Excellence Robert Greene, MD Rochester Individual Practice Association (RIPA) William Greene, PhD Stern School of Business George Isham, MD HealthPartners Joe Newhouse, PhD Harvard University Don Nielsen American Hospital Association Greg Pawlson, MD, MPH National Committee for Quality Assurance (HCQA) Bill Thomas, PhD University of Southern Maine *service as a technical expert does not imply endorsement of the report Table 1B. Stakeholders AQA (Formerly known as Ambulatory Quality Alliance) Blue Cross Blue Shield (BCBS) Illinois Centers for Medicare and Medicaid Services (CMS) Health Partners Integrated Healthcare Association (IHA)/Pacific Business Group on Health (PBGH) Joint Comission on Accreditation of Healthcare Organization (JCAHO) Leapfrog National Business Coalition on Health (NBCH) National Committee for Quality Assurance (NCQA) National Quality Forum (NQF) The Alliance Tufts Health Plan Table 1C. Peer Reviewers Name Institution Karen Adams, PhD NQF Michel Belman, MD, MPH WellPoint John Bott, MSSW, MBA The Alliance Janet Corrigan, PhD, MBA NQF Tammy Fisher, MPH IHA Pamela Kanda American Medical Association (AMA) John Kingsdale, PhD Tufts Health Plan Michael Rapp, MD CMS Barbara Rudolph, PhD, MSSW Leapfrog Group Sarah Hudson Scholle, DrPH, MCQA NCQA Margaret Van Amringe JACHO Andy Webber, MBA NBCH Kevin Weiss, MD, MPH, FACP AQA Carol Wilhoit, MD, MS BCBS of Illinois Reva Winkler, MD, MPH NQF


Appendix E Blinded Reviewer Comments

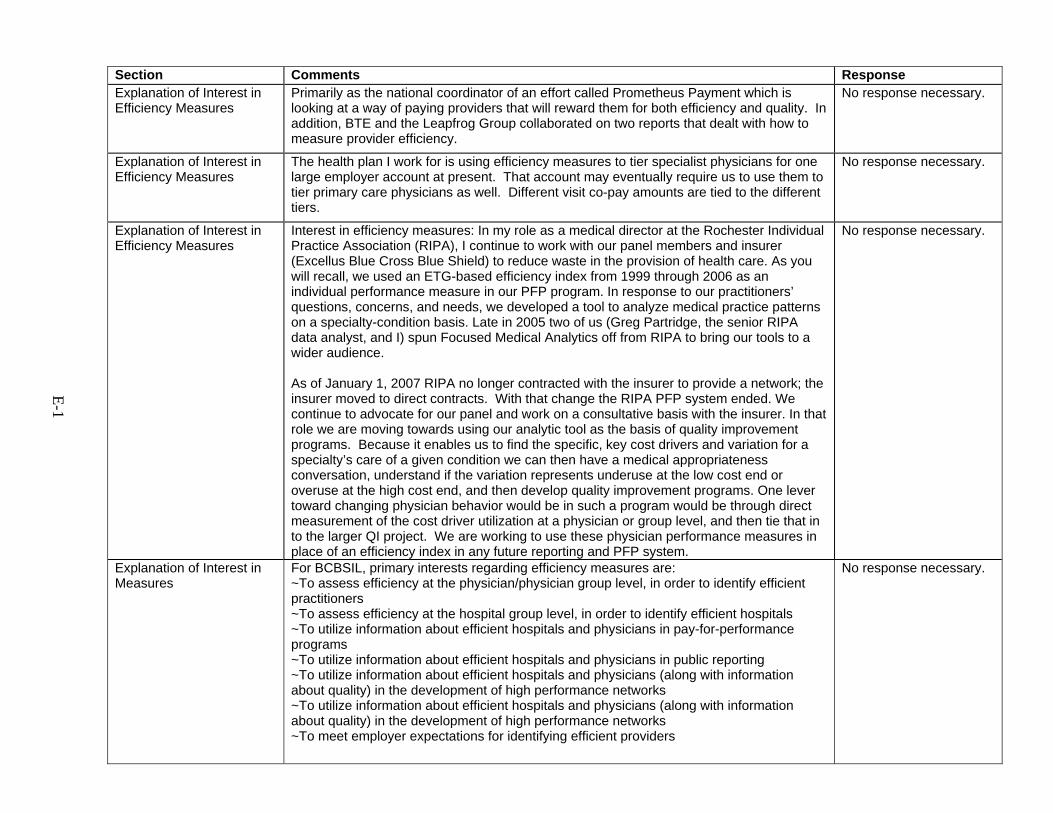
E-1
Section Comments Response Explanation of Interest in Efficiency Measures
Primarily as the national coordinator of an effort called Prometheus Payment which is looking at a way of paying providers that will reward them for both efficiency and quality. In addition, BTE and the Leapfrog Group collaborated on two reports that dealt with how to measure provider efficiency.
No response necessary.
Explanation of Interest in Efficiency Measures
The health plan I work for is using efficiency measures to tier specialist physicians for one large employer account at present. That account may eventually require us to use them to tier primary care physicians as well. Different visit co-pay amounts are tied to the different tiers.
No response necessary.
Explanation of Interest in Efficiency Measures
Interest in efficiency measures: In my role as a medical director at the Rochester Individual Practice Association (RIPA), I continue to work with our panel members and insurer (Excellus Blue Cross Blue Shield) to reduce waste in the provision of health care. As you will recall, we used an ETG-based efficiency index from 1999 through 2006 as an individual performance measure in our PFP program. In response to our practitioners’ questions, concerns, and needs, we developed a tool to analyze medical practice patterns on a specialty-condition basis. Late in 2005 two of us (Greg Partridge, the senior RIPA data analyst, and I) spun Focused Medical Analytics off from RIPA to bring our tools to a wider audience. As of January 1, 2007 RIPA no longer contracted with the insurer to provide a network; the insurer moved to direct contracts. With that change the RIPA PFP system ended. We continue to advocate for our panel and work on a consultative basis with the insurer. In that role we are moving towards using our analytic tool as the basis of quality improvement programs. Because it enables us to find the specific, key cost drivers and variation for a specialty’s care of a given condition we can then have a medical appropriateness conversation, understand if the variation represents underuse at the low cost end or overuse at the high cost end, and then develop quality improvement programs. One lever toward changing physician behavior would be in such a program would be through direct measurement of the cost driver utilization at a physician or group level, and then tie that in to the larger QI project. We are working to use these physician performance measures in place of an efficiency index in any future reporting and PFP system.
No response necessary.
Explanation of Interest in Measures
For BCBSIL, primary interests regarding efficiency measures are: ~To assess efficiency at the physician/physician group level, in order to identify efficient practitioners ~To assess efficiency at the hospital group level, in order to identify efficient hospitals ~To utilize information about efficient hospitals and physicians in pay-for-performance programs ~To utilize information about efficient hospitals and physicians in public reporting ~To utilize information about efficient hospitals and physicians (along with information about quality) in the development of high performance networks ~To utilize information about efficient hospitals and physicians (along with information about quality) in the development of high performance networks ~To meet employer expectations for identifying efficient providers
No response necessary.
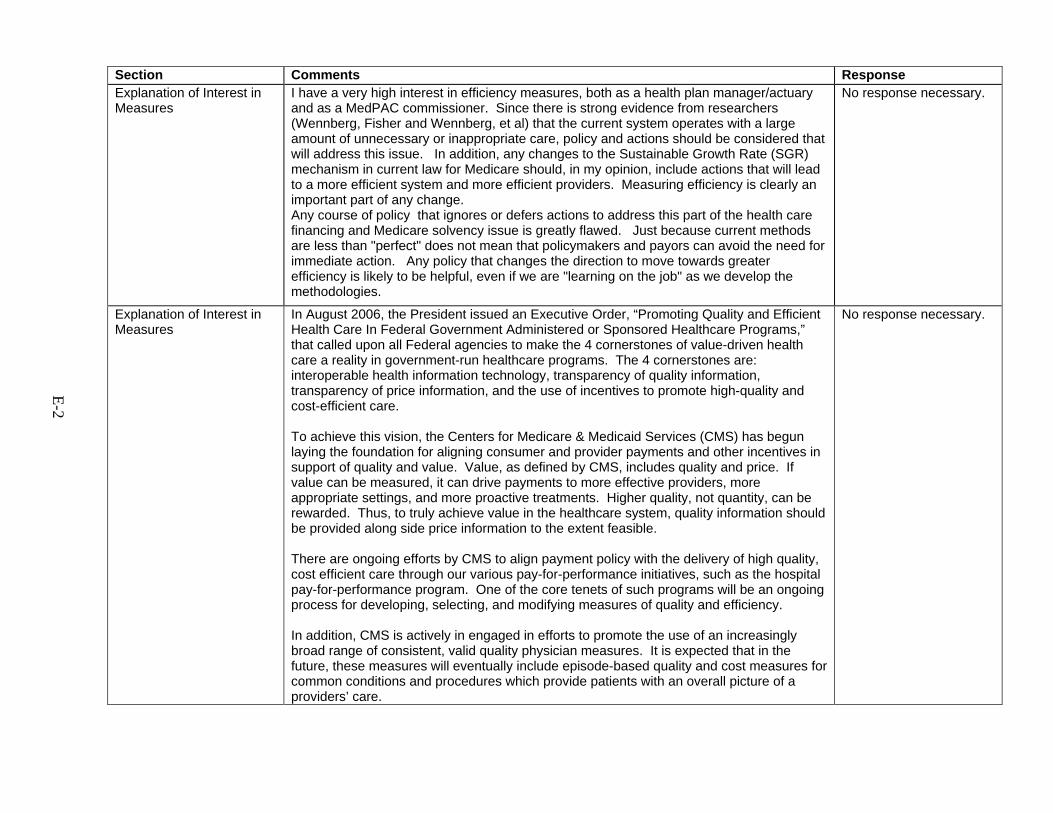
E-2
Section Comments Response Explanation of Interest in Measures
I have a very high interest in efficiency measures, both as a health plan manager/actuary and as a MedPAC commissioner. Since there is strong evidence from researchers (Wennberg, Fisher and Wennberg, et al) that the current system operates with a large amount of unnecessary or inappropriate care, policy and actions should be considered that will address this issue. In addition, any changes to the Sustainable Growth Rate (SGR) mechanism in current law for Medicare should, in my opinion, include actions that will lead to a more efficient system and more efficient providers. Measuring efficiency is clearly an important part of any change. Any course of policy that ignores or defers actions to address this part of the health care financing and Medicare solvency issue is greatly flawed. Just because current methods are less than "perfect" does not mean that policymakers and payors can avoid the need for immediate action. Any policy that changes the direction to move towards greater efficiency is likely to be helpful, even if we are "learning on the job" as we develop the methodologies.
No response necessary.
Explanation of Interest in Measures
In August 2006, the President issued an Executive Order, “Promoting Quality and Efficient Health Care In Federal Government Administered or Sponsored Healthcare Programs,” that called upon all Federal agencies to make the 4 cornerstones of value-driven health care a reality in government-run healthcare programs. The 4 cornerstones are: interoperable health information technology, transparency of quality information, transparency of price information, and the use of incentives to promote high-quality and cost-efficient care. To achieve this vision, the Centers for Medicare & Medicaid Services (CMS) has begun laying the foundation for aligning consumer and provider payments and other incentives in support of quality and value. Value, as defined by CMS, includes quality and price. If value can be measured, it can drive payments to more effective providers, more appropriate settings, and more proactive treatments. Higher quality, not quantity, can be rewarded. Thus, to truly achieve value in the healthcare system, quality information should be provided along side price information to the extent feasible. There are ongoing efforts by CMS to align payment policy with the delivery of high quality, cost efficient care through our various pay-for-performance initiatives, such as the hospital pay-for-performance program. One of the core tenets of such programs will be an ongoing process for developing, selecting, and modifying measures of quality and efficiency. In addition, CMS is actively in engaged in efforts to promote the use of an increasingly broad range of consistent, valid quality physician measures. It is expected that in the future, these measures will eventually include episode-based quality and cost measures for common conditions and procedures which provide patients with an overall picture of a providers’ care.
No response necessary.
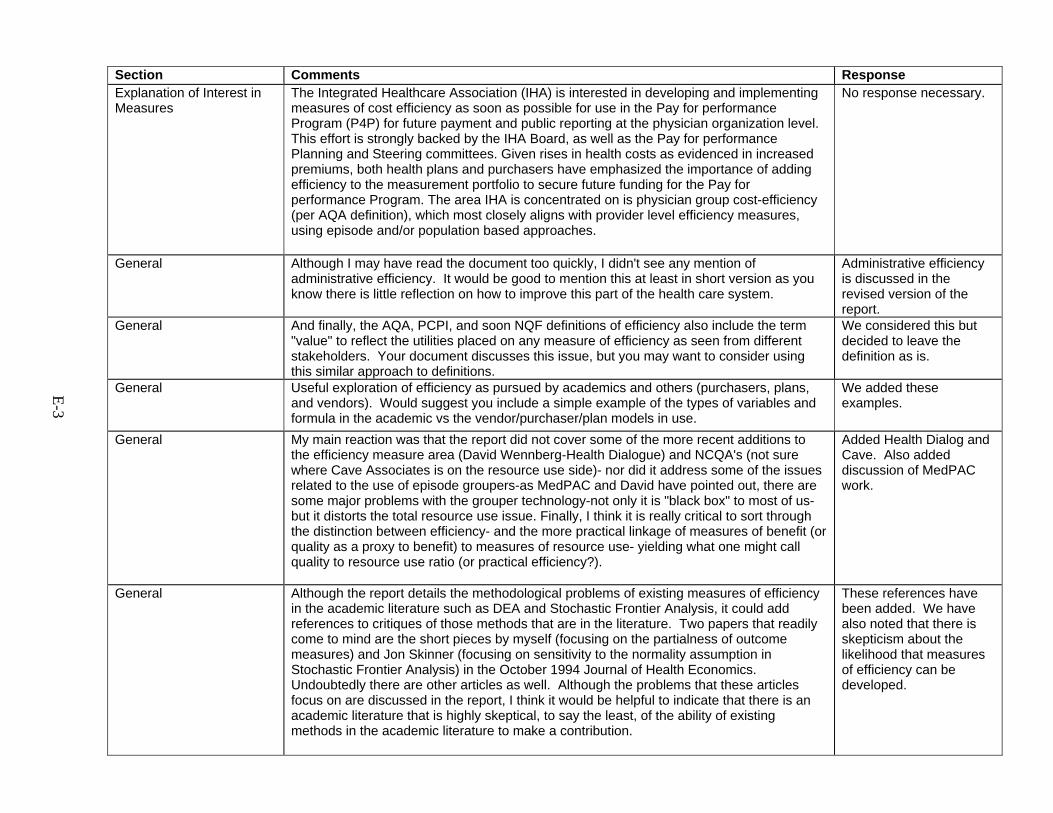
E-3
Section Comments Response Explanation of Interest in Measures
The Integrated Healthcare Association (IHA) is interested in developing and implementing measures of cost efficiency as soon as possible for use in the Pay for performance Program (P4P) for future payment and public reporting at the physician organization level. This effort is strongly backed by the IHA Board, as well as the Pay for performance Planning and Steering committees. Given rises in health costs as evidenced in increased premiums, both health plans and purchasers have emphasized the importance of adding efficiency to the measurement portfolio to secure future funding for the Pay for performance Program. The area IHA is concentrated on is physician group cost-efficiency (per AQA definition), which most closely aligns with provider level efficiency measures, using episode and/or population based approaches.
No response necessary.
General Although I may have read the document too quickly, I didn't see any mention of administrative efficiency. It would be good to mention this at least in short version as you know there is little reflection on how to improve this part of the health care system.
Administrative efficiency is discussed in the revised version of the report.
General And finally, the AQA, PCPI, and soon NQF definitions of efficiency also include the term "value" to reflect the utilities placed on any measure of efficiency as seen from different stakeholders. Your document discusses this issue, but you may want to consider using this similar approach to definitions.
We considered this but decided to leave the definition as is.
General Useful exploration of efficiency as pursued by academics and others (purchasers, plans, and vendors). Would suggest you include a simple example of the types of variables and formula in the academic vs the vendor/purchaser/plan models in use.
We added these examples.
General My main reaction was that the report did not cover some of the more recent additions to the efficiency measure area (David Wennberg-Health Dialogue) and NCQA's (not sure where Cave Associates is on the resource use side)- nor did it address some of the issues related to the use of episode groupers-as MedPAC and David have pointed out, there are some major problems with the grouper technology-not only it is "black box" to most of us-but it distorts the total resource use issue. Finally, I think it is really critical to sort through the distinction between efficiency- and the more practical linkage of measures of benefit (or quality as a proxy to benefit) to measures of resource use- yielding what one might call quality to resource use ratio (or practical efficiency?).
Added Health Dialog and Cave. Also added discussion of MedPAC work.
General Although the report details the methodological problems of existing measures of efficiency in the academic literature such as DEA and Stochastic Frontier Analysis, it could add references to critiques of those methods that are in the literature. Two papers that readily come to mind are the short pieces by myself (focusing on the partialness of outcome measures) and Jon Skinner (focusing on sensitivity to the normality assumption in Stochastic Frontier Analysis) in the October 1994 Journal of Health Economics. Undoubtedly there are other articles as well. Although the problems that these articles focus on are discussed in the report, I think it would be helpful to indicate that there is an academic literature that is highly skeptical, to say the least, of the ability of existing methods in the academic literature to make a contribution.
These references have been added. We have also noted that there is skepticism about the likelihood that measures of efficiency can be developed.
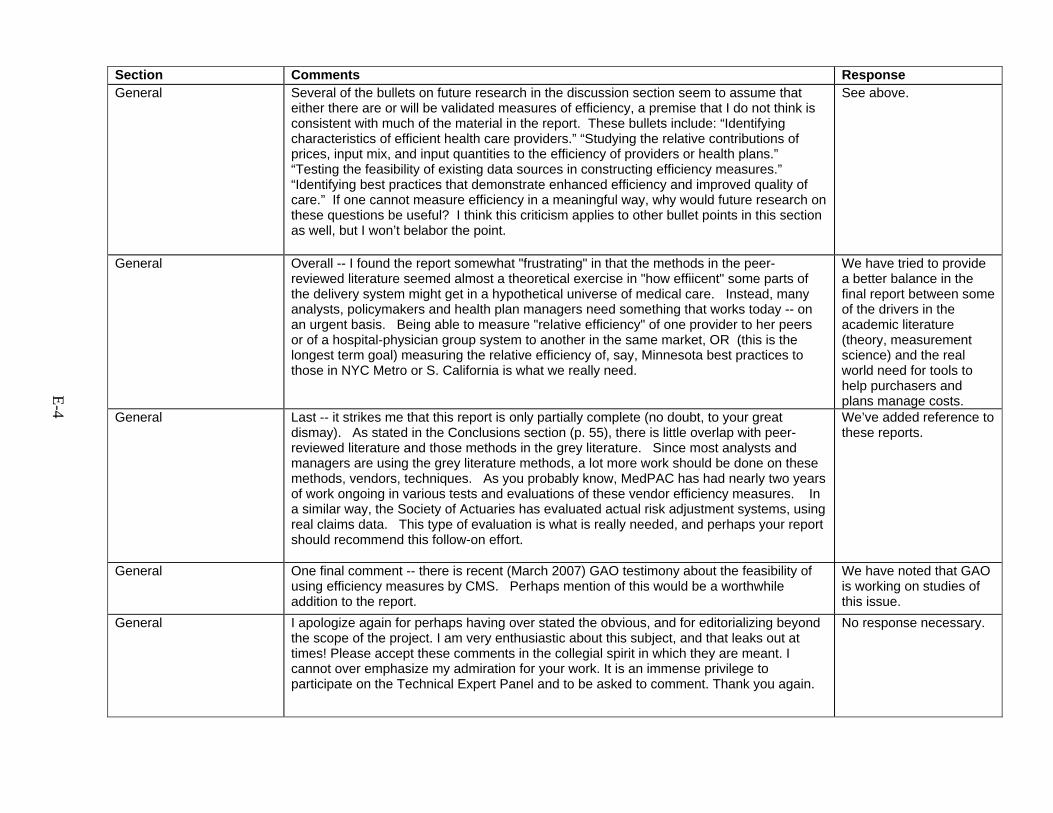
E-4
Section Comments Response General Several of the bullets on future research in the discussion section seem to assume that
either there are or will be validated measures of efficiency, a premise that I do not think is consistent with much of the material in the report. These bullets include: “Identifying characteristics of efficient health care providers.” “Studying the relative contributions of prices, input mix, and input quantities to the efficiency of providers or health plans.” “Testing the feasibility of existing data sources in constructing efficiency measures.” “Identifying best practices that demonstrate enhanced efficiency and improved quality of care.” If one cannot measure efficiency in a meaningful way, why would future research on these questions be useful? I think this criticism applies to other bullet points in this section as well, but I won’t belabor the point.
See above.
General Overall -- I found the report somewhat "frustrating" in that the methods in the peer-reviewed literature seemed almost a theoretical exercise in "how effiicent" some parts of the delivery system might get in a hypothetical universe of medical care. Instead, many analysts, policymakers and health plan managers need something that works today -- on an urgent basis. Being able to measure "relative efficiency" of one provider to her peers or of a hospital-physician group system to another in the same market, OR (this is the longest term goal) measuring the relative efficiency of, say, Minnesota best practices to those in NYC Metro or S. California is what we really need.
We have tried to provide a better balance in the final report between some of the drivers in the academic literature (theory, measurement science) and the real world need for tools to help purchasers and plans manage costs.
General Last -- it strikes me that this report is only partially complete (no doubt, to your great dismay). As stated in the Conclusions section (p. 55), there is little overlap with peer-reviewed literature and those methods in the grey literature. Since most analysts and managers are using the grey literature methods, a lot more work should be done on these methods, vendors, techniques. As you probably know, MedPAC has had nearly two years of work ongoing in various tests and evaluations of these vendor efficiency measures. In a similar way, the Society of Actuaries has evaluated actual risk adjustment systems, using real claims data. This type of evaluation is what is really needed, and perhaps your report should recommend this follow-on effort.
We’ve added reference to these reports.
General One final comment -- there is recent (March 2007) GAO testimony about the feasibility of using efficiency measures by CMS. Perhaps mention of this would be a worthwhile addition to the report.
We have noted that GAO is working on studies of this issue.
General I apologize again for perhaps having over stated the obvious, and for editorializing beyond the scope of the project. I am very enthusiastic about this subject, and that leaks out at times! Please accept these comments in the collegial spirit in which they are meant. I cannot over emphasize my admiration for your work. It is an immense privilege to participate on the Technical Expert Panel and to be asked to comment. Thank you again.
No response necessary.
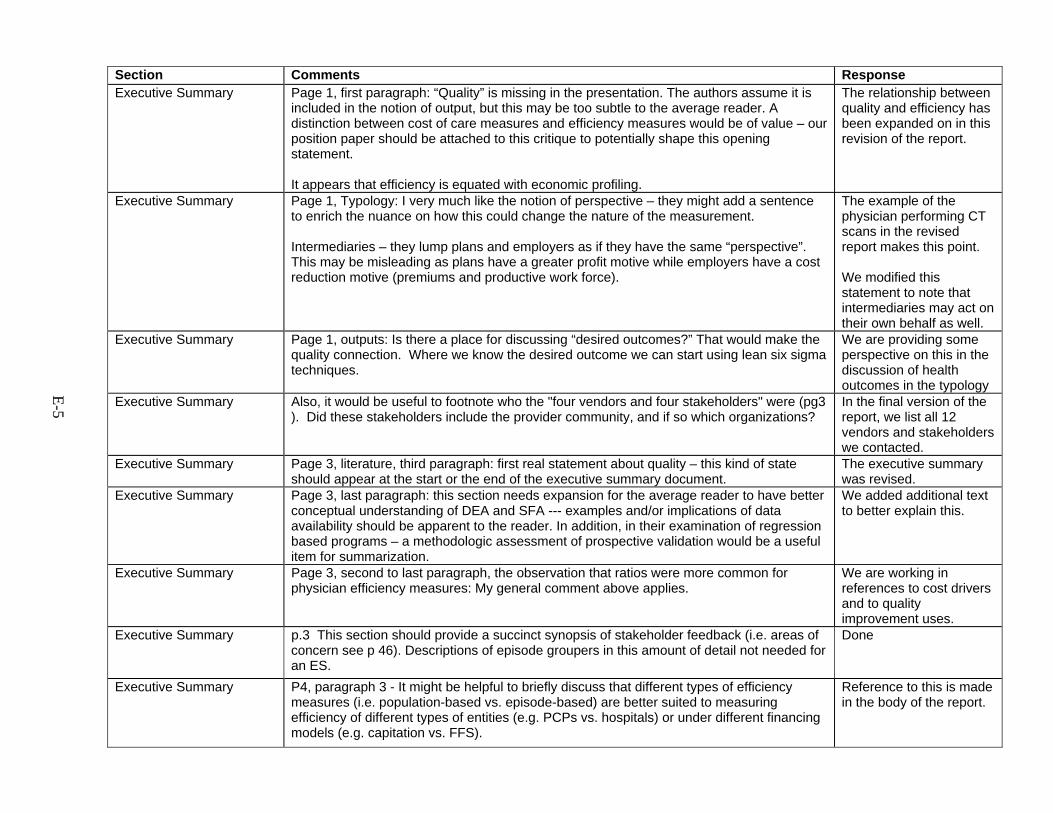
E-5
Section Comments Response Executive Summary Page 1, first paragraph: “Quality” is missing in the presentation. The authors assume it is
included in the notion of output, but this may be too subtle to the average reader. A distinction between cost of care measures and efficiency measures would be of value – our position paper should be attached to this critique to potentially shape this opening statement. It appears that efficiency is equated with economic profiling.
The relationship between quality and efficiency has been expanded on in this revision of the report.
Executive Summary Page 1, Typology: I very much like the notion of perspective – they might add a sentence to enrich the nuance on how this could change the nature of the measurement. Intermediaries – they lump plans and employers as if they have the same “perspective”. This may be misleading as plans have a greater profit motive while employers have a cost reduction motive (premiums and productive work force).
The example of the physician performing CT scans in the revised report makes this point. We modified this statement to note that intermediaries may act on their own behalf as well.
Executive Summary Page 1, outputs: Is there a place for discussing “desired outcomes?” That would make the quality connection. Where we know the desired outcome we can start using lean six sigma techniques.
We are providing some perspective on this in the discussion of health outcomes in the typology
Executive Summary Also, it would be useful to footnote who the "four vendors and four stakeholders" were (pg3 ). Did these stakeholders include the provider community, and if so which organizations?
In the final version of the report, we list all 12 vendors and stakeholders we contacted.
Executive Summary Page 3, literature, third paragraph: first real statement about quality – this kind of state should appear at the start or the end of the executive summary document.
The executive summary was revised.
Executive Summary Page 3, last paragraph: this section needs expansion for the average reader to have better conceptual understanding of DEA and SFA --- examples and/or implications of data availability should be apparent to the reader. In addition, in their examination of regression based programs – a methodologic assessment of prospective validation would be a useful item for summarization.
We added additional text to better explain this.
Executive Summary Page 3, second to last paragraph, the observation that ratios were more common for physician efficiency measures: My general comment above applies.
We are working in references to cost drivers and to quality improvement uses.
Executive Summary p.3 This section should provide a succinct synopsis of stakeholder feedback (i.e. areas of concern see p 46). Descriptions of episode groupers in this amount of detail not needed for an ES.
Done
Executive Summary P4, paragraph 3 - It might be helpful to briefly discuss that different types of efficiency measures (i.e. population-based vs. episode-based) are better suited to measuring efficiency of different types of entities (e.g. PCPs vs. hospitals) or under different financing models (e.g. capitation vs. FFS).
Reference to this is made in the body of the report.
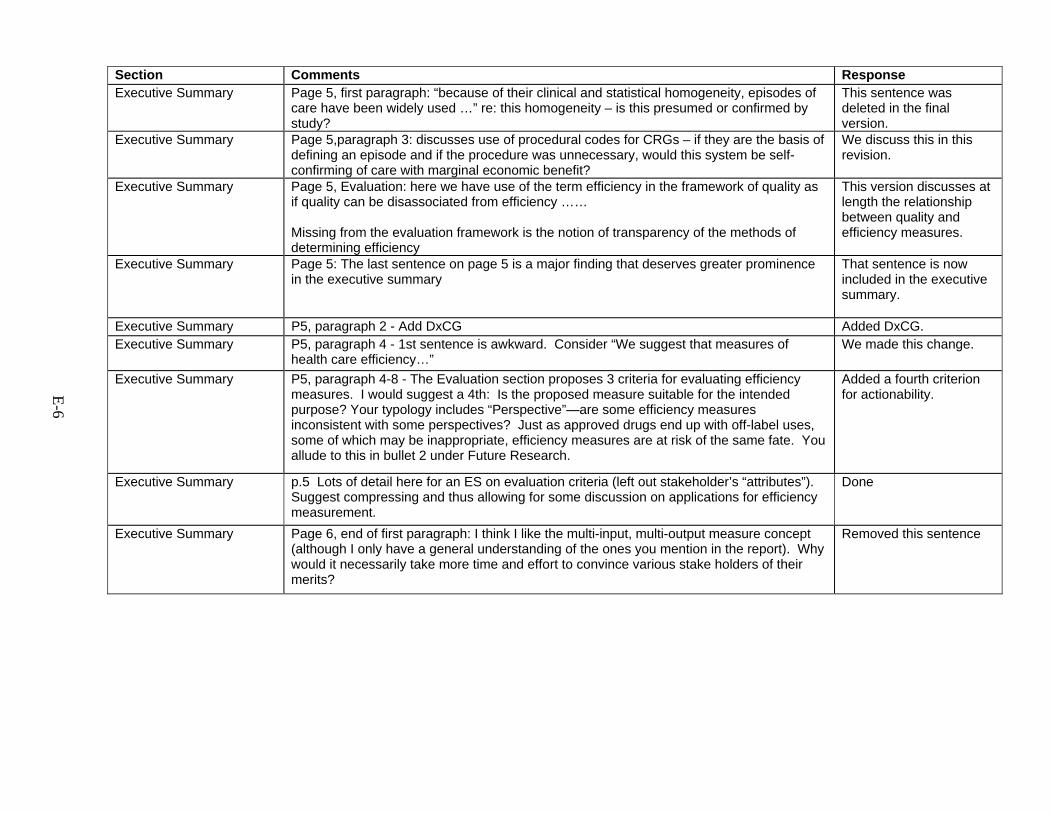
E-6
Section Comments Response Executive Summary Page 5, first paragraph: “because of their clinical and statistical homogeneity, episodes of
care have been widely used …” re: this homogeneity – is this presumed or confirmed by study?
This sentence was deleted in the final version.
Executive Summary Page 5,paragraph 3: discusses use of procedural codes for CRGs – if they are the basis of defining an episode and if the procedure was unnecessary, would this system be self-confirming of care with marginal economic benefit?
We discuss this in this revision.
Executive Summary Page 5, Evaluation: here we have use of the term efficiency in the framework of quality as if quality can be disassociated from efficiency …… Missing from the evaluation framework is the notion of transparency of the methods of determining efficiency
This version discusses at length the relationship between quality and efficiency measures.
Executive Summary Page 5: The last sentence on page 5 is a major finding that deserves greater prominence in the executive summary
That sentence is now included in the executive summary.
Executive Summary P5, paragraph 2 - Add DxCG Added DxCG. Executive Summary P5, paragraph 4 - 1st sentence is awkward. Consider “We suggest that measures of
health care efficiency…” We made this change.
Executive Summary P5, paragraph 4-8 - The Evaluation section proposes 3 criteria for evaluating efficiency measures. I would suggest a 4th: Is the proposed measure suitable for the intended purpose? Your typology includes “Perspective”—are some efficiency measures inconsistent with some perspectives? Just as approved drugs end up with off-label uses, some of which may be inappropriate, efficiency measures are at risk of the same fate. You allude to this in bullet 2 under Future Research.
Added a fourth criterion for actionability.
Executive Summary p.5 Lots of detail here for an ES on evaluation criteria (left out stakeholder’s “attributes”). Suggest compressing and thus allowing for some discussion on applications for efficiency measurement.
Done
Executive Summary Page 6, end of first paragraph: I think I like the multi-input, multi-output measure concept (although I only have a general understanding of the ones you mention in the report). Why would it necessarily take more time and effort to convince various stake holders of their merits?
Removed this sentence
E-7
Section Comments Response Executive Summary Page 6, last two sentences of second paragraph: Yes! Equal quality outputs are assumed
(among other things). That’s why we needed to find key cost drivers. Without quality outputs you need some way to judge if we’re asking physicians to do the right thing. Example: in several regions where we’ve looked at practice patterns in hypertension, the only thing that matters is prescribing patterns. (We’ve found about 4 different patterns by the way – 3 ways of being expensive and two ways of being less expensive.) Without blood pressure and side effect outcomes, however, we can’t say that more costly is worse. Some patients need only one med and some need 3 or 4. But we can say that your mix of medications should be weighted more towards thiazide diuretics and ACE-inhibitors than ARBs and calcium-channel blockers. That would decrease some overuse-type waste, and there are clinical guidelines to back that up. I think if we did have outcomes, however, we would get a great deall further. Then you could continue whittling away at the regimens as long as you were moving towards the desired outcome.
We have added this example with attribution.
Executive Summary Page 6, first paragraph: the finding that no articles were found on successful use by policy makers deserves greater prominence in the summary
We made this change.
Executive Summary Page 6: The last sentence in the first paragraph is vague – is this a good thing or a bad thing that it takes more time and effort to convince people about their merits?
This sentence has been deleted in the revised report.
Executive Summary Page 6, Scientific Soundness: another key finding for greater prominence – the lack of testing of the scientific soundness of efficiency measures – there needs to be a greater definition of what are stochastic vs. deterministic models for efficiency
We have prominently highlighted this in the executive summary and discuss in more detail the strengths and weaknesses of various approaches. We believe this is best explained in the Explanation of Methods box in the Results chapter.
Executive Summary Page 6: The last sentence also needs greater prominence – that many methods assume equivalent quality of all outcomes
This version discusses at length the relationship between quality and efficiency measures.
Executive Summary Some of the points of emphasis listed above should appear here The notion of social efficiency appears here but not earlier in the text …Why?
We reworked the presentation of social efficiency in this version and have now introduced and defined social efficiency prior to this reference.
Executive Summary Page 7: Last bullet in discussion fails to mention proprietary measures as a cause of disagreement in the different stakeholders
This sentence has been deleted in this version.
E-8
Section Comments Response Executive Summary Page 7, Future research: no mention of evaluating teams or units vs. individual providers We agreed this is
something useful for future research but did not add it to our already full list of future research items.
Executive Summary P7, heading - The heading “Discussion” in the Executive Summary is labeled “Conclusions” in the main report (see page 55). The contents read more like Conclusions.
This has been changed in the Executive Summary to “conclusions”.
Executive Summary Page 7, last bullet point: I would add poorly defined outcomes to the list of possible causes. This has been added.
Executive Summary p.7-8 Ditto on discussion section & research agenda as recommended below for Ch 5. Done Executive Summary Page 8: third bullet on page 8 again assumes quality is independent of efficiency. The relationship between
quality and efficiency has been more extensively detailed in this revision.
Executive Summary Page 8: In bullet one there is also the sensitivity to various methodological differences. The second bullet refers to various objectives, but these are all varieties of making a judgment (does this doctor deserve higher payment, three stars, inclusion in the network, etc.) rather than improving quality or efficiency (it seems to me). Re: the third bullet I think the way to incorporate quality of care into efficiency is a combination of waste reduction through decreased overuse and misuse, and lean-six sigma processes; can that be worked in some how? In the fifth bullet, identifying characteristics of efficient health care providers will require details and behaviors to change. Finally I suggest adding to the list of critical research topics one about defining in a measurable, quantifiable, and reproducible way, desired outcomes condition by condition, so that quality improvement techniques can be applied.
We have incorporated many of these comments in the body of the report.
Executive Summary On page 8, one of the bullets for future research states that we should study "relative contributions of prices, input mix, and input quantitites to the efficiency of providers or health plans." The real question is "Why is this important?" If the quality and dollar-cost-denominated effficiency are the same, why do we care if one part of the country delivers care differently than another? Is one type of delivery system inherently better? Probably not.
This has been deleted from the Executive Summary.
Executive Summary P8, future research - Suggestions for additional bullets: ~Methodologies for establishing peer groupings of providers ~Attribution methodologies for physician efficiency measurement ~Which inputs should be included for which providers (e.g. who controls what?) and how should those inputs be priced? For example when using actual costs for measuring physician efficiency, should neutral pricing be applied to hospital room and board expenses?
We have added these in the body of the report.
E-9
Section Comments Response Executive Summary I remain concerned that there is still a little too much weight given to the industry-
developed measures of "efficiency," which are just ratios of input costs (individual to group comparisons). This is reflected by nearly a page (half of pg 4 and half pg 5) out of the total 8 pages being devoted to describing some of the main proprietary products. I would suggest just a mention of these in no more than a short para.
We attempted in this revision to achieve a better balance between the published measures and the industry developed measures.
Executive Summary In the discussion section last bullet suggest that there is disagreement between various stakeholders... however the AQA has a consensus document on definitions of efficiency. (this document was voted on by more than 100 stakeholders). This same definition is being used as part of the PCPI policy document on cost-of-care measurement. Also, this same definition is being used in the draft NQF document on efficiency and episodes of care. However this is not reflected in the exec summary, or the main document.
We acknowledged in more detail the AQA’s position in this revision but also note that among stakeholders and peer reviewers in this report there was still disagreement about the definition of efficiency.
Executive Summary Also, important that while the industry vendors have been using are cost-of-care ratios rather than measures of input to outputs, and thereby do not even meet your document's definition of efficiency.
We disagree and believe that the industry vendors’ measures do meet our definition of efficiency.
Chapt. 1 - Intro In this introductory chapter efficiency (as well as value) should be defined more explicitly upfront. Efficiency is later defined as an attribute of performance in Ch 2 and we are told how it is measured (relationship of inputs to outputs) but need to be clear on the parameters of efficiency here (mainly costs).
Done.
Chapt. 1 - Introduction Lists Leapfrog as a measures developer – this is a stretch – No mention of the PCPI We added PCPI Chapt. 1 - Introduction Paragraph 3 – first real mention of the concept of value – it is mentioned in the first
paragraph in the executive summary – but then disappears from the paper. ”Value” is useful for framing the debate but we omit it from the rest of the document since our task was to develop a typology of “efficiency”—“value” was not part of the nomenclature adopted for our typology.
Chapt. 1 - Intro Chapter 1, page 11, 2nd paragraph, I suggest adding AQA to the list of groups defining health care quality measures.
This was added
Chapt. 1 - Introduction Page 12 –nice definition of efficiency that should be pulled into the executive summary This definition has been added in the executive summary.
E-10
Section Comments Response Chapt. 1 - Introduction Bullet in perspective – refers to intermediaries who “act on behalf of providers or
individuals --- no mention of their own profit motive or self interest. It is true that there is no mention of the other motives that intermediaries may have but there is no implication nor indeed expectation that intermediaries are free of other interests. We do not expect that readers will assume that intermediaries, nor providers, are free of other motives including profit or self-interest.
Methods Data Sources: As acknowledged in the report, academics and vendors/purchasers/plans rely on administrative data sources for measuring efficiency.
We have revised this section to reflect this observation.
Methods Data Sources: Administrative data was termed problematic by the authors, without any clear evidence that for this specific use it might be adequate. I have seen no evidence in the literature that indicates that the use of administrative data for measuring efficiency is inadequate.
We agree and have modified references to the problems with administrative data.
Methods Data Sources: Severity adjustment tools and groupers utilizing administrative data have been shown to have high C statistics for certain conditions using certain products—since no one has looked at administrative data for efficiency measurement it is somewhat arbitrary to indicate that the data source is problematic and that the resulting measurement would be better using clinical data sources. Is it not true that clinical data sources without administrative data would hinder the development and use of efficiency measures? Imagine searching through ambulatory clinical records for visits provided by others.
We agree and have modified the text to reflect this.
Methods Data Sources: For this document to have greater value to vendors/purchasers/plans adopting a more neutral stance on methods would be useful; this document as written has an academic bias. It could be noted that academic models have the same potential problem (secondary use) that is applied to administrative data, given that academics are not designing their models to be used in the real world of pay-for-performance.
We have modified the text to try to communicate a more neutral stance.
E-11
Section Comments Response Method I am not that familiar with the DEA and SFA type measures. Could you provide a simple
example of each early on in the report? Then the concepts would be easier to follow later on. This is a non-economist speaking, of course. It seems like the efficiency index concept is getting applied in more and more places (I understand IHA is considering using it, for example). The report spent a good deal of time on the academic papers, and less on physician efficiency measures. Given the increasing pervasiveness of efficiency index measures, they may deserve more space and discussion.
We now reference the box in the results chapter, which describes the methods in greater detail and includes references to these methods.
Chapt. 2 - Methods A scan of Appendix F, Characteristics of Health Care Efficiency Measures Published in Peer-Reviewed Literature (1982-2006) raises some very useful questions that pertain to the implications of existing research for future, practical efforts to develop efficiency measures for large-scale implementation and use. Three basic approaches to resource (input) enumeration seem apparent in the literature: [A] operationalization/measurement of inputs using costs; and [B] operationalization/measurement of inputs using number of units - especially manpower units (e.g. physicians, nurses); [C] a hybrid of the two. RAND defines efficiency as "an attribute of performance that is measured by examining the relationship between a specific product of the health care system (also called an output) and the resources used to create that product (also called inputs). Others have defined efficiency as the cost of producing a given level of output, or quality. Risk adjustment and episode groupers have attempted to increase comparability across patients. There is a question whether heterogeneity in some fundamental characteristics of producers and the inputs/technology that they use should similarly be addressed. In other words, it would seem that a measure of efficiency should hold constant variation in patient characteristics that might affect the amount of resources used, but also some physician characteristics that might affect resource use. For example, two physicians of similar training and background may differ in efficiency if one uses more tests and time, than the other. On the other hand, medical students and new doctors may use more resources (diagnostic tests, for example) in producing care initially because they have not built up their stock of human capital that comes from years of learning-by-doing and experience (whether direct or vicarious). More seasoned doctors may be able to treat the same case more quickly or with fewer inputs. Without accounting for heterogeneity in the sheer number of years as a proxy for human capital, a strict interpretation of efficiency may identify newer producers as inefficient relative to older producers. This may not be desirable.
We tried to discuss in greater depth and nuance these various themes.
E-12
Section Comments Response Chapt. 2 - Methods Based on your review of the literature, how much variation is there in the way costs are
identified and measured across studies, and what implications are there for developing some form of standardized cost reporting for use in efficiency measurement?
There is a great deal of variation in way costs are identified and measures across studies and we expect it would be a substantial challenge to standardize this.
Chapt. 2 - Methods On page 13 -- the whole section on Outputs being either health services (number of visits, drugs, admissions, etc.) misses the point. There will always be some exchange between, say, higher drug compliance and use and lower admissions or visits to the E/R. Neither one is inherently "better" than the other in terms of number of services. Similarly, while I would love to have good measures of health outcomes for every health status/disease/treatment, this is likely not possible in the near future. Thus, we are left with only dollar-cost denominated measures as the only practical ones.
We have edited the text to reflect that neither approach is inherently better or worse.
Chapt. 2 - Methods Top of page 13, of course CDHPs are attempts to put individuals directly in contact with providers.
We have added this observation.
Chapt. 2 - Methods Page 13, discussion of outputs: Is there a place here to discuss quality of outputs? Also, where does patient-centeredness fit in? I’m working with a fellow with a six-sigma background, and he talks about connecting the set of patient preferences (the “voice of the customer”) to the set of desired outcomes and then measuring the costs to get there. Next paragraph, last sentence “Greater opportunity for conflict may arise…” I’m not sure why this should be. Perhaps a concrete example would clarify. Is there a particular issue you are getting at?
We have added a reference to consumer experience as being an extension of the health outcomes category. We moved the sentence referring to conflict.
Chapt. 2 - Methods P13, paragraph 7 - Re comparability of outputs: Using the example of “by specialty for physicians” begs the question of how to define specialty. When pooling provider directories across health plans we identified many inconsistencies across plans in the listed primary and secondary specialties for the same physician. The Bd of Registration in Medicine files are not that helpful either. Should the mix of ETGs be used in some fashion (e.g specialty “fit” statistic)?
We have added this example.
Chapt. 2 - Methods p.14 par.1 In this paragraph it would be helpful to present the rationale why the AQA defines efficiency as “a measure of the relationship of cost of care associated with a specific level of performance measured in respect to the other 5 IOM aims (effectiveness, safety, equity, timeliness, patient-centeredness) of quality”. For example, the unintended consequences of only measuring costs without regards to patient outcomes. Or deeming a provider efficient (i.e. performed a CABG perfectly efficiently) without considering appropriateness of the intervention (should it have been done in the first place).
We have added the rationale.
Chapt. 2 - Methods Page 14, last two sentences before “Input” section: Yes, this is why well specified definable desired outcomes are a key research question.
Added to future research section.
E-13
Section Comments Response Chapt. 2 - Methods P14, last 3 sentences - Here again, there’s a seeming ambivalence re whether the failure
to use health outcomes as the output of interest for efficiency measurement is something that should be remedied or if outcomes should be addressed in the quality domain instead. The authors could add something like “However, health outcome measures of quality can be used in the side-by-side comparisons referred to above (e.g. risk-adjusted cost of cancer care and 5-year survival rates).”
We have edited the text to reflect that either health services or health outcomes are reasonable outputs to include in efficiency measures.
Chapt. 2 - Methods P14, paragraph 4 - The last sentence in this paragraph reads, “The way in which inputs are measured may influence the way the results are used”. One could just as easily say, “The measurement objectives may dictate which inputs are measured.” I prefer the idea of beginning with an objective. At the least, I would say, “…will dictate the way results should be used.”
Done.
Chapt. 2 - Methods p14 bottom - p. 15 top You also need to set up social (allocative) efficiency here for the discussion later on p 21. It is part of the stated typology in regards to inputs.
We have introduced this concept here as suggested.
Chapt. 2 - Methods P15, paragraph 2 - Just as the authors point out the need for comparability of outputs, it would seem that a key issue in the discussion of inputs is whether the inputs are comparable. One problem area we’ve encountered in establishing comparable inputs is aligning cost data for physicians paid on a FFS basis with that for physicians or groups paid on a capitated basis. There are payments in capitated contracts that should be allocated to services in order to get truly equivalent service level payments. This can also be true when contracting with groups on behalf of physicians who are paid FFS; the group may receive payments that should be allocated to services. This is an argument for using neutral pricing.
Done.
E-14
Section Comments Response Chapt. 2 - Methods Part I
Page 15, last paragraph: This is where judgmental systems break down. The physician with a 20 percent co-insurance has a competitive advantage over the other two LASIK providers. It is to her advantage to maintain that advantage and increase her share of the local LASIK business. Therefore she has an incentive not to share any “best practice” knowledge. The stronger the judgment, the more the pressure to keep best practice proprietary. This would include knowing about generic medication. Also, she would never tell another surgeon that her nurse was faster – the nurse would get poached. (A shortage of any non-physician helper leads to this problem, which I have actually seen in a different specialty in our community. A larger practice was hiring away a certain type of technician from smaller practices, making them less able to compete.) We were able to maintain cooperation in our PFP system I think because we had counterbalancing system forces (for example, gain-sharing on non-physician expenses, and specialty budgets that bound together the performance of all practitioners in the specialty). Also, PFP I think would be weaker deterrent to cooperation than co-insurance tiers for elective surgery. I don’t think analysis without external reference would work. For example, physicians may have asymmetric knowledge (for example that the general anesthetic is a less expensive alternative). Asymmetric knowledge is both a competitive advantage but also by definition is not (yet) available to the other practitioners. Therefore there needs to be an outside agent with a broader perspective working with the practitioners. In the manufacturing world, this would be the idea that line workers can tell you about special case variation while management has to understand common cause variation. (I’m thinking of special causes like a worker being able to say “Last Friday we were less productive because our co-worker Larry was out sick” vs common cause like management finding out that Mondays are generally least productive because they are the day after the weekend.)
We have changed the example to cataract surgery and have made it focus more on the math and the concepts than the sociology of change.
E-15
Section Comments Response Chapt. 2 - Methods Part II
The way to make LASIK surgery less expensive in this micro-environment would be to remove tiers and organize a quality improvement initiative. This would require analysis by an organization at a level higher than the competing physicians, and that organization would have to be able to align the financial incentives. The organization could be an IPA, health plan, or integrated delivery system, but the principles would be the same (they would require different methods of aligning the financial incentives). I’m not sure if LASIK is the best example, because as non-medically necessary procedure I presume it is rarely covered by an insurance company. On the other hand, it may respond more to market forces than other procedures precisely because it is elective and paid directly by patients. To be more realistic you might make the costs be more like $400 to $1000, and the charge might be $1000 to $2000 (all figures per eye). Of course, the charges depend on many factors including the region (what each market will bear). In Buffalo, NY practitioners need to compete with Canadian clinics that advertise $299 (USD) per eye. Interestingly, that seems to be less a problem when you get to Rochester, only 60 miles to the east. Another interesting economic aspect is that optometrists refer the patients to ophthalmologists, but also do the pre-op and post-op care for LASIK. The optometrists therefore negotiate a fee from the ophthalmologists for pre- and post-op care. Cataract surgery might be an example that works better for the intended audience, for example for Medicare. Similar issues with optometrist referral and participation apply in that case, although Medicare sets their fee through the use of CPT modifiers.
The example has been changed to cataract surgery.
Chapt. 2 - Methods p15 I don’t care for this example (personal bias) particularly since it is an elective procedure. It is very “production” oriented. I think a common chronic condition such as diabetes or even low back pain would resonate better here.
The example has been changed to cataract surgery.
Chapt. 2 - Methods I did not feel, however, that the Lasik example was particularly helpful. It certainly illustrates the difficulty of comparison when dealing with multiple variables, but then again, anyone not really well versed in quadratic math could say that solving any equation with more than two moving variables is a tough exercise, so I'd get rid of the example.
We’ve left the example for those readers who might find something more concrete helpful. We changed the Lasik example to cataract surgery.
E-16
Section Comments Response Chapt. 2 - Methods P16, paragraph 2 - I thought I understood the difference between technical and productive
efficiency as explained on pages 14 and 15 until I got to the last sentence in this paragraph. If I understand the last sentence, it’s stating that standard pricing does not reflect productive efficiency. Is the point that actual costs or prices would reflect productive efficiency, but that standard pricing would not? I would think that standard pricing does reflect the mix of inputs, which I thought distinguished productive efficiency from technical efficiency. A physician who routinely performs a lab test that avoids a large percentage of hospitalizations should have a lower episode cost than a physician who doesn’t perform that test and has more hospitalizations, whether using actual or standard pricing. Maybe I’m just hopelessly confused.
Standard pricing does reflect the input mix and hence reflects productive as well as technical efficiency.
Chapt. 2 - Methods Page 16, last sentence: this is a place where a simplified example of DEA and SFA would be helpful.
We’ve added a simpler description of these methods to the executive summary and the example in the typology.
Chapt. 2 - Methods On page 19, the paragraph on cost per covered life mentions one reason that cost per covered life may not be an accurate measure of efficiency. “Large national employers may have some difficulty accounting for differences in market prices.” Another limitation to comparison across geography is differences in state mandates. While these might not apply to plans covered by ERISA, many national employers with ERISA plans also purchase non-ERISA local plans such as HMOs. Illinois, for example, mandates rich infertility treatment benefits for HMO plans. These mandates make it difficult to standardize benefit packages across the country.
We added this comment.
Chapt. 2 - Methods P19, paragraph 6 - Generic prescribing—there is also an assumption that the availability of generic substitutes is consistent across all conditions, or at least across large population groups. Otherwise, casemix adjustment would be needed or generic prescribing rates would need to be measured by condition.
We added this observation.
Chapt. 2 - Methods Page 20 Table 4: The title includes the word “effectiveness” but from the context it seems like the term “efficiency” is what was intended.
This was a typo. We changed it to efficiency.
Chapt. 2 - Methods p 20. Table 4 The measures excluded from the typology solidify my concern over the limited scope of this purely economic approach to classification. Exclusion of more system-level types of efficiency measures such as readmission rates (or hospital admissions for ambulatory sensitive conditions) says to me we are missing some important opportunities to improve quality of care while minimizing costs. What about measures of waste such as duplicate medical tests or overuse such as imaging for acute low back pain? Or not having access to good primary care and so using the emergency room for what could have been routine lower cost care?
We note that there are many ways to improve the functioning of the health care system other than the development and implementation of efficiency measures. We are not saying these measures have no uses, rather that they do not meet our criteria for an efficiency measure.
E-17
Section Comments Response Chapt. 2 - Methods Page 21, under cost-effectiveness: The first thing that occurred to me in terms of cost-
effectiveness measures was comparative cost of QALY, as in the cost per QALY saved is higher for screening mammography in women between 40 and 50 than in women over 50, so it is less cost-effective. But doesn’t that also qualify as a measure of efficiency? In other words, there is an output (the QALY) at a given level of input (cost).
We have revised our explanation of why we excluded cost-effectiveness measures from this report.
Chapt. 2 - Methods P21, paragraph 4 - Not sure I agree that the delivery of additional services at a price above input costs and below current charges is always a win-win. I think those additional services need to be necessary and appropriate, or at least add value. If those services could possibly have negative health and/or cost consequences down the road (e.g. an injection that has an Iatrogenic effect), that would not be a win-win.
We modified this sentence.
Chapt. 2 - Methods Page 22, second paragraph: This sounds like the “moral hazard” argument. Are you thinking that society needs to prioritize the outputs? E.g. society spends $2000 on LASIK but gets a very low ROI compared with spending $2000 on pre-natal care.
This isn’t exactly moral hazard.
Chapt. 2 - Methods Page 22: I like your comment on “more plans than is good for society as a whole.” We are very lucky in Rochester only to have a handful of major plans. Could you be more explicit that having a higher number of plans raises administrative costs, thereby decreasing a system’s efficiency? Carried to its logical conclusion this becomes the argument for a national health care system, of course.
We are not taking this argument to its “rational” conclusion.
Chapt. 2 - Methods Page 22, second to last paragraph: which is “this setting?” Chapt. 2 - Methods P22, paragraph 5 - In the last sentence, the word “setting” is unclear. Did the author’s
mean “perspective”?
Changes have been made to the text.
Chapt. 2 - Methods P24, figure 1 - Either remove the text box outline around “Inputs” or outline the text box around “Outputs” to be consistent.
We added the text box to the Inputs category.
E-18
Section Comments Response Typology RAND has constructed a basic typology to categorize efficiency measures along three
dimensions: perspective, outputs, and inputs. One suggestion is to consider the relevance of time horizon as a fourth dimension. Measures of short-run efficiency may focus on the relationship between inputs and outputs from a given perspective over a short period of time. A short-run perspective does not question a producer's choice of outputs to produce, nor does it question the efficiency of the technology investments that are made by a producer. However, a long-run perspective may be useful if one believes there may be more or less efficient choices of outputs to include in a product line (i.e. the choice to specialize, the scope of conditions a given producer chooses to treat), and/or if one believes that there may be more or less efficient choices of technologies with which to produce a given output, whether a service or a health outcome. The issue of time horizon may have differential importance depending on the perspective of measurement. Consumers may care more about short-run measures of efficiency (i.e. measures in which there exist "fixed costs"). Healthcare providers at the point of care (nurses, doctors) may also care more about short-run measures. Healthcare administrators may care about short-run measures, but also long-run measures in which all costs are variable. Intermediaries (health plans, purchasers), may care about long run and short-run measures, and Society may likewise care about long-run measures more in terms of societal public health planning (this is not to say, however, that short-run measures would not be important to Society). Another reason why time horizon might be a useful dimension to distinguish between efficiency measures, is that it imposes additional structure on the consideration of costs. What counts as a relevant cost in a long-run analysis of efficiency may not enter into an analysis of short-run efficiency.
We thank the reviewer for this suggestion of an additional dimension to the typology. We are not in a position at this point to make this revision but would be open to this suggestion and others that may arise from a broader audience who will read this after dissemination of the final report.
Typology Also, the typology didn’t include mention of the use of re-admissions as a modifier or adjuster of LOS or other measures of use. Note that The Leapfrog Group model uses re-admissions as an adjuster to assure that hospitals with shorter lengths of stay but with high rates of readmissions are not considered efficient. The Leapfrog solicited comments from providers and received extensive feedback from the provider community about which measures to use, and the providers supported the use of LOS adjusted for severity and re-admissions.
No response necessary.
Typology I thought that the proposed typology was quite helpful in terms of providing a definition of efficiency and a “big picture” understanding of efficiency in a far more systematic and thoughtful manner than I had come up with independently. The typology does cover our interests in a very general way. The document somewhat meets the purpose outlined in the title: a thorough list of healthcare efficiency measures is identified and categorized. However, the document seems less successful at evaluating the measures.
No response necessary.
E-19
Section Comments Response Typology I like it. I think it's clear and makes good distinctions between the different levels at which
efficiency should be viewed/measured. No response necessary.
Typology I found the revised typology somewhat "frustrating" rather than helpful. While I found the draft report well-researched and written, the emphasis that I read was on "absolute efficiency" measures, rather than the more practical "relative efficiency" measures that are already in use. Taking the typology dimensions one at a time: ~Perspective: isn't there really just a single perspective of making the system less costly? Why do we care how many units of physician time, nursing time, etc. are used, as long as the dollar-denominated results are at an average level or better? ~Outputs -- what type of product is being evaluated? Again, the main output needs to be dollar costs, with quality measures used where available. One note -- mention is made that quality measures are "further advanced" than efficiency measures. While there may be more research completed, I have personally found that there is a lack of consensus on quality measures, which means that nothing much gets measured or agreed to. I would state that efficiency measures are further along -- solid software by private vendors that is being used on an everyday basis. ~Inputs -- what Inputs are used to produce the output? I found this to be a less than productive discussion. Again, why do we care what the Inputs are, as long as the quality and dollar-efficiency output is better?
We have tried to provide a better balance in the review between what one might learn from the peer reviewed literature versus the applications that are being used in practice.
Typology I am concerned that the current typology focuses mainly on costs. Although it is mentioned in the report about incorporating quality metrics into efficiency assessments the general conclusion is that this is too challenging and is part of a future research agenda. As such, I don’t believe this current typology will move us forward towards evaluating the “value” of care delivered across the continuum and doesn’t target high leverage crosscutting areas such as longitudinal efficiency and outcomes, care coordination, care transitions, patient engagement, and end of life care. This report is a good overview of where we are now with existing “efficiency” measures and proprietary grouper methodologies, and how these can be classified.
You are correct that the main focus is on costs. There are many other domains of performance in the health care system that require different types of measures. As IOM has reminded us, we need to look at all of these domains.
E-20
Section Comments Response Typology I found it easy to understand and it provided a useful framework for considering not only
the existing measures, but also measures that are in development (e.g. by NCQA) or measures that could be developed in the future. The typology has face validity and any efficiency measures that I’m aware of could easily fit into this typology. There were, however, a couple of definitional concepts that seemed a bit inconsistent with my understanding of how efficiency measures are currently constructed by health plans. For example, on page 3 in paragraph 5, the authors state, “The main difference between the various measurement approaches is that ratio-based measures can include only single inputs and outputs…” Perhaps what the authors meant is single units, metrics or types of inputs and outputs. When financial inputs are used to create efficiency ratios, they encompass multiple types of inputs (visits, procedures, hospital days, prescriptions, etc) expressed in terms of a single unit of measure or metric--their dollar expense. What seems to distinguish between ratios and the other measurement approaches to me is that when we convert all of these different units of inputs to a common metric—dollars, in my example—we lose the ability to define the optimal mix of different types of inputs to produce a given output. That makes ratios less useful for improvement purposes.
The text now acknowledges that inputs or outputs may be aggregated into a single input or output, with a ratio then applied.
Typology RAND/AHRQ’s attempts to define and develop a typology of efficiency measures are commendable. However, the proposed typology continues the current measurement of efficiency measures in terms of resource consumption and associated costs without accounting for quality. The proposed typology fosters a provider/payer perspective rather than a broader provider/payer/patient perspective of care and is disconnected with the principle of quality improvement and value based purchasing of care. Quality and efficiency should not be discussed separately. A good example is avoidable readmission since it is a fact that reducing complications and readmissions will result in greater economic returns. As discussed in the report, the Medicare program has been using readmission rates as measure of efficiency. However, defining efficiency solely in terms of the relationship between inputs and outputs excludes avoidable readmissions from being classified as an efficiency measure under the proposed typology.
We have tried to make clearer the role of measures of effectiveness in combination with measures of efficiency and the potential to see these on a continuum based on the choice of output measure.
Typology Reaction to revised typology: I found the revised typology much more useful. The addition of perspective is a key improvement. One entity’s efficiency is often another entity’s decreased income.
No response necessary.
Typology The proposed typology makes sense and does provide a way in which to classify efficiency measures: perspective, inputs, and outputs. However, when actually implementing measures, it would be challenging to use this typology to classify the IHA measures in terms of inputs, outputs etc. The way in which we have gone about doing this is illustrated in the table below. I only included some examples. (Listed as Table B in the end of reviewers comments)
No response necessary.
Chapt. 2 - Methods P25, paragraph 1 - In third setence from the end, "publication" should be plural. This change was made. Chapt. 2 - Methods Page 25: What is a “purposive reputational sample approach?” A sample we chose
based on reputation.
E-21
Section Comments Response Chapt. 2 - Methods P26, paragraph 2 - 1st bullet should read "…treatment or product" This change was made Chapt. 2 - Methods P27, paragraph 2 - Refers to a list of 12 potential stakeholders who would be interested in
using efficiency members. I assume this will be Table 1B in Appendix D. It was missing from my copy.
This is included in the final report.
Chapt. 3 - Results P29, paragraph 3 - Next to last sentence—either delete the word “from” in “…using from data USA data sources” or reword as “using data from USA sources
We deleted the word “from”.
Chapt. 3 - Results P30, figure 2 - Is the asterisked footnote “*submitted after review of draft report” an orphan? I couldn’t find the asterisk it relates to in the flowchart.
This change was made.
Chapt. 3 - Results P31, paragraph 2 - Reads “..our definition presented above…” I believe the definition was presented 19 pages earlier (i.e. on page 12) so this was confusing. It could be changed to “…our definition presented earlier…”:
This change was made.
Chapt. 3 - Results Page 31: In the last sentence of the second paragraph, “article” should be “articles.” This change was made. Chapt. 3 - Results P32, paragraph 1 - Move this paragraph after Box 1. This change was made. Chapt. 3 - Results Page 32, Box, third paragraph, last sentence: the lack of direct information about why the
providers are different is exactly the main problem with efficiency indexes, we believe. Another problem is that the ratio removes the size of the problem. Two practitioners may both have an efficiency of 1.20. All other things being equal, if one practitioner has 100 patients in their panel and the other has 1000, it is much more important to work with the latter. If a practitioner has 10, I would ignore the EI of 1.20 completely as it is unlikely to be accurate, stable, actionable, or worth pursuing by itself.
We added a comment about ratios masking differences in order of magnitude.
Chapt. 3 - Results Page 33, first paragraph: at the top, another reason for many studies of hospitals might be that they are relatively closed systems where one can measure all the inputs, outputs, and outcomes (in theory). At the bottom of the paragraph, one couldn’t count all the physicians, but one could count the visits. Similarly, a general problem we’ve had in managing our network is understanding how many physicians are full time and how many part time (and how part time they are).
This change was made.
Chapt. 3 - Results P33, table 5 - In the inputs column of this table, is Financial equated to Productive Efficiency and Physical equated to Technical Efficiency? If so, does Both mean that both technical and productive efficiency were addressed in the article?
Financial and physical are similar to productive and technical efficiency and “Both” does refer to an article addressing financial and physical efficiency.
Chapt. 3 - Results P36, table 6 - Add "at the Hospital Level" to the title of table 6. This table was retitled. Chapt. 3 - Results Page 36, table 6: I believe you mean to label this “20 Most Frequent Inputs and Outputs for
Hospital Efficiency Measures.” This table was retitled.
Chapt. 3 - Results Page 36, end of first paragraph: Another difficulty in measuring physician efficiency is that pharmacy use is such a key element and may not readily available (as in Medicare before Part D).
Added this point.
E-22
Section Comments Response Chapt. 3 - Results Page 37, middle paragraph: again, in practice efficiency indexes would be very wide
spread and this discussion does not bring that out. We did not make the change because we were not certain how to interpret the comment.
Chapt. 3 - Results Page 37, towards bottom: again, would be helpful to have simple examples of SFA, DEA, and EI for physician oriented measures.
DEA example given on p. 37.
Chapt. 3 - Results Page 39: On the first line, “measures” should be “measure.” This change was made Chapt. 3 - Results Page 42, end of first paragraph: Pilot is in the eye of the beholder, of course, but I expect
some readers would consider PFP activities to be beyond the pilot level. Deleted “pilot.”
Chapt. 3 - Results The discussion of episode-based measures vs. population-based measures is a very important one (p. 42). Have you considered that some measures (e.g., treatment of diabetes or acute MIs) might be better assessed using episodes and others (e.g., flu vaccination and flu treatment/prevention) would be better through population measures? Very few conditions/treatments can be evaluated on the basis of population measurements -- too many people needed for many of the low incidence diseases/treatments.
Added at the end of the vendor measures.
Chapt. 3 - Results Page 42, 3rd paragraph. The category you call “population-based” is more properly called “person-level risk adjusters.” In the 3rd line of the paragraph, you need to fix the episode definition so that either you’re defining a single episode, or so that your definition describes episodes (plural).
We continue to use population-based.
Chapt. 3 - Results P42, paragraph 3 - I would insert the paragraph describing ETGs and the MEGs from page 4 of the Executive Summary after paragraph 3.
This change was made.
Chapt. 3 - Results P42, paragraph 4 - I would insert the paragraph describing ACGs and CRGs (and potentially DxCGs) from page 5 of the Executive Summary after paragraph 4.
This change was made.
Chapt. 3 - Results Page 42, last paragraph. You should change “The outputs, either episodes or risk-adjusted populations,….” to “The outputs, either episodes or person years of care,…”
This change was made.
Chapt. 3 - Results P43, paragraph 2 - The acronyms for ACGs and CRGs have not yet been defined in the body of the report—only in the Executive Summary. If you take my suggestion above, this is moot.
Took suggestion above so moot.
Chapt. 3 - Results Page 43, last paragraph. Line 4: should be “networks” (plural). This change was made.
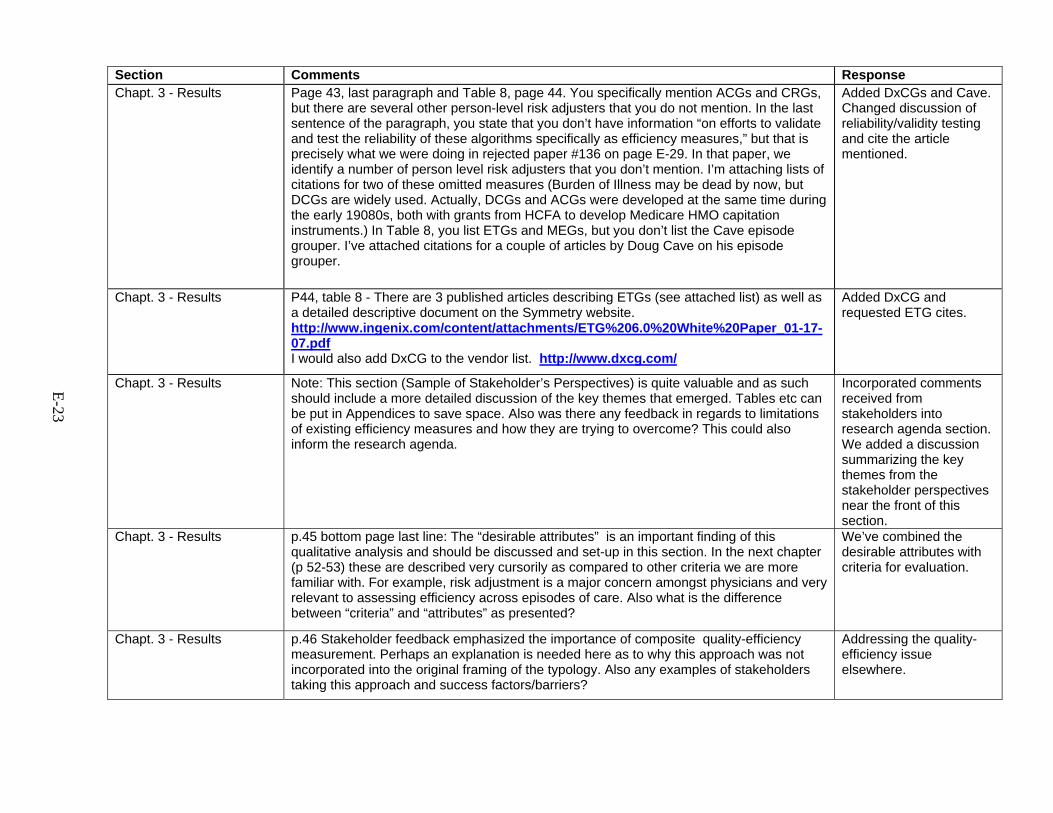
E-23
Section Comments Response Chapt. 3 - Results Page 43, last paragraph and Table 8, page 44. You specifically mention ACGs and CRGs,
but there are several other person-level risk adjusters that you do not mention. In the last sentence of the paragraph, you state that you don’t have information “on efforts to validate and test the reliability of these algorithms specifically as efficiency measures,” but that is precisely what we were doing in rejected paper #136 on page E-29. In that paper, we identify a number of person level risk adjusters that you don’t mention. I’m attaching lists of citations for two of these omitted measures (Burden of Illness may be dead by now, but DCGs are widely used. Actually, DCGs and ACGs were developed at the same time during the early 19080s, both with grants from HCFA to develop Medicare HMO capitation instruments.) In Table 8, you list ETGs and MEGs, but you don’t list the Cave episode grouper. I’ve attached citations for a couple of articles by Doug Cave on his episode grouper.
Added DxCGs and Cave. Changed discussion of reliability/validity testing and cite the article mentioned.
Chapt. 3 - Results P44, table 8 - There are 3 published articles describing ETGs (see attached list) as well as a detailed descriptive document on the Symmetry website. http://www.ingenix.com/content/attachments/ETG%206.0%20White%20Paper_01-17-07.pdf I would also add DxCG to the vendor list. http://www.dxcg.com/
Added DxCG and requested ETG cites.
Chapt. 3 - Results Note: This section (Sample of Stakeholder’s Perspectives) is quite valuable and as such should include a more detailed discussion of the key themes that emerged. Tables etc can be put in Appendices to save space. Also was there any feedback in regards to limitations of existing efficiency measures and how they are trying to overcome? This could also inform the research agenda.
Incorporated comments received from stakeholders into research agenda section. We added a discussion summarizing the key themes from the stakeholder perspectives near the front of this section.
Chapt. 3 - Results p.45 bottom page last line: The “desirable attributes” is an important finding of this qualitative analysis and should be discussed and set-up in this section. In the next chapter (p 52-53) these are described very cursorily as compared to other criteria we are more familiar with. For example, risk adjustment is a major concern amongst physicians and very relevant to assessing efficiency across episodes of care. Also what is the difference between “criteria” and “attributes” as presented?
We’ve combined the desirable attributes with criteria for evaluation.
Chapt. 3 - Results p.46 Stakeholder feedback emphasized the importance of composite quality-efficiency measurement. Perhaps an explanation is needed here as to why this approach was not incorporated into the original framing of the typology. Also any examples of stakeholders taking this approach and success factors/barriers?
Addressing the quality-efficiency issue elsewhere.
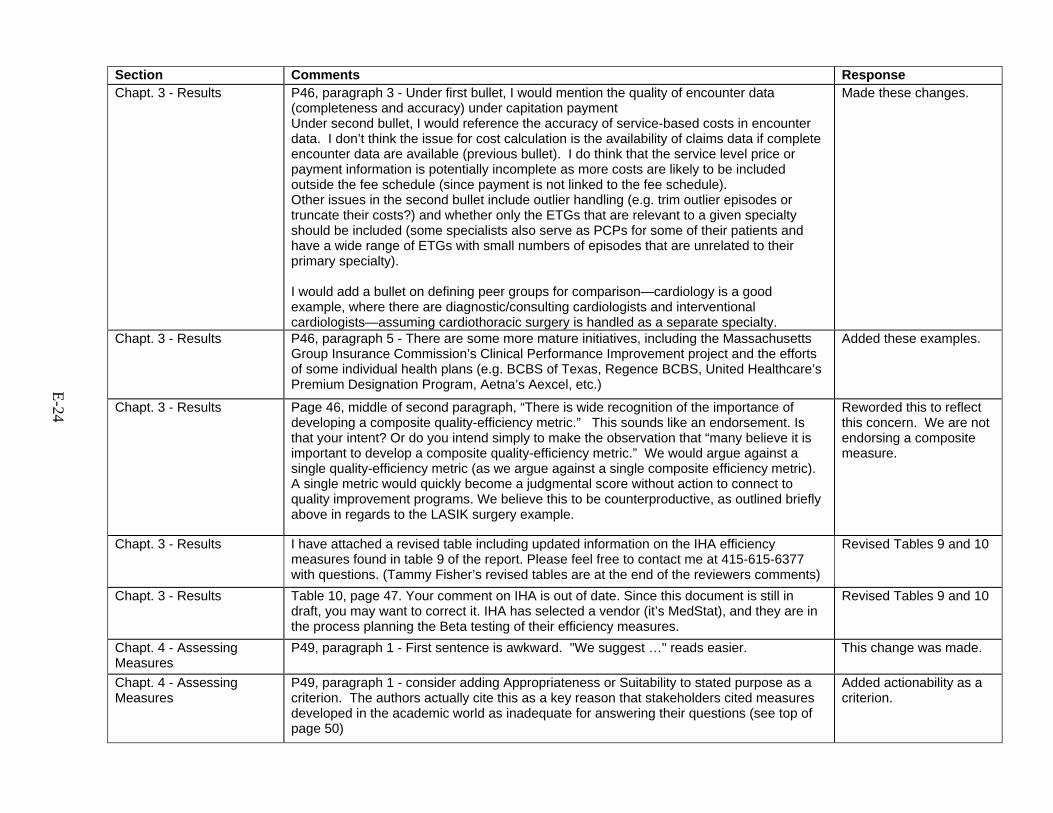
E-24
Section Comments Response Chapt. 3 - Results P46, paragraph 3 - Under first bullet, I would mention the quality of encounter data
(completeness and accuracy) under capitation payment Under second bullet, I would reference the accuracy of service-based costs in encounter data. I don’t think the issue for cost calculation is the availability of claims data if complete encounter data are available (previous bullet). I do think that the service level price or payment information is potentially incomplete as more costs are likely to be included outside the fee schedule (since payment is not linked to the fee schedule). Other issues in the second bullet include outlier handling (e.g. trim outlier episodes or truncate their costs?) and whether only the ETGs that are relevant to a given specialty should be included (some specialists also serve as PCPs for some of their patients and have a wide range of ETGs with small numbers of episodes that are unrelated to their primary specialty). I would add a bullet on defining peer groups for comparison—cardiology is a good example, where there are diagnostic/consulting cardiologists and interventional cardiologists—assuming cardiothoracic surgery is handled as a separate specialty.
Made these changes.
Chapt. 3 - Results P46, paragraph 5 - There are some more mature initiatives, including the Massachusetts Group Insurance Commission’s Clinical Performance Improvement project and the efforts of some individual health plans (e.g. BCBS of Texas, Regence BCBS, United Healthcare’s Premium Designation Program, Aetna’s Aexcel, etc.)
Added these examples.
Chapt. 3 - Results Page 46, middle of second paragraph, “There is wide recognition of the importance of developing a composite quality-efficiency metric.” This sounds like an endorsement. Is that your intent? Or do you intend simply to make the observation that “many believe it is important to develop a composite quality-efficiency metric.” We would argue against a single quality-efficiency metric (as we argue against a single composite efficiency metric). A single metric would quickly become a judgmental score without action to connect to quality improvement programs. We believe this to be counterproductive, as outlined briefly above in regards to the LASIK surgery example.
Reworded this to reflect this concern. We are not endorsing a composite measure.
Chapt. 3 - Results I have attached a revised table including updated information on the IHA efficiency measures found in table 9 of the report. Please feel free to contact me at 415-615-6377 with questions. (Tammy Fisher’s revised tables are at the end of the reviewers comments)
Revised Tables 9 and 10
Chapt. 3 - Results Table 10, page 47. Your comment on IHA is out of date. Since this document is still in draft, you may want to correct it. IHA has selected a vendor (it’s MedStat), and they are in the process planning the Beta testing of their efficiency measures.
Revised Tables 9 and 10
Chapt. 4 - Assessing Measures
P49, paragraph 1 - First sentence is awkward. "We suggest …" reads easier. This change was made.
Chapt. 4 - Assessing Measures
P49, paragraph 1 - consider adding Appropriateness or Suitability to stated purpose as a criterion. The authors actually cite this as a key reason that stakeholders cited measures developed in the academic world as inadequate for answering their questions (see top of page 50)
Added actionability as a criterion.
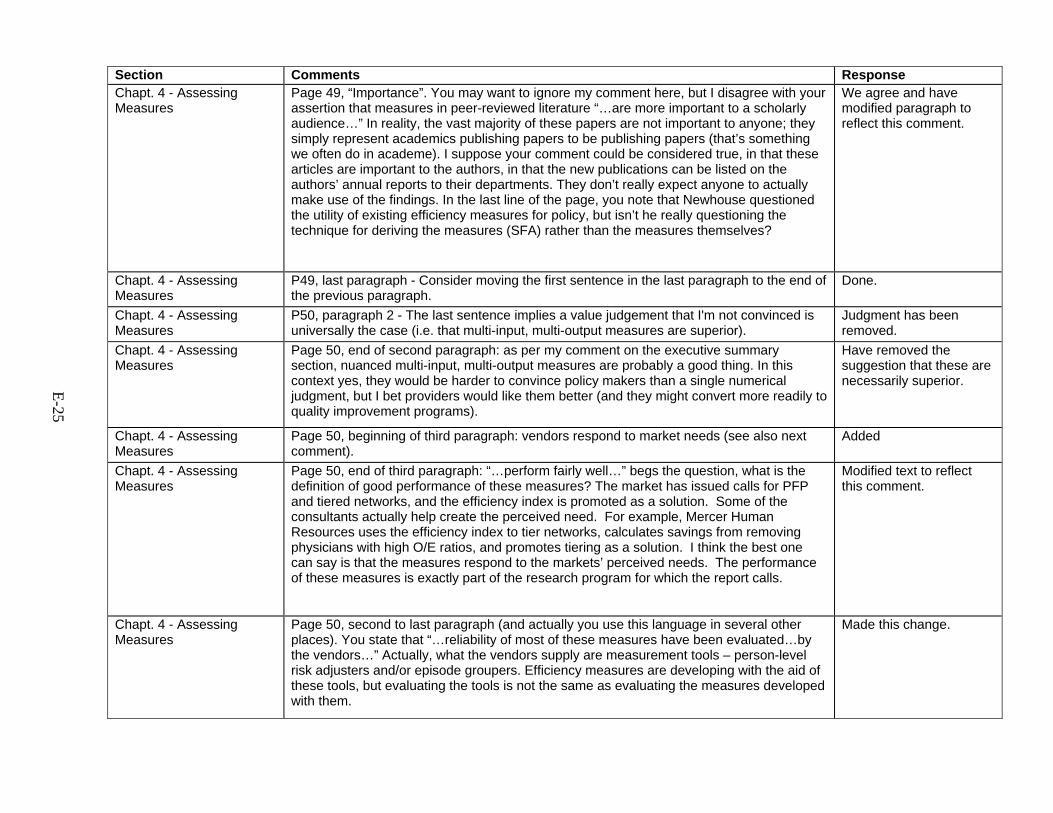
E-25
Section Comments Response Chapt. 4 - Assessing Measures
Page 49, “Importance”. You may want to ignore my comment here, but I disagree with your assertion that measures in peer-reviewed literature “…are more important to a scholarly audience…” In reality, the vast majority of these papers are not important to anyone; they simply represent academics publishing papers to be publishing papers (that’s something we often do in academe). I suppose your comment could be considered true, in that these articles are important to the authors, in that the new publications can be listed on the authors’ annual reports to their departments. They don’t really expect anyone to actually make use of the findings. In the last line of the page, you note that Newhouse questioned the utility of existing efficiency measures for policy, but isn’t he really questioning the technique for deriving the measures (SFA) rather than the measures themselves?
We agree and have modified paragraph to reflect this comment.
Chapt. 4 - Assessing Measures
P49, last paragraph - Consider moving the first sentence in the last paragraph to the end of the previous paragraph.
Done.
Chapt. 4 - Assessing Measures
P50, paragraph 2 - The last sentence implies a value judgement that I'm not convinced is universally the case (i.e. that multi-input, multi-output measures are superior).
Judgment has been removed.
Chapt. 4 - Assessing Measures
Page 50, end of second paragraph: as per my comment on the executive summary section, nuanced multi-input, multi-output measures are probably a good thing. In this context yes, they would be harder to convince policy makers than a single numerical judgment, but I bet providers would like them better (and they might convert more readily to quality improvement programs).
Have removed the suggestion that these are necessarily superior.
Chapt. 4 - Assessing Measures
Page 50, beginning of third paragraph: vendors respond to market needs (see also next comment).
Added
Chapt. 4 - Assessing Measures
Page 50, end of third paragraph: “…perform fairly well…” begs the question, what is the definition of good performance of these measures? The market has issued calls for PFP and tiered networks, and the efficiency index is promoted as a solution. Some of the consultants actually help create the perceived need. For example, Mercer Human Resources uses the efficiency index to tier networks, calculates savings from removing physicians with high O/E ratios, and promotes tiering as a solution. I think the best one can say is that the measures respond to the markets’ perceived needs. The performance of these measures is exactly part of the research program for which the report calls.
Modified text to reflect this comment.
Chapt. 4 - Assessing Measures
Page 50, second to last paragraph (and actually you use this language in several other places). You state that “…reliability of most of these measures have been evaluated…by the vendors…” Actually, what the vendors supply are measurement tools – person-level risk adjusters and/or episode groupers. Efficiency measures are developing with the aid of these tools, but evaluating the tools is not the same as evaluating the measures developed with them.
Made this change.
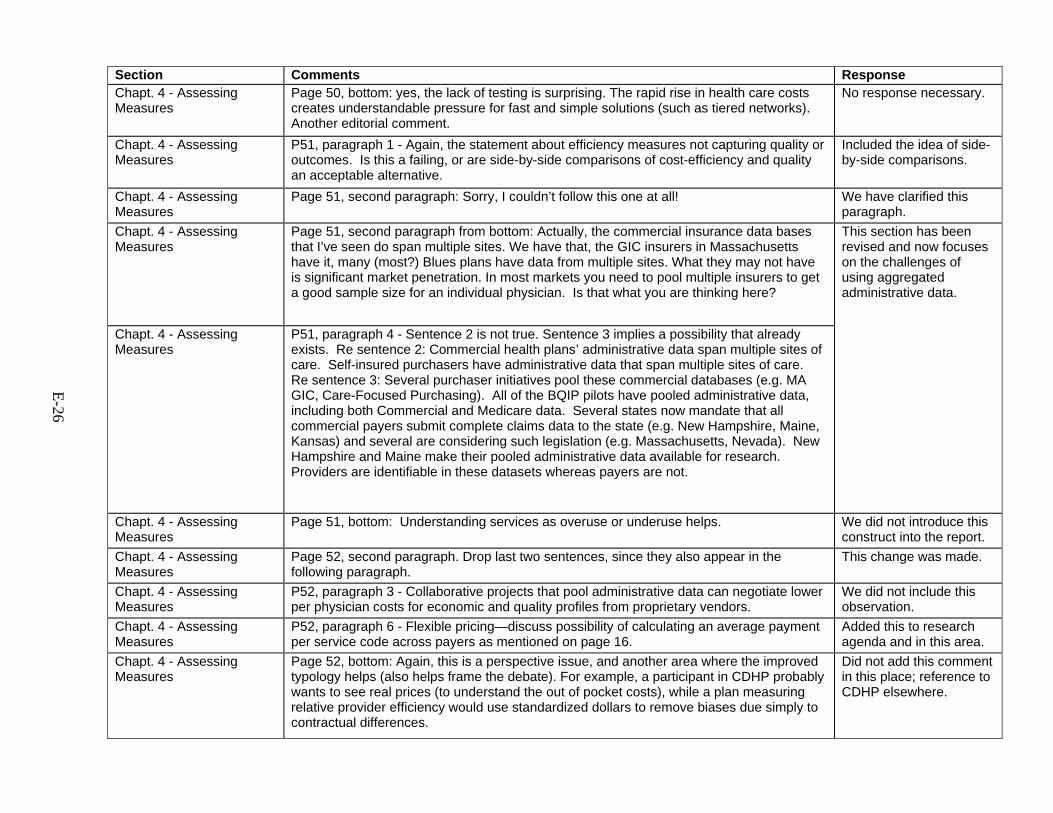
E-26
Section Comments Response Chapt. 4 - Assessing Measures
Page 50, bottom: yes, the lack of testing is surprising. The rapid rise in health care costs creates understandable pressure for fast and simple solutions (such as tiered networks). Another editorial comment.
No response necessary.
Chapt. 4 - Assessing Measures
P51, paragraph 1 - Again, the statement about efficiency measures not capturing quality or outcomes. Is this a failing, or are side-by-side comparisons of cost-efficiency and quality an acceptable alternative.
Included the idea of side-by-side comparisons.
Chapt. 4 - Assessing Measures
Page 51, second paragraph: Sorry, I couldn’t follow this one at all! We have clarified this paragraph.
Chapt. 4 - Assessing Measures
Page 51, second paragraph from bottom: Actually, the commercial insurance data bases that I’ve seen do span multiple sites. We have that, the GIC insurers in Massachusetts have it, many (most?) Blues plans have data from multiple sites. What they may not have is significant market penetration. In most markets you need to pool multiple insurers to get a good sample size for an individual physician. Is that what you are thinking here?
Chapt. 4 - Assessing Measures
P51, paragraph 4 - Sentence 2 is not true. Sentence 3 implies a possibility that already exists. Re sentence 2: Commercial health plans’ administrative data span multiple sites of care. Self-insured purchasers have administrative data that span multiple sites of care. Re sentence 3: Several purchaser initiatives pool these commercial databases (e.g. MA GIC, Care-Focused Purchasing). All of the BQIP pilots have pooled administrative data, including both Commercial and Medicare data. Several states now mandate that all commercial payers submit complete claims data to the state (e.g. New Hampshire, Maine, Kansas) and several are considering such legislation (e.g. Massachusetts, Nevada). New Hampshire and Maine make their pooled administrative data available for research. Providers are identifiable in these datasets whereas payers are not.
This section has been revised and now focuses on the challenges of using aggregated administrative data.
Chapt. 4 - Assessing Measures
Page 51, bottom: Understanding services as overuse or underuse helps. We did not introduce this construct into the report.
Chapt. 4 - Assessing Measures
Page 52, second paragraph. Drop last two sentences, since they also appear in the following paragraph.
This change was made.
Chapt. 4 - Assessing Measures
P52, paragraph 3 - Collaborative projects that pool administrative data can negotiate lower per physician costs for economic and quality profiles from proprietary vendors.
We did not include this observation.
Chapt. 4 - Assessing Measures
P52, paragraph 6 - Flexible pricing—discuss possibility of calculating an average payment per service code across payers as mentioned on page 16.
Added this to research agenda and in this area.
Chapt. 4 - Assessing Measures
Page 52, bottom: Again, this is a perspective issue, and another area where the improved typology helps (also helps frame the debate). For example, a participant in CDHP probably wants to see real prices (to understand the out of pocket costs), while a plan measuring relative provider efficiency would use standardized dollars to remove biases due simply to contractual differences.
Did not add this comment in this place; reference to CDHP elsewhere.

E-27
Section Comments Response Chapt. 4 - Assessing Measures
p.53, last paragraph This paragraph as worded is confusing. I think you are saying that as you move down the variables on the Y axis (various applications for efficiency measurement) they should meet more rigorous criteria on the x axis. Some might argue w/ this premise but should be clearer regardless. (Perhaps some shading on the chart) Also the applications need a brief description for the reader who may not intuitively understand how efficiency measurement would be relevant in this case.
We reworded this paragraph to make this more transparent.
Chapt. 4 - Assessing Measures
p.54 Table 11 Should the other attributes derived from stakeholder groups be included in the table on the x axis?
We added the attribute “actionable”
Chapt. 4 - Assessing Measures
Page 54, Table: It seems to me that the question in ranking the uses is, how much harm would occur if a mistake were made? Or more specifically, how much harm would occur to patients and secondarily to physicians if a mistake were made? In terms of increasing consequences of making a mistake, we would order the uses as internal review, quality improvement, PFP, public reporting, tiered copayment, and network selection. Not sure where research fits, probably around the quality improvement level. Also not sure where health plan selection by purchasers fits, probably around the public reporting level. Public reporting is the line where reputations get damaged. If you mistakenly hurt my reputation, you probably meet my lawyer. Network selection is the highest stakes because it disrupts doctor-patient relationships, potentially harming patients by forcing them to switch physicians. And from the physician and plan point of view, if you take away my livelihood in error, you definitely get to meet my lawyer! At least in PFP we could always give the money back (in fact I was in charge of adjusting the RIPA PFP payments in response to errors uncovered).
We have reordered the rows in this way.
Chapt. 5 - Discussion Page 55, last bullet on page. The statement is not true because you omit, among others, DCGs.
DxCGs are now included.
Chapt. 5 - Discussion p.55 I would recommend grouping the “conclusion” bullets by content area or under some type of heading. At the moment they are a bit scattered. Many need some additional detail, particularly stating potential policy implications (if w/i the scope of this paper not sure). It would seem that the research agenda could then map back to the findings by identifying gaps.
Conclusion has been written in prose rather than bullet form.
Chapt. 5 - Discussion p.56 Ditto for grouping under research agenda and perhaps some prioritization. This is a long list.
Research agenda has been grouped but not prioritized.
Chapt. 5 - Discussion P56, Future Research - See suggestions for additional research areas above under page 8 of Executive Summary. ~Methodologies for establishing peer groupings of providers ~Attribution methodologies for physician efficiency measurement ~Which inputs should be included for which providers (e.g. who controls what?) and how should those inputs be priced? For example when using actual costs for measuring physician efficiency, should neutral pricing be applied to hospital room and board expenses?
These additions were made
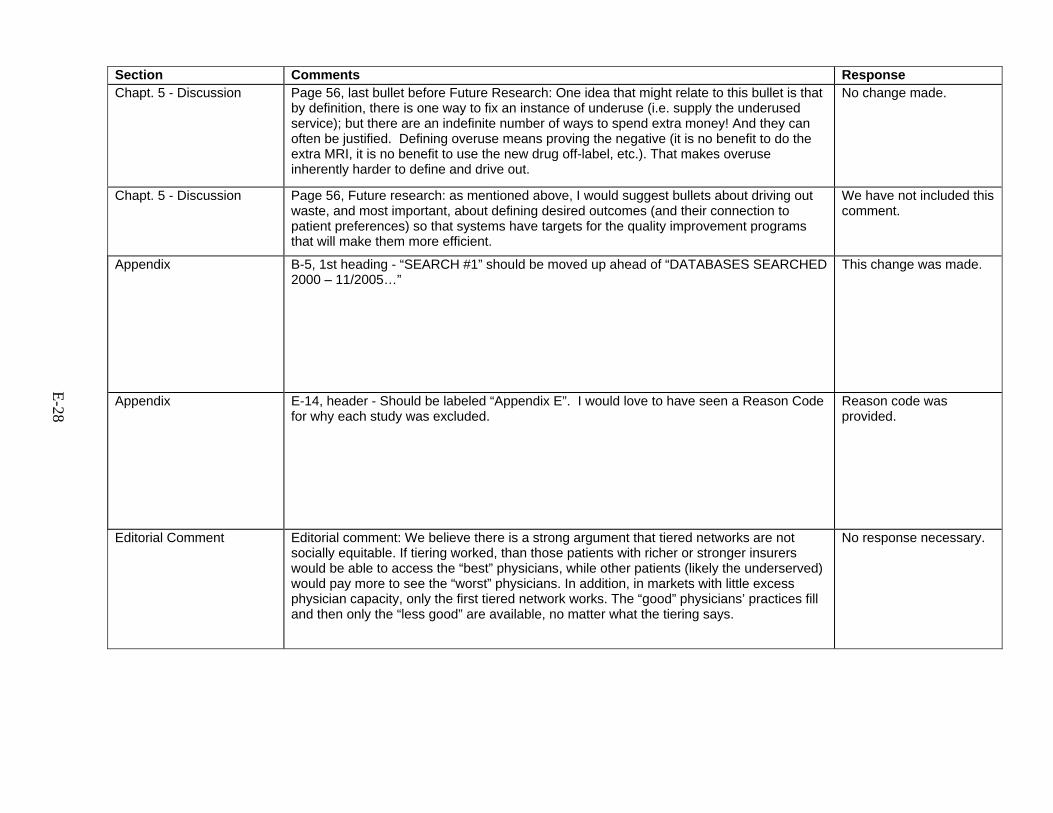
E-28
Section Comments Response Chapt. 5 - Discussion Page 56, last bullet before Future Research: One idea that might relate to this bullet is that
by definition, there is one way to fix an instance of underuse (i.e. supply the underused service); but there are an indefinite number of ways to spend extra money! And they can often be justified. Defining overuse means proving the negative (it is no benefit to do the extra MRI, it is no benefit to use the new drug off-label, etc.). That makes overuse inherently harder to define and drive out.
No change made.
Chapt. 5 - Discussion Page 56, Future research: as mentioned above, I would suggest bullets about driving out waste, and most important, about defining desired outcomes (and their connection to patient preferences) so that systems have targets for the quality improvement programs that will make them more efficient.
We have not included this comment.
Appendix B-5, 1st heading - “SEARCH #1” should be moved up ahead of “DATABASES SEARCHED 2000 – 11/2005…”
This change was made.
Appendix E-14, header - Should be labeled “Appendix E”. I would love to have seen a Reason Code for why each study was excluded.
Reason code was provided.
Editorial Comment Editorial comment: We believe there is a strong argument that tiered networks are not socially equitable. If tiering worked, than those patients with richer or stronger insurers would be able to access the “best” physicians, while other patients (likely the underserved) would pay more to see the “worst” physicians. In addition, in markets with little excess physician capacity, only the first tiered network works. The “good” physicians’ practices fill and then only the “less good” are available, no matter what the tiering says.
No response necessary.

E-29
Section Comments Response Which measures are ready for use?
None of the peer-reviewed input/output measures seem to be very useful. However, the relative efficiency measures currently used by payors are very useful and begin to provide sustainable cost reduction possibilities by (1) improving provider selection -- more on total efficiency and less on unit price; (2) beginning to be used with tiered co-payments; and (3) health plan selection -- which health plans provide the best total value. It is likely that these relative performance measures, with enough data (a key component), should be practical for internal review and improvement of physician and physician-hospital systems, but I would expect a large degree of resistance to use of these. "Report cards" on individual practice are likely to be very controversial, as has been the case with morbidity reporting in several Eastern states. Pay for Performance (P4P) may well be linked at some future date to the some combination of quality and efficiency reporting.
No response necessary.
Which measures are ready for use?
All of them are ready for internal review and improvement -- they all start to give a view of efficiency that is important, but they all need a fair amount of refinement before being used for other uses. I think that pmpm is certainly an easy metric of efficiency that is currently used by purchasers to select health plans, however, it has to be fully severity-adjusted to be meaningful in any way when comparing premiums. (Large employers simply have plans reprice their claims to compare one plan to another and therefore do not need to have the data severity adjusted since it is their own). When it comes to public reporting, P4P, tiering, network selection, I personally believe that the efficiency measures you've identified are only suitable to identify the outliers, and then again, only if there are large enough sample sizes from which to calculate the scores. A couple of years ago, BTE and Leapfrog issued a White Paper on measuring provider efficiency. The Paper outlined some of the necessary conditions for use of some of the more common efficiency measurement products. Those conditions still hold true. And the reason for my statement is that there are very few instances currently where Payers have enough data to meet the conditions we specified.
No response necessary.
Which measures are ready for use?
Population-based measures are more developed and better suited to a capitated environment, while the episode-based measures are more widely used and better suited to a fee-for-service environment. With regard to performance improvement, population-based measures are difficult to use for improving efficiency as they’re generally too high level. Episode groupers hold more promise for improving efficiency, when drill-down reporting capabilities are made available to physicians, but physicians won’t engage with them unless there are economic incentives to do so. I don’t think either type of measure is ready to be used for pay for performance at the physician level, and maybe not even at the group level. On the other hand, tiering may provide a sufficient incentive for physicians to engage in understanding episode-based measures and working with them to effect improvements in efficiency.
No response necessary.
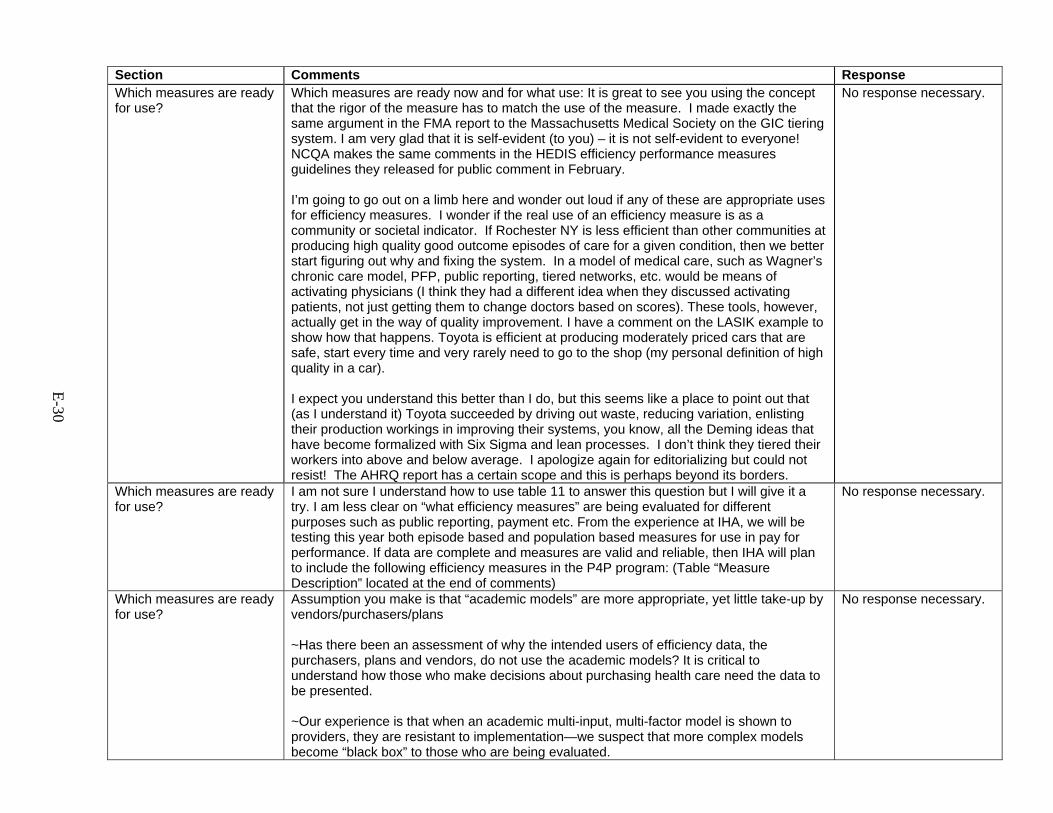
E-30
Section Comments Response Which measures are ready for use?
Which measures are ready now and for what use: It is great to see you using the concept that the rigor of the measure has to match the use of the measure. I made exactly the same argument in the FMA report to the Massachusetts Medical Society on the GIC tiering system. I am very glad that it is self-evident (to you) – it is not self-evident to everyone! NCQA makes the same comments in the HEDIS efficiency performance measures guidelines they released for public comment in February. I’m going to go out on a limb here and wonder out loud if any of these are appropriate uses for efficiency measures. I wonder if the real use of an efficiency measure is as a community or societal indicator. If Rochester NY is less efficient than other communities at producing high quality good outcome episodes of care for a given condition, then we better start figuring out why and fixing the system. In a model of medical care, such as Wagner’s chronic care model, PFP, public reporting, tiered networks, etc. would be means of activating physicians (I think they had a different idea when they discussed activating patients, not just getting them to change doctors based on scores). These tools, however, actually get in the way of quality improvement. I have a comment on the LASIK example to show how that happens. Toyota is efficient at producing moderately priced cars that are safe, start every time and very rarely need to go to the shop (my personal definition of high quality in a car). I expect you understand this better than I do, but this seems like a place to point out that (as I understand it) Toyota succeeded by driving out waste, reducing variation, enlisting their production workings in improving their systems, you know, all the Deming ideas that have become formalized with Six Sigma and lean processes. I don’t think they tiered their workers into above and below average. I apologize again for editorializing but could not resist! The AHRQ report has a certain scope and this is perhaps beyond its borders.
No response necessary.
Which measures are ready for use?
I am not sure I understand how to use table 11 to answer this question but I will give it a try. I am less clear on “what efficiency measures” are being evaluated for different purposes such as public reporting, payment etc. From the experience at IHA, we will be testing this year both episode based and population based measures for use in pay for performance. If data are complete and measures are valid and reliable, then IHA will plan to include the following efficiency measures in the P4P program: (Table “Measure Description” located at the end of comments)
No response necessary.
Which measures are ready for use?
Assumption you make is that “academic models” are more appropriate, yet little take-up by vendors/purchasers/plans ~Has there been an assessment of why the intended users of efficiency data, the purchasers, plans and vendors, do not use the academic models? It is critical to understand how those who make decisions about purchasing health care need the data to be presented. ~Our experience is that when an academic multi-input, multi-factor model is shown to providers, they are resistant to implementation—we suspect that more complex models become “black box” to those who are being evaluated.
No response necessary.
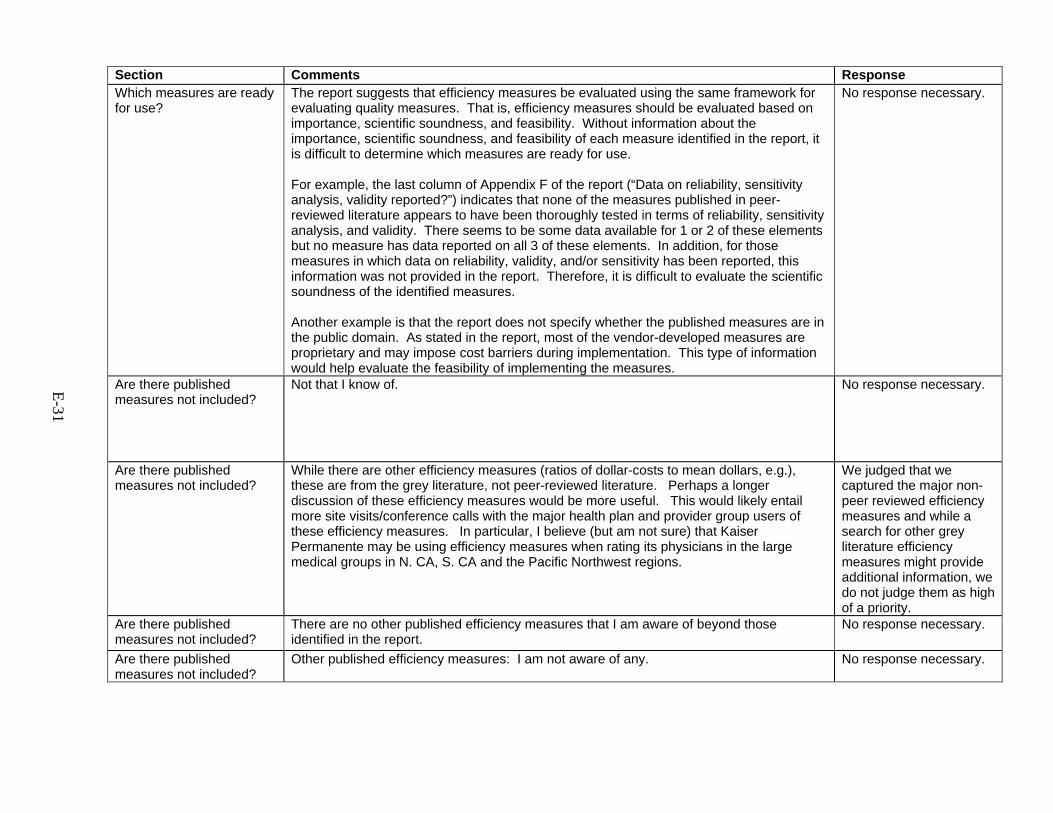
E-31
Section Comments Response Which measures are ready for use?
The report suggests that efficiency measures be evaluated using the same framework for evaluating quality measures. That is, efficiency measures should be evaluated based on importance, scientific soundness, and feasibility. Without information about the importance, scientific soundness, and feasibility of each measure identified in the report, it is difficult to determine which measures are ready for use. For example, the last column of Appendix F of the report (“Data on reliability, sensitivity analysis, validity reported?”) indicates that none of the measures published in peer-reviewed literature appears to have been thoroughly tested in terms of reliability, sensitivity analysis, and validity. There seems to be some data available for 1 or 2 of these elements but no measure has data reported on all 3 of these elements. In addition, for those measures in which data on reliability, validity, and/or sensitivity has been reported, this information was not provided in the report. Therefore, it is difficult to evaluate the scientific soundness of the identified measures. Another example is that the report does not specify whether the published measures are in the public domain. As stated in the report, most of the vendor-developed measures are proprietary and may impose cost barriers during implementation. This type of information would help evaluate the feasibility of implementing the measures.
No response necessary.
Are there published measures not included?
Not that I know of. No response necessary.
Are there published measures not included?
While there are other efficiency measures (ratios of dollar-costs to mean dollars, e.g.), these are from the grey literature, not peer-reviewed literature. Perhaps a longer discussion of these efficiency measures would be more useful. This would likely entail more site visits/conference calls with the major health plan and provider group users of these efficiency measures. In particular, I believe (but am not sure) that Kaiser Permanente may be using efficiency measures when rating its physicians in the large medical groups in N. CA, S. CA and the Pacific Northwest regions.
We judged that we captured the major non-peer reviewed efficiency measures and while a search for other grey literature efficiency measures might provide additional information, we do not judge them as high of a priority.
Are there published measures not included?
There are no other published efficiency measures that I am aware of beyond those identified in the report.
No response necessary.
Are there published measures not included?
Other published efficiency measures: I am not aware of any. No response necessary.
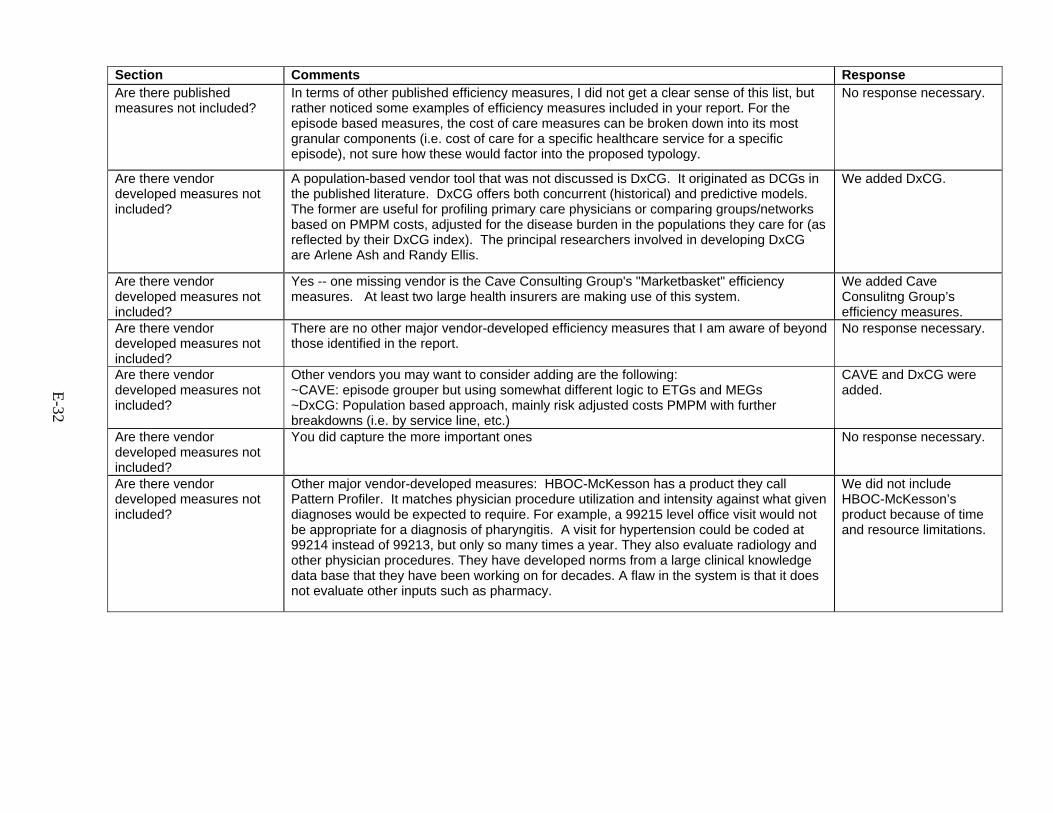
E-32
Section Comments Response Are there published measures not included?
In terms of other published efficiency measures, I did not get a clear sense of this list, but rather noticed some examples of efficiency measures included in your report. For the episode based measures, the cost of care measures can be broken down into its most granular components (i.e. cost of care for a specific healthcare service for a specific episode), not sure how these would factor into the proposed typology.
No response necessary.
Are there vendor developed measures not included?
A population-based vendor tool that was not discussed is DxCG. It originated as DCGs in the published literature. DxCG offers both concurrent (historical) and predictive models. The former are useful for profiling primary care physicians or comparing groups/networks based on PMPM costs, adjusted for the disease burden in the populations they care for (as reflected by their DxCG index). The principal researchers involved in developing DxCG are Arlene Ash and Randy Ellis.
We added DxCG.
Are there vendor developed measures not included?
Yes -- one missing vendor is the Cave Consulting Group's "Marketbasket" efficiency measures. At least two large health insurers are making use of this system.
We added Cave Consulitng Group’s efficiency measures.
Are there vendor developed measures not included?
There are no other major vendor-developed efficiency measures that I am aware of beyond those identified in the report.
No response necessary.
Are there vendor developed measures not included?
Other vendors you may want to consider adding are the following: ~CAVE: episode grouper but using somewhat different logic to ETGs and MEGs ~DxCG: Population based approach, mainly risk adjusted costs PMPM with further breakdowns (i.e. by service line, etc.)
CAVE and DxCG were added.
Are there vendor developed measures not included?
You did capture the more important ones No response necessary.
Are there vendor developed measures not included?
Other major vendor-developed measures: HBOC-McKesson has a product they call Pattern Profiler. It matches physician procedure utilization and intensity against what given diagnoses would be expected to require. For example, a 99215 level office visit would not be appropriate for a diagnosis of pharyngitis. A visit for hypertension could be coded at 99214 instead of 99213, but only so many times a year. They also evaluate radiology and other physician procedures. They have developed norms from a large clinical knowledge data base that they have been working on for decades. A flaw in the system is that it does not evaluate other inputs such as pharmacy.
We did not include HBOC-McKesson’s product because of time and resource limitations.

Appendix F List of Excluded Studies


F-1
Rejected: Abstract Level
1. HEDIS outcomes may not be the only ones you need to benchmark. Healthc Benchmarks. 1997 Jun; 4(6):81-3. Rec #: 1338
2. Provider overhauls pathway procedures to improve outcomes analysis, care efficiency. Health Care Cost Reengineering Rep. 1998 Feb; 3(2):25-9. Rec #: 1330
3. Asadi, M. J. and Baltz, W. A. Activity-based costing for clinical paths. An example to improve clinical cost & efficiency. J Soc Health Syst. 1996; 5(2):1-7. Rec #: 1356
4. Berndt, E. R. Health Care Productivity: Comment. Brookings Papers on Economic Activity. 1997; 0(0):203-15. Rec #: 1468
5. Blank, J. L. T. Public provision and performance: Contributions from efficiency and productivity measurement. With contributions from C. A. Knox Lovell et al. Amsterdam; New York and Oxford: Elsevier Science North-Holland; 2000. xvii, 412 . Rec #: 1454
6. Blank, J. L. T.; Eggink, E., and de Graaff, A. I. Een empirisch onderzock naar de productiestructuur van verpleeghuizen in Nederland . Zuinig op Zorg; 1996 Sep: 3-5. Rec #: 1620
7. Campari, M. A Competitive Strategy for the Efficient Organization of Out-Patient Services. Hermans, H. E. G. M.; Casparie, A. F., and Paelinck, J. H. P.Aldershot, U.K. and Sydney: Dartmouth; distributed in the U.S. by Ashgate Brookfield Vt.; 1992; pp. 79-85. Rec #: 1495
8. Casale, C.; Labbrozzi, D.; Nicolucci, A.; Carinci, F.; Avanzi, C.; Dell'Aquila, R.; Forcella, M.; Montemurno, C.; Procaccini, D. A.; Ruscitto, F., and et, a. l. Evaluation of the efficiency of a nephrology department by the DRGs and Barber's Nomogram. The role of comorbidity. Contrib Nephrol. 1994; 109:84-9. Rec #: 1387
9. Chatterjee, S. Consolidations, Efficiency, and Quality in Health Care Markets [Ph.D.]: University of Florida; 2003. Rec #: 1015
10. Chilingerian, J. A. Evaluating why some physicians hospital practices aremore efficient: taking DEA inside the hospital. Charnes, A.; Cooper, W.; Lewin, A., and Seiford, L. DEA Theory, Methodology and Applications. Boston: Kluwer; 1994. Rec #: 1565
11. Cohen, J. and Ubel, P. Accounting for Fairness and Efficiency in Health Economics. Davis, John B.Advances in Social Economics. London and New York: Routledge; 2001; pp. 94-109. Rec #: 1421
12. Dalkir, S. Competition and Efficiency in the U S Managed Healthcare Industry [Ph.D.]: Cornell University; 1995. Rec #: 1496
13. Dash, P. C. and Murty, K. N. Evaluation of Hospital Performance in Andhra Pradesh Using Combined Utilisation and Productivity Analysis. Margin. 2001; 33(2-3):92-119. Rec #: 1427
14. Eggink, E. and Blank, J. L. T. Efficiency of Dutch Nursing Homes: The Sensitivity of DEA-Scores to Different Sets of Resource Prices. Blank, Jos L. T.With contributions from C. A. Knox Lovell et al. Amsterdam; New York and Oxford: Elsevier Science North-Holland; 2000; pp. 147-72. Rec #: 1056
15. Fare, R. and et al. Productivity Developments in Swedish Hospitals: A Malmquist Output Index Approach. Charnes, Abraham and et al.Dordrecht; Boston and London: Kluwer Academic; 1994; pp. 253-72. Rec #: 1471
16. Fare, R.; Grosskopf, S.; Lindgren, B., and Roos, P. Productivity developments in Swedish hospitals: A Malmquist output index approach. Discussion Paper No 89-3, Illinois. Southern Illinois University; 1989. Rec #: 1626
17. Fare, R.; Grosskopf, S., and Lovell, C. A. K. The measurement of Efficiency of Production. Boston: Kluwer-Nijhoff; 1985. Rec #: 1625
18. Folland, S.; Goodman, A. C., and Stano, M. The Economics of Health and Health Care. Englewood Cliffs, NJ: Prentice-Hall; 2001. Rec #: 1575
F-2
19. Frank, R. G. Medical Care Output and Productivity in the Nonprofit Sector: Comment. Cutler, David M. and Berndt, Ernst R.NBER Studies in Income and Wealth, vol. 62. Chicago and London: University of Chicago Press; 2001; pp. 137-40. Rec #: 1042
20. Ganley, A. and Cubbin, J. S. Public Sector Efficiency Measurement: Applications of Data Envelopment Analysis. Amsterdam: Elsevier; 1992. Rec #: 1628
21. Grosskopf, S.; Margaritis, D., and Valdmanis, V. Nurse productivity and wages. New Zealand Economic Papers. 1990; 24:73-86. Rec #: 1580
22. Hellman, E. A. Analysis of a home health agency's productivity system. Public Health Nurs. 1991 Dec; 8(4):251-7. Rec #: 1401
23. Lee, W. and Wang, Y. Productivity Growth of Public and Private Medical Centers and Regional Hospitals in Taiwan: Nonparametric Malmquist Index (In Japanese With English summary ). Academia Economic Papers. 1998; 26(3): 243-69. Rec #: 1465
24. Lekprichakul, T. Efficiency Measurement of 89 Public Provincial Hospitals in Thailand: Parametric and Non-parametric Estimation Methods [Ph.D.]: University of Hawaii; 2001. Rec #: 1054
25. Lewis, D. The Allocative Efficiency of the Australian Health Care System. Bridges, JohnAustralian Studies in Health Service Administration, no. 89. Sydney: University of New South Wales School of Health Services Management; 2001; pp. 213-23. Rec #: 1047
26. Liang, S. Contract Choice and Physician Productivity [Ph.D.]: University of Washington; 1999. Rec #: 1452
27. Ling, D. Productivity and Competition in Health Care Markets [Ph.D.]: Massachusetts Institute of Technology; 1999. Rec #: 1462
28. Lo, J. C.; Shih, K. S., and Chen, K. L. Technical efficiency of the general hospitals in Taiwan: An application of DEA. Academia Economic Papers. 1996; 24(3):275-96. Rec #: 1618
29. Mensah, Y. M. Input Substitution and Productive Efficiency: Optimization Behavior in Nonprofit Institutions. Lee, Cheng-FewGreenwich, Conn. and London: JAI Press; 1997; pp. 161-91. Rec #: 1457
30. Mirmirani, S. and Li, H. Health Care Efficiency Measurement: An Application of Data Envelopment Analysis. Rivista Internazionale Di Scienze Economiche e Commerciali. 1995; 42(3):217-29. Rec #: 1494
31. Mobley, L. R. Multihospital Systems in California: Behavior and Efficiency [Ph.D.]: University of California Santa Barbara; 1990. Rec #: 1517
32. Molinari, N. A. Efficiency Improvements via Monitoring Medical Group Practice [Ph.D.]: Wayne State University; 2001. Rec #: 1053
33. Mourdoukoutas, P. Technical Efficiency and Hospital Costs [Ph.D.]: University of Connecticut; 1994. Rec #: 1503
34. Okoye, I. N. The Effects of Internal Organization Structure and Administrator Education on the Efficiency of United State Short-Term Hospitals: A Data Envelopment Analysis Approach [Ph.D.]: Wayne State University; 2003. Rec #: 1033
35. Osterkamp, R. Health-Care Efficiency in OECD Countries. Applied Economics Quarterly. 2004; 50:117-42. Rec #: 1007
36. Overdyk, F. J.; Harvey, S. C.; Fishman, R. L., and Shippey, F. Successful strategies for improving operating room efficiency at academic institutions. Anesth Analg. 1998 Apr; 86(4):896-906. Rec #: 1323
37. Ozcan, Y. A. and Lynch, J. R. Rural Hospital Closures: An Inquiry into Efficiency. Scheffler, Richard M. and Rossiter, Louis F.Greenwich, Conn. and London: JAI Press; 1992; pp. 205-24. Rec #: 1493
38. Pekurinen, M. and et al. Hospital Productivity in Finland: Further Analysis. Liiketaloudellinen Aikakauskirja. 1991; 40(1):50-67. Rec #: 1518
39. Ramanathan, T. V.; Chandra, K. S.; Thupeng, W. M.; Kessler, D., and McClellan, M. A Comparison of the Technical Efficiencies of Health Districts and Hospitals in Botswana The Effects of Hospital Ownership on Medical Productivity. 2003(8537): 307-20. Rec #: 1039
F-3
40. Rattso, J. Productivity and Costs in Public Production of Services. Andersen, Torben M. and Molander, PerCambridge; New York and Melbourne: Cambridge University Press; 2003; pp. 105-30. Rec #: 1407
41. Rice, T. The Economics of Health Reconsidered. Chicago: Health Administration Press; 2003. Rec #: 1596
42. Rohrer, J. E. and Vaughan, M. Monitoring health care system performance in Iowa. Health Serv Manage Res. 1997 May; 10(2):107-12. Rec #: 1341
43. Roos, P. Measuring output of hospital services. Fox, K. J. Efficiency in the Public Sector. Boston: Kluwer; 2002. Rec #: 1597
44. Shanahan, M. The Allocative Efficiency of the Australian Health Care System: Commentary. Bridges, JohnAustralian Studies in Health Service Administration, no. 89. Sydney: University of New South Wales School of Health Services Management; 2001; pp. 225-26. Rec #: 1046
45. Silkman, R. H. Measuring Efficiency: An Assessment of Data Envelopment Analysis. San Francisco: Jossey Bass; 1986. Rec #: 1630
46. Simoens, S. and Giuffrida, A. The Impact of Physician Payment Methods on Raising the Efficiency of the Healthcare System: An International Comparison. Applied Health Economics and Health Policy. 2004; 3(1):39-46. Rec #: 1005
47. Sissouras, A.; Mitropoulos, J., and Gounaris, C. Evaluating the Efficiency of Health Care Units: The Case of the Greek Primary Health Care Centers. Javor, Andras; van Eimeren, Wilhelm, and Duru, GerardVilleurbanne, France: International Society for System Science in Health Care; 2000; pp. 202-05. Rec #: 1055
48. Smith, P. Developing Composite Indicators for Assessing Health System Efficiency. Smith, PeterParis and Washington, D.C.: Organisation for Economic Co-operation and Development; 2002; pp. 295-316. Rec #: 1013
49. Soderstrom, N. S. Health Care Production Efficiency under Different Ownership Types: Commentary. Chan, James L.Greenwich, Conn. and London: JAI Press; 1994; pp. 323-28. Rec #: 1476
50. Sommersguter-Reichmann, M. and Parry, I. W. H. Analysing Hospital Productivity Changes Using Non-parametric Approaches On the Efficiency of Public and Private Health Care Systems: An Application to Alternative Health Policies in the United Kingdom. 2003(01/07): 145-60. Rec #: 1041
51. Stepan, A. and Sommersguter-Reichmann, M. New Public Management and Its Excesses: The Financing of Hospitals and Path-Dependent Impacts on Hospital Efficiency: A Case Study for Austria. RISEC: International Review of Economics and Business. 2004; 51(1):143-57. Rec #: 1019
52. Stevens, C. J. Ownership and Inframarginal Rents: The Role and Effect of Input-Supplier Ownership on the Efficiency of Health Maintenance Organizations [Ph.D.]: Washington State University; 2000. Rec #: 1443
53. Stone, G. A. An Efficiency Analysis of Physician Distribution in Michigan Using Data Envelopment Analysis [Ph.D.]: Wayne State University; 1999. Rec #: 1451
54. Su, J. Measuring Efficiency in Hospital Mergers and Access to Health Care [Ph.D.]: University of Kansas; 2000. Rec #: 1453
55. Szczepura, A.; Davies, A.; Fletcher, C. J., and Boussofiane, A. Efficiency and effectiveness in general practice. Journal of Management in Medicine. 1993; 7(5):36-47. Rec #: 1603
56. Thanassoulis, E.; Boussofiane, A., and Dyson, R. A comparison of data envelopment analysis and ration analysis as tools for performance assessment. International Journal of Management Science. 1996; 24(3):229-44. Rec #: 1604
57. Tsaprounis, D. The Administrative Efficiency of Hospitals and the Effect of Electronic Data Interchange: A Critical Evaluation of the Stochastic Frontier and the Data Envelopment Analysis Models to Efficiency Measurement [Ph.D.]: City University of New York; 1997. Rec #: 1466
58. Ventura, J.; Gonzalez, E.; Carcaba, A.; Santerre, R. E., and Vernon, J. A. Efficiency and Program-Contract Bargaining in Spanish Public Hospitals Testing for Ownership Mix Efficiency: The Case of the Nursing Home Industry. 2004(11115): 549-73. Rec #: 1012
F-4
59. Wagstaff, A. Quantitative techniques for investigating health service efficiency. Seminar on Economia y Salud del Sistema Sanitario Espanol; Santander, Spain. 1992. Rec #: 1616
60. Wang, J. and Mahmood, A. Efficiency of the NSW Public Acute Hospitals: An Application of the Data Envelopment Analysis. Bridges, JohnAustralian Studies in Health Service Administration, no. 89. Sydney: University of New South Wales School of Health Services Management; 2001; pp. 247-60. Rec #: 1045
61. Wang, J. and Mahmood, A. Relative Efficiency of NSW Public Acute Hospitals: A Stochastic Frontier Cost Function Analysis. Bridges, JohnAustralian Studies in Health Service Administration, no. 89. Sydney: University of New South Wales School of Health Services Management; 2001; pp. 261-79. Rec #: 1044
62. Zweifel, P. Health-Care Efficiency in OECD Countries: Comment. Applied Economics Quarterly. 2004; 50:143-49. Rec #: 1006

F-5
Rejected: Topic
1. Accurate patient costing under PPS ensures margins, improves efficiency. Natl Rep Subacute Care. 2000 Feb 9; 8(3):4-6. Rec #: 1273
2. Measuring PPO performance is an inexact science at best. Data Strateg Benchmarks. 2001 Feb; 5(2):28-30, 17. Rec #: 1237
3. Perspectives. MedPAC: cost-sharing changes could boost Medicare efficiency. Med Health. 2002 Jul 1; 56(24):7-8. Rec #: 1166
4. AHRQ. Declining per-patient costs not just from shorter LOS. Data Strateg Benchmarks. 2000 Oct; 4(10 ):157-60, 145. Rec #: 1248
5. Albertina, M. J. CT: considerations for safety, efficiency and cost containment. Radiol Manage. 2002 Sep-2002 Oct 31; 24(5):10-2. Rec #: 1175
6. Ali, N. A.; Mekhjian, H. S.; Kuehn, P. L.; Bentley, T. D.; Kumar, R.; Ferketich, A. K., and Hoffmann, S. P. Specificity of computerized physician order entry has a significant effect on the efficiency of workflow for critically ill patients. Crit Care Med. 2005 Jan; 33(1):110-4. Rec #: 1108
7. Almanaseer, Y.; Mukherjee, D.; Kline-Rogers, E. M.; Kesterson, S. K.; Sonnad, S. S.; Rogers, B.; Smith, D.; Furney, S.; Ernst, R.; McCort, J., and Eagle, K. A. Implementation of the ACC/AHA guidelines for preoperative cardiac risk assessment in a general medicine preoperative clinic: improving efficiency and preserving outcomes. Cardiology. 2005; 103(1):24-9. Rec #: 1113
8. Anderson, D. G.; Hollander, S. F., and Bastar, P. Customized productivity feedback systems improve nursing performance and reduce costs. Nurs Econ. 1991 Sep-1991 Oct 31; 9(5):367-70. Rec #: 1168
9. Austin, M. T.; Diaz, J. J. Jr; Feurer, I. D.; Miller, R. S.; May, A. K.; Guillamondegui, O. D.; Pinson, C. W., and Morris, J. A. Creating an emergency general surgery service enhances the productivity of trauma surgeons, general surgeons and the hospital. J Trauma. 2005 May; 58(5):906-10. Rec #: 1101
10. Auton, G. M. Using benchmarking techniques to improve efficiency and quality in cardiology services: Part one. J Cardiovasc Manag. 1994 Mar-1994 Apr 30; 5(2):16-8, 20-1. Rec #: 1384
11. Avery, G. Comparative efficiency of national health systems. Devleoped countries must pay attention to wider issues in helping developing countries. BMJ. 2002 Jan 5; 324(7328):48; author reply 48-9. Rec #: 1207
12. Banks, D.; Parker, E., and Wendel, J. Strategic Interaction among Hospitals and Nursing Facilities: The Efficiency Effects of Payment Systems and Vertical Integration. Health Economics. 2001; 10(2):119-34. Rec #: 1445
13. Barros, A. The many faces of productivity measurement. MLO Med Lab Obs. 1990 Apr; 22(4):17-8. Rec #: 1126
14. Becker, E. R.; Cohen, D.; Culler, S. D.; Ellis, S.; Green, L. M.; Schnitzler, R. N.; Simon, A., and Weintraub, W. S. Benchmarking cardiac catheterization laboratories: the impact of patient age, gender and risk factors on variable costs, device costs, total time and procedural time in 53 catheterization laboratories. J Invasive Cardiol. 1999 Sep; 11(9):533-42. Rec #: 1275
15. Benedetti, T. J.; Baldwin, L. M.; Andrilla, C. H., and Hart, L. G. The productivity of Washington State's obstetrician-gynecologist workforce: does gender make a difference? Obstet Gynecol. 2004 Mar; 103(3):499-505. Rec #: 1131
16. Benninger, M. S. and Strode, S. R. Model for optimal space and staff efficiency in an otolaryngology clinic. Otolaryngol Head Neck Surg. 1998 Oct; 119(4):394-7. Rec #: 1310
17. Bishop, C. E. Efficiency of home care: notes for an economic approach to resource allocation. J Aging Health. 1999 Aug; 11(3):277-98. Rec #: 1287
18. Boggs, K. A. Creating a more efficient physician practice: six steps toward turbo-charged practice revenues. J Med Pract Manage. 2002 Jan-2002 Feb 28; 17(4):178-82. Rec #: 1202
F-6
19. Bonneux, L. Comparative efficiency of national health systems. To improve health care system's performance, drink red wine. BMJ. 2002 Jan 5; 324(7328):49. Rec #: 1206
20. Bradbury, R. C.; Golec, J. H., and Steen, P. M. Linking health outcomes and resource efficiency for hospitalized patients: do physicians with low mortality and morbidity rates also have low resource expenditures? Health Serv Manage Res. 2000 Feb; 13(1):57-68. Rec #: 1242
21. Bradshaw, G. and Bradshaw, P. L. Competition and efficiency in health care--the case of the British National Health Service. J Nurs Manag. 1994 Jan; 2(1):31-6. Rec #: 1388
22. Brandt, M. D. Measuring and improving performance: a practical approach to implementing a productivity program. J AHIMA. 1994 Jul; 65(7):46-51. Rec #: 1378
23. Brenn, B. R. and Lawless, S. T. A simplified analysis to determine the impact of surgical procedure time on pediatric anesthesia productivity. Health Care Manage Rev. 2004 Oct-2004 Dec 31; 29(4):270-7. Rec #: 1112
24. Capettini, R.; Dittman, D. A., and Morey, R. C. Variation in inefficiency among US hospitals. Journal of Accounting and Public Policy. 1985; 4:83-110. Rec #: 1561
25. Cerese, J. Leveraging performance measurement and management: the quality and efficiency edge. Top Health Inf Manage. 2001 Nov; 22(2):73-8. Rec #: 1210
26. Chandra, Amitabh and Staiger, Douglas. Testing a Roy Model with Productivity Spillovers: Evidence from the Treatment of Heart Attacks [Ph.D.]: Texas Tech University National Bureau of Economic Research Inc NBER Working Papers: 10811; 2004Unlisted; Unlisted. Rec #: 1092
27. Cohen, M. D.; Hawes, D. R.; Hutchins, G. D.; McPhee, W. D.; LaMasters, M. B., and Fallon, R. P. Activity-based cost analysis: a method of analyzing the financial and operating performance of academic radiology departments. Radiology. 2000 Jun; 215(3):708-16. Rec #: 1270
28. Critchley, P.; Jadad, A. R.; Taniguchi, A.; Woods, A.; Stevens, R.; Reyno, L., and Whelan, T. J. Are some palliative care delivery systems more effective and efficient than others? A systematic review of comparative studies. J Palliat Care. 1999 Winter; 15(4):40-7. Rec #: 1278
29. Cromwell, T. J. Productivity presented graphically. Nurs Manage. 1993 Apr; 24(4):73-8. Rec #: 1390
30. Dafny, L. and Gruber, J. Does Public Insurance Improve the Efficiency of Medical Care? Medicaid Expansions and Child Hospitalizations. 2000(7555). Rec #: 1023
31. Dafny, L. and Gruber, J. Public Insurance and Child Hospitalizations: Access and Efficiency Effects. Journal of Public Economics. 2005; 89(1 ):109-29. Rec #: 1515
32. Dexter, F. and Rittenmeyer, H. Measuring productivity of the phase I postanesthesia care unit. J Perianesth Nurs. 1997 Feb; 12(1):7-11. Rec #: 1344
33. Donham, R. T. Defining measurable OR-PR scheduling, efficiency, and utilization data elements: the Association of Anesthesia Clinical Directors procedural times glossary. Int Anesthesiol Clin. 1998 Winter; 36(1):15-29. Rec #: 1322
34. Duggan, M. Does Contracting Out Increase the Efficiency of Government Programs? Evidence from Medicaid HMOs. Journal of Public Economics. 2004; 88(12):2549-72. Rec #: 1016
35. Eappen, S.; Flanagan, H., and Bhattacharyya, N. Introduction of anesthesia resident trainees to the operating room does not lead to changes in anesthesia-controlled times for efficiency measures. Anesthesiology. 2004 Nov; 101(5):1210-4. Rec #: 1114
36. Eggleston, K.; Grossman, J., and Cutler, D. Productivity Research and Healthcare Delivery Innovation. Applied Health Economics and Health Policy. 2004; 3(3):133-41. Rec #: 1408
37. Einterz, R. M.; Goss, J. R.; Kelley, S., and Lore, W. Illness and efficiency of health services delivery in a district hospital. East Afr Med J. 1992 May; 69(5):248-53. Rec #: 1395
F-7
38. Evans, R. G. Behavioural cost functions for hospitals. Canadian J. Economics. 1971; 4:198-215. Rec #: 1624
39. Fisher, E. S.; Wennberg, D. E.; Stukel, T. A., and Gottlieb, D. J. Variations in the longitudinal efficiency of academic medical centers. Health Aff (Millwood). 2004; Suppl Web Exclusive:VAR19-32. Rec #: 1632
40. Fishman, P. A.; Hornbrook, M. C.; Meenan, R. T., and Goodman, M. J. Opportunities and challenges for measuring cost, quality, and clinical effectiveness in health care. Med Care Res Rev. 2004 Sep; 61(3 Suppl):124S-43S. Rec #: 1070
41. Forsberg, E.; Axelsson, R., and Arnetz, B. Financial incentives in health care. The impact of performance-based reimbursement. Health Policy. 2001 Dec; 58(3):243-62. Rec #: 1214
42. Fox, K. A. Can a hospital be like a supermarket? Better data will provide cost controls, efficiencies, and income streams. J Health Care Finance. 1997 Spring; 23(3):44-8. Rec #: 1343
43. Fox, R. T.; Fox, D. H., and Wells, P. J. Performance of first-line management functions on productivity of hospital unit personnel. J Nurs Adm. 1999 Sep; 29(9):12-8. Rec #: 1291
44. Frech, H. E. III and Mobley, L. R. Efficiency, Growth and Concentration: An Empirical Analysis of Hospital Markets. 1998(98/14): 38. Rec #: 1460
45. Friedman, D. M. and Berger, D. L. Improving team structure and communication: a key to hospital efficiency. Arch Surg. 2004 Nov; 139(11):1194-8. Rec #: 1510
46. Glass, K. P.; Pieper, L. E., and Berlin, M. F. Incentive-based physician compensation models. J Ambul Care Manage. 1999 Jul; 22(3):36-46. Rec #: 1240
47. Goedhuys, J. and Rethans, J. J. On the relationship between the efficiency and the quality of the consultation. A validity study. Fam Pract. 2001 Dec; 18(6):592-6. Rec #: 1211
48. Gosden, T.; Black, M.; Mead, N., and Leese, B. The efficiency of specialist outreach clinics in general practice: is further evaluation needed? J Health Serv Res Policy. 1997 Jul; 2(3):174-9. Rec #: 1337
49. Green, R. Measuring productivity in health care. Qld Nurse. 1995 Jul-1995 Aug 31; 14(4):9. Rec #: 1368
50. Gregory, G. D. Using a nursing performance information system. Nurs Manage. 1995 Jul; 26(7):74-7. Rec #: 1366
51. Hadley, J. and Zuckerman, S. The Role of Efficiency Measurement in Hospital Rate Setting. Journal of Health Economics. 1994; 13(3):335-40. Rec #: 1497
52. Hall, D. and Siegel, B. Taking the measure of measures. Quality data initiatives and the challenge of effective and efficient data. J AHIMA. 2005 Feb; 76(2):42-4, 46. Rec #: 1105
53. Harrison, F. G. and Kuhlemeier, K. A. How do skilled nursing rehabilitation managers track efficiency and costs? J Allied Health. 2001 Spring; 30(1):43-7. Rec #: 1235
54. Hendrich, A. L. and Lee, N. Intra-unit patient transports: time, motion, and cost impact on hospital efficiency. Nurs Econ. 2005 Jul-2005 Aug 31; 23(4):157-64, 147. Rec #: 1104
55. Hollingsworth, B.; Maniadakis, N., and Thanassoulis, E. Efficiency. Measured response. Health Serv J. 1999 Nov 25; 109(5682):28-9. Rec #: 1254
56. Huang, I. C. ; Frangakis, C.; Dominici, F.; Diette, G. B., and Wu, A. W. Application of a Propensity Score Approach for Risk Adjustment in Profiling Multiple Physician Groups on Asthma Care. Health Services Research. 2005; 40(1):253-78. Rec #: 1008
57. Huckman, R. S. and Barro, J. Cohort Turnover and Productivity: The July Phenomenon in Teaching Hospitals. 2005(11182). Rec #: 1010
F-8
58. Iapichino, G.; Radrizzani, D.; Simini, B.; Rossi, C.; Albicini, M.; Ferla, L.; Colombo, A.; Pezzi, A.; Brazzi, L.; Melotti, R., and Rossi, G. Effectiveness and efficiency of intensive care medicine: variable costs in different diagnosis groups. Acta Anaesthesiol Scand. 2004 Aug; 48(7):820-6. Rec #: 1121
59. Jacobson, J. M. Promoting and measuring productivity in the HMO. Top Health Care Financ. 1992 Winter; 19(2):75-82. Rec #: 1399
60. Jessee, W. F. Administrative complexity in medical practice: its impact on costs, practice operations and patient care. American College of Medical Practice; 2003 Aug 18. Rec #: 1635
61. Johnson, C. M.; Johnson, T., and Zhang, J. Increasing productivity and reducing errors through usability analysis: a case study and recommendations. Proc AMIA Symp. 2000; 394-8. Rec #: 1252
62. Johnston, M. V.; Wood, K. D., and Fiedler, R. Characteristics of effective and efficient rehabilitation programs. Arch Phys Med Rehabil. 2003 Mar; 84(3):410-8. Rec #: 1511
63. Kahn, J. G.; Kronick, R.; Kreger, M., and Gans, D. N. The cost of health insurance administration in California: estimates for insurers, physicians, and hospitals. Health Aff (Millwood). 2005 Nov-2005 Dec 31; 24(6):1629-39. Rec #: 1634
64. Kanavos, P.; Trueman, P., and Bosilevac, A. Can economic evaluation guidelines improve efficiency in resource allocation? The cases of Portugal, The Netherlands, Finland, and the United Kingdom. Int J Technol Assess Health Care. 2000 Autumn; 16(4):1179-92. Rec #: 1246
65. Kanich, D. G. and Byrd, J. R. How to increase efficiency in the operating room. Surg Clin North Am. 1996 Feb; 76(1):161-73. Rec #: 1354
66. Karpiel, M. S. Using patient classification systems to identify ambulatory care costs. Healthc Financ Manage. 1994 Nov; 48(11):30-4, 36-7. Rec #: 1376
67. Kearnes, D. R. A productivity tool to evaluate NP practice: monitoring clinical time spent in reimbursable, patient-related activities. Nurse Pract. 1992 Apr; 17(4):50-2, 55. Rec #: 1396
68. Keenan, S. P.; Doig, G. S.; Martin, C. M.; Inman, K. J., and Sibbald, W. J. Assessing the efficiency of the admission process to a critical care unit: does the literature allow the use of benchmarking? Intensive Care Med. 1997 May; 23(5):574-80. Rec #: 1340
69. Kessler, D. P. and McClellan, M. B. How Liability Law Affects Medical Productivity. Journal of Health Economics. 2002; 21(6):931-55. Rec #: 1050
70. Kocakulah, M. C. and Harris, D. Measuring human capital cost through benchmarking in health care environment. J Health Care Finance. 2002 Winter; 29(2):27-37. Rec #: 1172
71. Kole, L. A. Calculating costs for an episode of care. JAAPA. 2002 Nov; 15(11):7. Rec #: 1089
72. Krupinski, E.; Webster, P.; Dolliver, M.; Weinstein, R. S., and Lopez, A. M. Efficiency analysis of a multi-specialty telemedicine service. Telemed J. 1999 Fall; 5(3):265-71. Rec #: 1267
73. Lagasse, P. Jr. Physician productivity measurement, methodology and implementation. J Soc Health Syst. 1996; 5(2):41-9. Rec #: 1355
74. Landry, M. T.; Landry, H. T., and Hebert, W. A tool to measure nurse efficiency and value. Home Healthc Nurse. 2001 Jul; 19(7):445-9. Rec #: 1198
75. Lester, D. K. and Linn, L. S. Variation in hospital charges for total joint arthroplasty: an investigation of physician efficiency. Orthopedics. 2000 Feb; 23(2):137-40. Rec #: 1279
76. Longdon, T. Economy, effectiveness and efficiency in the NHS. Br J Hosp Med. 1995 Sep 6-1995 Sep 19; 54(5):232-4. Rec #: 1361
77. Lossius, H. M.; Langhelle, A.; Pillgram-Larsen, J.; Lossius, T. A.; Soreide, E.; Laake, P., and Steen, P. A. Efficiency of activation of the trauma team in a Norwegian trauma referral centre. Eur J Surg. 2000 Oct; 166(10):760-4. Rec #: 1253
78. Lynk, W. J. The creation of economic efficiencies in hospital mergers. J Health Econ. 1995 Dec; 14(5):507-30. Rec #: 1358
F-9
79. Martin, K.; Balding, C., and Sohal, A. Stakeholder perspectives on outpatient services performance: what patients, clinicians and managers want to know. Aust Health Rev. 2003; 26(2):63-72. Rec #: 1120
80. Mason, M. G. Evaluating nursing productivity in the emergency department. Nurs Manage. 1991 Oct; 22(10):120J, 120N, 120P. Rec #: 1402
81. McGhee, S. M.; Leung, G. M., and Hedley, A. J. Efficiency is dependent on the control of supply. Hong Kong Med J. 2001 Jun; 7(2):169-73. Rec #: 1220
82. McKee, M. Measuring the efficiency of health systems. The world health report sets the agenda, but there's still a long way to go. BMJ. 2001 Aug 11; 323(7308):295-6. Rec #: 1223
83. McNeese-Smith, D. K. The influence of manager behavior on nurses' job satisfaction, productivity, and commitment. J Nurs Adm. 1997 Sep; 27(9):47-55. Rec #: 1335
84. ---. Staff nurse views of their productivity and nonproductivity. Health Care Manage Rev. 2001 Spring; 26(2):7-19. Rec #: 1233
85. Miller, R. H. and Luft, H. S. HMO plan performance update: an analysis of the literature, 1997-2001. Health Aff (Millwood). 2002 Jul-2002 Aug 31; 21(4):63-86. Rec #: 1190
86. Mira, A. and Lehmann, C. Pre-analytical workflow analysis reveals simple changes and can result in improved hospital efficiency. Clin Leadersh Manag Rev. 2001 Jan-2001 Feb 28; 15(1):23-9. Rec #: 1238
87. Mobley, L. R. Effects of selective contracting on hospital efficiency, costs and accessibility. Health Econ. 1998 May; 7(3):247-61. Rec #: 1321
88. Mobley, L. R. and Magnussen, J. An International Comparison of Hospital Efficiency: Does Institutional Environment Matter? Applied Economics. 1998; 30( 8):1089-1100. Rec #: 1463
89. Morrissey, J. All benchmarked out. Even the top 100 hospitals can't find many more ways to be more productive. Mod Healthc. 1998 Dec 7; 28(49):38-40, 42-4, 46. Rec #: 1300
90. Nash, K. D. and Bramson, J. Economic models to help periodontists evaluate their practices: how to analyze a practice to assess the potential impact of managed care contracts. J Periodontol. 1998 Feb; 69(2):241-53. Rec #: 1324
91. Negrini, D.; Kettle, A.; Sheppard, L.; Mills, G. H., and Edbrooke, D. L. The cost of a hospital ward in Europe: is there a methodology available to accurately measure the costs? J Health Organ Manag. 2004; 18(2-3):195-206. Rec #: 1090
92. Newhouse, J. P. Frontier estimation: how useful a tool for health economics? J Health Econ. 1994 Oct; 13(3):317-22. Rec #: 1536
93. Newhouse, J. P. Reimbursement Under Uncertainty: What To Do If One Cannot Identify An Efficient Hospital. 1994(MR-309-HCFA): 56. Rec #: 1489
94. ---. Reimbursing Health Plans and Health Providers: Efficiency in Production versus Selection. Journal of Economic Literature. 1996; 34(3):1236-63. Rec #: 1487
95. O'Reilly, D.; Parfrey, P. S.; Barrett, B., and McDonald, J. Efficiency of institutional long-term care and annual demands for placement. Healthc Manage Forum. 1998 Fall; 11(3):26-32. Rec #: 1303
96. Offner, P. J.; Hawkes, A.; Madayag, R.; Seale, F., and Maines, C. General surgery residents improve efficiency but not outcome of trauma care. J Trauma. 2003 Jul; 55(1):14-9. Rec #: 1145
97. Ondategui-Parra, S.; Bhagwat, J. G.; Zou, K. H.; Nathanson, E.; Gill, I. E., and Ros, P. R. Use of productivity and financial indicators for monitoring performance in academic radiology departments: U.S. nationwide survey. Radiology. 2005 Jul; 236(1):214-9. Rec #: 1099
98. Oxley, H. and MacFarlan, M. Health Care Reform: Controlling Spending and Increasing Efficiency. OECD Economic Studies. 1995; 0(24):7-55. Rec #: 1486
99. Page, S. How Physicians' Organizations Compete: Protectionism and Efficiency. Journal of Health Politics, Policy and Law. 2004; 29(1):75-105. Rec #: 1413
F-10
100. Parente, D. H.; Pinto, M. B., and Barber, J. C. A pre-post comparison of service operational efficiency and patient satisfaction under open access scheduling. Health Care Manage Rev. 2005 Jul-2005 Sep 30; 30(3):220-8. Rec #: 1097
101. Parker, D. and Newbrander, W. Tackling wastage and inefficiency in the health sector. World Health Forum. 1994; 15(2):107-13; discussion 114-31. Rec #: 1386
102. Parkin, D. Comparing Health Service Efficiency across Countries. McGuire, Alistair; Fenn, Paul, and Mayhew, KenPaperback reprint. Oxford and New York: Oxford University Press; 1991; pp. 172-91. Rec #: 1516
103. Parry, I. W. H. On the Efficiency of Public and Private Health Care Systems: An Application to Alternative Health Policies in the United Kingdom. 2001(01/07): 22. Rec #: 1423
104. Pollack, M. M. and Koch, M. A. Association of outcomes with organizational characteristics of neonatal intensive care units. Crit Care Med. 2003 Jun; 31(6):1620-9. Rec #: 1147
105. Porter, H. B. The effect of ambulatory oncology nursing practice models on health resource utilization. Part 2, Different practice models--different use of health resources? J Nurs Adm. 1995 Feb; 25(2):15-22. Rec #: 1372
106. Preston, S. H. How does your productivity measure up? Med Econ. 1999 Nov 22; 76(22):54-60. Rec #: 1274
107. Provenzale, D.; Ofman, J.; Gralnek, I.; Rabeneck, L.; Koff, R., and McCrory, D. Gastroenterologist specialist care and care provided by generalists--an evaluation of effectiveness and efficiency. Am J Gastroenterol. 2003 Jan; 98(1):21-8. Rec #: 1087
108. Randolph, A. G. and Pronovost, P. Reorganizing the delivery of intensive care could improve efficiency and save lives. J Eval Clin Pract. 2002 Feb; 8(1):1-8. Rec #: 1200
109. Ravallion, M. On Measuring Aggregate "Social Efficiency ". Economic Development and Cultural Change. 2005; 53( 2):273-92. Rec #: 1513
110. Redfern, J. and Bowling, A. Efficiency of care at the primary-secondary interface: variations with GP fundholding. Health Place. 2000 Mar; 6(1):15-23. Rec #: 1280
111. Regan, G. Making a difference to A&E: analysis of the operational inefficiencies in A&E departments in major acute hospitals in Dublin. Accid Emerg Nurs. 2000 Jan; 8(1):54-61. Rec #: 1249
112. Reiner, B. I.; Siegel, E. L.; Hooper, F. J.; Pomerantz, S.; Dahlke, A., and Rallis, D. Radiologists' productivity in the interpretation of CT scans: a comparison of PACS with conventional film. AJR Am J Roentgenol. 2001 Apr; 176(4):861-4. Rec #: 1236
113. Renouf, J. Balancing health care efficiency and cost. Can Fam Physician. 1995 Jul; 41:1158. Rec #: 1365
114. Rogut, L. Reshaping inpatient care: efficiency and quality in New York City hospitals. Pap Ser United Hosp Fund N Y. 1996 Nov; 1-41. Rec #: 1348
115. Roos, N. P. and Brownell, M. Introducing data into the health policy process: developing a report on the efficiency of bed use in Manitoba. Healthc Manage Forum. 1994 Summer; 7(2):46-50. Rec #: 1371
116. Rosen, A. K.; Loveland, S. A.; Rakovski, C. C.; Christiansen, C. L., and Berlowitz, D. R. Do different case-mix measures affect assessments of provider efficiency? Lessons from the Department of Veterans Affairs. J Ambul Care Manage. 2003 Jul-2003 Sep 30; 26(3):229-42. Rec #: 1081
117. Rosen, A. K.; Rakovski, C. C.; Loveland, S. A.; Anderson, J. J., and Berlowitz, D. R. Profiling resource use: do different outcomes affect assessments of provider efficiency? Am J Manag Care. 2002 Dec; 8(12):1105-15. Rec #: 1167
118. Rosko, M. D. Hospital Cost Efficiency. Inquiry. 2003; 40(3):310-11. Rec #: 1030
F-11
119. Rudkin, G. E.; Bacon, A. K.; Burrow, B.; Chapman, M. H.; Claxton, M.; Donovan, B.; Gibb, D., and Weber, L. S. Review of efficiencies and patient satisfaction in Australian and New Zealand day surgery units: a pilot study. Anaesth Intensive Care. 1996 Feb; 24(1):74-8. Rec #: 1353
120. Santerre, R. E. and Vernon, J. A. Hospital Ownership Mix Efficiency in the US: An Exploratory Study. 2005(11192). Rec #: 1512
121. Santerre, R. E. and Vernon, J. A. Testing for Ownership Mix Efficiency: The Case of the Nursing Home Industry. 2005(11115). Rec #: 1514
122. Schreck, T. J. Measuring productivity in outpatient addiction counseling. J Healthc Qual. 1999 Jul-1999 Aug 31; 21(4):34-7. Rec #: 1288
123. Schroeder, R. E. Improving productivity in academic group practice. Med Group Manage J. 1995 May-1995 Jun 30; 42(3):72, 74, 76 passim. Rec #: 1369
124. Schwartz, W. B. and Mendelson, D. N. Eliminating waste and inefficiency can do little to contain costs. Health Aff (Millwood). 1994 Spring; 13(1):224-38. Rec #: 1385
125. Segal, L. and Richardson, J. Economic Framework for Allocative Efficiency in the Health Sector. Australian Economic Review. 1994; 0(106):89-98. Rec #: 1502
126. Segall, M. Comparative efficiency of national health systems. Methodological problems were understated. BMJ. 2002 Jan 5; 324(7328):48-9. Rec #: 1208
127. Severens, J. L. Value for money of changing healthcare services? Economic evaluation of quality improvement. Qual Saf Health Care. 2003 Oct; 12(5):366-71. Rec #: 1079
128. Shukla, R. K. Effect of an admission monitoring and scheduling system on productivity and employee satisfaction. Hosp Health Serv Adm. 1990 Fall; 35(3):429-41. Rec #: 1302
129. Silva, N. and Aderholdt, B. Monitoring nursing productivity: a unique approach integrating an on-line kardex with workload measurement. Comput Nurs. 1992 Nov-1992 Dec 31; 10(6):232-4. Rec #: 1393
130. Sinreich, D. and Marmor, Y. Ways to reduce patient turnaround time and improve service quality in emergency departments. J Health Organ Manag. 2005; 19(2):88-105. Rec #: 1095
131. Solomon, A. and Martino, S. Relative value units: practical productivity measurement. Radiol Manage. 1991 Winter; 13(1):33-7. Rec #: 1400
132. Sullivan, K. On the 'efficiency' of managed care plans. Health Aff (Millwood). 2000 Jul-2000 Aug 31; 19(4):139-48. Rec #: 1265
133. Tait, N. and Thurston, N. PACS--a system for measuring patient activity and costs. AARN News Lett. 1995 Dec; 51(11):11. Rec #: 1357
134. Tavakoli, M.; Davies, H. T. O., and Malek, M. Modelling Production and Cost Efficiency within Health Care Systems. Health Care Management Science. 1999; 2(2):i-iii. Rec #: 1450
135. Thalman, J. J. and Ford, R. M. Labor and productivity measures. Respir Care Clin N Am. 2004 Jun; 10(2):211-21. Rec #: 1125
136. Thomas, J. W.; Grazier, K. L., and Ward, K. Comparing accuracy of risk-adjustment methodologies used in economic profiling of physicians. Inquiry. 2004 Summer; 41(2):218-31. Rec #: 1091
137. Upenieks, V. V. Work sampling. Assessing nursing efficiency. Nurs Manage. 1998 Apr; 29(4):27-9. Rec #: 1315
138. Wade, J. C. and Zechman, D. M. Enterprise-wide patient monitoring improves care efficiency and lowers costs. J Med Pract Manage. 2001 Jul-2001 Aug 31; 17(1):44-8. Rec #: 1218
139. Weisbrod, B. A. Productivity and Incentives in the Medical Care Sector. Scandinavian Journal of Economics. 1992; 94( 0):S131-45. Rec #: 1506
140. Widjaja, L. S.; Chan, B. P.; Chen, H.; Ong, B. K., and Pang, Y. T. Variance analysis applied to a stroke pathway: how this can improve efficiency of healthcare delivery. Ann Acad Med Singapore. 2002 Jul; 31(4):425-30. Rec #: 1184
F-12
141. Wilton, P. and Smith, R. D. Devolved Budgetary Responsibility in Primary Care: A Cross-Country Assessment of the Impact on Efficiency. European Journal of Health Economics. 2002; 3(1):17-25. Rec #: 1004
142. World Health Organization (WHO). Report of the scientific peer review group on health systems performance assessment [Web Page]. Accessed 2001. Available at: http://www.who.int/health-systems-performance/sprg/report_or_sprg_on_hspa.htm. Rec #: 1609
143. Worthington, A. C. Frontier efficiency measurement in health care: a review of empirical techniques and selected applications. Med Care Res Rev. 2004 Jun; 61(2):135-70. Rec #: 1073
144. Zamir, S. and Rex, D. K. An initial investigation of efficiency in endoscopy delivery. Am J Gastroenterol. 2002 Aug; 97(8):1968-72. Rec #: 1183
145. Zarling, E. J.; Piontek, F. A.; Kohli, R., and Carrier, J. The cost and efficiency of hospital care provided by primary care physicians and medical subspecialists. Am J Med Qual. 1999 Sep-1999 Oct 31; 14(5):197-201. Rec #: 1290
F-13
Rejected: Focus
1. Medicaid program and State Children's Health
Insurance Program (SCHIP) payment error rate measurement. Interim final rule with comment period. Fed Regist. 2005 Oct 5; 70(192): 58259-77. Rec #: 1100
2. Sweden. Looking for cost efficiency. Med Device Technol. 2001 Mar; 12(2):33. Rec #: 1230
3. Take your pick. The Economist. 2006 Mar 2. Rec #: 1612
4. Abel, E. and Longworth, J. C. Developing an economic IQ in primary care. J Am Acad Nurse Pract. 2002 Jan; 14(1):3-10. Rec #: 1204
5. Ahtiala, P. Medical Decision Criteria and Policy for an Efficient Allocation of Resources. International Journal of Health Care Finance and Economics. 2002; 2(1):5-24. Rec #: 1406
6. Aloisio, J. J. Proposed: improve efficiency, reimbursement and LOS through better utilization of inpatient imaging procedures. Radiol Manage. 2002 Mar-2002 Apr 30; 24(2):36-9. Rec #: 1197
7. Balicki, B.; Kelly, W. P., and Miller, H. Establishing benchmarks for ambulatory surgery costs. Healthc Financ Manage. 1995 Sep; 49(9):40-2, 44, 46-8. Rec #: 1364
8. Batchelor, W. B.; Peterson, E. D.; Mark, D. B.; Knight, J. D.; Granger, C. B.; Armstrong, P. W., and Califf, R. M. A comparison of U.S. and Canadian cardiac catheterization practices in detecting severe coronary artery disease after myocardial infarction: efficiency, yield and long-term implications. J Am Coll Cardiol. 1999 Jul; 34(1):12-9. Rec #: 1294
9. Bergenstal, R. M.; Anderson, R. L.; Bina, D. M.; Johnson, M. L.; Davidson, J. L.; Solarz-Johnson, B., and Kendall, D. M. Impact of modem-transferred blood glucose data on clinician work efficiency and patient glycemic control. Diabetes Technol Ther. 2005 Apr; 7(2):241-7. Rec #: 1102
10. Berndt, E. R.; Bir, A.; Busch, S. H.; Frank, R. G., and Normand, S. T. The Medical Treatment of Depression, 1991-1996: Productive Inefficiency, Expected Outcome Variations, and Price Indexes. 2000(7816). Rec #: 1024
11. Birch, S. and Gafni, A. Economics and the evaluation of health care programmes: generalisability of methods and implications for generalisability of results. Health Policy. 2003 May; 64(2):207-19. Rec #: 1156
12. Block, P. C.; Peterson, E. D.; Krone, R.; Kesler, K.; Hannan, E.; O'Connor, G. T., and Detre, K. Identification of variables needed to risk adjust outcomes of coronary interventions: evidence-based guidelines for efficient data collection. J Am Coll Cardiol. 1998 Jul; 32(1):275-82. Rec #: 1317
13. Bloom, J. R.; Alexander, J. A., and Nuchols, B. A. Nurse staffing patterns and hospital efficiency in the United States. Soc Sci Med. 1997 Jan; 44(2):147-55. Rec #: 1346
14. Bradford, W. D. Efficiency in Employment-Based Health Insurance: The Potential for Supra-marginal Cost Pricing. Economic Inquiry. 1996; 34(2):341-56. Rec #: 1490
15. Bradford, W. D.; Kleit, A. N.; Krousel-Wood, M. A., and Re, R. N. Stochastic frontier estimation of cost models within the hospital. Review of Economics and Statistics. 2001; 83(2):302-9. Rec #: 1617
16. Brailer, D. J. Care-based management of cost. Health Manag Technol. 2001 Nov; 22(11):60, 59. Rec #: 1212
17. Brouwer, W. B. F.; Meerding, W.; Lamers, L. M., and Severens, J. L. The Relationship between Productivity and Health-Related QOL: An Exploration. PharmacoEconomics. 2005; 23(3):209-18. Rec #: 1000
18. Brown, D. M. and Hoover, L. W. Total factor productivity modeling in hospital foodservice operations. J Am Diet Assoc. 1991 Sep; 91(9):1088-92. Rec #: 1165
F-14
19. Brukner, H. Only human? The effect of financial productivity incentives on physicians' use of preventive care measures. Am J Med. 2001 Feb 15; 110(3):226-8. Rec #: 1244
20. Capettini, R. A. D. and Corey, R. C. Reimbursement rate setting for Medicaid prescription drugs based on relative efficiencies. Journal of Accounting and Public Policy. 1985; 4:83-110. Rec #: 1562
21. Castello, R.; Bella, J. N.; Rovner, A.; Swan, J.; Smith, J., and Shaw, L. Efficacy and time-efficiency of a "sonographer-driven" contrast echocardiography protocol in a high-volume echocardiography laboratory. Am Heart J. 2003 Mar; 145(3):535-41. Rec #: 1159
22. Chan, L.; Trambert, M.; Kywi, A., and Hartzman, S. PACS in private practice--effect on profits and productivity. J Digit Imaging. 2002; 15 Suppl 1:131-6. Rec #: 1192
23. Chang, P. L.; Huang, S. T.; Wang, T. M.; Hsieh, M. L., and Tsui, K. H. Improvements in the efficiency of care after implementing a clinical-care pathway for transurethral prostatectomy. Br J Urol. 1998 Mar; 81(3):394-7. Rec #: 1325
24. Chetty, V. K. Stochastic technology, production organization and costs. J Health Econ. 1998 Apr; 17(2):187-210. Rec #: 1327
25. Chirikos, T. N. Appraising the economic efficiency of cancer treatment: an exploratory analysis of lung cancer. Health Care Manag Sci. 2003 May; 6(2):87-95. Rec #: 1152
26. Cutler, D. M. and Berndt, E. R. Medical care output and productivity. NBER Studies in Income and Wealth, vol. 62. Chicago and London: University of Chicago Press; 2001. xii, 611. Rec #: 1428
27. Cutler, D. M. and Huckman, R. S. Technological Development and Medical Productivity: The Diffusion of Angioplasty in New York State. Journal of Health Economics. 2003; 22(2):187-217. Rec #: 1048
28. ---. Technological Development and Medical Productivity: The Diffusion of Angioplasty in New York State. 2002(9311). Rec #: 1028
29. Cutler, D. M. and Huckman, R. S. Technological development and medical productivity: the diffusion of angioplasty in New York state. J Health Econ. 2003 Mar; 22(2):187-217. Rec #: 1163
30. Danzon, P. M. and Furukawa, M. F. Health Care: Competition and Productivity. Litan, Robert E. and Rivlin, Alice M.Washington, D.C.: Brookings Institution Press; Washington D.C.: Internet Policy Institute; 2001; pp. 189-234. Rec #: 1420
31. DeSalvo, K. B.; Bowdish, B. E.; Alper, A. S.; Grossman, D. M., and Merrill, W. W. Physician practice variation in assignment of return interval. Arch Intern Med. 2000 Jan 24; 160(2):205-8. Rec #: 1284
32. do Rosario Giraldes, M. Allocative efficiency in the use of health resources in Portugal. J Public Health Med. 1999 Mar; 21(1):55-9. Rec #: 1298
33. Dor, A. Non-minimum cost functions and the stochastic frontier: on applications to health care providers. J Health Econ. 1994 Oct; 13(3):329-34. Rec #: 1614
34. Durham, C. F.; Alden, K. R.; Dalton, J. A.; Carlson, J.; Miller, D. W.; Englebardt, S. P., and Neelon, V. J. Quality of life and productivity in nurses reporting migraine. Headache. 1998 Jun; 38(6):427-35. Rec #: 1318
35. Fallacaro, M. D. An inefficient mix: a comparative analysis of nurse and physician anesthesia providers across New York State. J N Y State Nurses Assoc. 1998 Jun; 29(2):4-8. Rec #: 1304
36. Farrell, M. J. The measurment of productive efficiency. J. Royal Statistical Society Series A. 1957; 120(3):253-90. Rec #: 1627
37. Fern, K. T.; Smith, J. T.; Zee, B.; Lee, A.; Borschneck, D., and Pichora, D. R. Trauma patients with multiple extremity injuries: resource utilization and long-term outcome in relation to injury severity scores. J Trauma. 1998 Sep; 45(3):489-94. Rec #: 1314
38. Gandjour, A.; Kleinschmit, F.; Littmann, V., and Lauterbach, K. W. An evidence-based evaluation of quality and efficiency indicators. Qual Manag Health Care. 2002 Summer; 10(4):41-52. Rec #: 1140
F-15
39. Gemke, R. J.; Bonsel, G. J., and van Vught, A. J. Effectiveness and efficiency of a Dutch pediatric intensive care unit: validity and application of the Pediatric Risk of Mortality score. Crit Care Med. 1994 Sep; 22(9):1477-84. Rec #: 1377
40. Godwin, M.; Seguin, R., and Wilson, R. Queen's University alternative funding plan. Effect on patients, staff, and faculty in the Department of Family Medicine. Can Fam Physician. 2000 Jul; 46:1438-44. Rec #: 1263
41. Guell, R. C. and Fischbaum, M. Toward allocative efficiency in the prescription drug industry. Milbank Q. 1995; 73(2):213-30. Rec #: 1373
42. Harp, S. S. The measurement of performance in a physical therapy clinical program. A ROI approach. Health Care Manag (Frederick). 2004 Apr-2004 Jun 30; 23(2):110-9. Rec #: 1124
43. Harris, K.; Thomas, M.; Short, C., and Moore, R. Assessment of the efficiency of treatment of dyslipidaemia in renal outpatients. J Nephrol. 2002 May-2002 Jun 30; 15(3):263-9. Rec #: 1191
44. Hilsenrath, P.; Levey, S., and O'Neill, L. Management and economic perspectives on efficiency. Best Pract Benchmarking Healthc. 1997 Sep-1997 Oct 31; 2(5):208-13. Rec #: 1329
45. Hollingsworth, B. Data envelopment analysis and productivity analysis: a review of the options. Economic Journal. 1999; 109(456):458-62. Rec #: 1583
46. Ide, P.; Kirby, K. K., and Starck, P. K. Operating room productivity. An evaluation format. J Nurs Adm. 1992 Oct; 22(10):41-8. Rec #: 1394
47. Iregui, M.; Ward, S.; Clinikscale, D.; Clayton, D., and Kollef, M. H. Use of a handheld computer by respiratory care practitioners to improve the efficiency of weaning patients from mechanical ventilation. Crit Care Med. 2002 Sep; 30(9):2038-43. Rec #: 1177
48. Jacob-Tacken, K. H. M.; Koopmanschap, M. A.; Meerding, W. J., and Severens, J. L. Correcting for Compensating Mechanisms Related to Productivity Costs in Economic Evaluations of Health Care Programmes. Health Economics. 2005; 14(5):435-43. Rec #: 1093
49. Jones, B. N. 3rd and Ruskin, P. E. Telemedicine and geriatric psychiatry: directions for future research and policy. J Geriatr Psychiatry Neurol. 2001 Summer; 14(2):59-62. Rec #: 1227
50. Kaplan, L. J.; Santora, T. A.; Blank-Reid, C. A., and Trooskin, S. Z. Improved emergency department efficiency with a three-tier trauma triage system. Injury. 1997 Sep; 28(7):449-53. Rec #: 1326
51. Kim, S. C.; Matlaga, B. R.; Kuo, R. L.; Watkins, S. L.; Kennett, K. M.; Gilling, P. J., and Lingeman, J. E. Holmium laser enucleation of the prostate: a comparison of efficiency measures at two institutions. J Endourol. 2005 Jun; 19(5):555-8. Rec #: 1098
52. Klem, S. A.; Pollack, M. M.; Glass, N. L.; Spohn, W. A.; Kanter, R. K.; Zucker, A. R., and Ruttimann, U. E. Resource use, efficiency, and outcome prediction in pediatric intensive care of trauma patients. J Trauma. 1990 Jan; 30(1):32-6. Rec #: 1107
53. Koc, C. The Productivity of Health Care and Health Production Functions. Health Economics. 2004; 13(8):739-47. Rec #: 1014
54. Koopmanschap, M.; Burdorf, A.; Jacob, K.; Meerding, W. J.; Brouwer, W., and Severens, H. Measuring productivity changes in economic evaluation: setting the research agenda. Pharmacoeconomics. 2005; 23(1):47-54. Rec #: 1065
55. Kooreman, P. Data envelopment analysis and parametric frontier estimation-complementary tools. Journal of Health Economics. 1994; 13(3):345-6. Rec #: 1586
56. Kumar, N. Changing geographic access to and locational efficiency of health services in two Indian districts between 1981 and 1996. Soc Sci Med. 2004 May; 58(10):2045-67. Rec #: 1130
57. Kwan, J.; Hand, P., and Sandercock, P. Improving the efficiency of delivery of thrombolysis for acute stroke: a systematic review. QJM. 2004 May; 97(5):273-9. Rec #: 1128
58. Lin, J. H.; Chang, C. M.; Liu, C. K.; Huang, M. H., and Lin, Y. T. Efficiency and effectiveness of stroke rehabilitation after first stroke. J Formos Med Assoc. 2000 Jun; 99(6):483-90. Rec #: 1264
F-16
59. Lindholm, L.; Rosen, M., and Emmelin, M. An epidemiological approach towards measuring the trade-off between equity and efficiency in health policy. Health Policy. 1996 Mar; 35(3):205-16. Rec #: 1352
60. Lu, M. The Productivity of Mental Health Care: An Instrumental Variable Approach. Journal of Mental Health Policy and Economics. 1999; 2 (2):59-71. Rec #: 1425
61. Lundsgaard, J. Competition and Efficiency in Publicly Funded Services. OECD Economic Studies N35. 2002:79-128. Rec #: 1422
62. Mason, J. and et al. Incorporating Economic Analysis in Evidence-Based Guidelines for Mental Health: The Profile Approach. Journal of Mental Health Policy and Economics. 1999; 2(1):13-19. Rec #: 1426
63. Mathewson, J. W.; Dyar, D.; Jones, F. D.; Sklansky, M. S.; Perry, J. C.; Michelfelder, E. C.; Cripe, L., and Kimball, T. R. Conversion to digital technology improves efficiency in the pediatric echocardiography laboratory. J Am Soc Echocardiogr. 2002 Dec; 15(12):1515-22. Rec #: 1171
64. Maxon, A. B.; White, K. R.; Behrens, T. R., and Vohr, B. R. Referral rates and cost efficiency in a universal newborn hearing screening program using transient evoked otoacoustic emissions. J Am Acad Audiol. 1995 Jul; 6(4):271-7. Rec #: 1367
65. Medical Group Management Association. Administrative simplification for medical group practices. Position Paper ed. 2005 Jun. Rec #: 1636
66. Nash, D. B.; Sullivan, S. D., and Mackowiak, J. Optimizing quality of care and cost effectiveness in treating allergic rhinitis in a managed care setting. Am J Manag Care. 2000 Jan; 6(1 Suppl):S3-15; quiz S19-20. Rec #: 1256
67. Neff, J. M. and et al. Profile of Medical Charges for Children by Health Status Group and Severity Level in a Washington State Health Plan. Health Services Research. 2004; 39(1):73-89. Rec #: 1414
68. Nishimuzu, M. and Page, J. M. Total factor productivity growth, technological progress and technical efficiency change: dimensions of productivity change in Yugoslavia 1965-1978. Economic J. 1982; 92:920-36. Rec #: 1629
69. Okunade, A. A. and Suraratdecha, C. Cost Efficiency, Factor Interchange, and Technical Progress in US Specialized Hospital Pharmacies. Health Economics. 1998; 7(4):363-71. Rec #: 1467
70. Ozcan, Y. A. and Shukla, R. K. The effect of a competency-based targeted staff development program on nursing productivity. J Nurs Staff Dev. 1993 Mar-1993 Apr 30; 9(2):78-84. Rec #: 1391
71. Puckett, R. P.; Connell, B. C.; Dahl, M. K.; Jackson, R., and McClusky, K. W. Practice paper of the American Dietetic Association: A systems approach to measuring productivity in health care foodservice operations. J Am Diet Assoc. 2005 Jan; 105(1):122-30. Rec #: 1109
72. Ravallion, M. On Measuring Aggregate 'Social Efficiency'. 2003(3166). Rec #: 1410
73. Redekop, W. K.; Koopmanschap, M. A.; Rutten, G. E.; Wolffenbuttel, B. H.; Stolk, R. P., and Niessen, L. W. Resource consumption and costs in Dutch patients with type 2 diabetes mellitus. Results from 29 general practices. Diabet Med. 2002 Mar; 19(3):246-53. Rec #: 1199
74. Reti, S. Improving outpatient department efficiency: a randomized controlled trial comparing hospital and general-practice telephone reminders. N Z Med J. 2003 Jun 6; 116(1175):U458. Rec #: 1146
75. Rex, D. K.; Imperiale, T. F.; Latinovich, D. R., and Bratcher, L. L. Impact of bowel preparation on efficiency and cost of colonoscopy. Am J Gastroenterol. 2002 Jul; 97(7):1696-700. Rec #: 1186
76. Roberts, J.; Browne, G. B.; Streiner, D.; Gafni, A.; Pallister, R.; Hoxby, H.; Jamieson, E., and Meichenbaum, D. The effectiveness and efficiency of health promotion in specialty clinic care. Med Care. 1995 Sep; 33(9):892-905. Rec #: 1363
77. Roos, L. L. and et al. Working More Productively: Tools for Administrative Data. Health Services Research. 2003; 38(5):1339-57. Rec #: 1415
78. Roos, P. and Lundstrom, M. An index approach for the measurement of patient benefits from surgery - illustrated in the case of cataract extraction. INFOR. 1998; 36(3):120-8. Rec #: 1598
F-17
79. Ruof, J.; Hulsemann, J. L.; Mittendorf, T.; Handelmann, S.; von der Schulenburg, J. M.; Zeidler, H., and Merkesdal, S. Costs of rheumatoid arthritis in Germany: a micro-costing approach based on healthcare payer's data sources. Ann Rheum Dis. 2003 Jun; 62(6):544-9. Rec #: 1149
80. Shah, S.; Vanclay, F., and Cooper, B. Efficiency, effectiveness, and duration of stroke rehabilitation. Stroke. 1990 Feb; 21(2):241-6. Rec #: 1119
81. Simar, L. Aspects of statistical analysis in DEA-type frontier models. J. Productivity Analysis. 1996; 7:177-85. Rec #: 1631
82. Simar, L. and Wilson, P. W. Statistical inference in nonparametric frontier models: the sate of the art. Journal of Productivity Analysis. 2000; 13:49-78_. Rec #: 1601
83. Singla, D. L.; Jasser, G., and Wilson, R. Effects of group education on patient satisfaction, knowledge gained, and cost-efficiency in an anticoagulation center. J Am Pharm Assoc (Wash). 2003 Mar-2003 Apr 30; 43(2):264-6. Rec #: 1157
84. Skillman, J. J.; Paras, C.; Rosen, M.; Davis, R. B.; Kim, D., and Kent, K. C. Improving cost efficiency on a vascular surgery service. Am J Surg. 2000 Mar; 179(3):197-200. Rec #: 1272
85. Smith, P. and Goddard, M. Performance measurement and operational research: a marriage made in heaven? Journal of the Operational Research Society. 2002; 53:247-55. Rec #: 1602
86. Soucat, A.; Levy-Bruhl, D.; De Bethune, X.; Gbedonou, P.; Lamarque, J. P.; Bangoura, O.; Camara, O.; Gandaho, T.; Ortiz, C.; Kaddar, M., and Knippenberg, R. Affordability, cost-effectiveness and efficiency of primary health care: the Bamako Initiative experience in Benin and Guinea. Int J Health Plann Manage. 1997 Jun; 12 Suppl 1:S81-108. Rec #: 1301
87. Stineman, M. G. and Granger, C. V. Outcome, efficiency, and time-trend pattern analyses for stroke rehabilitation. Am J Phys Med Rehabil. 1998 May-1998 Jun 30; 77(3):193-201. Rec #: 1319
88. Stinnett, A. A. and Paltiel, A. D. Mathematical Programming for the Efficient Allocation of Health Care Resources. Journal of Health Economics. 1996; 15( 5):641-53. Rec #: 1481
89. Tiano, J. J. and White, A. H. Effective training of nursing staff enhances hospital information system efficiency. J Contin Educ Nurs. 1990 Nov-1990 Dec 31; 21( 6):257-9. Rec #: 1143
90. Torstensen, T. A.; Ljunggren, A. E.; Meen, H. D.; Odland, E.; Mowinckel, P., and Geijerstam, S. Efficiency and costs of medical exercise therapy, conventional physiotherapy, and self-exercise in patients with chronic low back pain. A pragmatic, randomized, single-blinded, controlled trial with 1-year follow-up. Spine. 1998 Dec 1; 23(23):2616-24. Rec #: 1306
91. Tynan, A. J. and Lane, S. J. COPD: illness severity, resource utilisation and cost. Ir Med J. 2005 Feb; 98(2):41-2, 44-5. Rec #: 1103
92. Umiker, W. Value-added service in health care institutions. Health Care Superv. 1996 Dec; 15(2):55-62. Rec #: 1347
93. Wee, C. C.; Phillips, R. S.; Burstin, H. R.; Cook, E. F.; Puopolo, A. L.; Brennan, T. A., and Haas, J. S. Influence of financial productivity incentives on the use of preventive care. Am J Med. 2001 Feb 15; 110(3):181-7. Rec #: 1245
F-18
Rejected: Exact Duplicate
1. Executive Summary of the Health Care
Productivity Report. J Ambul Care Manage. 2001 Apr; 24(2):1-10. Rec #: 1232
2. Baily, M. N. and Garber, A. M. Health Care Productivity. Brookings Papers on Economic Activity. 1997; 0(0):143-202. Rec #: 1469
3. Conrad, D. A.; Sales, A.; Liang, S. Y.; Chaudhuri, A.; Maynard, C.; Pieper, L.; Weinstein, L.; Gans, D., and Piland, N. The impact of financial incentives on physician productivity in medical groups. Health Serv Res. 2002 Aug; 37(4):885-906. Rec #: 1179
4. DeLia, D.; Cantor, J. C.; Duck, E., and Blomqvist, A. Productivity vs Training in Primary Care: Analysis of Hospitals and Health Centers in New York City Economic Efficiency and QALY-Based Cost-Utility Analysis in Health Care. 2002(2000/07): 314-26. Rec #: 1051
5. Kessler, D. and McClellan, M. The Effects of Hospital Ownership on Medical Productivity. 2001(8537). Rec #: 1026
6. Kralewski, J. E.; Rich, E. C.; Feldman, R.; Dowd, B. E.; Bernhardt, T.; Johnson, C., and Gold, W. The effects of medical group practice and physician payment methods on costs of care. Health Serv Res. 2000 Aug; 35(3):591-613. Rec #: 1260

F-21
Rejected: Duplicate Data
1. Duggan, M. Does Contracting Out Increase the
Efficiency of Government Programs? Evidence from Medicaid HMOs. 2002(9091). Rec #: 1027
F-22
Excluded: At Detailed Review
1. Al-Shammari, M. A multi-criteria data
envelopment analysis model for measuring the productive efficiency of hospitals. International Journal of Operations and Production and Management. 1999; 19(9):879-90. Rec #: 1555
2. Arrow, K.; Baily, M. N.; Borsch-Supan, A.; Garber, A. M., and McKinsey Global Institute. Health Care Productivity. Los Angeles: McKinsey & Company, Inc.; 1996 Oct. Rec #: 1611
3. Athanassopoulos, A. D.; Gounaris, C., and Sissouras, A. A Descriptive Assessment of the Production and Cost Efficiency of General Hospitals in Greece. Health Care Management Science. 1999; 2(2):97-106. Rec #: 1448
4. Baicker, K.; Chandra, A.; Puig, J., and Ortun, V. The Productivity of Physician Specialization: Evidence from the Medicare Program Cost Efficiency in Primary Care Contracting: A Stochastic Frontier Cost Function Approach. 2004: 357-61. Rec #: 1018
5. Barros, P. P. Random output and hospital performance. Health Care Manag Sci. 2003 Nov; 6(4):219-27. Rec #: 1133
6. Beguin, C. Nonparametric frontier model as a tool for exploratory analysis of hospital stays. Methods Inf Med. 2001 Jul; 40(3):241-7. Rec #: 1523
7. Bhat, V. N. Health systems performance: a statewide analysis. J Health Care Finance. 2003 Summer; 29(4):77-86. Rec #: 1141
8. Biorn, Erik and et al. The Effect of Activity-Based Financing on Hospital Efficiency: A Panel Data Analysis of DEA Efficiency Scores 1992-2000. Health Care Management Science. 2003; 6(4):271-83. Rec #: 1031
9. Bjorkgren, M. A.; Fries, B. E.; Hakkinen, U., and Brommels, M. Case-mix adjustment and efficiency measurement. Scand J Public Health. 2004; 32(6):464-71. Rec #: 1063
10. Bjorkgren, M. A.; Hakkinen, U., and Linna, M. Measuring efficiency of long-term care units in Finland. Health Care Manag Sci. 2001 Sep; 4(3):193-200. Rec #: 1219
11. Blank, J. L. T. and Eggink, E. The Decomposition of Cost Efficiency: An Empirical Application of the Shadow Cost Function Model to Dutch General Hospitals. Health Care Management Science. 2004; 7(2):79-88. Rec #: 1412
12. Blank, J. L. T.; Eggink, E., and Merkies, A. H. Q. M. Between Bed and Budget: The Efficiency of Dutch Hospitals. Blank, Jos L. T.With contributions from C. A. Knox Lovell et al. Amsterdam; New York and Oxford: Elsevier Science North-Holland; 2000; pp. 85-119. Rec #: 1057
13. Bloor, K. and Maynard, A. Workforce productivity and incentive structures in the UK National Health Service. J Health Serv Res Policy. 2001 Apr; 6(2):105-13. Rec #: 1228
14. Bosmans, N. and Fecher, F. Performance of Belgian hospitals: a frontier approach. Health Econ. 1995 Sep-1995 Oct 31; 4(5):389-97. Rec #: 1362
15. Brownell, M. D. and Roos, N. P. Variation in length of stay as a measure of efficiency in Manitoba hospitals. CMAJ. 1995 Mar 1; 152(5):675-82. Rec #: 1370
16. Buck, D. The efficiency of the community dental service in England: a data envelopment analysis. Community Dent Oral Epidemiol. 2000 Aug; 28(4):274-80. Rec #: 1524
17. Busch, S. H.; Berndt, E. R., and Frank, R. G. Creating Price Indexes for Measuring Productivity in Mental Health Care. Garber, Alan M.Cambridge and London: MIT Press for the National Bureau of Economic Research; 2001; pp. 115-47. Rec #: 1040
18. Cellini, R.; Pignataro, G., and Rizzo, I. Competition and Efficiency in Health Care: An Analysis of the Italian Case. International Tax and Public Finance. 2000; 7(4-5):503-19. Rec #: 1439
F-23
19. Chandra, A. and Staiger, D. Testing a Roy Model with Productivity Spillovers: Evidence from the Treatment of Heart Attacks. 2004(10811). Rec #: 1409
20. Chang, H. H. Determinants of hospital efficiency: the case of central government-owned hospitals in Taiwan, Omega. The International Journal of Management Science. 1998; 26(2):307-17. Rec #: 1563
21. Chattopadhyay, S. and Heffley, D. Are For-Profit Nursing Homes More Efficient? Data Envelopment Analysis with a Case-Mix Constraint. Eastern Economic Journal. 1994; 20(2):171-86. Rec #: 1505
22. Chattopadhyay, S. and Ray, S. C. Technical, scale, and size efficiency in nursing home care: a nonparametric analysis of Connecticut homes. Health Econ. 1996 Jul-1996 Aug 31; 5(4):363-73. Rec #: 1350
23. Chu, H. L.; Liu, S. Z., and Romeis, J. C. Does the implementation of responsibility centers, total quality management, and physician fee programs improve hospital efficiency? Evidence from Taiwan hospitals. Med Care. 2002 Dec; 40(12):1223-37. Rec #: 1174
24. Crivelli, L. ; Filippini, M., and Lunati, D. Regulation, Ownership and Efficiency in the Swiss Nursing Home Industry. International Journal of Health Care Finance and Economics. 2002; 2(2):79-97. Rec #: 1405
25. Dalmau-Matarrodona, E. and Puig-Junoy, J. Market Structure and Hospital Efficiency: Evaluating Potential Effects of Deregulation in a National Health Service. Review of Industrial Organization. 1998; 13(4):447-66. Rec #: 1464
26. Dismuke, C. and Sena, V. Is there a trade-off between qualiyt and productivity? The case of diagnostic technologies in Portugal. Annals of Operation Research. 2001; 107:101-16. Rec #: 1570
27. Dismuke, C. E. and Sena, V. Has DRG Payment Influenced the Technical Efficiency and Productivity of Diagnostic Technologies in Portuguese Public Hospitals? An Empirical Analysis Using Parametric and Non-Parametric Methods. Health Care Management Science. 1999; 2(2):107-16. Rec #: 1435
28. Duck, E.; DeLia, D., and Cantor, J. C. Primary care productivity and the health care safety net in New York City. J Ambul Care Manage. 2001 Jan; 24(1):1-14. Rec #: 1239
29. Erlandsen, E. and Forsund, F. R. Efficiency in the Provision of Municipal Nursing- and Home-Care Services: The Norwegian Experience. Fox, Kevin J.Studies in Productivity and Efficiency. Boston; Dordrecht and London: Kluwer Academic; 2002; pp. 273-300. Rec #: 1021
30. Ersoy, K.; Kavuncubasi, S.; Ozcan, Y. A., and Harris, J. M. 2nd. Technical efficiencies of Turkish hospitals: DEA approach. J Med Syst. 1997 Apr; 21(2):67-74. Rec #: 1336
31. Evans, D. B.; Tandon, A.; Murray, C. J., and Lauer, J. A. Comparative efficiency of national health systems: cross national econometric analysis. BMJ. 2001 Aug 11; 323(7308):307-10. Rec #: 1222
32. Fare, R.; Grosskopf, S.; Lindgren, B., and Poullier, J. P. Productivity growth in health-care delivery. Med Care. 1997 Apr; 35(4):354-66. Rec #: 1342
33. Fare, R.; Grosskopf, S.; Lindgren, B., and Roos, P. Productivity and quality changes in Swedish pharmacies. International Journal of Porduction Economics. 1995; 39:137-47. Rec #: 1572
34. ---. Productivity changes in Swedish pharmacies 1980-1989: a non-parametric Malmquist approach. The Journal of Productivity Analysis. 1992; 3:85-101. Rec #: 1571
35. Fare, R.; Grosskopf, S., and Roos, P. Integrating consumer satisfaction into productivity indexes. Fox, K. J. Efficiency in the Public Sector. Boston: Kluwer; 2002. Rec #: 1573
36. Farsi, M. and Filippini, M. An Empirical Analysis of Cost Efficiency in Non-profit and Public Nursing Homes. Annals of Public and Cooperative Economics. 2004; 75(3):339-65. Rec #: 1017
37. Fizel, J. L. and Nunnikhoven, T. S. The Efficiency of Nursing Home Chains. Applied Economics. 1993; 25(1):49-55. Rec #: 1508
F-24
38. ---. Technical Efficiency of For-profit and Non-profit Nursing Homes. Managerial and Decision Economics. 1992; 13(5):429-39. Rec #: 1507
39. Fried, H. O. ; Lovell, C. A. K.; Schmidt, S. S., and Yaisawarng, S. Accounting for environmental effects and statistical noise in data envelopment analysis. Journal of Productivity Analysis. 2002; 17:157-74. Rec #: 1576
40. Fried, H. O. ; Schmidt, S. S., and Yaisawarng, S. Incorporating the Operating Environment into a Nonparametric Measure of Technical Efficiency. Journal of Productivity Analysis. 1999; 12(3):249-67. Rec #: 1458
41. ---. Productive, scale and scope efficiencies in US hospital-based nursing homes. INFOR. 1998; 36(3):103-19. Rec #: 1577
42. Gerdtham, U. G. and Lothgren, M. Health System Effects on Cost Efficiency in the OECD Countries. Applied Economics. 2001; 33(5):643-47. Rec #: 1441
43. Gerdtham, U. G.; Lothgren, M.; Tambour, M., and Rehnberg, C. Internal markets and health care efficiency: a multiple-output stochastic frontier analysis. Health Econ. 1999 Mar; 8(2):151-64. Rec #: 1297
44. Gerdtham, U. G.; Rehnberg, C., and Tambour, M. The Impact of Internal Markets on Health Care Efficiency: Evidence from Health Care Reforms in Sweden. Applied Economics. 1999; 31(8 ):935-45. Rec #: 1459
45. Giokas, D. I. Greek hospitals: how well their resources are used. The International Journal of Management Science. 2001; 29:73-83. Rec #: 1578
46. Giuffrida, A. Productivity and Efficiency Changes in Primary Care: A Malmquist Index Approach. Health Care Management Science. 1999; 2 (1):11-26. Rec #: 1436
47. Giuffrida, A. and Gravelle, H. Measuring performances in primary care: econometric analysis and DEA. Applied Economics. 2001; 33:163-75. Rec #: 1579
48. Giuffrida, A.; Gravelle, H., and Sutton, M. Efficiency and Administrative Costs in Primary Care. Journal of Health Economics. 2000; 19(6):983-1006. Rec #: 1446
49. Gonzalez Lopez-Valcarcel, B. and Barber Perez, P. Changes in the Efficiency of Spanish Public Hospitals after the Introduction of Program-Contracts. Investigaciones Economicas. 1996; 20(3):377-402. Rec #: 1479
50. Gravelle, H.; Jacobs, R.; Jones, A. M., and Street, A. Comparing the efficiency of national health systems: a sensitivity analysis of the WHO approach. Appl Health Econ Health Policy. 2003; 2(3):141-7. Rec #: 1074
51. Greene, W. Distinguishing between heterogeneity and inefficiency: stochastic frontier analysis of the World Health Organization's panel data on national health care systems. Health Econ. 2004 Oct; 13(10):959-80. Rec #: 1067
52. Gruca, T. S. and Nath, D. The Technical Efficiency of Hospitals under a Single Payer System: The Case of Ontario Community Hospitals. Health Care Management Science. 2001; 4(2):91-101. Rec #: 1036
53. Grytten, J. and Dalen, D. M. Too Many for Too Few? Efficiency among Dentists Working in Private Practice in Norway. Journal of Health Economics. 1997; 16(4):483-97. Rec #: 1474
54. Grytten, J. and Rongen, G. Efficiency in provision of public dental services in Norway. Community Dent Oral Epidemiol. 2000 Jun; 28(3):170-6. Rec #: 1271
55. Harper, J.; Hauck, K., and Street, A. Analysis of Costs and Efficiency in General Surgery Specialties in the United Kingdom. HEPAC: Health Economics in Prevention and Care. 2001; 2(4):150-57. Rec #: 1002
56. Heshmati, A. Productivity Measurement in Swedish Departments of Gynecology and Obstetrics. Structural Change and Economic Dynamics. 2002; 13(3):315-36. Rec #: 1052
57. Hicks, L. L.; Rantz, M. J.; Petroski, G. F., and Mukamel, D. B. Nursing home costs and quality of care outcomes. Nurs Econ. 2004 Jul-2004 Aug 31; 22(4):178-92, 175. Rec #: 1069
58. Hofler, R. A. and Rungeling, B. U S Nursing Homes: Are They Cost Efficient? Economics Letters. 1994; 44(3):301-05. Rec #: 1504
F-25
59. Hofmarcher, M. M.; Paterson, I., and Riedel, M. Measuring Hospital Efficiency in Austria--A DEA Approach. Health Care Management Science. 2002; 5(1):7-14. Rec #: 1417
60. Hollingsworth, B. Non-parametric and parametric applications measuring efficiency in health care. Health Care Manag Sci. 2003 Nov; 6(4):203-18. Rec #: 1076
61. Hollingsworth, B.; Dawson, P. J., and Maniadakis, N. Efficiency measurement of health care: a review of non-parametric methods and applications. Health Care Manag Sci. 1999 Jul; 2(3):161-72. Rec #: 1262
62. Hollingsworth, B.; Harris, A., and Gospodarevskaya, E. The efficiency of immunization of infants by local government. Applied Economics. 2002; 34:2341-5. Rec #: 1584
63. Hollingsworth, B. and Parkin, D. Efficiency and productivity change in the English National Health Service: can data envelopment analysis provide a robust and useful measure? J Health Serv Res Policy. 2003 Oct; 8(4):230-6. Rec #: 1078
64. ---. The efficiency of Scottish acute hospitals: an application of data envelopment analysis. IMA J Math Appl Med Biol. 1995 Sep-1995 Dec 31; 12(3-4):161-73. Rec #: 1532
65. ---. The efficiency of the delivery of neonatal care in the UK. J Public Health Med. 2001 Mar; 23(1):47-50. Rec #: 1231
66. Hollingsworth, B. and Wildman, J. The efficiency of health production: re-estimating the WHO panel data using parametric and non-parametric approaches to provide additional information. Health Econ. 2003 Jun; 12(6):493-504. Rec #: 1083
67. Hugo, M. Comparative efficiency ratings between public and private acute inpatient facilities. Aust N Z J Psychiatry. 2000 Aug; 34(4):651-7. Rec #: 1261
68. Jacobs, R. Alternative Methods to Examine Hospital Efficiency: Data Envelopment Analysis and Stochastic Frontier Analysis. Health Care Management Science. 2001; 4(2):103-15. Rec #: 1418
69. Jacobs, R. and Dawson, D. Hospital efficiency targets. Health Econ. 2003 Aug; 12(8):669-84. Rec #: 1142
70. Jacobs, R.; Dawson, D.; Miller, R. D. Jr., and Frech, H. E. III. Hospital Efficiency Targets The Productivity of Health Care and Pharmaceuticals: Quality of Life, Cause of Death and the Role of Obesity. 2003(02/12): 669-84. Rec #: 1038
71. Jayasuriya, R. and Wodon, Q. Measuring and Explaining Country Efficiency in Improving Health and Education Indicators. Jayasuriya, Ruwan and Wodon, QuentinWorking Paper, no. 9. Washington, D.C.: World Bank; 2003; pp. 5-16. Rec #: 1001
72. Jimenez, R.; Lopez, L.; Dominguez, D., and Farinas, H. Difference between observed and predicted length of stay as an indicator of inpatient care inefficiency. Int J Qual Health Care. 1999 Oct; 11(5):375-84. Rec #: 1286
73. John, E.; Hind, N.; Roberts, V., and Roberts, S. Cost efficiency of neonatal nurseries: the significance of unit size. Aust J Public Health. 1991 Sep; 15(3):242-4. Rec #: 1403
74. Johnson, S. C. and Lahiri, K. A Panel Data Analysis of Productive Efficiency in Freestanding Health Clinics. Empirical Economics. 1992; 17(1):141-51. Rec #: 1509
75. Johnston, K. and Gerard, K. Assessing efficiency in the UK breast screening programme: does size of screening unit make a difference? Health Policy. 2001 Apr; 56(1):21-32. Rec #: 1533
76. Kerr, C. A.; Glass, J. C.; McCallion, G. M., and McKillop, D. G. Best-practice measures of resource utilization for hospitals: a useful complement in performance assessment. Public Administration. 1999; 77(3):639-50. Rec #: 1585
77. Kirigia, J. M.; Emrouznejad, A.; Sambo, L. G.; Munguti, N., and Liambila, W. Using data envelopment analysis to measure the technical efficiency of public health centers in Kenya. J Med Syst. 2004 Apr; 28(2):155-66. Rec #: 1072
78. Kjekshus, L. E. and Hagen, T. P. Ring fencing of elective surgery: does it affect hospital efficiency? Health Serv Manage Res. 2005 Aug; 18(3):186-97. Rec #: 1096
F-26
79. Kjellstrand, C. M.; Kovithavongs, C., and Szabo, E. On the success, cost and efficiency of modern medicine: an international comparison. J Intern Med. 1998 Jan; 243(1):3-14. Rec #: 1328
80. Kjerstad, E. Prospective funding of general hospitals in Norway--incentives for higher production? Int J Health Care Finance Econ. 2003 Dec; 3(4):231-51. Rec #: 1135
81. Kleinsorge, I. K. and Karney, D. F. Management of nursing homes using data envelopment analysis. Socioecon Plann Sci. 1992; 26(1):57-71. Rec #: 1534
82. Knox, K. J.; Blankmeyer, E. C., and Stutzman, J. R. The Efficiency of Nursing Home Chains and the Implications of Nonprofit Status: A Comment. Journal of Real Estate Portfolio Management. 2001; 7(2):177-82. Rec #: 1429
83. Knox, K. J.; Blankmeyer, E. C., and Stutzman, J. R. Organizational Efficiency and Quality in Texas Nursing Facilities. Health Care Management Science. 2003; 6(3):175-88. Rec #: 1035
84. Knox, K. J.; Blankmeyer, E. C., and Stutzman, J. R. Relative Economic Efficiency in Texas Nursing Facilities: A Profit Function Analysis. Journal of Economics and Finance. 1999; 23(3):199-213. Rec #: 1456
85. Kontodimopoulos, N. and Niakas, D. Efficiency measurement of hemodialysis units in Greece with data envelopment analysis. Health Policy. 2005 Feb; 71(2):195-204. Rec #: 1110
86. Kooreman, P. Nursing Home Care in The Netherlands: A Nonparametric Efficiency Analysis. Journal of Health Economics. 1994; 13(3):301-16. Rec #: 1498
87. Laine, J.; Finne-Soveri, U. H.; Bjorkgren, M.; Linna, M.; Noro, A., and Hakkinen, U. The association between quality of care and technical efficiency in long-term care. Int J Qual Health Care. 2005 Jun; 17(3):259-67. Rec #: 1061
88. Laine, J.; Linna, M.; Hakkinen, U., and Noro, A. Measuring the productive efficiency and clinical quality of institutional long-term care for the elderly. Health Econ. 2005 Mar; 14(3):245-56. Rec #: 1068
89. Laine, J.; Linna, M.; Noro, A., and Hakkinen, U. The cost efficiency and clinical quality of institutional long-term care for the elderly. Health Care Manag Sci. 2005 May; 8(2):149-56. Rec #: 1060
90. Li, J. and Hawkins, J. A system for evaluating inpatient care cost-efficiency in a hospital. Medinfo. 2001; 10(Pt 2):1171-4. Rec #: 1215
91. ---. A system for evaluating inpatient care cost-efficiency in hospital. Proc AMIA Symp. 2001; 369-72. Rec #: 1205
92. Lin, H. C.; Xirasagar, S., and Tang, C. H. Costs per discharge and hospital ownership under prospective payment and cost-based reimbursement systems in Taiwan. Health Policy Plan. 2004 May; 19(3):166-76. Rec #: 1129
93. Linna, M. Measuring hospital cost efficiency with panel data models. Health Econ. 1998 Aug; 7(5):415-27. Rec #: 1313
94. Linna, M. and Hakkinen, U. A comparative application of econometric frontier and DEA methods for assessing cost efficiency of Finnish hospitals. Dev Health Econ Public Policy. 1998; 6:169-87. Rec #: 1282
95. Linna, M. and Hakkinen, U. A comparative application of econometric frontier and DEA methods for assessing cost efficiency of Finnish hospital. Zweifel, P. Health, the Medical Profession and Regulation. Boston: Kluwer; 1998; pp. 169-87. Rec #: 1587
96. Linna, M.; Hakkinen, U., and Linnakko, E. An econometric study of costs of teaching and research in Finnish hospitals. Health Econ. 1998 Jun; 7(4):291-305. Rec #: 1615
97. Linna, M.; Nordblad, A., and Koivu, M. Technical and cost efficiency of oral health care provision in Finnish health centres. Soc Sci Med. 2003 Jan; 56(2):343-53. Rec #: 1170
98. Lothgren, M. and Tambour, M. Productivity and customer satisfaction in Swedish pharmacies: a DEA network model. European Journal of Operational Research. 1999; 115:449-58. Rec #: 1588
F-27
99. Lundstrom, M.; Roos, P.; Brege, K. G.; Floren, I.; Stenevi, U., and Thorburn, W. Cataract surgery and effectiveness. 2. An index approach for the measurement of output and efficiency of cataract surgery at different surgery departments. Acta Ophthalmol Scand. 2001 Apr; 79(2):147-53. Rec #: 1234
100. Luoma, K. and et al. Financial Incentives and Productive Efficiency in Finnish Health Centres. Health Economics. 1996; 5(5):435-45 Available From Publisher's URL. Rec #: 1480
101. MacLean, M. B. and Mix, P. Measuring hospital productivity and output: the omission of outpatient services. Health Rep. 1991; 3(3):229-44. Rec #: 1144
102. Magnussen, J. Efficiency measurement and the operationalization of hospital production. Health Serv Res. 1996 Apr; 31(1):21-37. Rec #: 1351
103. Maniadakis, N.; Hollingsworth, B., and Thanassoulis, E. The Impact of the Internal Market on Hospital Efficiency, Productivity and Service Quality. Health Care Management Science. 1999; 2(2):75-85. Rec #: 1449
104. Maniadakis, N. and Thanassoulis, E. Assessing Productivity Changes in UK Hospitals Reflecting Technology and Input Prices. Applied Economics. 2000; 32(12):1575-89. Rec #: 1433
105. Martens, P. J.; Stewart, D. K.; Mitchell, L., and Black, C. Assessing the performance of rural hospitals. Healthc Manage Forum. 2002 Winter; Suppl:27-34. Rec #: 1160
106. Martineau, T.; Gong, Y., and Tang, S. Changing medical doctor productivity and its affecting factors in rural China. Int J Health Plann Manage. 2004 Apr-2004 Jun 30; 19(2):101-11. Rec #: 1122
107. McCallion, G. and et al. Investigating Productivity Change and Hospital Size: A Nonparametric Frontier Approach. Applied Economics. 2000; 32(2):161-74. Rec #: 1442
108. McCallion, G. M.; McKillop, D. G.; Glass, J. C., and Kerr, C. Rationalizing Northern Ireland hospital services towards larger providers: best practice efficiency studies and current policy. Public Money and Management. 1999 Apr; 27-32. Rec #: 1539
109. McKillop, D. G. and et al. Efficiency in Northern Ireland Hospitals: A Non-parametric Analysis . Economic and Social Review. 1999; 30(2):175-96. Rec #: 1461
110. McPake, B.; Yepes, F. J.; Lake, S., and Sanchez, L. H. Is the Colombian health system reform improving the performance of public hospitals in Bogota? Health Policy Plan. 2003 Jun; 18(2):182-94. Rec #: 1150
111. Miller, R. and Frech, T. The Productivity of Health Care and Pharmaceuticals: Quality of Life, Cause. 2002. Rec #: 1029
112. Nordyke, R. J. Determinants of PHC productivity and resource utilization: a comparison of public and private physicians in Macedonia. Health Policy. 2002 Apr; 60(1):67-96. Rec #: 1201
113. Nyman, J. A. and Bricker, D. L. Profit incentives and technical efficiency in the production of nursing home care. The Reveiw of Economics and Statistics. 1989; 586-94. Rec #: 1590
114. Nyman, J. A.; Bricker, D. L., and Link, D. Technical efficiency in nursing homes. Med Care. 1990 Jun; 28(6):541-51. Rec #: 1538
115. Olesen, O. B. and Petersen, N. C. The Use of Data Envelopment Analysis with Probabilistic Assurance Regions for Measuring Hospital Efficiency. Journal of Productivity Analysis. 2002; 17(1-2):83-109. Rec #: 1059
116. Ozcan, Y. A.; Wogen, S. E., and Mau, L. W. Efficiency evaluation of skilled nursing facilities. J Med Syst. 1998 Aug; 22(4):211-24. Rec #: 1541
117. Parkin, D. and Hollingsworth, B. Measuring Production Efficiency of Acute Hospitals in Scotland, 1991-94: Validity Issues in Data Envelopment Analysis. Applied Economics. 1997; 29 (11):1425-33. Rec #: 1470

F-28
118. Paul, C. J. M. Productive Structure and Efficiency of Public Hospitals. Fox, Kevin J.Studies in Productivity and Efficiency. Boston; Dordrecht and London: Kluwer Academic; 2002; pp. 219-48. Rec #: 1022
119. Philipson, T. and Lakdawalla, D. Medical Care Output and Productivity in the Nonprofit Sector. Cutler, David M. and Berndt, Ernst R.NBER Studies in Income and Wealth, vol. 62. Chicago and London: University of Chicago Press; 2001; pp. 119-37. Rec #: 1043
120. Pietila, T.; Sintonen, H.; Pietila, I.; Widstrom, E.; Varrela, J., and Alanen, P. Cost and productivity analysis of orthodontic care in Finland. Community Dent Oral Epidemiol. 1998 Aug; 26(4):283-8. Rec #: 1312
121. Pina, V. and Torres, L. Evaluating the efficiency of nonprofit organizations: an application of data envelopment analysis to the public health service. Financial Accountability and Management. 1992; 8(3):213-24. Rec #: 1594
122. Pink, G. H.; Murray, M. A., and McKillop, I. Hospital efficiency and patient satisfaction. Health Serv Manage Res. 2003 Feb; 16(1):24-38. Rec #: 1161
123. Polyzos, N. M. Striving towards efficiency in the Greek hospitals by reviewing case mix classifications. Health Policy. 2002 Sep; 61(3):305-28. Rec #: 1193
124. Prior, D. Technical Efficiency and Scope Economies in Hospitals. Applied Economics. 1996; 28(10):1295-1301. Rec #: 1485
125. Prior, D. and Sola, M. Technical efficiency and economies of diversification in health care. Health Care Manag Sci. 2000 Sep; 3(4):299-307. Rec #: 1251
126. Puig, J. and Ortun, V. Cost Efficiency in Primary Care Contracting: A Stochastic Frontier Cost Function Approach. 2003. Rec #: 1411
127. Puig-Junoy, J. Measuring health production performance in the eOECD. Applied Economics Letters. 1998; 5:255-9. Rec #: 1595
128. Puig-Junoy, J. Technical efficiency in the clinical management of critically ill patients. Health Econ. 1998 May; 7(3):263-77. Rec #: 1320
129. Puig-Junoy, J. and Ortun, V. Cost efficiency in primary care contracting: a stochastic frontier cost function approach. Health Econ. 2004 Dec; 13(12):1149-65. Rec #: 1011
130. Rannan-Eliya, R. P. and Somanathan, A. The Bangladesh Health Facility Efficiency Study. Yazbeck, Abdo S. and Peters, David H.Human Development Network Health, Nutrition, and Population Series. Washington, D.C.: World Bank; 2003; pp. 195-225. Rec #: 1404
131. Retzlaff-Roberts, D.; Chang, C. F., and Rubin, R. M. Technical efficiency in the use of health care resources: a comparison of OECD countries. Health Policy. 2004 Jul; 69(1):55-72. Rec #: 1066
132. Richardson, J.; Wildman, J., and Robertson, I. K. A critique of the World Health Organisation's evaluation of health system performance. Health Econ. 2003 May; 12(5):355-66. Rec #: 1153
133. Ridderstolpe, L.; Johansson, A.; Skau, T.; Rutberg, H., and Ahlfeldt, H. Clinical process analysis and activity-based costing at a heart center. J Med Syst. 2002 Aug; 26(4):309-22. Rec #: 1189
134. Rieder, M. J.; Hanmer, S. J., and Haslam, R. H. Age- and gender-related differences in clinical productivity among Canadian pediatricians. Pediatrics. 1990 Feb; 85(2):144-9. Rec #: 1118
135. Rosko, M. D.; Chilingerian, J. A.; Zinn, J. S., and Aaronson, W. E. The effects of ownership, operating environment, and strategic choices on nursing home efficiency. Med Care. 1995 Oct; 33(10):1001-21. Rec #: 1360
136. Routh, S.; Thwin, A. A.; Barb, N., and Begum, A. Cost efficiency in maternal and child health and family planning service delivery in Bangladesh: implications for NGOs. Health Policy Plan. 2004 Jan; 19(1):11-21. Rec #: 1134
137. Sahin, I. and Ozcan, Y. A. Public sector hospital efficiency for provincial markets in Turkey. J Med Syst. 2000 Dec; 24(6):307-20. Rec #: 1545
138. Salinas-Jimenez, J. and Smith, P. Data envelopment analysis applied to quality in primary health care. Annals of Operations Research . 1996; 67(141-61). Rec #: 1599
F-29
139. Sarkis, J. and Talluri, S. Efficiency measurement of hospitals: issues and extensions. International Journal of Operations and Production Management. 2002; 22(3):306-13. Rec #: 1600
140. Sexton, T. R.; Leiken, A. M.; Sleeper, S., and Coburn, A. F. The impact of prospective reimbursement on nursing home efficiency. Med Care. 1989 Feb; 27(2):154-63. Rec #: 1548
141. Soderlund, N.; Csaba, I.; Gray, A.; Milne, R., and Raftery, J. Impact of the NHS reforms on English hospital productivity: an analysis of the first three years. BMJ. 1997 Nov 1; 315(7116):1126-9. Rec #: 1332
142. Sommersguter-Reichmann, M. The impact of the Austrian hospital financing reform on hospital productivity: empirical evidence on efficiency and technology changes using a non-parametric input-based Malmquist approach. Health Care Manag Sci. 2000 Sep; 3(4):309-21. Rec #: 1037
143. Staat, M. The Effect of Sample Size on the Mean Efficiency in DEA: Comment. Journal of Productivity Analysis. 2001; 15(2):129-37. Rec #: 1444
144. Staat, M. The Efficiency of Treatment Strategies of General Practitioners: A Malmquist Index Approach. European Journal of Health Economics. 2003; 4(3):232-38. Rec #: 1003
145. Steinmann, L.; Dittrich, G.; Karmann, A., and Zweifel, P. Measuring and comparing the (in)efficiency of German and Swiss hospitals. Eur J Health Econ. 2004 Oct; 5(3):216-26. Rec #: 1064
146. Street, A. How much confidence should we place in efficiency estimates? Health Econ. 2003 Nov; 12(11):895-907. Rec #: 1077
147. Street, A.; Carr-Hill, R., and Posnett, J. Is hospital performance related to expenditure on management? J Health Serv Res Policy. 1999 Jan; 4(1):16-23; discussion 24-6. Rec #: 1296
148. Street, A. and Jacobs, R. Relative performance evaluation of the English acute hospital sector. Applied Economics. 2002; 34(9):1109-19. Rec #: 1619
149. Suraratdecha, C. and Okunade, A. A. Measuring operational efficiency in a health care system: A case study from Thailand. Health Policy. 2005 Sep 5. Rec #: 1032
150. Tambour, M. The impact of health care policy initiatives on productivity. Health Econ. 1997 Jan-1997 Feb 28; 6(1):57-70. Rec #: 1345
151. Tsai, L. H. ; Ozcan, Y. A., and Wogen, S. E. A variable returns to scale data envelopment analysis model for the joint determination of efficiencies with an example of the UK health service. European Journal of Operational Research. 2002; 141:21-38. Rec #: 1605
152. Vitaliano, D. F. and Toren, M. Cost and Efficiency in Nursing Homes: A Stochastic Frontier Approach. Journal of Health Economics. 1994; 13(3 ):281-300. Rec #: 1499
153. Wagstaff, A. Estimating efficiency in the hospital sector: a comparison of three statistical cost frontier models. Applied Economics. 1989; 21:659-72. Rec #: 1607
154. Wagstaff, A. and Lopez, g. Hospital costs in Catlonia: a stochastic frontier analysis. Applied Economics Letters. 1996; 3:471-4. Rec #: 1608
155. Wan, T. T.; Hsu, N.; Feng, R. C.; Ma, A.; Pan, S. A., and Chou, M. C. Technical efficiency of nursing units in a tertiary care hospital in Taiwan. J Med Syst. 2002 Feb; 26(1):21-7. Rec #: 1550
156. Wang, S. C.; Tsai, C. C.; Huang, S. T., and Hong, Y. J. Measuring the efficiency of dental departments in medical centers: a nonparametric analysis approach. Kaohsiung J Med Sci. 2002 Dec; 18(12):610-21. Rec #: 1085
157. Webster, R. ; Kennedy, S., and Johnson, L. Comparing Techniques for Measuring the Efficiency of Australian Private Hospitals. Blank, Jos L. T.With contributions from C. A. Knox Lovell et al. Amsterdam; New York and Oxford: Elsevier Science North-Holland; 2000; pp. 57-83. Rec #: 1058
158. Weinbroum, A. A.; Ekstein, P., and Ezri, T. Efficiency of the operating room suite. Am J Surg. 2003 Mar; 185(3):244-50. Rec #: 1162

F-30
159. Zavras, A. I.; Tsakos, G.; Economou, C., and Kyriopoulos, J. Using DEA to evaluate efficiency and formulate policy within a Greek national primary health care network. Data Envelopment Analysis. J Med Syst. 2002 Aug; 26(4):285-92. Rec #: 1553
160. Zere, E.; McIntyre, D., and Addison, T. Technical Efficiency and Productivity of Public Sector Hospitals in Three South African Provinces . South African Journal of Economics. 2001; 69(2):336-58. Rec #: 1431


Appendix G Evidence Tables

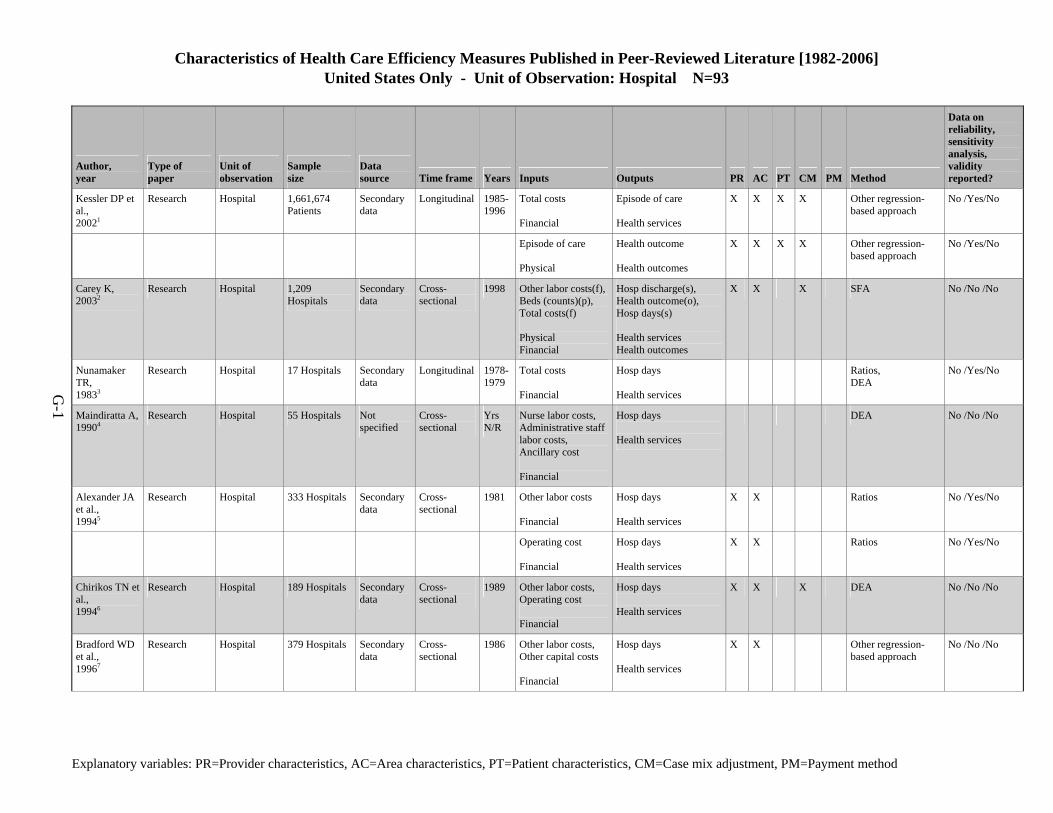
Characteristics of Health Care Efficiency Measures Published in Peer-Reviewed Literature [1982-2006] United States Only - Unit of Observation: Hospital N=93
Explanatory variables: PR=Provider characteristics, AC=Area characteristics, PT=Patient characteristics, CM=Case mix adjustment, PM=Payment method
G-1
Author, year
Type of paper
Unit of observation
Sample size
Data source Time frame Years Inputs Outputs PR AC PT CM PM Method
Data on reliability, sensitivity analysis, validity reported?
Kessler DP et al., 20021
Research Hospital 1,661,674 Patients
Secondary data
Longitudinal 1985-1996
Total costs Financial
Episode of care Health services
X X X X Other regression-based approach
No /Yes/No
Episode of care Physical
Health outcome Health outcomes
X X X X Other regression-based approach
No /Yes/No
Carey K, 20032
Research Hospital 1,209 Hospitals
Secondary data
Cross- sectional
1998 Other labor costs(f),Beds (counts)(p), Total costs(f) Physical Financial
Hosp discharge(s), Health outcome(o), Hosp days(s) Health services Health outcomes
X X X SFA No /No /No
Nunamaker TR, 19833
Research Hospital 17 Hospitals Secondary data
Longitudinal 1978-1979
Total costs Financial
Hosp days Health services
Ratios, DEA
No /Yes/No
Maindiratta A, 19904
Research Hospital 55 Hospitals Not specified
Cross- sectional
Yrs N/R
Nurse labor costs, Administrative staff labor costs, Ancillary cost Financial
Hosp days Health services
DEA No /No /No
Alexander JA et al., 19945
Research Hospital 333 Hospitals Secondary data
Cross- sectional
1981 Other labor costs Financial
Hosp days Health services
X X Ratios No /Yes/No
Operating cost Financial
Hosp days Health services
X X Ratios No /Yes/No
Chirikos TN et al., 19946
Research Hospital 189 Hospitals Secondary data
Cross- sectional
1989 Other labor costs, Operating cost Financial
Hosp days Health services
X X X DEA No /No /No
Bradford WD et al., 19967
Research Hospital 379 Hospitals Secondary data
Cross- sectional
1986 Other labor costs, Other capital costs Financial
Hosp days Health services
X X Other regression-based approach
No /No /No
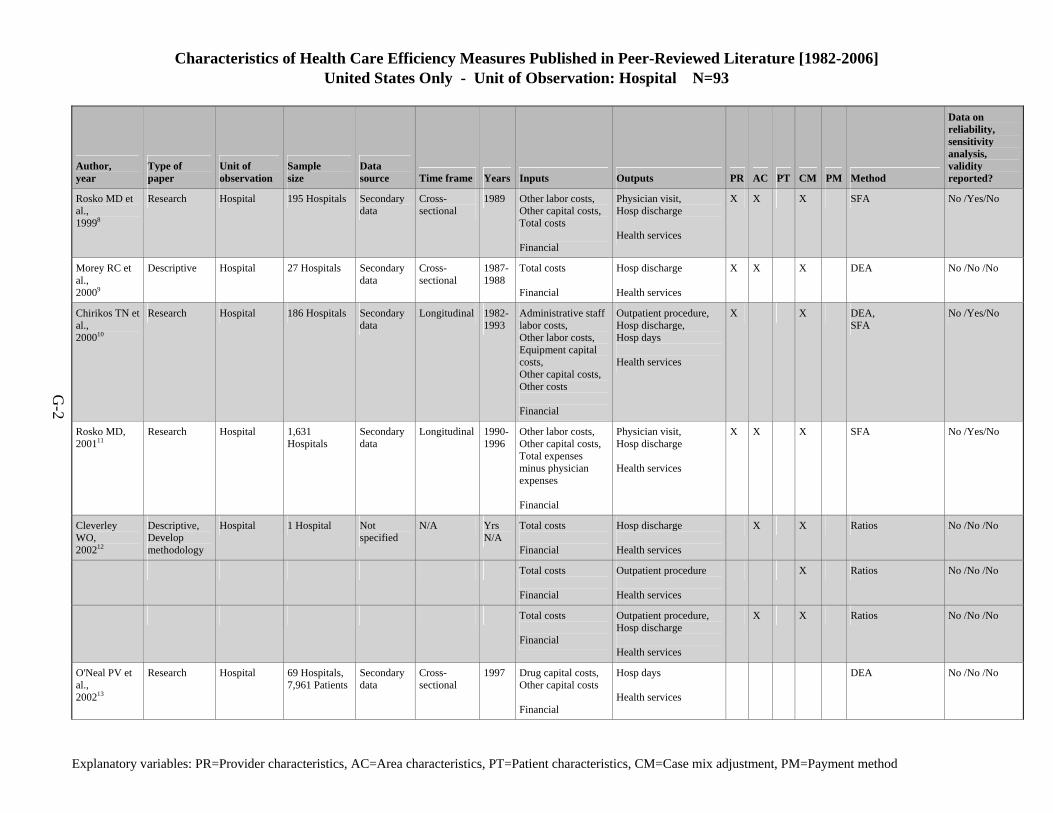
Characteristics of Health Care Efficiency Measures Published in Peer-Reviewed Literature [1982-2006] United States Only - Unit of Observation: Hospital N=93
Explanatory variables: PR=Provider characteristics, AC=Area characteristics, PT=Patient characteristics, CM=Case mix adjustment, PM=Payment method
G-2
Author, year
Type of paper
Unit of observation
Sample size
Data source Time frame Years Inputs Outputs PR AC PT CM PM Method
Data on reliability, sensitivity analysis, validity reported?
Rosko MD et al., 19998
Research Hospital 195 Hospitals Secondary data
Cross- sectional
1989 Other labor costs, Other capital costs, Total costs Financial
Physician visit, Hosp discharge Health services
X X X SFA No /Yes/No
Morey RC et al., 20009
Descriptive Hospital 27 Hospitals Secondary data
Cross- sectional
1987-1988
Total costs Financial
Hosp discharge Health services
X X X DEA No /No /No
Chirikos TN et al., 200010
Research Hospital 186 Hospitals Secondary data
Longitudinal 1982-1993
Administrative staff labor costs, Other labor costs, Equipment capital costs, Other capital costs, Other costs Financial
Outpatient procedure, Hosp discharge, Hosp days Health services
X X DEA, SFA
No /Yes/No
Rosko MD, 200111
Research Hospital 1,631 Hospitals
Secondary data
Longitudinal 1990-1996
Other labor costs, Other capital costs, Total expenses minus physician expenses Financial
Physician visit, Hosp discharge Health services
X X X SFA No /Yes/No
Cleverley WO, 200212
Descriptive, Develop methodology
Hospital 1 Hospital Not specified
N/A Yrs N/A
Total costs Financial
Hosp discharge Health services
X X Ratios No /No /No
Total costs Financial
Outpatient procedure Health services
X Ratios No /No /No
Total costs Financial
Outpatient procedure, Hosp discharge Health services
X X Ratios No /No /No
O'Neal PV et al., 200213
Research Hospital 69 Hospitals, 7,961 Patients
Secondary data
Cross- sectional
1997 Drug capital costs, Other capital costs Financial
Hosp days Health services
DEA No /No /No
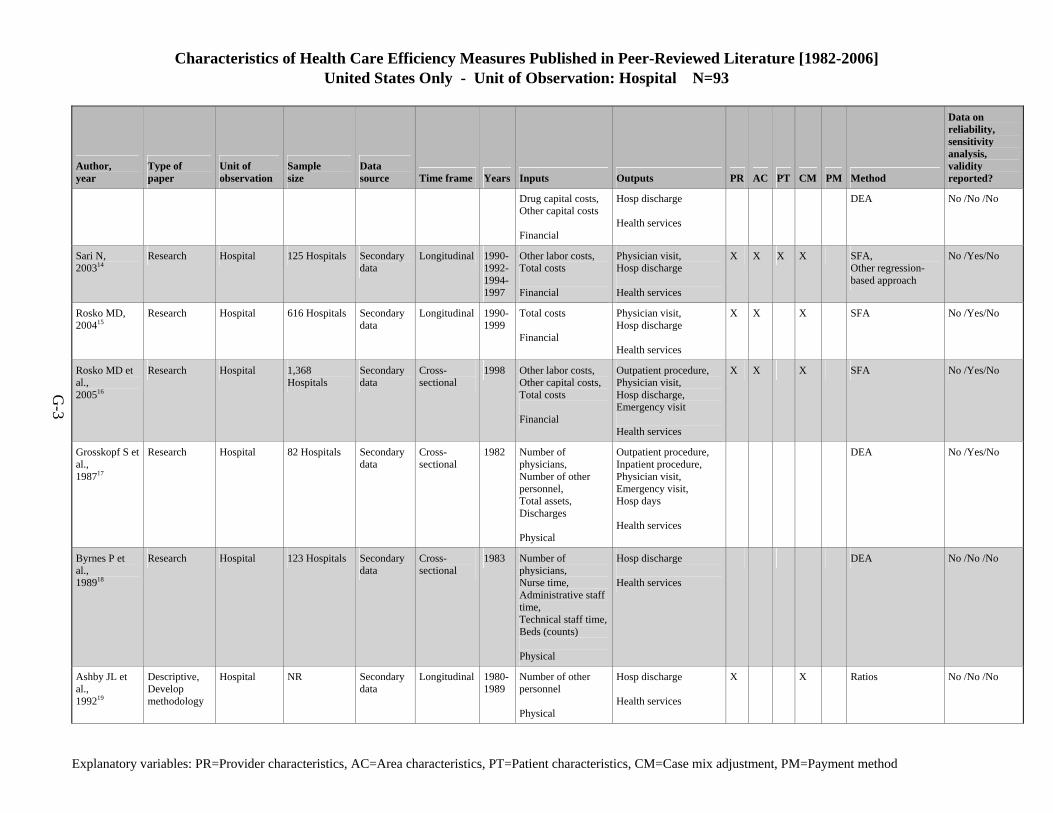
Characteristics of Health Care Efficiency Measures Published in Peer-Reviewed Literature [1982-2006] United States Only - Unit of Observation: Hospital N=93
Explanatory variables: PR=Provider characteristics, AC=Area characteristics, PT=Patient characteristics, CM=Case mix adjustment, PM=Payment method
G-3
Author, year
Type of paper
Unit of observation
Sample size
Data source Time frame Years Inputs Outputs PR AC PT CM PM Method
Data on reliability, sensitivity analysis, validity reported?
Drug capital costs, Other capital costs Financial
Hosp discharge Health services
DEA No /No /No
Sari N, 200314
Research Hospital 125 Hospitals Secondary data
Longitudinal 1990-1992-1994-1997
Other labor costs, Total costs Financial
Physician visit, Hosp discharge Health services
X X X X SFA, Other regression-based approach
No /Yes/No
Rosko MD, 200415
Research Hospital 616 Hospitals Secondary data
Longitudinal 1990-1999
Total costs Financial
Physician visit, Hosp discharge Health services
X X X SFA No /Yes/No
Rosko MD et al., 200516
Research Hospital 1,368 Hospitals
Secondary data
Cross- sectional
1998 Other labor costs, Other capital costs, Total costs Financial
Outpatient procedure, Physician visit, Hosp discharge, Emergency visit Health services
X X X SFA No /Yes/No
Grosskopf S et al., 198717
Research Hospital 82 Hospitals Secondary data
Cross- sectional
1982 Number of physicians, Number of other personnel, Total assets, Discharges Physical
Outpatient procedure, Inpatient procedure, Physician visit, Emergency visit, Hosp days Health services
DEA No /Yes/No
Byrnes P et al., 198918
Research Hospital 123 Hospitals Secondary data
Cross- sectional
1983 Number of physicians, Nurse time, Administrative staff time, Technical staff time,Beds (counts) Physical
Hosp discharge Health services
DEA No /No /No
Ashby JL et al., 199219
Descriptive, Develop methodology
Hospital NR Secondary data
Longitudinal 1980-1989
Number of other personnel Physical
Hosp discharge Health services
X X Ratios No /No /No
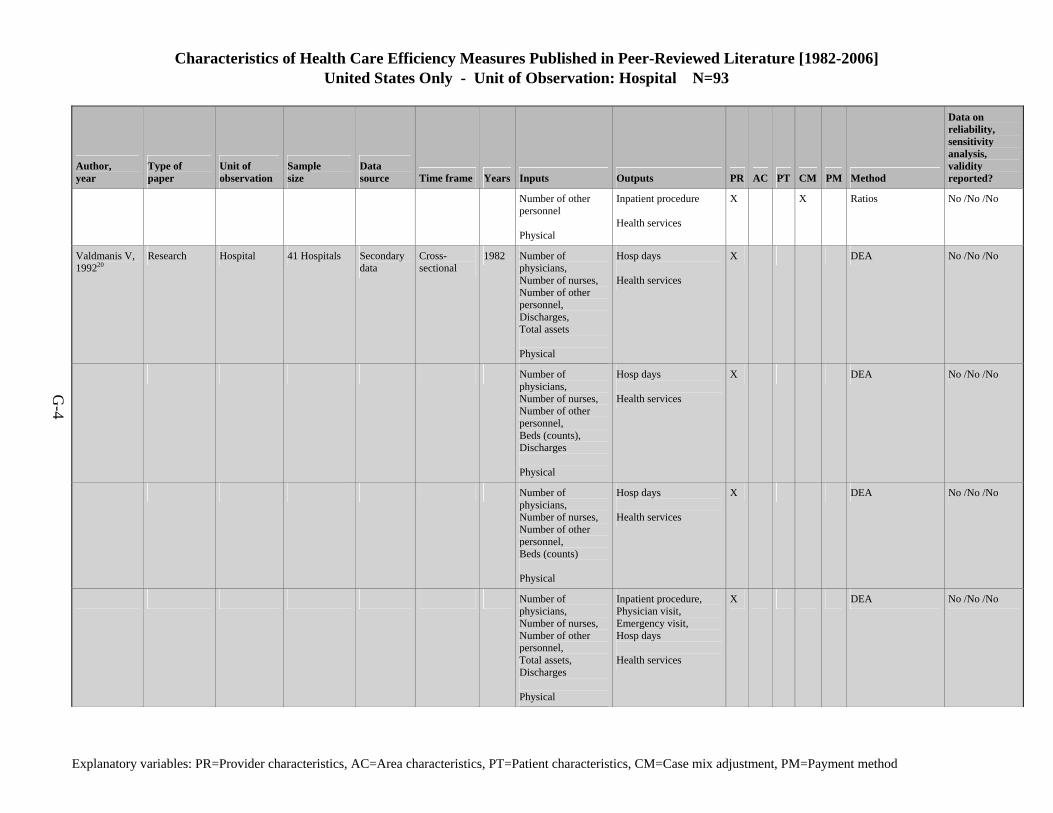
Characteristics of Health Care Efficiency Measures Published in Peer-Reviewed Literature [1982-2006] United States Only - Unit of Observation: Hospital N=93
Explanatory variables: PR=Provider characteristics, AC=Area characteristics, PT=Patient characteristics, CM=Case mix adjustment, PM=Payment method
G-4
Author, year
Type of paper
Unit of observation
Sample size
Data source Time frame Years Inputs Outputs PR AC PT CM PM Method
Data on reliability, sensitivity analysis, validity reported?
Number of other personnel Physical
Inpatient procedure Health services
X X Ratios No /No /No
Valdmanis V, 199220
Research Hospital 41 Hospitals Secondary data
Cross- sectional
1982 Number of physicians, Number of nurses, Number of other personnel, Discharges, Total assets Physical
Hosp days Health services
X DEA No /No /No
Number of physicians, Number of nurses, Number of other personnel, Beds (counts), Discharges Physical
Hosp days Health services
X DEA No /No /No
Number of physicians, Number of nurses, Number of other personnel, Beds (counts) Physical
Hosp days Health services
X DEA No /No /No
Number of physicians, Number of nurses, Number of other personnel, Total assets, Discharges Physical
Inpatient procedure, Physician visit, Emergency visit, Hosp days Health services
X DEA No /No /No
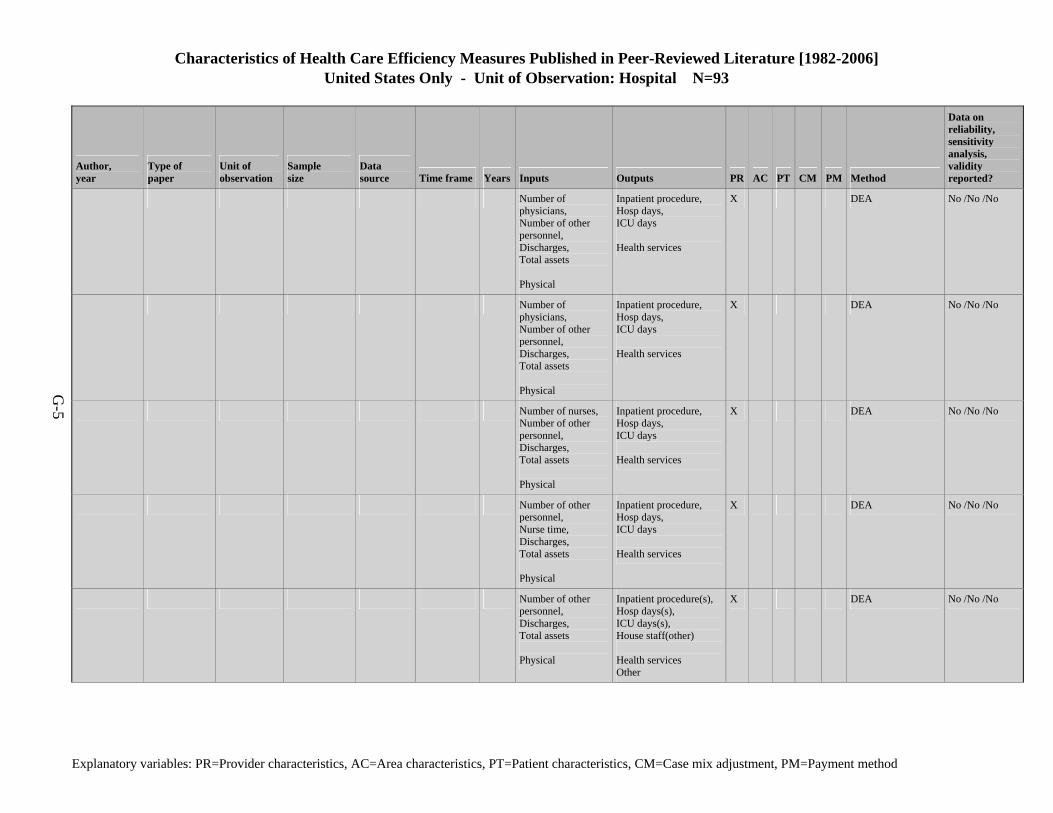
Characteristics of Health Care Efficiency Measures Published in Peer-Reviewed Literature [1982-2006] United States Only - Unit of Observation: Hospital N=93
Explanatory variables: PR=Provider characteristics, AC=Area characteristics, PT=Patient characteristics, CM=Case mix adjustment, PM=Payment method
G-5
Author, year
Type of paper
Unit of observation
Sample size
Data source Time frame Years Inputs Outputs PR AC PT CM PM Method
Data on reliability, sensitivity analysis, validity reported?
Number of physicians, Number of other personnel, Discharges, Total assets Physical
Inpatient procedure, Hosp days, ICU days Health services
X DEA No /No /No
Number of physicians, Number of other personnel, Discharges, Total assets Physical
Inpatient procedure, Hosp days, ICU days Health services
X DEA No /No /No
Number of nurses, Number of other personnel, Discharges, Total assets Physical
Inpatient procedure, Hosp days, ICU days Health services
X DEA No /No /No
Number of other personnel, Nurse time, Discharges, Total assets Physical
Inpatient procedure, Hosp days, ICU days Health services
X DEA No /No /No
Number of other personnel, Discharges, Total assets Physical
Inpatient procedure(s), Hosp days(s), ICU days(s), House staff(other) Health services Other
X DEA No /No /No
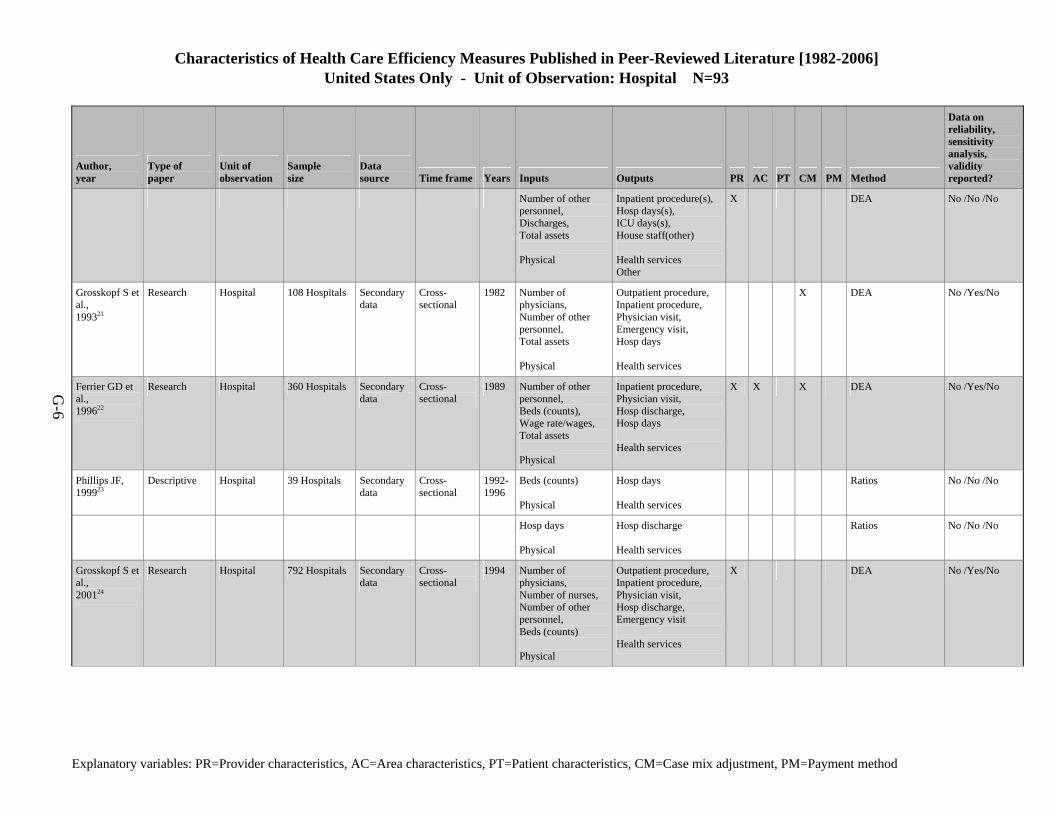
Characteristics of Health Care Efficiency Measures Published in Peer-Reviewed Literature [1982-2006] United States Only - Unit of Observation: Hospital N=93
Explanatory variables: PR=Provider characteristics, AC=Area characteristics, PT=Patient characteristics, CM=Case mix adjustment, PM=Payment method
G-6
Author, year
Type of paper
Unit of observation
Sample size
Data source Time frame Years Inputs Outputs PR AC PT CM PM Method
Data on reliability, sensitivity analysis, validity reported?
Number of other personnel, Discharges, Total assets Physical
Inpatient procedure(s), Hosp days(s), ICU days(s), House staff(other) Health services Other
X DEA No /No /No
Grosskopf S et al., 199321
Research Hospital 108 Hospitals Secondary data
Cross- sectional
1982 Number of physicians, Number of other personnel, Total assets Physical
Outpatient procedure, Inpatient procedure, Physician visit, Emergency visit, Hosp days Health services
X DEA No /Yes/No
Ferrier GD et al., 199622
Research Hospital 360 Hospitals Secondary data
Cross- sectional
1989 Number of other personnel, Beds (counts), Wage rate/wages, Total assets Physical
Inpatient procedure, Physician visit, Hosp discharge, Hosp days Health services
X X X DEA No /Yes/No
Phillips JF, 199923
Descriptive Hospital 39 Hospitals Secondary data
Cross- sectional
1992-1996
Beds (counts) Physical
Hosp days Health services
Ratios No /No /No
Hosp days Physical
Hosp discharge Health services
Ratios No /No /No
Grosskopf S et al., 200124
Research Hospital 792 Hospitals Secondary data
Cross- sectional
1994 Number of physicians, Number of nurses, Number of other personnel, Beds (counts) Physical
Outpatient procedure, Inpatient procedure, Physician visit, Hosp discharge, Emergency visit Health services
X DEA No /Yes/No
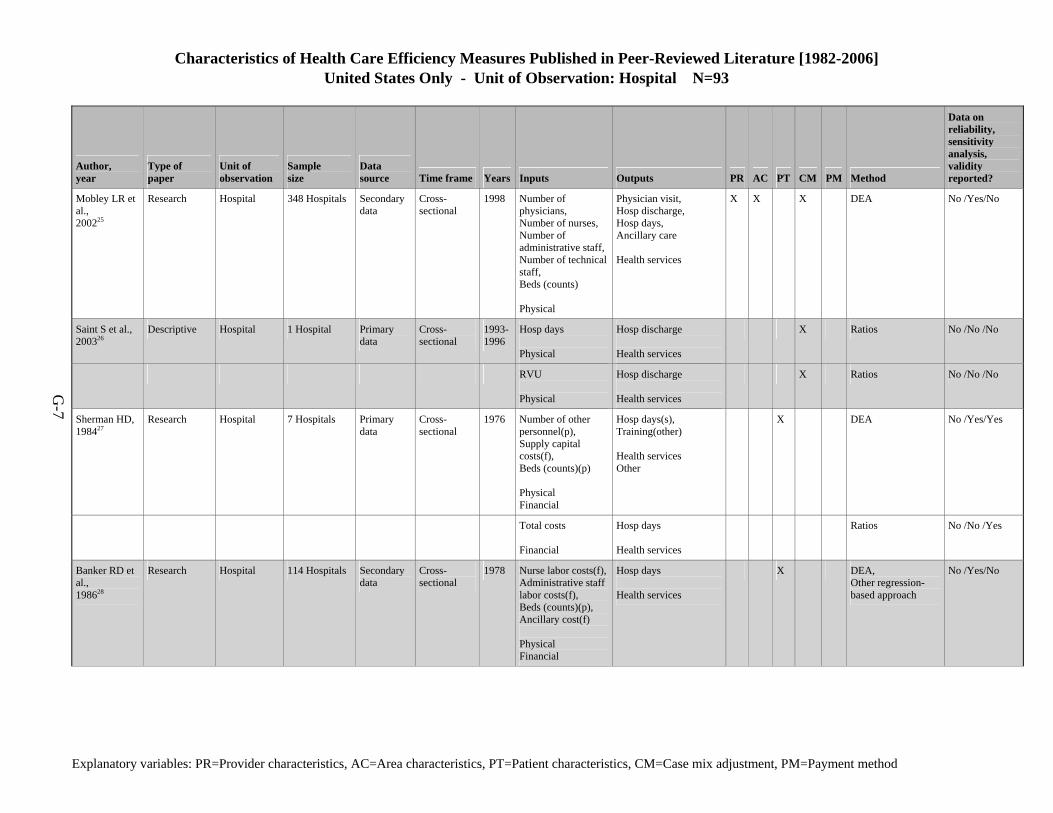
Characteristics of Health Care Efficiency Measures Published in Peer-Reviewed Literature [1982-2006] United States Only - Unit of Observation: Hospital N=93
Explanatory variables: PR=Provider characteristics, AC=Area characteristics, PT=Patient characteristics, CM=Case mix adjustment, PM=Payment method
G-7
Author, year
Type of paper
Unit of observation
Sample size
Data source Time frame Years Inputs Outputs PR AC PT CM PM Method
Data on reliability, sensitivity analysis, validity reported?
Mobley LR et al., 200225
Research Hospital 348 Hospitals Secondary data
Cross- sectional
1998 Number of physicians, Number of nurses, Number of administrative staff,Number of technical staff, Beds (counts) Physical
Physician visit, Hosp discharge, Hosp days, Ancillary care Health services
X X X DEA No /Yes/No
Saint S et al., 200326
Descriptive Hospital 1 Hospital Primary data
Cross- sectional
1993-1996
Hosp days Physical
Hosp discharge Health services
X Ratios No /No /No
RVU Physical
Hosp discharge Health services
X Ratios No /No /No
Sherman HD, 198427
Research Hospital 7 Hospitals Primary data
Cross- sectional
1976 Number of other personnel(p), Supply capital costs(f), Beds (counts)(p) Physical Financial
Hosp days(s), Training(other) Health services Other
X DEA No /Yes/Yes
Total costs Financial
Hosp days Health services
Ratios No /No /Yes
Banker RD et al., 198628
Research Hospital 114 Hospitals Secondary data
Cross- sectional
1978 Nurse labor costs(f),Administrative staff labor costs(f), Beds (counts)(p), Ancillary cost(f) Physical Financial
Hosp days Health services
X DEA, Other regression-based approach
No /Yes/No
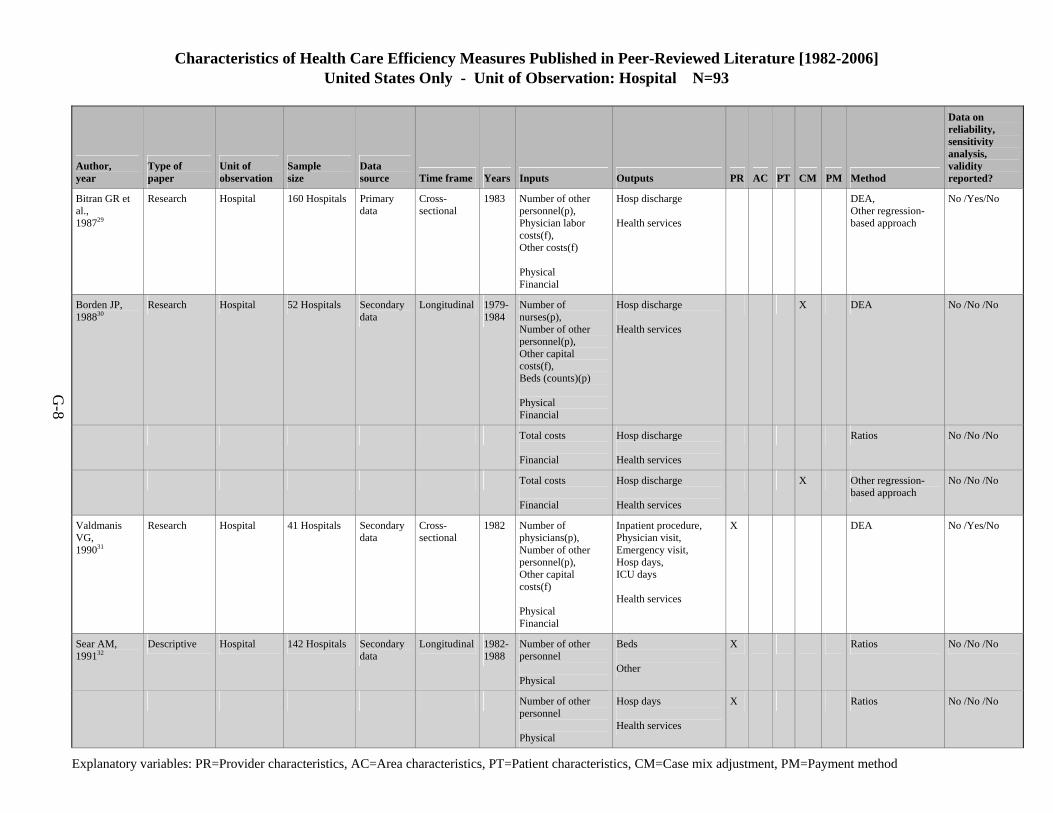
Characteristics of Health Care Efficiency Measures Published in Peer-Reviewed Literature [1982-2006] United States Only - Unit of Observation: Hospital N=93
Explanatory variables: PR=Provider characteristics, AC=Area characteristics, PT=Patient characteristics, CM=Case mix adjustment, PM=Payment method
G-8
Author, year
Type of paper
Unit of observation
Sample size
Data source Time frame Years Inputs Outputs PR AC PT CM PM Method
Data on reliability, sensitivity analysis, validity reported?
Bitran GR et al., 198729
Research Hospital 160 Hospitals Primary data
Cross- sectional
1983 Number of other personnel(p), Physician labor costs(f), Other costs(f) Physical Financial
Hosp discharge Health services
DEA, Other regression-based approach
No /Yes/No
Borden JP, 198830
Research Hospital 52 Hospitals Secondary data
Longitudinal 1979-1984
Number of nurses(p), Number of other personnel(p), Other capital costs(f), Beds (counts)(p) Physical Financial
Hosp discharge Health services
X DEA No /No /No
Total costs Financial
Hosp discharge Health services
Ratios No /No /No
Total costs Financial
Hosp discharge Health services
X Other regression-based approach
No /No /No
Valdmanis VG, 199031
Research Hospital 41 Hospitals Secondary data
Cross- sectional
1982 Number of physicians(p), Number of other personnel(p), Other capital costs(f) Physical Financial
Inpatient procedure, Physician visit, Emergency visit, Hosp days, ICU days Health services
X DEA No /Yes/No
Sear AM, 199132
Descriptive Hospital 142 Hospitals Secondary data
Longitudinal 1982-1988
Number of other personnel Physical
Beds Other
X Ratios No /No /No
Number of other personnel Physical
Hosp days Health services
X Ratios No /No /No
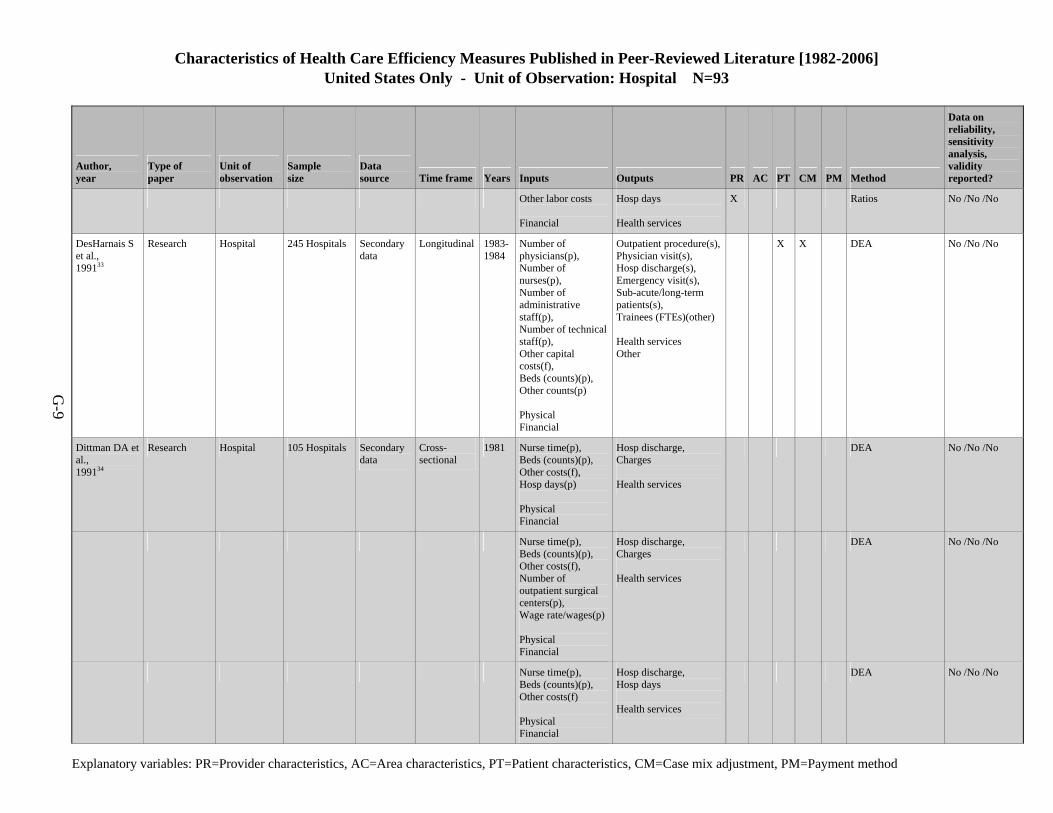
Characteristics of Health Care Efficiency Measures Published in Peer-Reviewed Literature [1982-2006] United States Only - Unit of Observation: Hospital N=93
Explanatory variables: PR=Provider characteristics, AC=Area characteristics, PT=Patient characteristics, CM=Case mix adjustment, PM=Payment method
G-9
Author, year
Type of paper
Unit of observation
Sample size
Data source Time frame Years Inputs Outputs PR AC PT CM PM Method
Data on reliability, sensitivity analysis, validity reported?
Other labor costs Financial
Hosp days Health services
X Ratios No /No /No
DesHarnais S et al., 199133
Research Hospital 245 Hospitals Secondary data
Longitudinal 1983-1984
Number of physicians(p), Number of nurses(p), Number of administrative staff(p), Number of technical staff(p), Other capital costs(f), Beds (counts)(p), Other counts(p) Physical Financial
Outpatient procedure(s),Physician visit(s), Hosp discharge(s), Emergency visit(s), Sub-acute/long-term patients(s), Trainees (FTEs)(other) Health services Other
X X DEA No /No /No
Dittman DA et al., 199134
Research Hospital 105 Hospitals Secondary data
Cross- sectional
1981 Nurse time(p), Beds (counts)(p), Other costs(f), Hosp days(p) Physical Financial
Hosp discharge, Charges Health services
DEA No /No /No
Nurse time(p), Beds (counts)(p), Other costs(f), Number of outpatient surgical centers(p), Wage rate/wages(p) Physical Financial
Hosp discharge, Charges Health services
DEA No /No /No
Nurse time(p), Beds (counts)(p), Other costs(f) Physical Financial
Hosp discharge, Hosp days Health services
DEA No /No /No

Characteristics of Health Care Efficiency Measures Published in Peer-Reviewed Literature [1982-2006] United States Only - Unit of Observation: Hospital N=93
Explanatory variables: PR=Provider characteristics, AC=Area characteristics, PT=Patient characteristics, CM=Case mix adjustment, PM=Payment method
G-10
Author, year
Type of paper
Unit of observation
Sample size
Data source Time frame Years Inputs Outputs PR AC PT CM PM Method
Data on reliability, sensitivity analysis, validity reported?
Ozcan YA, 199235
Research Hospital 40 Hospitals Secondary data
Cross- sectional
1989 Number of nurses(p), Number of administrative staff(p), Number of other personnel(p), Beds (counts)(p), Operating cost(f), Total assets(p) Physical Financial
Physician visit(s), Hosp discharge(s), Hosp days(s), Trainees (FTEs)(other) Health services Other
X DEA No /Yes/No
Bradbury RC et al., 199336
Research Hospital 10 Hospitals Secondary data
Longitudinal 1988-1989
Total costs Financial
Hosp discharge Health services
X X Other regression-based approach
No /No /No
Other costs Financial
Hosp discharge Health services
X X Other regression-based approach
No /No /No
Hosp days Physical
Hosp discharge Health services
X X Other regression-based approach
No /No /No
McCue MJ et al., 199337
Descriptive Hospital 84 Hospitals Secondary data
Cross- sectional
1986-1990
Beds (counts) Physical
Hosp days Health services
X Ratios No /No /No
Hosp days Physical
Hosp discharge Health services
X X Ratios No /No /No
Beds (counts) Physical
Hosp discharge Health services
X X Ratios No /No /No
Number of other personnel Physical
Hosp days Health services
X X Ratios No /No /No
Total costs Financial
Hosp days Health services
X X Ratios No /No /No
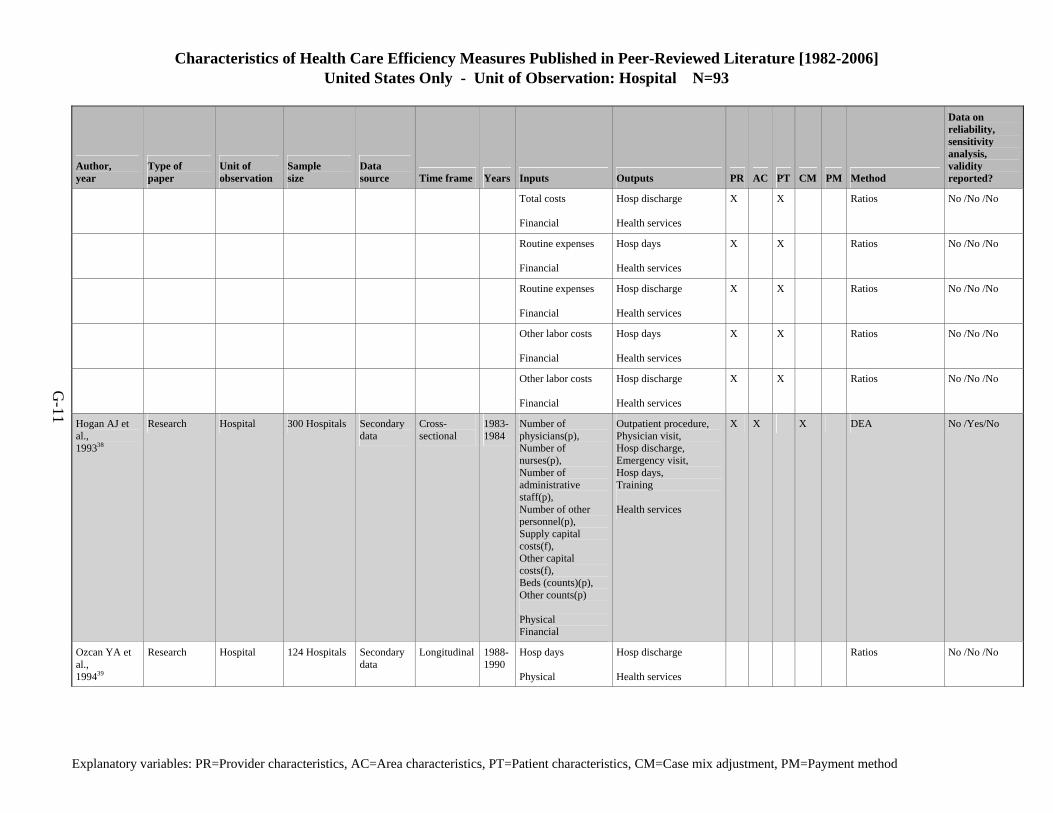
Characteristics of Health Care Efficiency Measures Published in Peer-Reviewed Literature [1982-2006] United States Only - Unit of Observation: Hospital N=93
Explanatory variables: PR=Provider characteristics, AC=Area characteristics, PT=Patient characteristics, CM=Case mix adjustment, PM=Payment method
G-11
Author, year
Type of paper
Unit of observation
Sample size
Data source Time frame Years Inputs Outputs PR AC PT CM PM Method
Data on reliability, sensitivity analysis, validity reported?
Total costs Financial
Hosp discharge Health services
X X Ratios No /No /No
Routine expenses Financial
Hosp days Health services
X X Ratios No /No /No
Routine expenses Financial
Hosp discharge Health services
X X Ratios No /No /No
Other labor costs Financial
Hosp days Health services
X X Ratios No /No /No
Other labor costs Financial
Hosp discharge Health services
X X Ratios No /No /No
Hogan AJ et al., 199338
Research Hospital 300 Hospitals Secondary data
Cross- sectional
1983-1984
Number of physicians(p), Number of nurses(p), Number of administrative staff(p), Number of other personnel(p), Supply capital costs(f), Other capital costs(f), Beds (counts)(p), Other counts(p) Physical Financial
Outpatient procedure, Physician visit, Hosp discharge, Emergency visit, Hosp days, Training Health services
X X X DEA No /Yes/No
Ozcan YA et al., 199439
Research Hospital 124 Hospitals Secondary data
Longitudinal 1988-1990
Hosp days Physical
Hosp discharge Health services
Ratios No /No /No
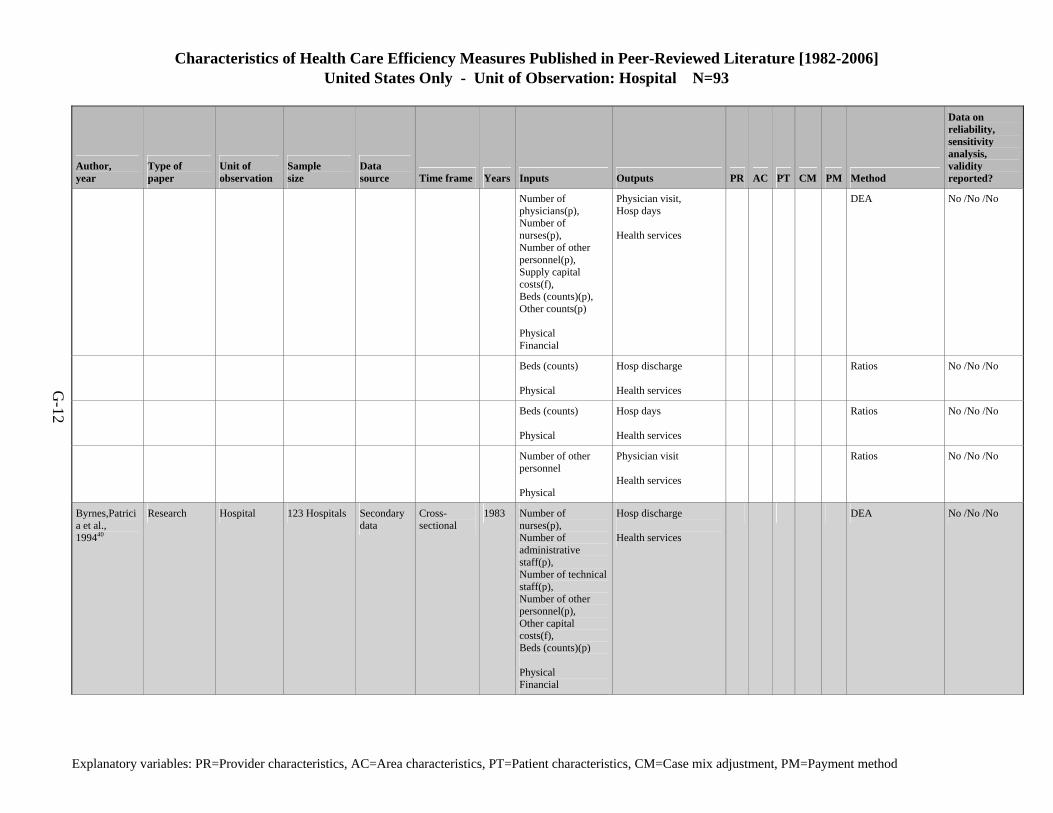
Characteristics of Health Care Efficiency Measures Published in Peer-Reviewed Literature [1982-2006] United States Only - Unit of Observation: Hospital N=93
Explanatory variables: PR=Provider characteristics, AC=Area characteristics, PT=Patient characteristics, CM=Case mix adjustment, PM=Payment method
G-12
Author, year
Type of paper
Unit of observation
Sample size
Data source Time frame Years Inputs Outputs PR AC PT CM PM Method
Data on reliability, sensitivity analysis, validity reported?
Number of physicians(p), Number of nurses(p), Number of other personnel(p), Supply capital costs(f), Beds (counts)(p), Other counts(p) Physical Financial
Physician visit, Hosp days Health services
DEA No /No /No
Beds (counts) Physical
Hosp discharge Health services
Ratios No /No /No
Beds (counts) Physical
Hosp days Health services
Ratios No /No /No
Number of other personnel Physical
Physician visit Health services
Ratios No /No /No
Byrnes,Patricia et al., 199440
Research Hospital 123 Hospitals Secondary data
Cross- sectional
1983 Number of nurses(p), Number of administrative staff(p), Number of technical staff(p), Number of other personnel(p), Other capital costs(f), Beds (counts)(p) Physical Financial
Hosp discharge Health services
DEA No /No /No
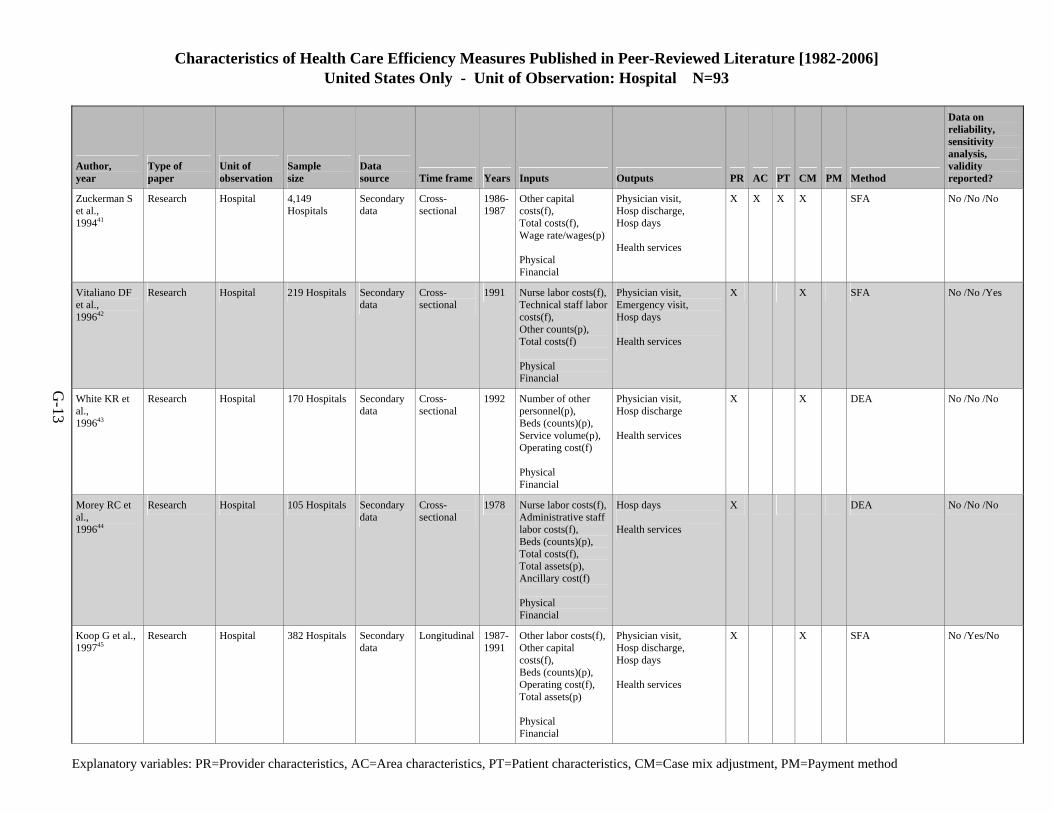
Characteristics of Health Care Efficiency Measures Published in Peer-Reviewed Literature [1982-2006] United States Only - Unit of Observation: Hospital N=93
Explanatory variables: PR=Provider characteristics, AC=Area characteristics, PT=Patient characteristics, CM=Case mix adjustment, PM=Payment method
G-13
Author, year
Type of paper
Unit of observation
Sample size
Data source Time frame Years Inputs Outputs PR AC PT CM PM Method
Data on reliability, sensitivity analysis, validity reported?
Zuckerman S et al., 199441
Research Hospital 4,149 Hospitals
Secondary data
Cross- sectional
1986-1987
Other capital costs(f), Total costs(f), Wage rate/wages(p) Physical Financial
Physician visit, Hosp discharge, Hosp days Health services
X X X X SFA No /No /No
Vitaliano DF et al., 199642
Research Hospital 219 Hospitals Secondary data
Cross- sectional
1991 Nurse labor costs(f),Technical staff labor costs(f), Other counts(p), Total costs(f) Physical Financial
Physician visit, Emergency visit, Hosp days Health services
X X SFA No /No /Yes
White KR et al., 199643
Research Hospital 170 Hospitals Secondary data
Cross- sectional
1992 Number of other personnel(p), Beds (counts)(p), Service volume(p), Operating cost(f) Physical Financial
Physician visit, Hosp discharge Health services
X X DEA No /No /No
Morey RC et al., 199644
Research Hospital 105 Hospitals Secondary data
Cross- sectional
1978 Nurse labor costs(f),Administrative staff labor costs(f), Beds (counts)(p), Total costs(f), Total assets(p), Ancillary cost(f) Physical Financial
Hosp days Health services
X DEA No /No /No
Koop G et al., 199745
Research Hospital 382 Hospitals Secondary data
Longitudinal 1987-1991
Other labor costs(f),Other capital costs(f), Beds (counts)(p), Operating cost(f), Total assets(p) Physical Financial
Physician visit, Hosp discharge, Hosp days Health services
X X SFA No /Yes/No
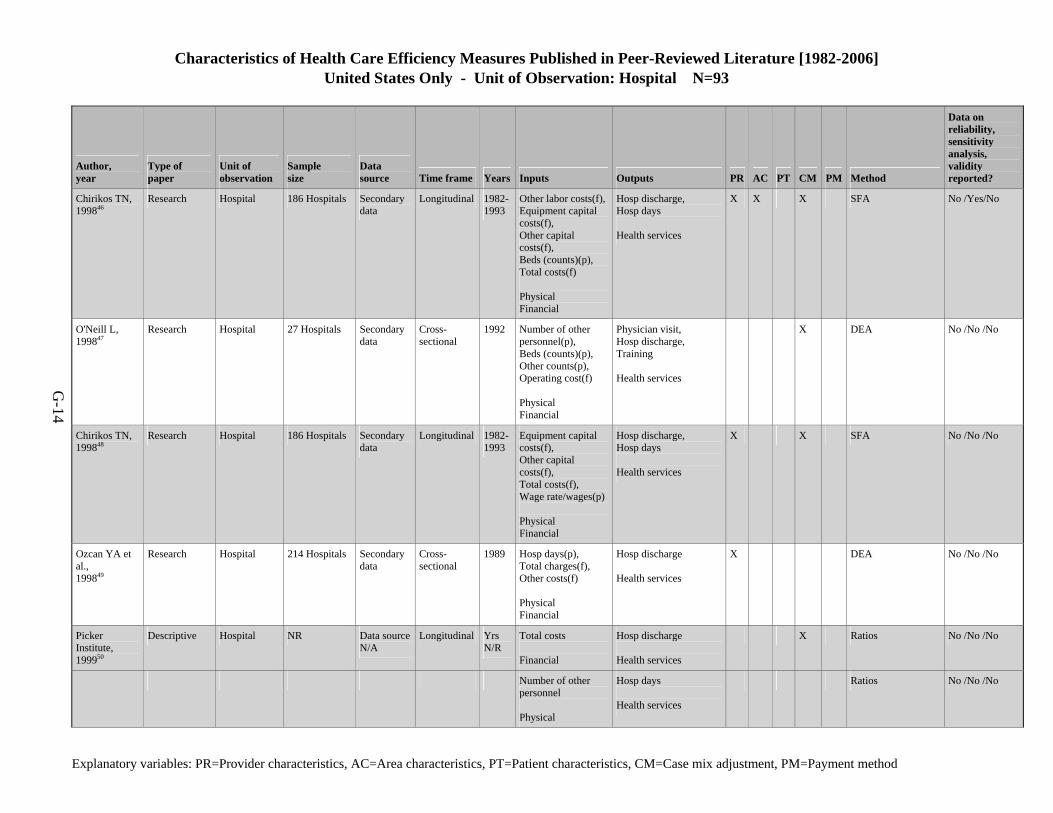
Characteristics of Health Care Efficiency Measures Published in Peer-Reviewed Literature [1982-2006] United States Only - Unit of Observation: Hospital N=93
Explanatory variables: PR=Provider characteristics, AC=Area characteristics, PT=Patient characteristics, CM=Case mix adjustment, PM=Payment method
G-14
Author, year
Type of paper
Unit of observation
Sample size
Data source Time frame Years Inputs Outputs PR AC PT CM PM Method
Data on reliability, sensitivity analysis, validity reported?
Chirikos TN, 199846
Research Hospital 186 Hospitals Secondary data
Longitudinal 1982-1993
Other labor costs(f),Equipment capital costs(f), Other capital costs(f), Beds (counts)(p), Total costs(f) Physical Financial
Hosp discharge, Hosp days Health services
X X X SFA No /Yes/No
O'Neill L, 199847
Research Hospital 27 Hospitals Secondary data
Cross- sectional
1992 Number of other personnel(p), Beds (counts)(p), Other counts(p), Operating cost(f) Physical Financial
Physician visit, Hosp discharge, Training Health services
X DEA No /No /No
Chirikos TN, 199848
Research Hospital 186 Hospitals Secondary data
Longitudinal 1982-1993
Equipment capital costs(f), Other capital costs(f), Total costs(f), Wage rate/wages(p) Physical Financial
Hosp discharge, Hosp days Health services
X X SFA No /No /No
Ozcan YA et al., 199849
Research Hospital 214 Hospitals Secondary data
Cross- sectional
1989 Hosp days(p), Total charges(f), Other costs(f) Physical Financial
Hosp discharge Health services
X DEA No /No /No
Picker Institute, 199950
Descriptive Hospital NR Data source N/A
Longitudinal Yrs N/R
Total costs Financial
Hosp discharge Health services
X Ratios No /No /No
Number of other personnel Physical
Hosp days Health services
Ratios No /No /No
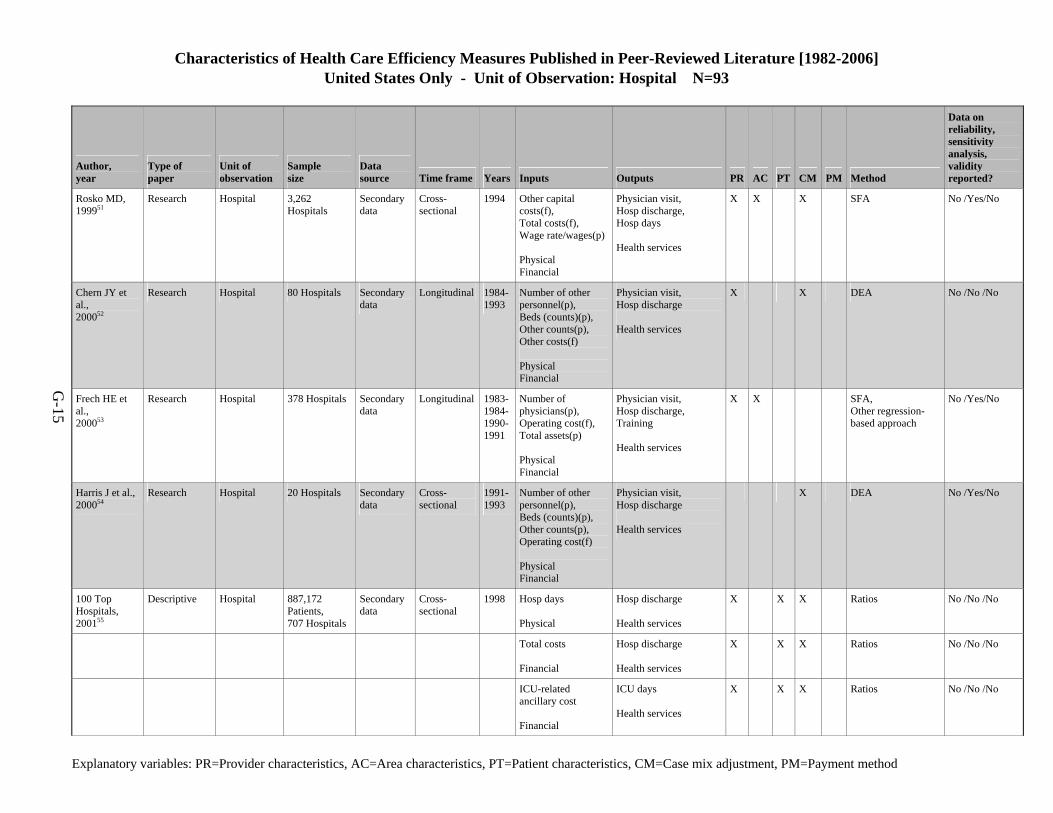
Characteristics of Health Care Efficiency Measures Published in Peer-Reviewed Literature [1982-2006] United States Only - Unit of Observation: Hospital N=93
Explanatory variables: PR=Provider characteristics, AC=Area characteristics, PT=Patient characteristics, CM=Case mix adjustment, PM=Payment method
G-15
Author, year
Type of paper
Unit of observation
Sample size
Data source Time frame Years Inputs Outputs PR AC PT CM PM Method
Data on reliability, sensitivity analysis, validity reported?
Rosko MD, 199951
Research Hospital 3,262 Hospitals
Secondary data
Cross- sectional
1994 Other capital costs(f), Total costs(f), Wage rate/wages(p) Physical Financial
Physician visit, Hosp discharge, Hosp days Health services
X X X SFA No /Yes/No
Chern JY et al., 200052
Research Hospital 80 Hospitals Secondary data
Longitudinal 1984-1993
Number of other personnel(p), Beds (counts)(p), Other counts(p), Other costs(f) Physical Financial
Physician visit, Hosp discharge Health services
X X DEA No /No /No
Frech HE et al., 200053
Research Hospital 378 Hospitals Secondary data
Longitudinal 1983-1984-1990-1991
Number of physicians(p), Operating cost(f), Total assets(p) Physical Financial
Physician visit, Hosp discharge, Training Health services
X X SFA, Other regression-based approach
No /Yes/No
Harris J et al., 200054
Research Hospital 20 Hospitals Secondary data
Cross- sectional
1991-1993
Number of other personnel(p), Beds (counts)(p), Other counts(p), Operating cost(f) Physical Financial
Physician visit, Hosp discharge Health services
X DEA No /Yes/No
100 Top Hospitals, 200155
Descriptive Hospital 887,172 Patients, 707 Hospitals
Secondary data
Cross- sectional
1998 Hosp days Physical
Hosp discharge Health services
X X X Ratios No /No /No
Total costs Financial
Hosp discharge Health services
X X X Ratios No /No /No
ICU-related ancillary cost Financial
ICU days Health services
X X X Ratios No /No /No
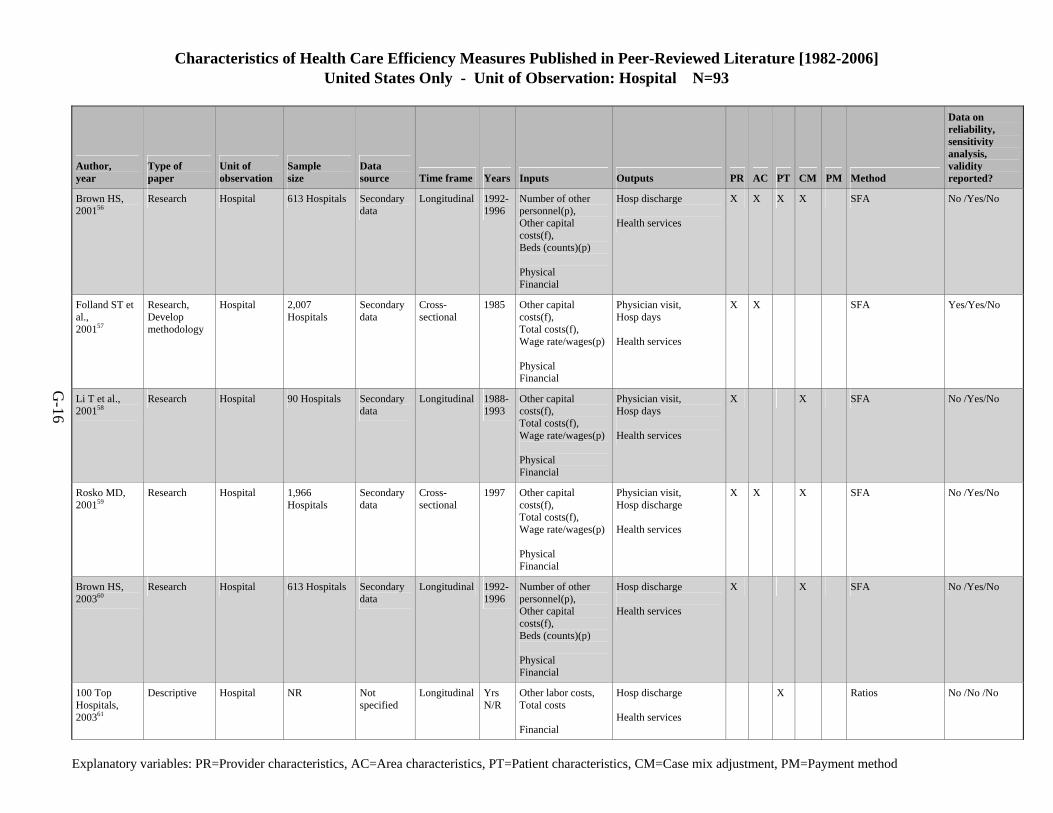
Characteristics of Health Care Efficiency Measures Published in Peer-Reviewed Literature [1982-2006] United States Only - Unit of Observation: Hospital N=93
Explanatory variables: PR=Provider characteristics, AC=Area characteristics, PT=Patient characteristics, CM=Case mix adjustment, PM=Payment method
G-16
Author, year
Type of paper
Unit of observation
Sample size
Data source Time frame Years Inputs Outputs PR AC PT CM PM Method
Data on reliability, sensitivity analysis, validity reported?
Brown HS, 200156
Research Hospital 613 Hospitals Secondary data
Longitudinal 1992-1996
Number of other personnel(p), Other capital costs(f), Beds (counts)(p) Physical Financial
Hosp discharge Health services
X X X X SFA No /Yes/No
Folland ST et al., 200157
Research, Develop methodology
Hospital 2,007 Hospitals
Secondary data
Cross- sectional
1985 Other capital costs(f), Total costs(f), Wage rate/wages(p) Physical Financial
Physician visit, Hosp days Health services
X X SFA Yes/Yes/No
Li T et al., 200158
Research Hospital 90 Hospitals Secondary data
Longitudinal 1988-1993
Other capital costs(f), Total costs(f), Wage rate/wages(p) Physical Financial
Physician visit, Hosp days Health services
X X SFA No /Yes/No
Rosko MD, 200159
Research Hospital 1,966 Hospitals
Secondary data
Cross- sectional
1997 Other capital costs(f), Total costs(f), Wage rate/wages(p) Physical Financial
Physician visit, Hosp discharge Health services
X X X SFA No /Yes/No
Brown HS, 200360
Research Hospital 613 Hospitals Secondary data
Longitudinal 1992-1996
Number of other personnel(p), Other capital costs(f), Beds (counts)(p) Physical Financial
Hosp discharge Health services
X X SFA No /Yes/No
100 Top Hospitals, 200361
Descriptive Hospital NR Not specified
Longitudinal Yrs N/R
Other labor costs, Total costs Financial
Hosp discharge Health services
X Ratios No /No /No
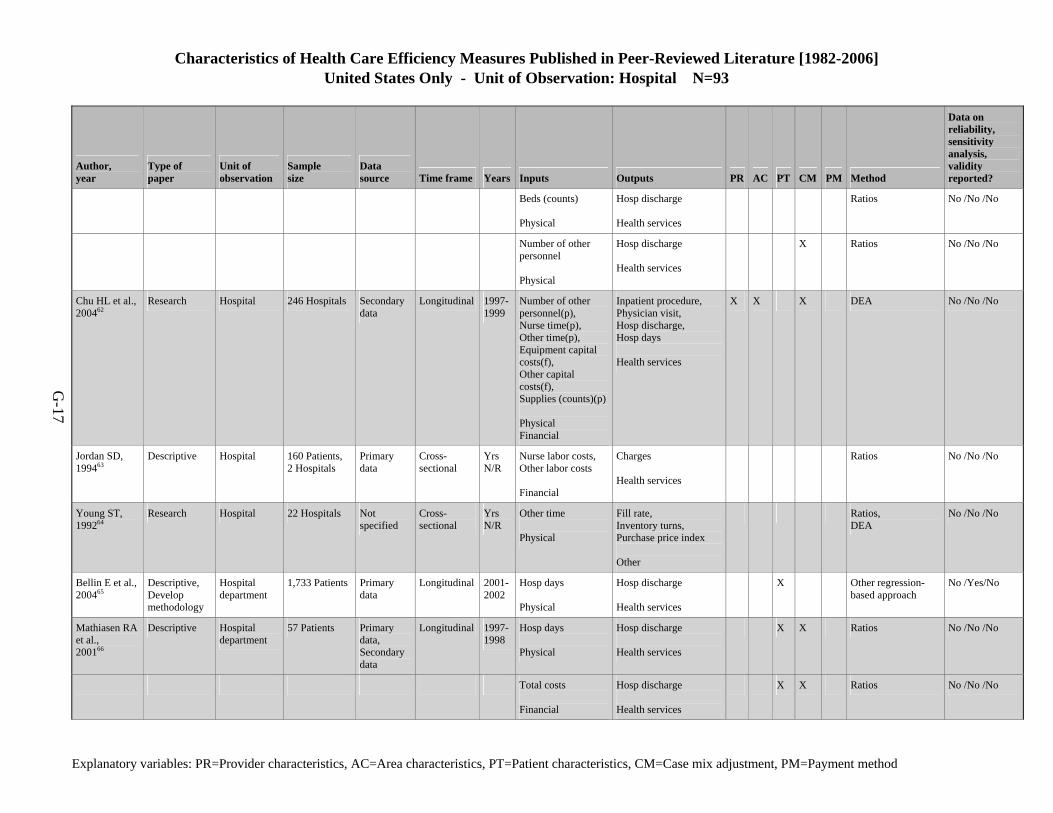
Characteristics of Health Care Efficiency Measures Published in Peer-Reviewed Literature [1982-2006] United States Only - Unit of Observation: Hospital N=93
Explanatory variables: PR=Provider characteristics, AC=Area characteristics, PT=Patient characteristics, CM=Case mix adjustment, PM=Payment method
G-17
Author, year
Type of paper
Unit of observation
Sample size
Data source Time frame Years Inputs Outputs PR AC PT CM PM Method
Data on reliability, sensitivity analysis, validity reported?
Beds (counts) Physical
Hosp discharge Health services
Ratios No /No /No
Number of other personnel Physical
Hosp discharge Health services
X Ratios No /No /No
Chu HL et al., 200462
Research Hospital 246 Hospitals Secondary data
Longitudinal 1997-1999
Number of other personnel(p), Nurse time(p), Other time(p), Equipment capital costs(f), Other capital costs(f), Supplies (counts)(p) Physical Financial
Inpatient procedure, Physician visit, Hosp discharge, Hosp days Health services
X X X DEA No /No /No
Jordan SD, 199463
Descriptive Hospital 160 Patients, 2 Hospitals
Primary data
Cross- sectional
Yrs N/R
Nurse labor costs, Other labor costs Financial
Charges Health services
Ratios No /No /No
Young ST, 199264
Research Hospital 22 Hospitals Not specified
Cross- sectional
Yrs N/R
Other time Physical
Fill rate, Inventory turns, Purchase price index Other
Ratios, DEA
No /No /No
Bellin E et al., 200465
Descriptive, Develop methodology
Hospital department
1,733 Patients Primary data
Longitudinal 2001-2002
Hosp days Physical
Hosp discharge Health services
X Other regression-based approach
No /Yes/No
Mathiasen RA et al., 200166
Descriptive Hospital department
57 Patients Primary data, Secondary data
Longitudinal 1997-1998
Hosp days Physical
Hosp discharge Health services
X X Ratios No /No /No
Total costs Financial
Hosp discharge Health services
X X Ratios No /No /No
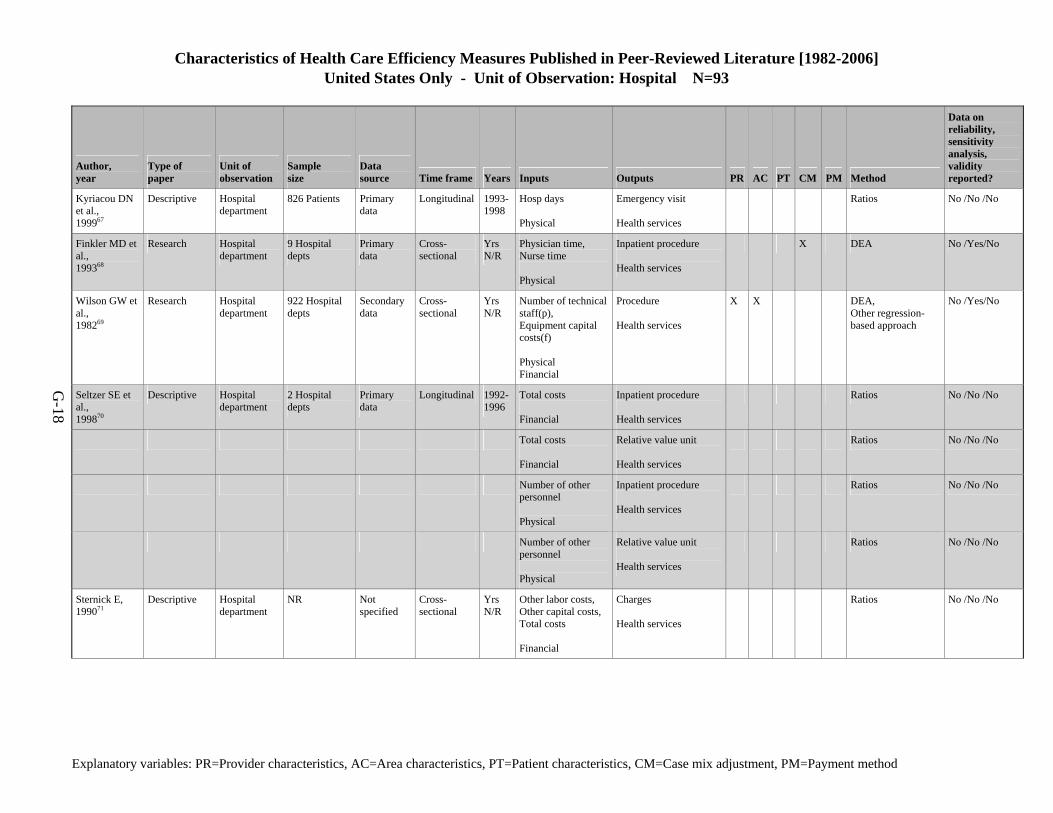
Characteristics of Health Care Efficiency Measures Published in Peer-Reviewed Literature [1982-2006] United States Only - Unit of Observation: Hospital N=93
Explanatory variables: PR=Provider characteristics, AC=Area characteristics, PT=Patient characteristics, CM=Case mix adjustment, PM=Payment method
G-18
Author, year
Type of paper
Unit of observation
Sample size
Data source Time frame Years Inputs Outputs PR AC PT CM PM Method
Data on reliability, sensitivity analysis, validity reported?
Kyriacou DN et al., 199967
Descriptive Hospital department
826 Patients Primary data
Longitudinal 1993-1998
Hosp days Physical
Emergency visit Health services
Ratios No /No /No
Finkler MD et al., 199368
Research Hospital department
9 Hospital depts
Primary data
Cross- sectional
Yrs N/R
Physician time, Nurse time Physical
Inpatient procedure Health services
X DEA No /Yes/No
Wilson GW et al., 198269
Research Hospital department
922 Hospital depts
Secondary data
Cross- sectional
Yrs N/R
Number of technical staff(p), Equipment capital costs(f) Physical Financial
Procedure Health services
X X DEA, Other regression-based approach
No /Yes/No
Seltzer SE et al., 199870
Descriptive Hospital department
2 Hospital depts
Primary data
Longitudinal 1992-1996
Total costs Financial
Inpatient procedure Health services
Ratios No /No /No
Total costs Financial
Relative value unit Health services
Ratios No /No /No
Number of other personnel Physical
Inpatient procedure Health services
Ratios No /No /No
Number of other personnel Physical
Relative value unit Health services
Ratios No /No /No
Sternick E, 199071
Descriptive Hospital department
NR Not specified
Cross- sectional
Yrs N/R
Other labor costs, Other capital costs, Total costs Financial
Charges Health services
Ratios No /No /No
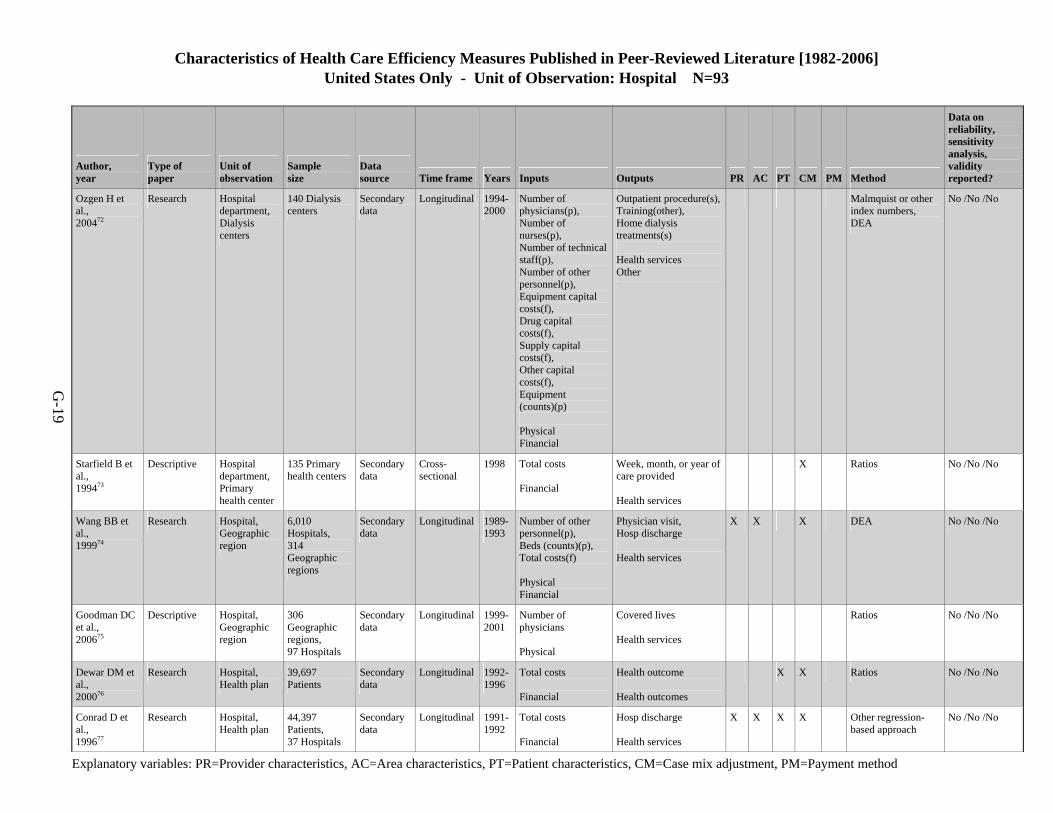
Characteristics of Health Care Efficiency Measures Published in Peer-Reviewed Literature [1982-2006] United States Only - Unit of Observation: Hospital N=93
Explanatory variables: PR=Provider characteristics, AC=Area characteristics, PT=Patient characteristics, CM=Case mix adjustment, PM=Payment method
G-19
Author, year
Type of paper
Unit of observation
Sample size
Data source Time frame Years Inputs Outputs PR AC PT CM PM Method
Data on reliability, sensitivity analysis, validity reported?
Ozgen H et al., 200472
Research Hospital department, Dialysis centers
140 Dialysis centers
Secondary data
Longitudinal 1994-2000
Number of physicians(p), Number of nurses(p), Number of technical staff(p), Number of other personnel(p), Equipment capital costs(f), Drug capital costs(f), Supply capital costs(f), Other capital costs(f), Equipment (counts)(p) Physical Financial
Outpatient procedure(s),Training(other), Home dialysis treatments(s) Health services Other
Malmquist or other index numbers, DEA
No /No /No
Starfield B et al., 199473
Descriptive Hospital department, Primary health center
135 Primary health centers
Secondary data
Cross- sectional
1998 Total costs Financial
Week, month, or year of care provided Health services
X Ratios No /No /No
Wang BB et al., 199974
Research Hospital, Geographic region
6,010 Hospitals, 314 Geographic regions
Secondary data
Longitudinal 1989-1993
Number of other personnel(p), Beds (counts)(p), Total costs(f) Physical Financial
Physician visit, Hosp discharge Health services
X X X DEA No /No /No
Goodman DC et al., 200675
Descriptive Hospital, Geographic region
306 Geographic regions, 97 Hospitals
Secondary data
Longitudinal 1999-2001
Number of physicians Physical
Covered lives Health services
Ratios No /No /No
Dewar DM et al., 200076
Research Hospital, Health plan
39,697 Patients
Secondary data
Longitudinal 1992-1996
Total costs Financial
Health outcome Health outcomes
X X Ratios No /No /No
Conrad D et al., 199677
Research Hospital, Health plan
44,397 Patients, 37 Hospitals
Secondary data
Longitudinal 1991-1992
Total costs Financial
Hosp discharge Health services
X X X X Other regression-based approach
No /No /No
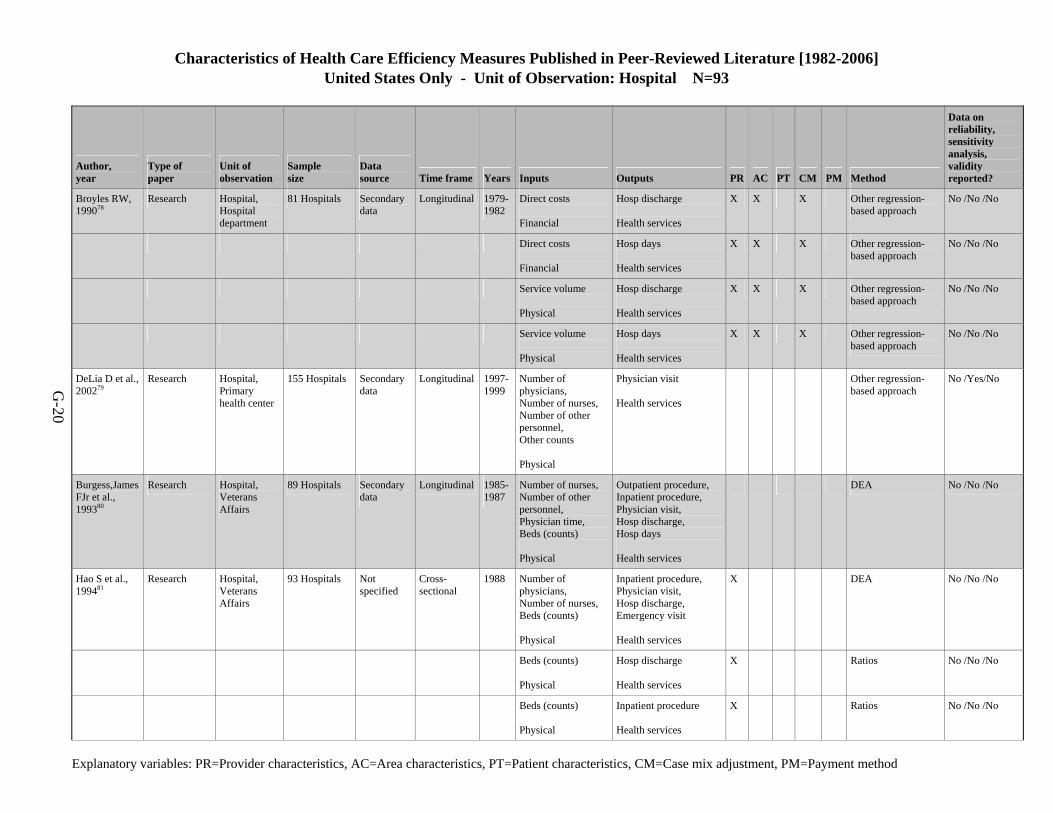
Characteristics of Health Care Efficiency Measures Published in Peer-Reviewed Literature [1982-2006] United States Only - Unit of Observation: Hospital N=93
Explanatory variables: PR=Provider characteristics, AC=Area characteristics, PT=Patient characteristics, CM=Case mix adjustment, PM=Payment method
G-20
Author, year
Type of paper
Unit of observation
Sample size
Data source Time frame Years Inputs Outputs PR AC PT CM PM Method
Data on reliability, sensitivity analysis, validity reported?
Broyles RW, 199078
Research Hospital, Hospital department
81 Hospitals Secondary data
Longitudinal 1979-1982
Direct costs Financial
Hosp discharge Health services
X X X Other regression-based approach
No /No /No
Direct costs Financial
Hosp days Health services
X X X Other regression-based approach
No /No /No
Service volume Physical
Hosp discharge Health services
X X X Other regression-based approach
No /No /No
Service volume Physical
Hosp days Health services
X X X Other regression-based approach
No /No /No
DeLia D et al., 200279
Research Hospital, Primary health center
155 Hospitals Secondary data
Longitudinal 1997-1999
Number of physicians, Number of nurses, Number of other personnel, Other counts Physical
Physician visit Health services
Other regression-based approach
No /Yes/No
Burgess,James FJr et al., 199380
Research Hospital, Veterans Affairs
89 Hospitals Secondary data
Longitudinal 1985-1987
Number of nurses, Number of other personnel, Physician time, Beds (counts) Physical
Outpatient procedure, Inpatient procedure, Physician visit, Hosp discharge, Hosp days Health services
DEA No /No /No
Hao S et al., 199481
Research Hospital, Veterans Affairs
93 Hospitals Not specified
Cross- sectional
1988 Number of physicians, Number of nurses, Beds (counts) Physical
Inpatient procedure, Physician visit, Hosp discharge, Emergency visit Health services
X DEA No /No /No
Beds (counts) Physical
Hosp discharge Health services
X Ratios No /No /No
Beds (counts) Physical
Inpatient procedure Health services
X Ratios No /No /No
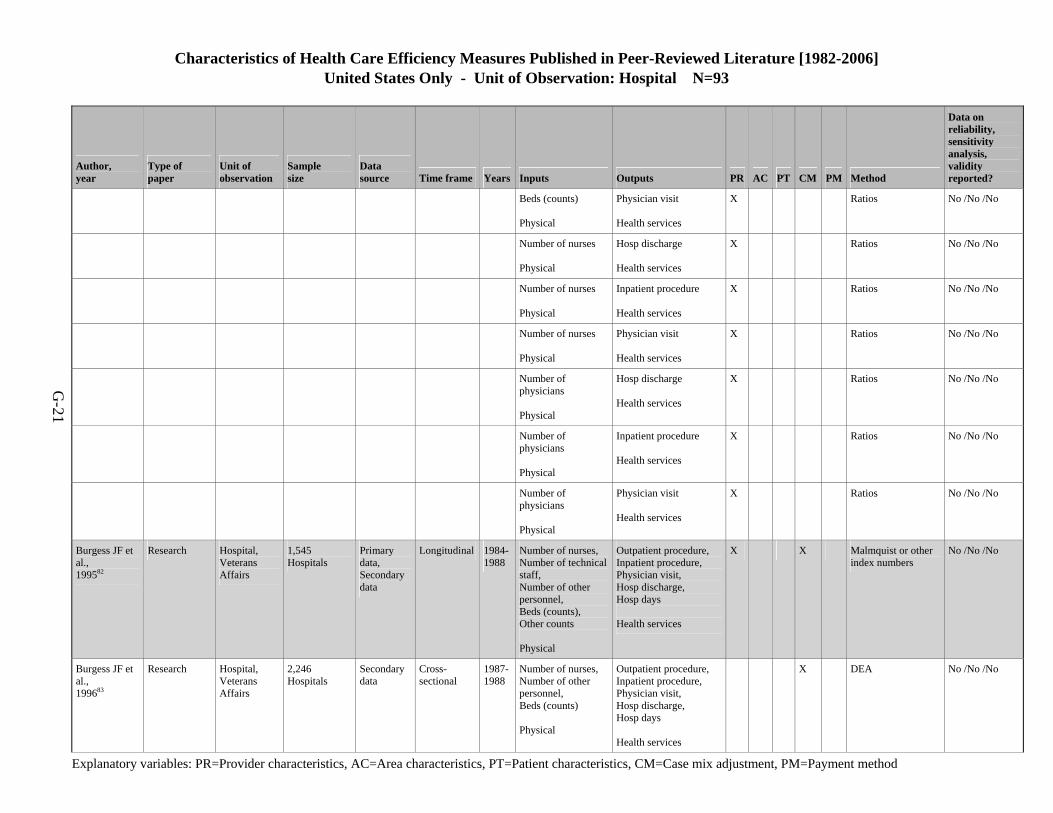
Characteristics of Health Care Efficiency Measures Published in Peer-Reviewed Literature [1982-2006] United States Only - Unit of Observation: Hospital N=93
Explanatory variables: PR=Provider characteristics, AC=Area characteristics, PT=Patient characteristics, CM=Case mix adjustment, PM=Payment method
G-21
Author, year
Type of paper
Unit of observation
Sample size
Data source Time frame Years Inputs Outputs PR AC PT CM PM Method
Data on reliability, sensitivity analysis, validity reported?
Beds (counts) Physical
Physician visit Health services
X Ratios No /No /No
Number of nurses Physical
Hosp discharge Health services
X Ratios No /No /No
Number of nurses Physical
Inpatient procedure Health services
X Ratios No /No /No
Number of nurses Physical
Physician visit Health services
X Ratios No /No /No
Number of physicians Physical
Hosp discharge Health services
X Ratios No /No /No
Number of physicians Physical
Inpatient procedure Health services
X Ratios No /No /No
Number of physicians Physical
Physician visit Health services
X Ratios No /No /No
Burgess JF et al., 199582
Research Hospital, Veterans Affairs
1,545 Hospitals
Primary data, Secondary data
Longitudinal 1984-1988
Number of nurses, Number of technical staff, Number of other personnel, Beds (counts), Other counts Physical
Outpatient procedure, Inpatient procedure, Physician visit, Hosp discharge, Hosp days Health services
X X Malmquist or other index numbers
No /No /No
Burgess JF et al., 199683
Research Hospital, Veterans Affairs
2,246 Hospitals
Secondary data
Cross- sectional
1987-1988
Number of nurses, Number of other personnel, Beds (counts) Physical
Outpatient procedure, Inpatient procedure, Physician visit, Hosp discharge, Hosp days Health services
X DEA No /No /No
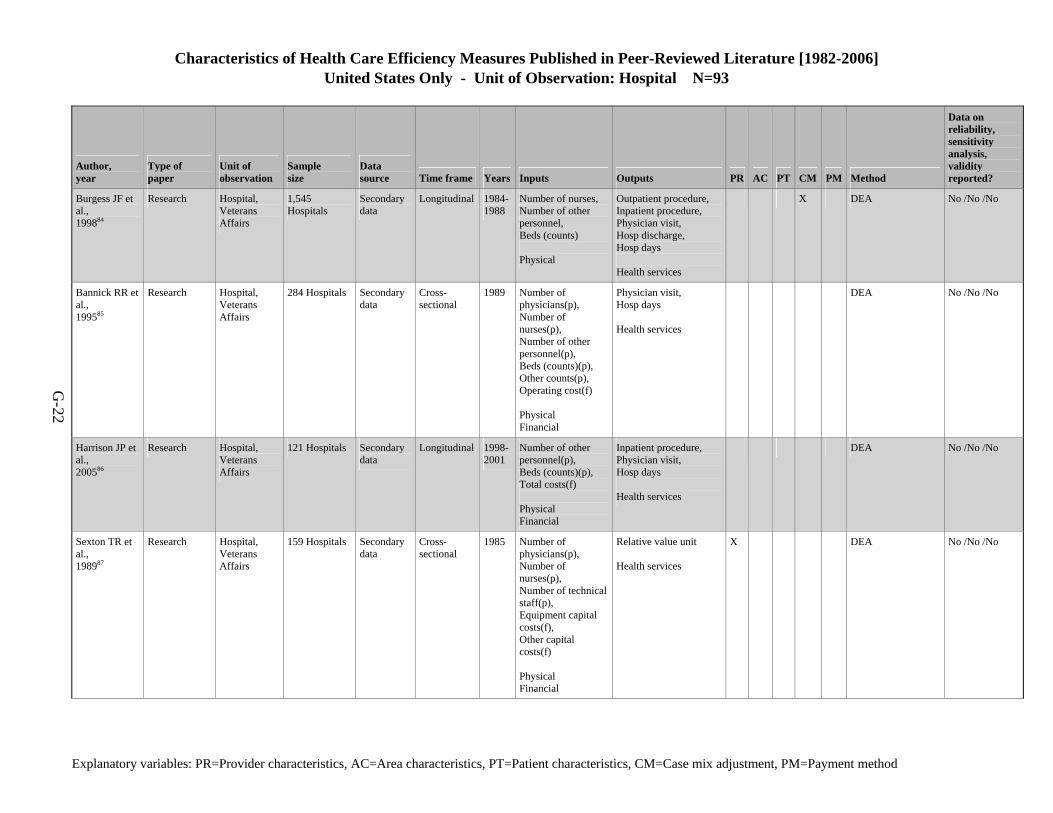
Characteristics of Health Care Efficiency Measures Published in Peer-Reviewed Literature [1982-2006] United States Only - Unit of Observation: Hospital N=93
Explanatory variables: PR=Provider characteristics, AC=Area characteristics, PT=Patient characteristics, CM=Case mix adjustment, PM=Payment method
G-22
Author, year
Type of paper
Unit of observation
Sample size
Data source Time frame Years Inputs Outputs PR AC PT CM PM Method
Data on reliability, sensitivity analysis, validity reported?
Burgess JF et al., 199884
Research Hospital, Veterans Affairs
1,545 Hospitals
Secondary data
Longitudinal 1984-1988
Number of nurses, Number of other personnel, Beds (counts) Physical
Outpatient procedure, Inpatient procedure, Physician visit, Hosp discharge, Hosp days Health services
X DEA No /No /No
Bannick RR et al., 199585
Research Hospital, Veterans Affairs
284 Hospitals Secondary data
Cross- sectional
1989 Number of physicians(p), Number of nurses(p), Number of other personnel(p), Beds (counts)(p), Other counts(p), Operating cost(f) Physical Financial
Physician visit, Hosp days Health services
DEA No /No /No
Harrison JP et al., 200586
Research Hospital, Veterans Affairs
121 Hospitals Secondary data
Longitudinal 1998-2001
Number of other personnel(p), Beds (counts)(p), Total costs(f) Physical Financial
Inpatient procedure, Physician visit, Hosp days Health services
DEA No /No /No
Sexton TR et al., 198987
Research Hospital, Veterans Affairs
159 Hospitals Secondary data
Cross- sectional
1985 Number of physicians(p), Number of nurses(p), Number of technical staff(p), Equipment capital costs(f), Other capital costs(f) Physical Financial
Relative value unit Health services
X DEA No /No /No
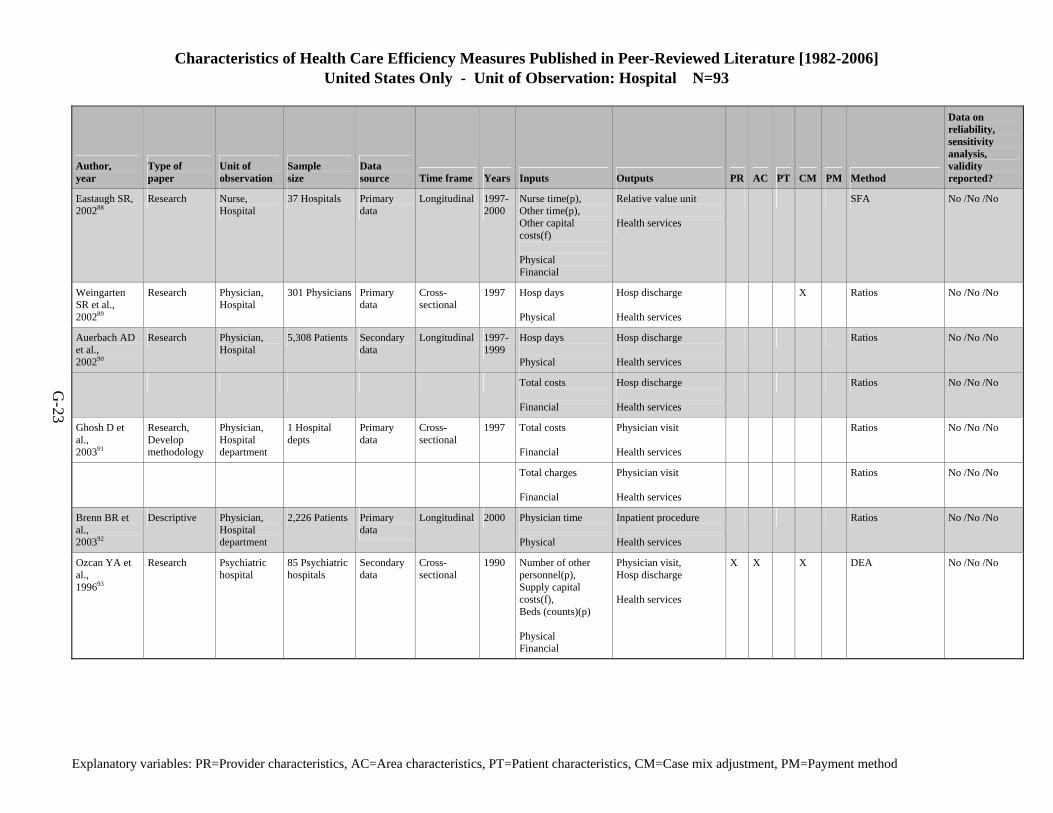
Characteristics of Health Care Efficiency Measures Published in Peer-Reviewed Literature [1982-2006] United States Only - Unit of Observation: Hospital N=93
Explanatory variables: PR=Provider characteristics, AC=Area characteristics, PT=Patient characteristics, CM=Case mix adjustment, PM=Payment method
G-23
Author, year
Type of paper
Unit of observation
Sample size
Data source Time frame Years Inputs Outputs PR AC PT CM PM Method
Data on reliability, sensitivity analysis, validity reported?
Eastaugh SR, 200288
Research Nurse, Hospital
37 Hospitals Primary data
Longitudinal 1997-2000
Nurse time(p), Other time(p), Other capital costs(f) Physical Financial
Relative value unit Health services
SFA No /No /No
Weingarten SR et al., 200289
Research Physician, Hospital
301 Physicians Primary data
Cross- sectional
1997 Hosp days Physical
Hosp discharge Health services
X Ratios No /No /No
Auerbach AD et al., 200290
Research Physician, Hospital
5,308 Patients Secondary data
Longitudinal 1997-1999
Hosp days Physical
Hosp discharge Health services
Ratios No /No /No
Total costs Financial
Hosp discharge Health services
Ratios No /No /No
Ghosh D et al., 200391
Research, Develop methodology
Physician, Hospital department
1 Hospital depts
Primary data
Cross- sectional
1997 Total costs Financial
Physician visit Health services
Ratios No /No /No
Total charges Financial
Physician visit Health services
Ratios No /No /No
Brenn BR et al., 200392
Descriptive Physician, Hospital department
2,226 Patients Primary data
Longitudinal 2000 Physician time Physical
Inpatient procedure Health services
Ratios No /No /No
Ozcan YA et al., 199693
Research Psychiatric hospital
85 Psychiatric hospitals
Secondary data
Cross- sectional
1990 Number of other personnel(p), Supply capital costs(f), Beds (counts)(p) Physical Financial
Physician visit, Hosp discharge Health services
X X X DEA No /No /No
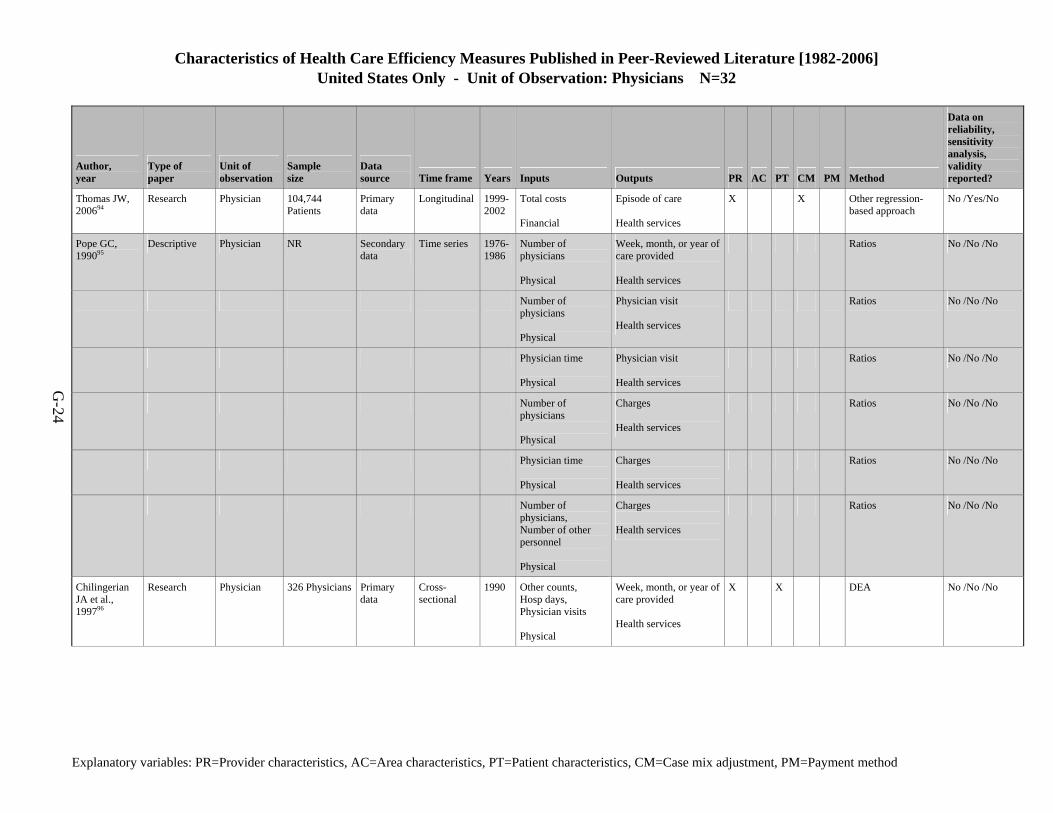
Characteristics of Health Care Efficiency Measures Published in Peer-Reviewed Literature [1982-2006] United States Only - Unit of Observation: Physicians N=32
Explanatory variables: PR=Provider characteristics, AC=Area characteristics, PT=Patient characteristics, CM=Case mix adjustment, PM=Payment method
G-24
Author, year
Type of paper
Unit of observation
Sample size
Data source Time frame Years Inputs Outputs PR AC PT CM PM Method
Data on reliability, sensitivity analysis, validity reported?
Thomas JW, 200694
Research Physician 104,744 Patients
Primary data
Longitudinal 1999-2002
Total costs Financial
Episode of care Health services
X X Other regression-based approach
No /Yes/No
Pope GC, 199095
Descriptive Physician NR Secondary data
Time series 1976-1986
Number of physicians Physical
Week, month, or year of care provided Health services
Ratios No /No /No
Number of physicians Physical
Physician visit Health services
Ratios No /No /No
Physician time Physical
Physician visit Health services
Ratios No /No /No
Number of physicians Physical
Charges Health services
Ratios No /No /No
Physician time Physical
Charges Health services
Ratios No /No /No
Number of physicians, Number of other personnel Physical
Charges Health services
Ratios No /No /No
Chilingerian JA et al., 199796
Research Physician 326 Physicians Primary data
Cross- sectional
1990 Other counts, Hosp days, Physician visits Physical
Week, month, or year of care provided Health services
X X DEA No /No /No
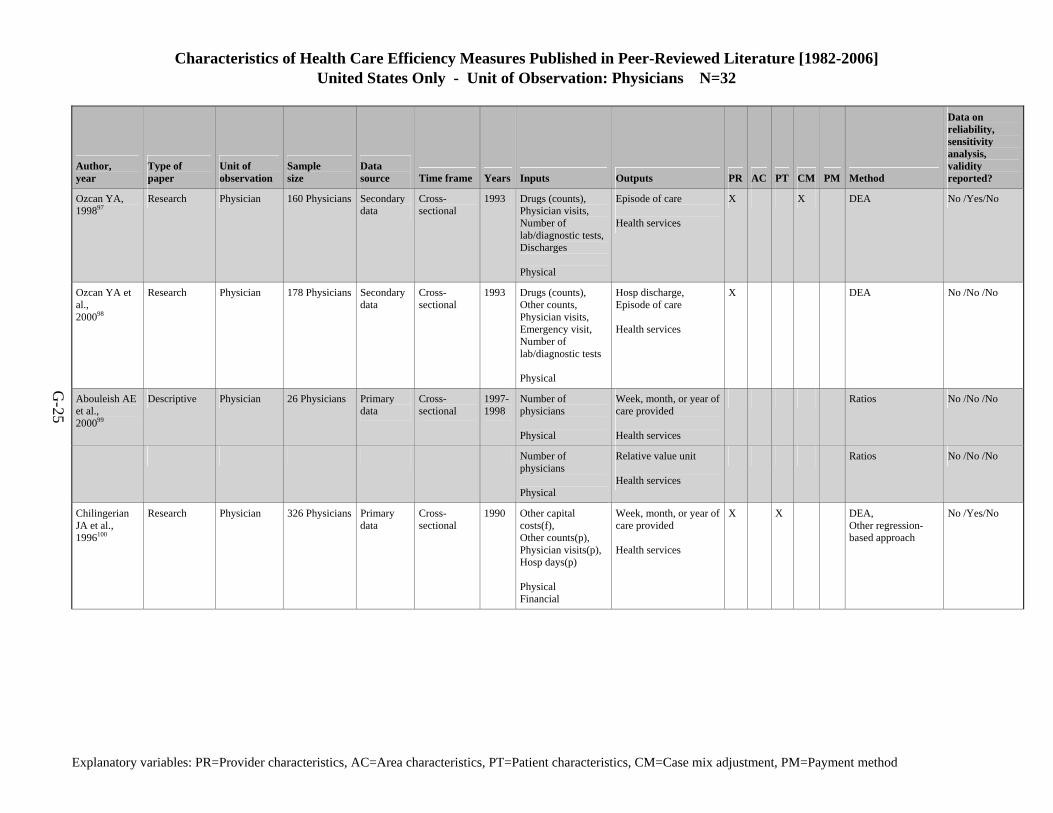
Characteristics of Health Care Efficiency Measures Published in Peer-Reviewed Literature [1982-2006] United States Only - Unit of Observation: Physicians N=32
Explanatory variables: PR=Provider characteristics, AC=Area characteristics, PT=Patient characteristics, CM=Case mix adjustment, PM=Payment method
G-25
Author, year
Type of paper
Unit of observation
Sample size
Data source Time frame Years Inputs Outputs PR AC PT CM PM Method
Data on reliability, sensitivity analysis, validity reported?
Ozcan YA, 199897
Research Physician 160 Physicians Secondary data
Cross- sectional
1993 Drugs (counts), Physician visits, Number of lab/diagnostic tests,Discharges Physical
Episode of care Health services
X X DEA No /Yes/No
Ozcan YA et al., 200098
Research Physician 178 Physicians Secondary data
Cross- sectional
1993 Drugs (counts), Other counts, Physician visits, Emergency visit, Number of lab/diagnostic tests Physical
Hosp discharge, Episode of care Health services
X DEA No /No /No
Abouleish AE et al., 200099
Descriptive Physician 26 Physicians Primary data
Cross- sectional
1997-1998
Number of physicians Physical
Week, month, or year of care provided Health services
Ratios No /No /No
Number of physicians Physical
Relative value unit Health services
Ratios No /No /No
Chilingerian JA et al., 1996100
Research Physician 326 Physicians Primary data
Cross- sectional
1990 Other capital costs(f), Other counts(p), Physician visits(p),Hosp days(p) Physical Financial
Week, month, or year of care provided Health services
X X DEA, Other regression-based approach
No /Yes/No
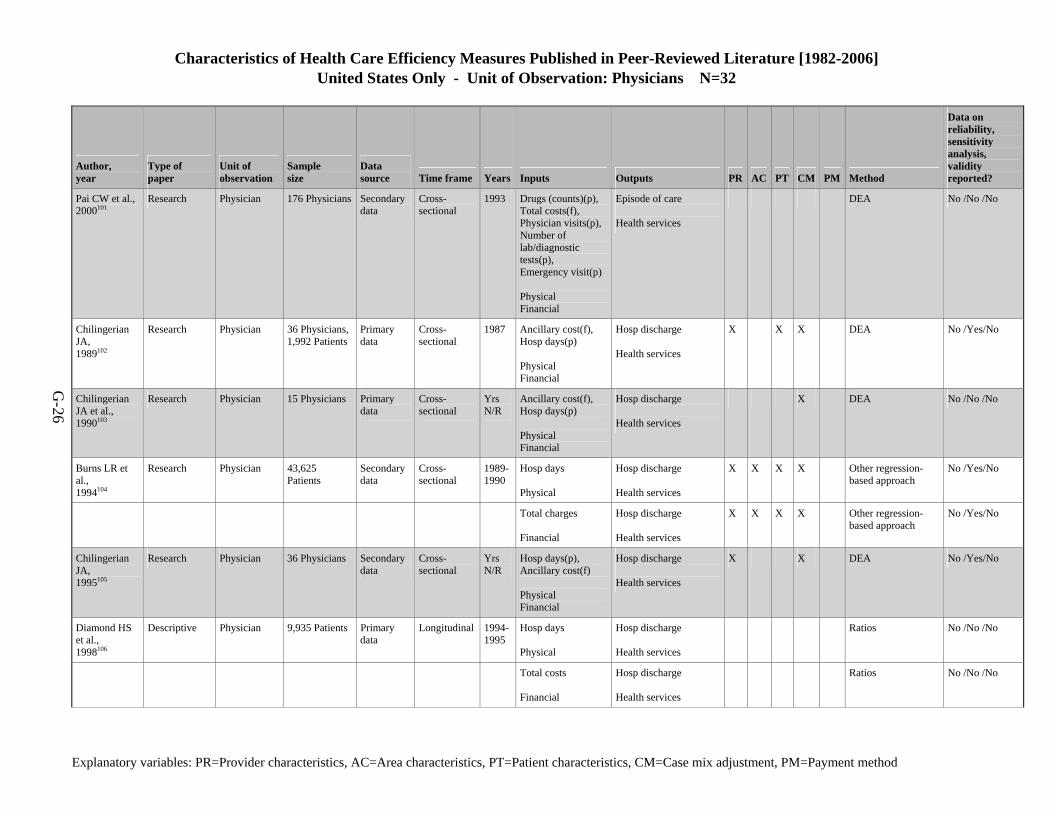
Characteristics of Health Care Efficiency Measures Published in Peer-Reviewed Literature [1982-2006] United States Only - Unit of Observation: Physicians N=32
Explanatory variables: PR=Provider characteristics, AC=Area characteristics, PT=Patient characteristics, CM=Case mix adjustment, PM=Payment method
G-26
Author, year
Type of paper
Unit of observation
Sample size
Data source Time frame Years Inputs Outputs PR AC PT CM PM Method
Data on reliability, sensitivity analysis, validity reported?
Pai CW et al., 2000101
Research Physician 176 Physicians Secondary data
Cross- sectional
1993 Drugs (counts)(p), Total costs(f), Physician visits(p),Number of lab/diagnostic tests(p), Emergency visit(p) Physical Financial
Episode of care Health services
DEA No /No /No
Chilingerian JA, 1989102
Research Physician 36 Physicians,1,992 Patients
Primary data
Cross- sectional
1987 Ancillary cost(f), Hosp days(p) Physical Financial
Hosp discharge Health services
X X X DEA No /Yes/No
Chilingerian JA et al., 1990103
Research Physician 15 Physicians Primary data
Cross- sectional
Yrs N/R
Ancillary cost(f), Hosp days(p) Physical Financial
Hosp discharge Health services
X DEA No /No /No
Burns LR et al., 1994104
Research Physician 43,625 Patients
Secondary data
Cross- sectional
1989-1990
Hosp days Physical
Hosp discharge Health services
X X X X Other regression-based approach
No /Yes/No
Total charges Financial
Hosp discharge Health services
X X X X Other regression-based approach
No /Yes/No
Chilingerian JA, 1995105
Research Physician 36 Physicians Secondary data
Cross- sectional
Yrs N/R
Hosp days(p), Ancillary cost(f) Physical Financial
Hosp discharge Health services
X X DEA No /Yes/No
Diamond HS et al., 1998106
Descriptive Physician 9,935 Patients Primary data
Longitudinal 1994-1995
Hosp days Physical
Hosp discharge Health services
Ratios No /No /No
Total costs Financial
Hosp discharge Health services
Ratios No /No /No
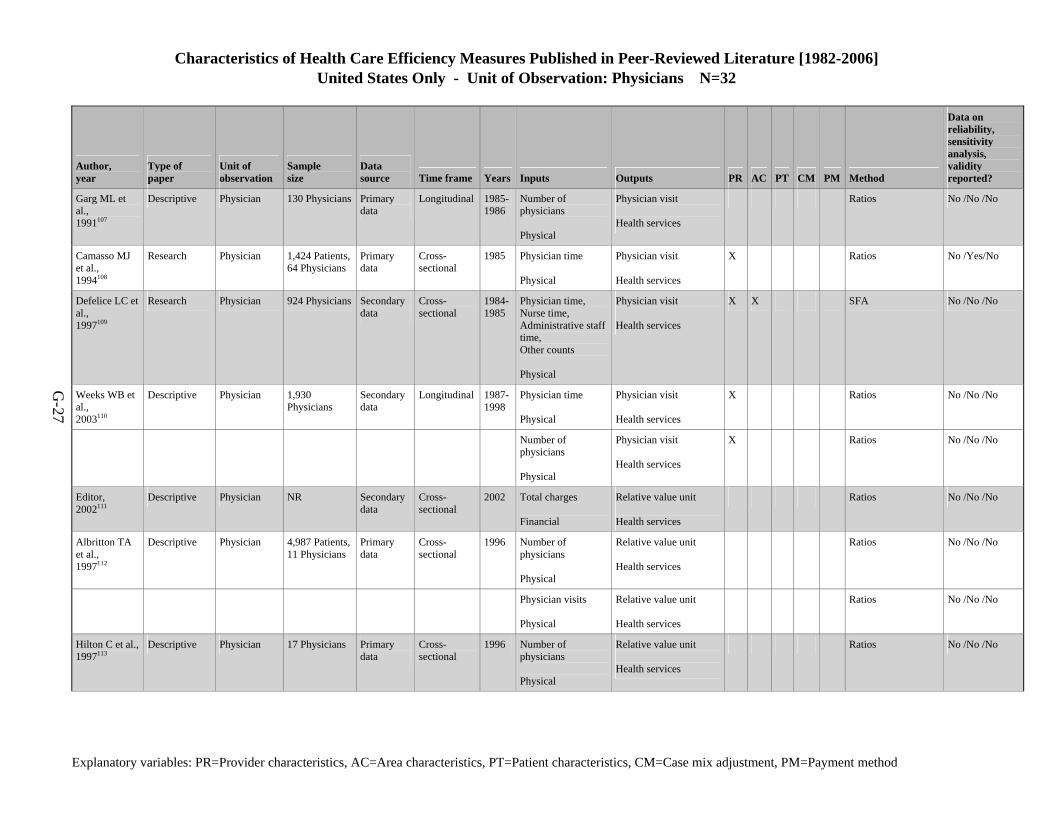
Characteristics of Health Care Efficiency Measures Published in Peer-Reviewed Literature [1982-2006] United States Only - Unit of Observation: Physicians N=32
Explanatory variables: PR=Provider characteristics, AC=Area characteristics, PT=Patient characteristics, CM=Case mix adjustment, PM=Payment method
G-27
Author, year
Type of paper
Unit of observation
Sample size
Data source Time frame Years Inputs Outputs PR AC PT CM PM Method
Data on reliability, sensitivity analysis, validity reported?
Garg ML et al., 1991107
Descriptive Physician 130 Physicians Primary data
Longitudinal 1985-1986
Number of physicians Physical
Physician visit Health services
Ratios No /No /No
Camasso MJ et al., 1994108
Research Physician 1,424 Patients,64 Physicians
Primary data
Cross- sectional
1985 Physician time Physical
Physician visit Health services
X Ratios No /Yes/No
Defelice LC et al., 1997109
Research Physician 924 Physicians Secondary data
Cross- sectional
1984-1985
Physician time, Nurse time, Administrative staff time, Other counts Physical
Physician visit Health services
X X SFA No /No /No
Weeks WB et al., 2003110
Descriptive Physician 1,930 Physicians
Secondary data
Longitudinal 1987-1998
Physician time Physical
Physician visit Health services
X Ratios No /No /No
Number of physicians Physical
Physician visit Health services
X Ratios No /No /No
Editor, 2002111
Descriptive Physician NR Secondary data
Cross- sectional
2002 Total charges Financial
Relative value unit Health services
Ratios No /No /No
Albritton TA et al., 1997112
Descriptive Physician 4,987 Patients,11 Physicians
Primary data
Cross- sectional
1996 Number of physicians Physical
Relative value unit Health services
Ratios No /No /No
Physician visits Physical
Relative value unit Health services
Ratios No /No /No
Hilton C et al., 1997113
Descriptive Physician 17 Physicians Primary data
Cross- sectional
1996 Number of physicians Physical
Relative value unit Health services
Ratios No /No /No
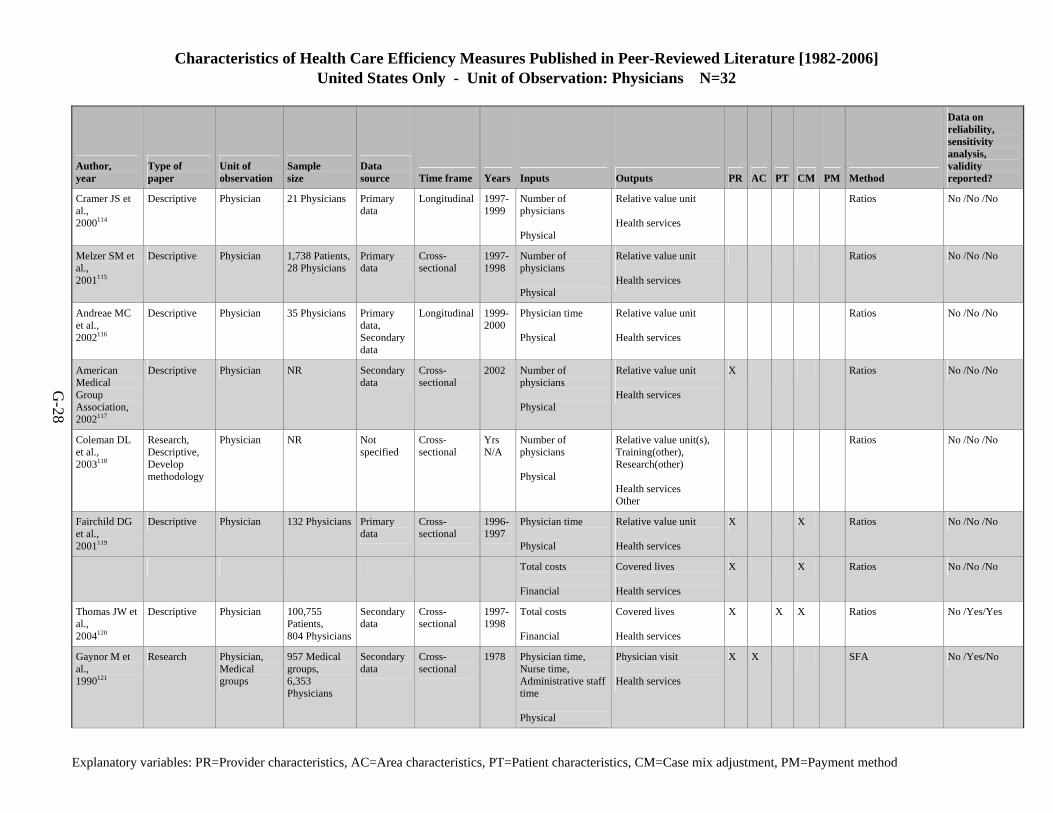
Characteristics of Health Care Efficiency Measures Published in Peer-Reviewed Literature [1982-2006] United States Only - Unit of Observation: Physicians N=32
Explanatory variables: PR=Provider characteristics, AC=Area characteristics, PT=Patient characteristics, CM=Case mix adjustment, PM=Payment method
G-28
Author, year
Type of paper
Unit of observation
Sample size
Data source Time frame Years Inputs Outputs PR AC PT CM PM Method
Data on reliability, sensitivity analysis, validity reported?
Cramer JS et al., 2000114
Descriptive Physician 21 Physicians Primary data
Longitudinal 1997-1999
Number of physicians Physical
Relative value unit Health services
Ratios No /No /No
Melzer SM et al., 2001115
Descriptive Physician 1,738 Patients,28 Physicians
Primary data
Cross- sectional
1997-1998
Number of physicians Physical
Relative value unit Health services
Ratios No /No /No
Andreae MC et al., 2002116
Descriptive Physician 35 Physicians Primary data, Secondary data
Longitudinal 1999-2000
Physician time Physical
Relative value unit Health services
Ratios No /No /No
American Medical Group Association, 2002117
Descriptive Physician NR Secondary data
Cross- sectional
2002 Number of physicians Physical
Relative value unit Health services
X Ratios No /No /No
Coleman DL et al., 2003118
Research, Descriptive, Develop methodology
Physician NR Not specified
Cross- sectional
Yrs N/A
Number of physicians Physical
Relative value unit(s), Training(other), Research(other) Health services Other
Ratios No /No /No
Fairchild DG et al., 2001119
Descriptive Physician 132 Physicians Primary data
Cross- sectional
1996-1997
Physician time Physical
Relative value unit Health services
X X Ratios No /No /No
Total costs Financial
Covered lives Health services
X X Ratios No /No /No
Thomas JW et al., 2004120
Descriptive Physician 100,755 Patients, 804 Physicians
Secondary data
Cross- sectional
1997-1998
Total costs Financial
Covered lives Health services
X X X Ratios No /Yes/Yes
Gaynor M et al., 1990121
Research Physician, Medical groups
957 Medical groups, 6,353 Physicians
Secondary data
Cross- sectional
1978 Physician time, Nurse time, Administrative staff time Physical
Physician visit Health services
X X SFA No /Yes/No
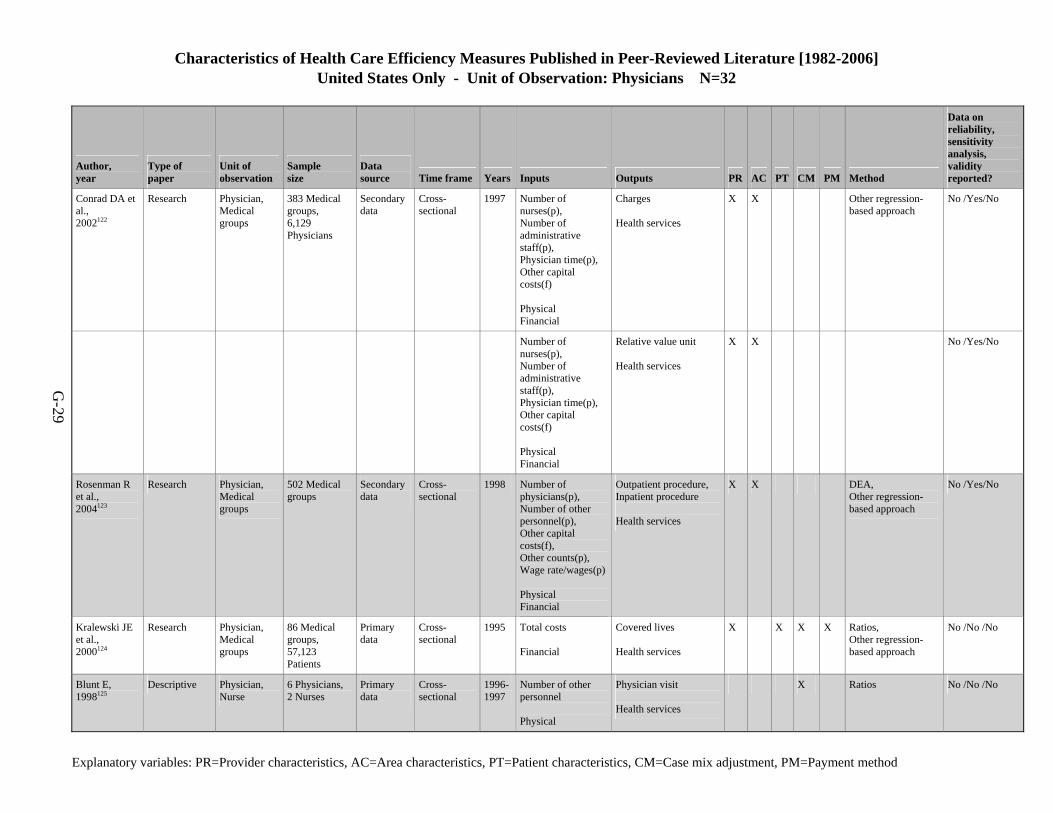
Characteristics of Health Care Efficiency Measures Published in Peer-Reviewed Literature [1982-2006] United States Only - Unit of Observation: Physicians N=32
Explanatory variables: PR=Provider characteristics, AC=Area characteristics, PT=Patient characteristics, CM=Case mix adjustment, PM=Payment method
G-29
Author, year
Type of paper
Unit of observation
Sample size
Data source Time frame Years Inputs Outputs PR AC PT CM PM Method
Data on reliability, sensitivity analysis, validity reported?
Conrad DA et al., 2002122
Research Physician, Medical groups
383 Medical groups, 6,129 Physicians
Secondary data
Cross- sectional
1997 Number of nurses(p), Number of administrative staff(p), Physician time(p), Other capital costs(f) Physical Financial
Charges Health services
X X Other regression-based approach
No /Yes/No
Number of nurses(p), Number of administrative staff(p), Physician time(p), Other capital costs(f) Physical Financial
Relative value unit Health services
X X No /Yes/No
Rosenman R et al., 2004123
Research Physician, Medical groups
502 Medical groups
Secondary data
Cross- sectional
1998 Number of physicians(p), Number of other personnel(p), Other capital costs(f), Other counts(p), Wage rate/wages(p) Physical Financial
Outpatient procedure, Inpatient procedure Health services
X X DEA, Other regression-based approach
No /Yes/No
Kralewski JE et al., 2000124
Research Physician, Medical groups
86 Medical groups, 57,123 Patients
Primary data
Cross- sectional
1995 Total costs Financial
Covered lives Health services
X X X X Ratios, Other regression-based approach
No /No /No
Blunt E, 1998125
Descriptive Physician, Nurse
6 Physicians, 2 Nurses
Primary data
Cross- sectional
1996-1997
Number of other personnel Physical
Physician visit Health services
X Ratios No /No /No
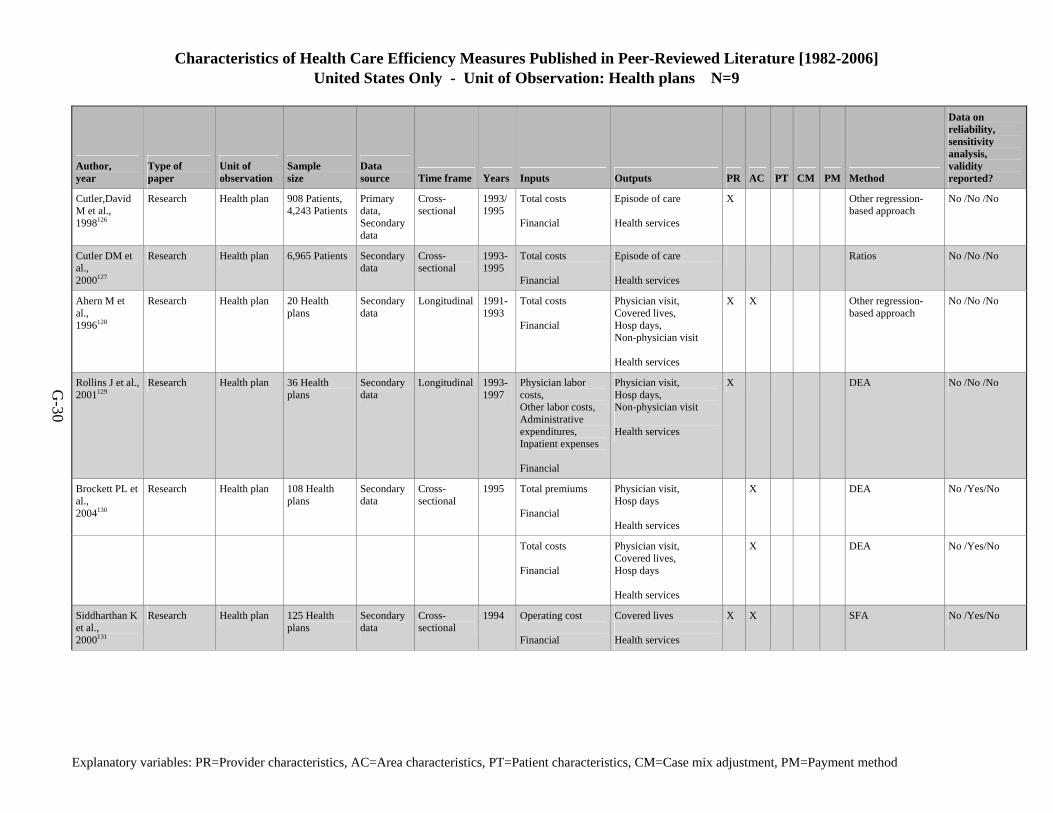
Characteristics of Health Care Efficiency Measures Published in Peer-Reviewed Literature [1982-2006] United States Only - Unit of Observation: Health plans N=9
Explanatory variables: PR=Provider characteristics, AC=Area characteristics, PT=Patient characteristics, CM=Case mix adjustment, PM=Payment method
G-30
Author, year
Type of paper
Unit of observation
Sample size
Data source Time frame Years Inputs Outputs PR AC PT CM PM Method
Data on reliability, sensitivity analysis, validity reported?
Cutler,David M et al., 1998126
Research Health plan 908 Patients, 4,243 Patients
Primary data, Secondary data
Cross- sectional
1993/1995
Total costs Financial
Episode of care Health services
X Other regression-based approach
No /No /No
Cutler DM et al., 2000127
Research Health plan 6,965 Patients Secondary data
Cross- sectional
1993-1995
Total costs Financial
Episode of care Health services
Ratios No /No /No
Ahern M et al., 1996128
Research Health plan 20 Health plans
Secondary data
Longitudinal 1991-1993
Total costs Financial
Physician visit, Covered lives, Hosp days, Non-physician visit Health services
X X Other regression-based approach
No /No /No
Rollins J et al., 2001129
Research Health plan 36 Health plans
Secondary data
Longitudinal 1993-1997
Physician labor costs, Other labor costs, Administrative expenditures, Inpatient expenses Financial
Physician visit, Hosp days, Non-physician visit Health services
X DEA No /No /No
Brockett PL et al., 2004130
Research Health plan 108 Health plans
Secondary data
Cross- sectional
1995 Total premiums Financial
Physician visit, Hosp days Health services
X DEA No /Yes/No
Total costs Financial
Physician visit, Covered lives, Hosp days Health services
X DEA No /Yes/No
Siddharthan K et al., 2000131
Research Health plan 125 Health plans
Secondary data
Cross- sectional
1994 Operating cost Financial
Covered lives Health services
X X SFA No /Yes/No
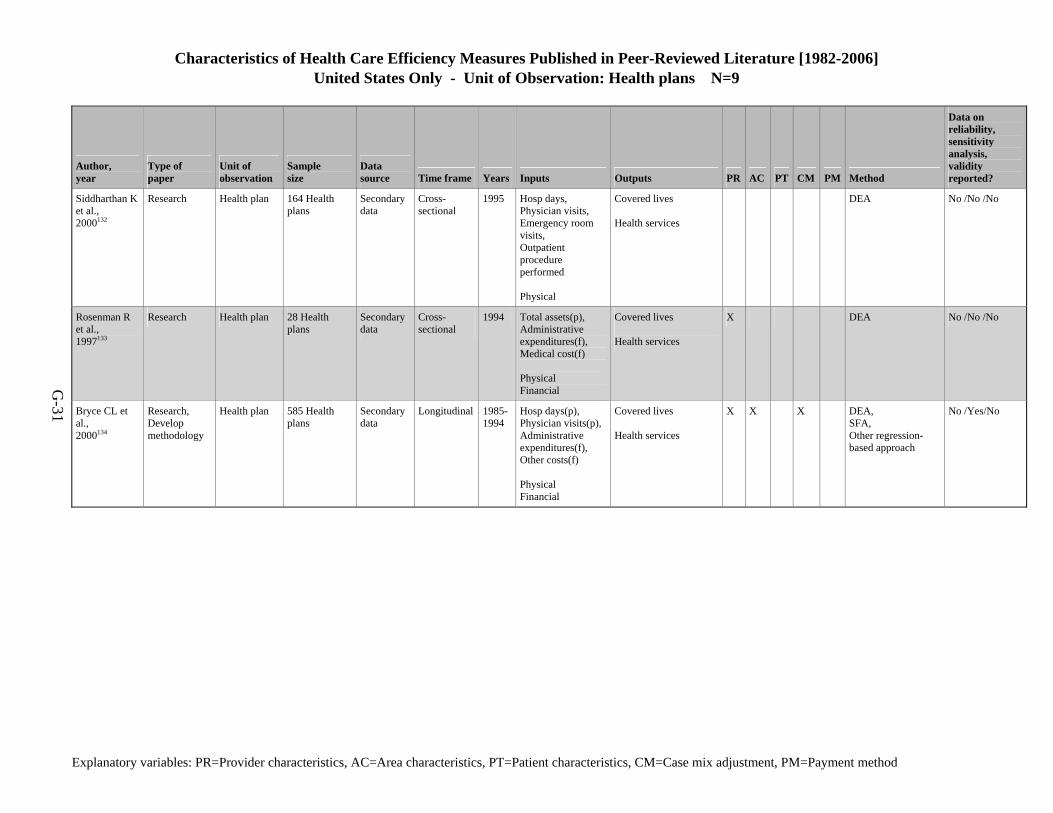
Characteristics of Health Care Efficiency Measures Published in Peer-Reviewed Literature [1982-2006] United States Only - Unit of Observation: Health plans N=9
Explanatory variables: PR=Provider characteristics, AC=Area characteristics, PT=Patient characteristics, CM=Case mix adjustment, PM=Payment method
G-31
Author, year
Type of paper
Unit of observation
Sample size
Data source Time frame Years Inputs Outputs PR AC PT CM PM Method
Data on reliability, sensitivity analysis, validity reported?
Siddharthan K et al., 2000132
Research Health plan 164 Health plans
Secondary data
Cross- sectional
1995 Hosp days, Physician visits, Emergency room visits, Outpatient procedure performed Physical
Covered lives Health services
DEA No /No /No
Rosenman R et al., 1997133
Research Health plan 28 Health plans
Secondary data
Cross- sectional
1994 Total assets(p), Administrative expenditures(f), Medical cost(f) Physical Financial
Covered lives Health services
X DEA No /No /No
Bryce CL et al., 2000134
Research, Develop methodology
Health plan 585 Health plans
Secondary data
Longitudinal 1985-1994
Hosp days(p), Physician visits(p),Administrative expenditures(f), Other costs(f) Physical Financial
Covered lives Health services
X X X DEA, SFA, Other regression-based approach
No /Yes/No
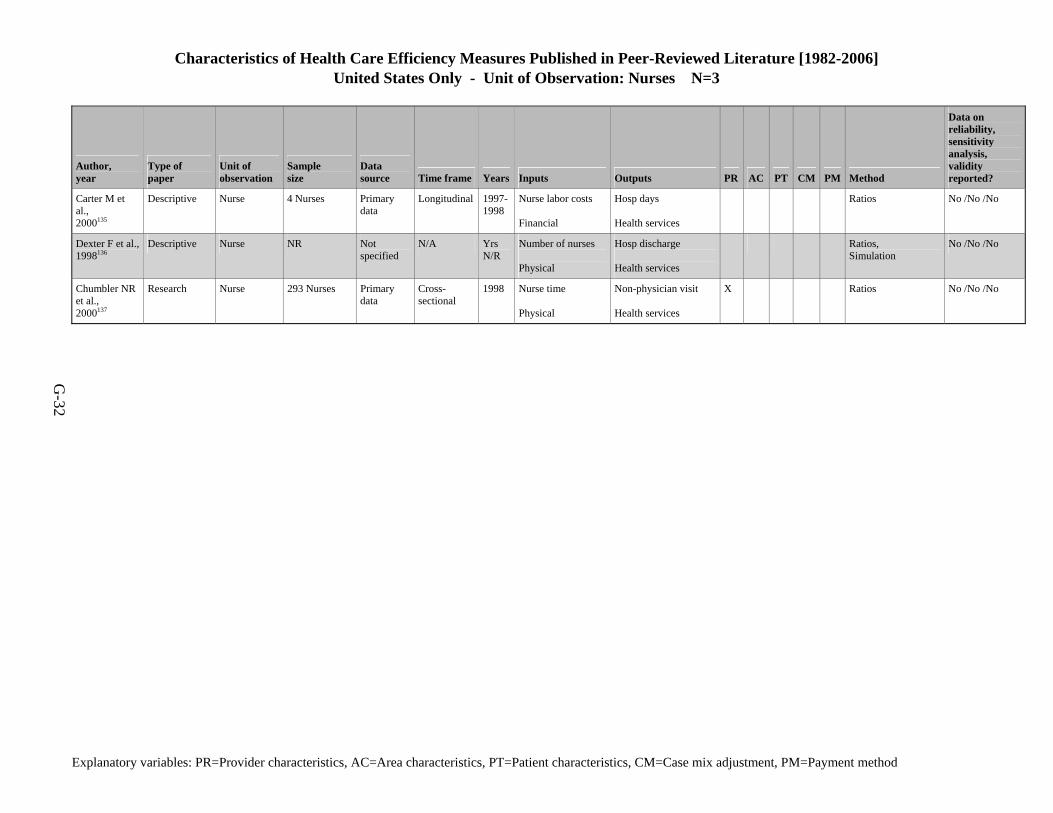
Characteristics of Health Care Efficiency Measures Published in Peer-Reviewed Literature [1982-2006] United States Only - Unit of Observation: Nurses N=3
Explanatory variables: PR=Provider characteristics, AC=Area characteristics, PT=Patient characteristics, CM=Case mix adjustment, PM=Payment method
G-32
Author, year
Type of paper
Unit of observation
Sample size
Data source Time frame Years Inputs Outputs PR AC PT CM PM Method
Data on reliability, sensitivity analysis, validity reported?
Carter M et al., 2000135
Descriptive Nurse 4 Nurses Primary data
Longitudinal 1997-1998
Nurse labor costs Financial
Hosp days Health services
Ratios No /No /No
Dexter F et al., 1998136
Descriptive Nurse NR Not specified
N/A Yrs N/R
Number of nurses Physical
Hosp discharge Health services
Ratios, Simulation
No /No /No
Chumbler NR et al., 2000137
Research Nurse 293 Nurses Primary data
Cross- sectional
1998 Nurse time Physical
Non-physician visit Health services
X Ratios No /No /No
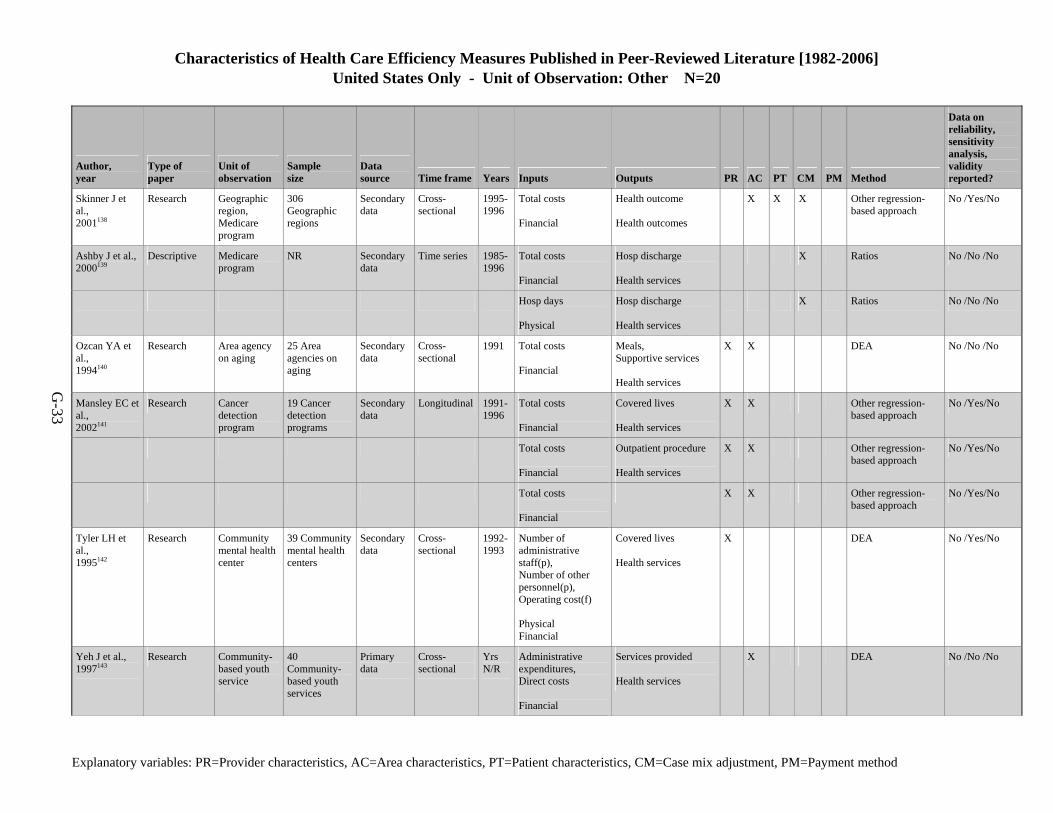
Characteristics of Health Care Efficiency Measures Published in Peer-Reviewed Literature [1982-2006] United States Only - Unit of Observation: Other N=20
Explanatory variables: PR=Provider characteristics, AC=Area characteristics, PT=Patient characteristics, CM=Case mix adjustment, PM=Payment method
G-33
Author, year
Type of paper
Unit of observation
Sample size
Data source Time frame Years Inputs Outputs PR AC PT CM PM Method
Data on reliability, sensitivity analysis, validity reported?
Skinner J et al., 2001138
Research Geographic region, Medicare program
306 Geographic regions
Secondary data
Cross- sectional
1995-1996
Total costs Financial
Health outcome Health outcomes
X X X Other regression-based approach
No /Yes/No
Ashby J et al., 2000139
Descriptive Medicare program
NR Secondary data
Time series 1985-1996
Total costs Financial
Hosp discharge Health services
X Ratios No /No /No
Hosp days Physical
Hosp discharge Health services
X Ratios No /No /No
Ozcan YA et al., 1994140
Research Area agency on aging
25 Area agencies on aging
Secondary data
Cross- sectional
1991 Total costs Financial
Meals, Supportive services Health services
X X DEA No /No /No
Mansley EC et al., 2002141
Research Cancer detection program
19 Cancer detection programs
Secondary data
Longitudinal 1991-1996
Total costs Financial
Covered lives Health services
X X Other regression-based approach
No /Yes/No
Total costs Financial
Outpatient procedure Health services
X X Other regression-based approach
No /Yes/No
Total costs Financial
X X Other regression-based approach
No /Yes/No
Tyler LH et al., 1995142
Research Community mental health center
39 Community mental health centers
Secondary data
Cross- sectional
1992-1993
Number of administrative staff(p), Number of other personnel(p), Operating cost(f) Physical Financial
Covered lives Health services
X DEA No /Yes/No
Yeh J et al., 1997143
Research Community-based youth service
40 Community-based youth services
Primary data
Cross- sectional
Yrs N/R
Administrative expenditures, Direct costs Financial
Services provided Health services
X DEA No /No /No

Characteristics of Health Care Efficiency Measures Published in Peer-Reviewed Literature [1982-2006] United States Only - Unit of Observation: Other N=20
Explanatory variables: PR=Provider characteristics, AC=Area characteristics, PT=Patient characteristics, CM=Case mix adjustment, PM=Payment method
G-34
Author, year
Type of paper
Unit of observation
Sample size
Data source Time frame Years Inputs Outputs PR AC PT CM PM Method
Data on reliability, sensitivity analysis, validity reported?
DiJerome L et al., 1999144
Descriptive Cost centers NR Data source N/A
N/A Yrs N/A
Other time Physical
Inpatient procedure Health services
Ratios No /No /No
Other time Physical
Hosp discharge Health services
Ratios No /No /No
Number of other personnel Physical
Inpatient procedure Health services
Ratios No /No /No
Number of other personnel Physical
Hosp discharge Health services
Ratios No /No /No
Other time Physical
Week, month, or year of care provided Health services
Ratios No /No /No
Productive manhours Physical
Inpatient procedure Health services
Ratios No /No /No
Productive manhours Physical
Hosp discharge Health services
Ratios No /No /No
Ozgen H et al., 2002145
Research Dialysis centers
791 Dialysis centers
Secondary data
Cross- sectional
1997 Number of physicians(p), Number of nurses(p), Number of other personnel(p), Equipment (counts)(p), Operating cost(f) Physical Financial
Outpatient procedure, Training, Home treatment Health services
X X DEA No /No /No
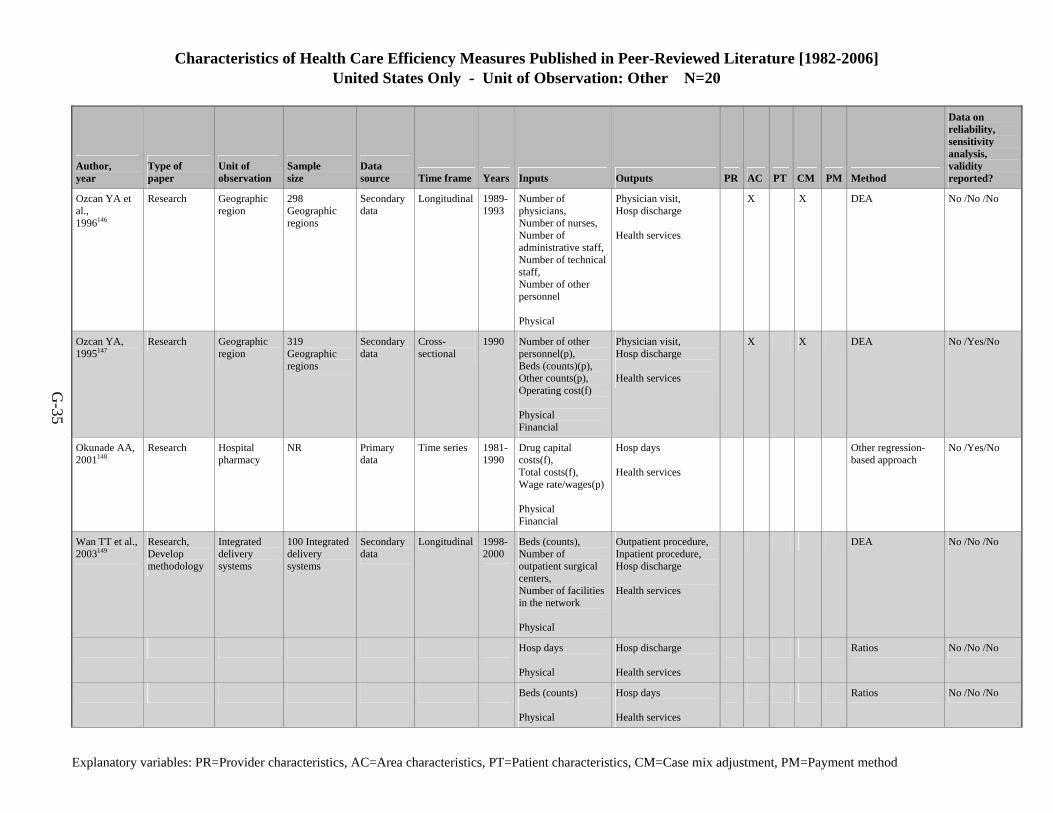
Characteristics of Health Care Efficiency Measures Published in Peer-Reviewed Literature [1982-2006] United States Only - Unit of Observation: Other N=20
Explanatory variables: PR=Provider characteristics, AC=Area characteristics, PT=Patient characteristics, CM=Case mix adjustment, PM=Payment method
G-35
Author, year
Type of paper
Unit of observation
Sample size
Data source Time frame Years Inputs Outputs PR AC PT CM PM Method
Data on reliability, sensitivity analysis, validity reported?
Ozcan YA et al., 1996146
Research Geographic region
298 Geographic regions
Secondary data
Longitudinal 1989-1993
Number of physicians, Number of nurses, Number of administrative staff,Number of technical staff, Number of other personnel Physical
Physician visit, Hosp discharge Health services
X X DEA No /No /No
Ozcan YA, 1995147
Research Geographic region
319 Geographic regions
Secondary data
Cross- sectional
1990 Number of other personnel(p), Beds (counts)(p), Other counts(p), Operating cost(f) Physical Financial
Physician visit, Hosp discharge Health services
X X DEA No /Yes/No
Okunade AA, 2001148
Research Hospital pharmacy
NR Primary data
Time series 1981-1990
Drug capital costs(f), Total costs(f), Wage rate/wages(p) Physical Financial
Hosp days Health services
Other regression-based approach
No /Yes/No
Wan TT et al., 2003149
Research, Develop methodology
Integrated delivery systems
100 Integrated delivery systems
Secondary data
Longitudinal 1998-2000
Beds (counts), Number of outpatient surgical centers, Number of facilities in the network Physical
Outpatient procedure, Inpatient procedure, Hosp discharge Health services
DEA No /No /No
Hosp days Physical
Hosp discharge Health services
Ratios No /No /No
Beds (counts) Physical
Hosp days Health services
Ratios No /No /No
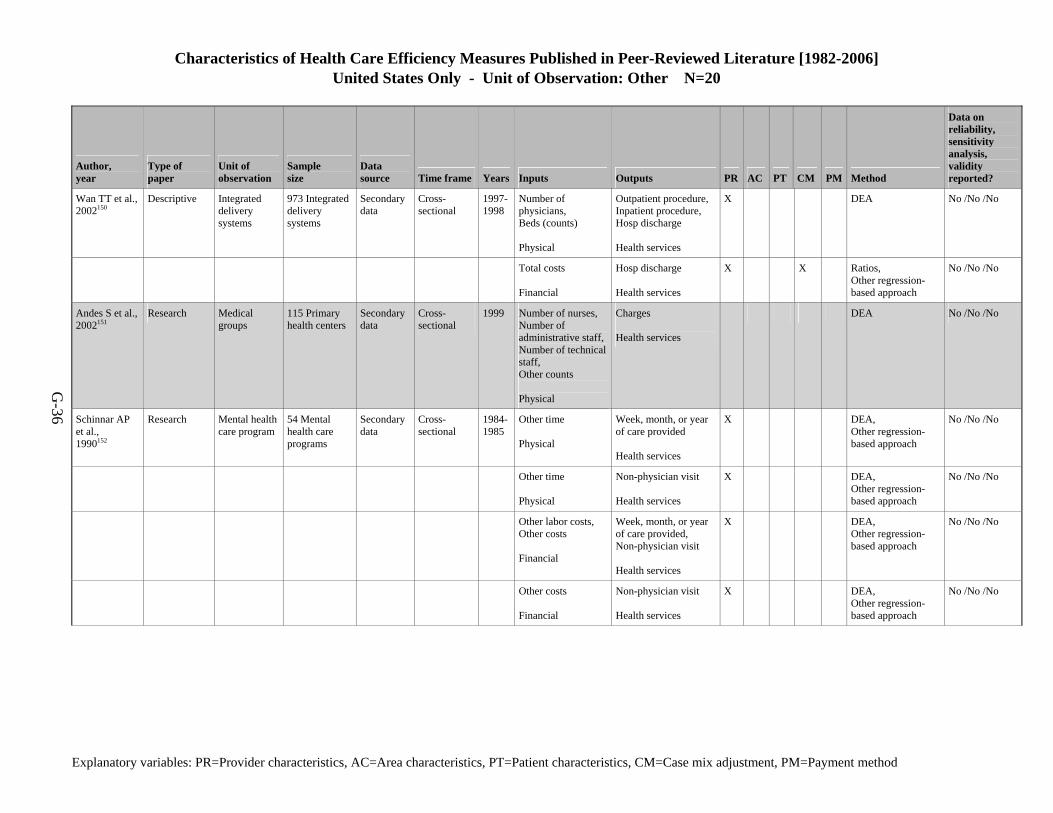
Characteristics of Health Care Efficiency Measures Published in Peer-Reviewed Literature [1982-2006] United States Only - Unit of Observation: Other N=20
Explanatory variables: PR=Provider characteristics, AC=Area characteristics, PT=Patient characteristics, CM=Case mix adjustment, PM=Payment method
G-36
Author, year
Type of paper
Unit of observation
Sample size
Data source Time frame Years Inputs Outputs PR AC PT CM PM Method
Data on reliability, sensitivity analysis, validity reported?
Wan TT et al., 2002150
Descriptive Integrated delivery systems
973 Integrated delivery systems
Secondary data
Cross- sectional
1997-1998
Number of physicians, Beds (counts) Physical
Outpatient procedure, Inpatient procedure, Hosp discharge Health services
X DEA No /No /No
Total costs Financial
Hosp discharge Health services
X X Ratios, Other regression-based approach
No /No /No
Andes S et al., 2002151
Research Medical groups
115 Primary health centers
Secondary data
Cross- sectional
1999 Number of nurses, Number of administrative staff,Number of technical staff, Other counts Physical
Charges Health services
DEA No /No /No
Schinnar AP et al., 1990152
Research Mental health care program
54 Mental health care programs
Secondary data
Cross- sectional
1984-1985
Other time Physical
Week, month, or year of care provided Health services
X DEA, Other regression-based approach
No /No /No
Other time Physical
Non-physician visit Health services
X DEA, Other regression-based approach
No /No /No
Other labor costs, Other costs Financial
Week, month, or year of care provided, Non-physician visit Health services
X DEA, Other regression-based approach
No /No /No
Other costs Financial
Non-physician visit Health services
X DEA, Other regression-based approach
No /No /No
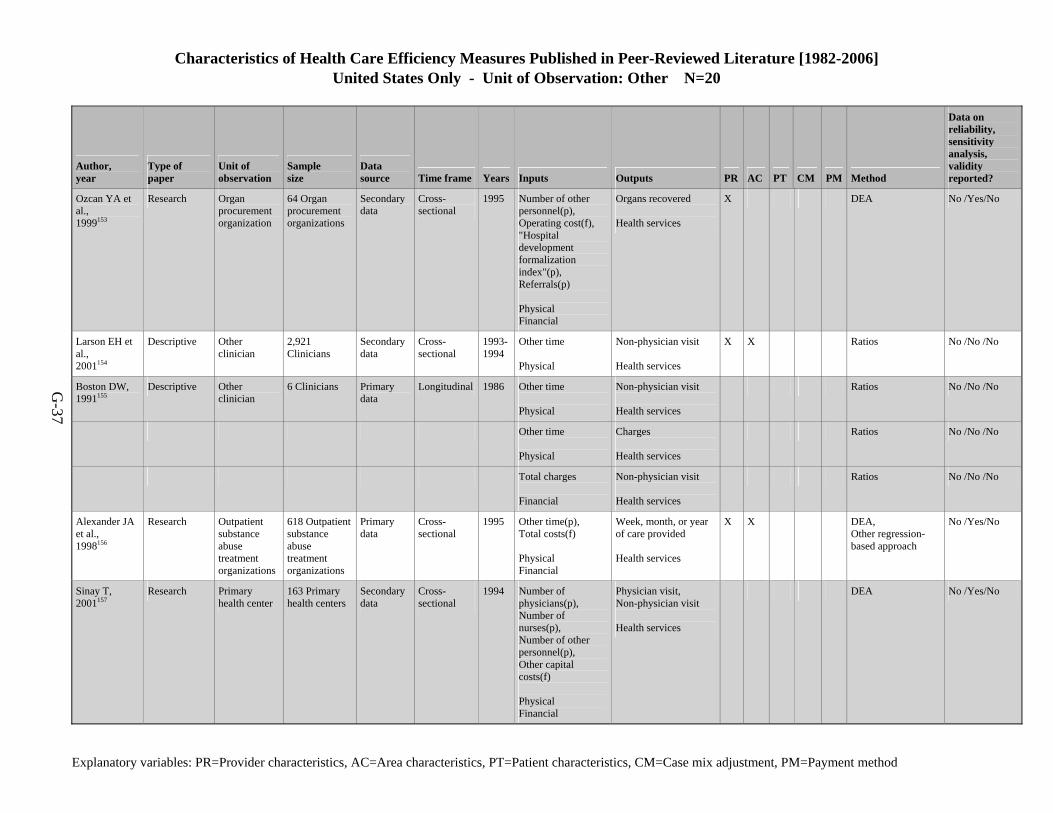
Characteristics of Health Care Efficiency Measures Published in Peer-Reviewed Literature [1982-2006] United States Only - Unit of Observation: Other N=20
Explanatory variables: PR=Provider characteristics, AC=Area characteristics, PT=Patient characteristics, CM=Case mix adjustment, PM=Payment method
G-37
Author, year
Type of paper
Unit of observation
Sample size
Data source Time frame Years Inputs Outputs PR AC PT CM PM Method
Data on reliability, sensitivity analysis, validity reported?
Ozcan YA et al., 1999153
Research Organ procurement organization
64 Organ procurement organizations
Secondary data
Cross- sectional
1995 Number of other personnel(p), Operating cost(f), "Hospital development formalization index"(p), Referrals(p) Physical Financial
Organs recovered Health services
X DEA No /Yes/No
Larson EH et al., 2001154
Descriptive Other clinician
2,921 Clinicians
Secondary data
Cross- sectional
1993-1994
Other time Physical
Non-physician visit Health services
X X Ratios No /No /No
Boston DW, 1991155
Descriptive Other clinician
6 Clinicians Primary data
Longitudinal 1986 Other time Physical
Non-physician visit Health services
Ratios No /No /No
Other time Physical
Charges Health services
Ratios No /No /No
Total charges Financial
Non-physician visit Health services
Ratios No /No /No
Alexander JA et al., 1998156
Research Outpatient substance abuse treatment organizations
618 Outpatient substance abuse treatment organizations
Primary data
Cross- sectional
1995 Other time(p), Total costs(f) Physical Financial
Week, month, or year of care provided Health services
X X DEA, Other regression-based approach
No /Yes/No
Sinay T, 2001157
Research Primary health center
163 Primary health centers
Secondary data
Cross- sectional
1994 Number of physicians(p), Number of nurses(p), Number of other personnel(p), Other capital costs(f) Physical Financial
Physician visit, Non-physician visit Health services
DEA No /Yes/No
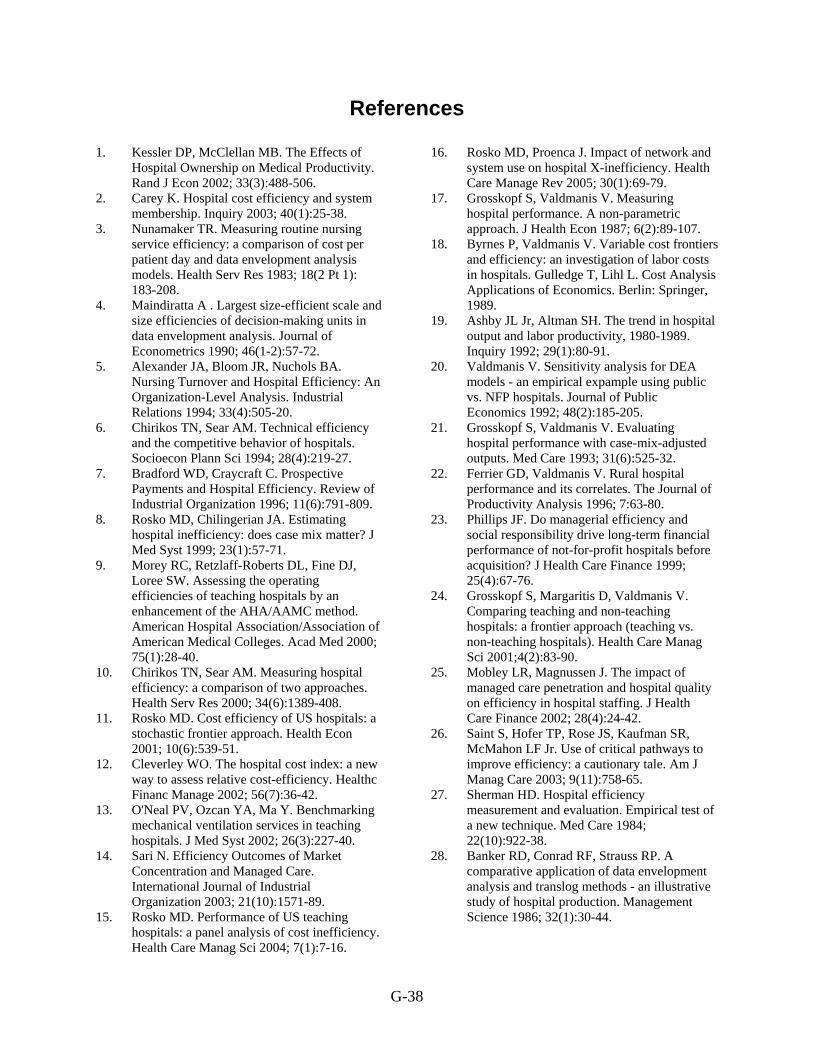
G-38
References
1. Kessler DP, McClellan MB. The Effects of Hospital Ownership on Medical Productivity. Rand J Econ 2002; 33(3):488-506.
2. Carey K. Hospital cost efficiency and system membership. Inquiry 2003; 40(1):25-38.
3. Nunamaker TR. Measuring routine nursing service efficiency: a comparison of cost per patient day and data envelopment analysis models. Health Serv Res 1983; 18(2 Pt 1): 183-208.
4. Maindiratta A . Largest size-efficient scale and size efficiencies of decision-making units in data envelopment analysis. Journal of Econometrics 1990; 46(1-2):57-72.
5. Alexander JA, Bloom JR, Nuchols BA. Nursing Turnover and Hospital Efficiency: An Organization-Level Analysis. Industrial Relations 1994; 33(4):505-20.
6. Chirikos TN, Sear AM. Technical efficiency and the competitive behavior of hospitals. Socioecon Plann Sci 1994; 28(4):219-27.
7. Bradford WD, Craycraft C. Prospective Payments and Hospital Efficiency. Review of Industrial Organization 1996; 11(6):791-809.
8. Rosko MD, Chilingerian JA. Estimating hospital inefficiency: does case mix matter? J Med Syst 1999; 23(1):57-71.
9. Morey RC, Retzlaff-Roberts DL, Fine DJ, Loree SW. Assessing the operating efficiencies of teaching hospitals by an enhancement of the AHA/AAMC method. American Hospital Association/Association of American Medical Colleges. Acad Med 2000; 75(1):28-40.
10. Chirikos TN, Sear AM. Measuring hospital efficiency: a comparison of two approaches. Health Serv Res 2000; 34(6):1389-408.
11. Rosko MD. Cost efficiency of US hospitals: a stochastic frontier approach. Health Econ 2001; 10(6):539-51.
12. Cleverley WO. The hospital cost index: a new way to assess relative cost-efficiency. Healthc Financ Manage 2002; 56(7):36-42.
13. O'Neal PV, Ozcan YA, Ma Y. Benchmarking mechanical ventilation services in teaching hospitals. J Med Syst 2002; 26(3):227-40.
14. Sari N. Efficiency Outcomes of Market Concentration and Managed Care. International Journal of Industrial Organization 2003; 21(10):1571-89.
15. Rosko MD. Performance of US teaching hospitals: a panel analysis of cost inefficiency. Health Care Manag Sci 2004; 7(1):7-16.
16. Rosko MD, Proenca J. Impact of network and system use on hospital X-inefficiency. Health Care Manage Rev 2005; 30(1):69-79.
17. Grosskopf S, Valdmanis V. Measuring hospital performance. A non-parametric approach. J Health Econ 1987; 6(2):89-107.
18. Byrnes P, Valdmanis V. Variable cost frontiers and efficiency: an investigation of labor costs in hospitals. Gulledge T, Lihl L. Cost Analysis Applications of Economics. Berlin: Springer, 1989.
19. Ashby JL Jr, Altman SH. The trend in hospital output and labor productivity, 1980-1989. Inquiry 1992; 29(1):80-91.
20. Valdmanis V. Sensitivity analysis for DEA models - an empirical expample using public vs. NFP hospitals. Journal of Public Economics 1992; 48(2):185-205.
21. Grosskopf S, Valdmanis V. Evaluating hospital performance with case-mix-adjusted outputs. Med Care 1993; 31(6):525-32.
22. Ferrier GD, Valdmanis V. Rural hospital performance and its correlates. The Journal of Productivity Analysis 1996; 7:63-80.
23. Phillips JF. Do managerial efficiency and social responsibility drive long-term financial performance of not-for-profit hospitals before acquisition? J Health Care Finance 1999; 25(4):67-76.
24. Grosskopf S, Margaritis D, Valdmanis V. Comparing teaching and non-teaching hospitals: a frontier approach (teaching vs. non-teaching hospitals). Health Care Manag Sci 2001;4(2):83-90.
25. Mobley LR, Magnussen J. The impact of managed care penetration and hospital quality on efficiency in hospital staffing. J Health Care Finance 2002; 28(4):24-42.
26. Saint S, Hofer TP, Rose JS, Kaufman SR, McMahon LF Jr. Use of critical pathways to improve efficiency: a cautionary tale. Am J Manag Care 2003; 9(11):758-65.
27. Sherman HD. Hospital efficiency measurement and evaluation. Empirical test of a new technique. Med Care 1984; 22(10):922-38.
28. Banker RD, Conrad RF, Strauss RP. A comparative application of data envelopment analysis and translog methods - an illustrative study of hospital production. Management Science 1986; 32(1):30-44.
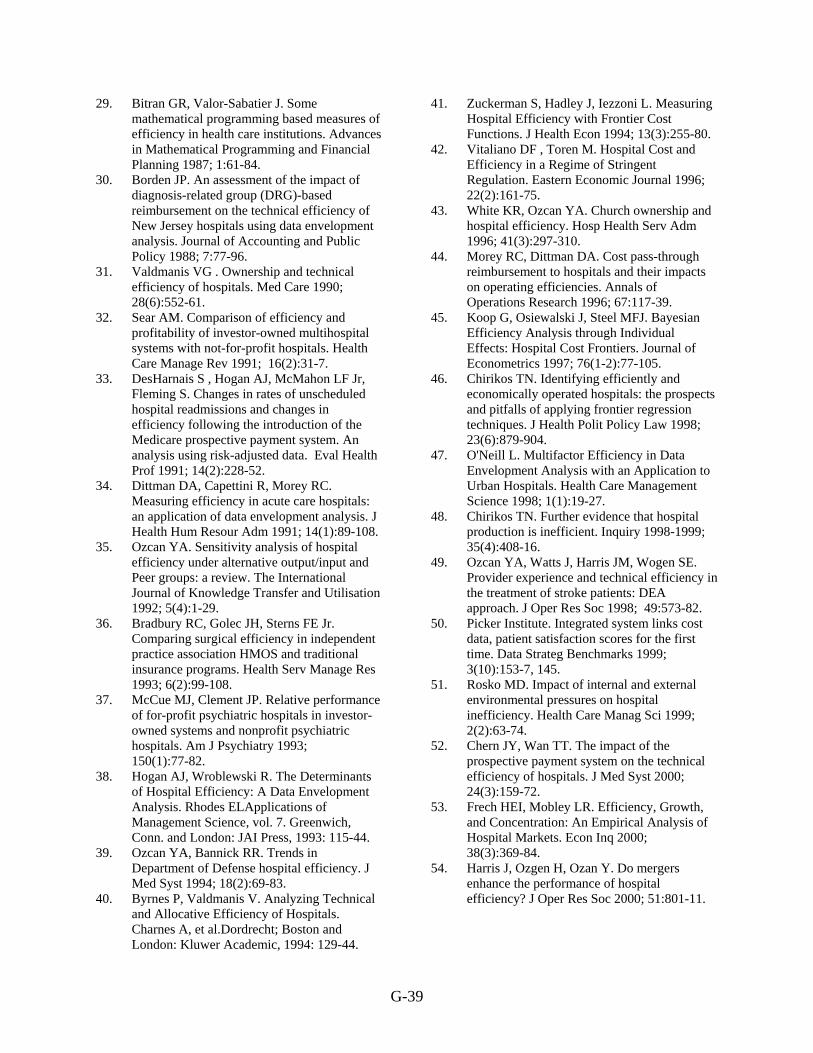
G-39
29. Bitran GR, Valor-Sabatier J. Some mathematical programming based measures of efficiency in health care institutions. Advances in Mathematical Programming and Financial Planning 1987; 1:61-84.
30. Borden JP. An assessment of the impact of diagnosis-related group (DRG)-based reimbursement on the technical efficiency of New Jersey hospitals using data envelopment analysis. Journal of Accounting and Public Policy 1988; 7:77-96.
31. Valdmanis VG . Ownership and technical efficiency of hospitals. Med Care 1990; 28(6):552-61.
32. Sear AM. Comparison of efficiency and profitability of investor-owned multihospital systems with not-for-profit hospitals. Health Care Manage Rev 1991; 16(2):31-7.
33. DesHarnais S , Hogan AJ, McMahon LF Jr, Fleming S. Changes in rates of unscheduled hospital readmissions and changes in efficiency following the introduction of the Medicare prospective payment system. An analysis using risk-adjusted data. Eval Health Prof 1991; 14(2):228-52.
34. Dittman DA, Capettini R, Morey RC. Measuring efficiency in acute care hospitals: an application of data envelopment analysis. J Health Hum Resour Adm 1991; 14(1):89-108.
35. Ozcan YA. Sensitivity analysis of hospital efficiency under alternative output/input and Peer groups: a review. The International Journal of Knowledge Transfer and Utilisation 1992; 5(4):1-29.
36. Bradbury RC, Golec JH, Sterns FE Jr. Comparing surgical efficiency in independent practice association HMOS and traditional insurance programs. Health Serv Manage Res 1993; 6(2):99-108.
37. McCue MJ, Clement JP. Relative performance of for-profit psychiatric hospitals in investor-owned systems and nonprofit psychiatric hospitals. Am J Psychiatry 1993; 150(1):77-82.
38. Hogan AJ, Wroblewski R. The Determinants of Hospital Efficiency: A Data Envelopment Analysis. Rhodes ELApplications of Management Science, vol. 7. Greenwich, Conn. and London: JAI Press, 1993: 115-44.
39. Ozcan YA, Bannick RR. Trends in Department of Defense hospital efficiency. J Med Syst 1994; 18(2):69-83.
40. Byrnes P, Valdmanis V. Analyzing Technical and Allocative Efficiency of Hospitals. Charnes A, et al.Dordrecht; Boston and London: Kluwer Academic, 1994: 129-44.
41. Zuckerman S, Hadley J, Iezzoni L. Measuring Hospital Efficiency with Frontier Cost Functions. J Health Econ 1994; 13(3):255-80.
42. Vitaliano DF , Toren M. Hospital Cost and Efficiency in a Regime of Stringent Regulation. Eastern Economic Journal 1996; 22(2):161-75.
43. White KR, Ozcan YA. Church ownership and hospital efficiency. Hosp Health Serv Adm 1996; 41(3):297-310.
44. Morey RC, Dittman DA. Cost pass-through reimbursement to hospitals and their impacts on operating efficiencies. Annals of Operations Research 1996; 67:117-39.
45. Koop G, Osiewalski J, Steel MFJ. Bayesian Efficiency Analysis through Individual Effects: Hospital Cost Frontiers. Journal of Econometrics 1997; 76(1-2):77-105.
46. Chirikos TN. Identifying efficiently and economically operated hospitals: the prospects and pitfalls of applying frontier regression techniques. J Health Polit Policy Law 1998; 23(6):879-904.
47. O'Neill L. Multifactor Efficiency in Data Envelopment Analysis with an Application to Urban Hospitals. Health Care Management Science 1998; 1(1):19-27.
48. Chirikos TN. Further evidence that hospital production is inefficient. Inquiry 1998-1999; 35(4):408-16.
49. Ozcan YA, Watts J, Harris JM, Wogen SE. Provider experience and technical efficiency in the treatment of stroke patients: DEA approach. J Oper Res Soc 1998; 49:573-82.
50. Picker Institute. Integrated system links cost data, patient satisfaction scores for the first time. Data Strateg Benchmarks 1999; 3(10):153-7, 145.
51. Rosko MD. Impact of internal and external environmental pressures on hospital inefficiency. Health Care Manag Sci 1999; 2(2):63-74.
52. Chern JY, Wan TT. The impact of the prospective payment system on the technical efficiency of hospitals. J Med Syst 2000; 24(3):159-72.
53. Frech HEI, Mobley LR. Efficiency, Growth, and Concentration: An Empirical Analysis of Hospital Markets. Econ Inq 2000; 38(3):369-84.
54. Harris J, Ozgen H, Ozan Y. Do mergers enhance the performance of hospital efficiency? J Oper Res Soc 2000; 51:801-11.

G-40
55. 100 Top Hospitals. Hospital benchmarks show clinical quality, efficiency are hallmarks of cost-effective care. Capitation Rates Data 2001; 6(5):55-8.
56. Brown HSI. Managed Care and Efficiency. Bridges JAustralian Studies in Health Service Administration, no. 89. Sydney: University of New South Wales School of Health Services Management, 2001: 57-64.
57. Folland ST, Hofler RA. How Reliable Are Hospital Efficiency Estimates? Exploiting the Dual to Homothetic Production. Health Econ 2001; 10(8):683-98.
58. Li T, Rosenman R. Cost inefficiency in Washington hospitals: a stochastic frontier approach using panel data. Health Care Manag Sci 2001; 4(2):73-81.
59. Rosko MD. Impact of HMO penetration and other environmental factors on hospital X-inefficiency. Med Care Res Rev 2001; 58(4):430-54.
60. Brown HS 3rd. Managed care and technical efficiency. Health Econ 2003; 12(2):149-58.
61. 100 Top Hospitals. Top hospitals show that quality, efficiency not always costly. Capitation Rates Data 2003; 8(11):131-2.
62. Chu HL, Liu SZ, Romeis JC. Does capitated contracting improve efficiency? Evidence from California hospitals. Health Care Manage Rev 2004; 29(4):344-52.
63. Jordan SD. Nursing productivity in rural hospitals. Nurs Manage 1994; 25(3):58-62.
64. Young ST. Multiple productivity measurement approaches for management. Health Care Manage Rev 1992; 17(2):51-8.
65. Bellin E, Kalkut G. Is time-slice analysis superior to total hospital length of stay in demonstrating the effectiveness of a month-long intensive effort on a medicine service? Qual Manag Health Care 2004; 13(2):143-9.
66. Mathiasen RA, Eby JB, Jarrahy R, Shahinian HK, Margulies DR. A dedicated craniofacial trauma team improves efficiency and reduces cost. J Surg Res 2001; 97(2):138-43.
67. Kyriacou DN, Ricketts V, Dyne PL, McCollough MD, Talan DA. A 5-year time study analysis of emergency department patient care efficiency. Ann Emerg Med 1999; 34(3):326-35.
68. Finkler MD, Wirtschafter DD. Cost-effectiveness and data envelopment analysis. Health Care Manage Rev 1993; 18(3):81-8.
69. Wilson GW, Jadlow JM. Competition, profit incentives, and technical efficiency in the provision of nuclear medicine services. Bell Journal of Economics 1982; 13(2):472-82.
70. Seltzer SE, Saini S, Bramson RT et al. Can academic radiology departments become more efficient and cost less? Radiology 1998; 209(2):405-10.
71. Sternick E. Productivity measurement in radiation oncology. Adm Radiol 1990; 9(10):80, 82-3.
72. Ozgen H, Ozcan YA, Santerre RE, Vernon JA. Longitudinal Analysis of Efficiency in Multiple Output Dialysis Markets Hospital Ownership Mix Efficiency in the US: An Exploratory Study. Health Care Management Science V7, N4 2004; (11192):253-61.
73. Starfield B, Powe NR, Weiner JR et al. Costs vs quality in different types of primary care settings. JAMA 1994; 272(24):1903-8.
74. Wang BB, Ozcan YA, Wan TT, Harrison J. Trends in hospital efficiency among metropolitan markets. J Med Syst 1999; 23(2):83-97.
75. Goodman DC, Stukel TA, Chang CH, Wennberg JE. End-of-life care at academic medical centers: implications for future workforce requirements. Health Aff (Millwood) 2006; 25(2):521-31.
76. Dewar DM, Lambrinos J. Does managed care more efficiently allocate resources to older patients in critical care settings? Cost Qual 2000; 6(2):18-26, 37.
77. Conrad D, Wickizer T, Maynard C et al. Managing care, incentives, and information: an exploratory look inside the "black box" of hospital efficiency. Health Serv Res 1996; 31(3):235-59.
78. Broyles RW. Efficiency, costs, and quality: the New Jersey experience revisited. Inquiry 1990; 27(1):86-96.
79. DeLia D, Cantor JC, Duck E. Productivity vs. training in primary care: analysis of hospitals and health centers in New York City. Inquiry 2002; 39(3):314-26.
80. Burgess JFJr , Wilson PW. Technical Efficiency in Veterans Administration Hospitals. Fried HO, Lovell CAK, Schmidt SSNew York; Oxford; Toronto and Melbourne: Oxford University Press, 1993: 335-51.
81. Hao S, Pegels CC. Evaluating relative efficiencies of Veterans Affairs Medical Centers using data envelopment, ratio, and multiple regression analysis. J Med Syst 1994; 18(2):55-67.
82. Burgess JFJr , Wilson PW. Decomposing Hospital Productivity Changes, 1985-1988: A Nonparametric Malmquist Approach. Journal of Productivity Analysis 1995; 6(4):343-63.
G-41
83. Burgess JF, Wilson PW. Hospital ownership and technical inefficiency. Management Science 1996; 42(1):110-23.
84. Burgess JF, Wilson PW. Variation in inefficiency among US hospitals. INFOR 1998; 36(3):84-102.
85. Bannick RR, Ozcan YA. Efficiency analysis of federally funded hospitals: comparison of DoD and VA hospitals using data envelopment analysis. Health Serv Manage Res 1995; 8(2):73-85.
86. Harrison JP, Ogniewski RJ. An efficiency analysis of Veterans Health Administration hospitals. Mil Med 2005; 170(7):607-11.
87. Sexton TR, Leiken AM, Nolan AH, Liss S, Hogan A, Silkman RH. Evaluating managerial efficiency of Veterans Administration medical centers using Data Envelopment Analysis. Med Care 1989; 27(12):1175-88.
88. Eastaugh SR. Hospital nurse productivity. J Health Care Finance 2002; 29(1):14-22.
89. Weingarten SR, Lloyd L, Chiou CF, Braunstein GD. Do subspecialists working outside of their specialty provide less efficient and lower-quality care to hospitalized patients than do primary care physicians? Arch Intern Med 2002; 162(5):527-32.
90. Auerbach AD, Wachter RM, Katz P, Showstack J, Baron RB, Goldman L. Implementation of a voluntary hospitalist service at a community teaching hospital: improved clinical efficiency and patient outcomes. Ann Intern Med 2002; 137(11):859-65.
91. Ghosh D, Alvis W. Efficient utilization of medical practice resources: a framework and case analysis. J Health Care Finance 2003; 30(1):41-8.
92. Brenn BR, Reilly JS, Deutsch ES, Hetrick MH, Cook SC. Analysis of efficiency of common otolaryngology operations: comparison of operating room vs short procedure room in a pediatric tertiary hospital. Arch Otolaryngol Head Neck Surg 2003; 129(4):435-7.
93. Ozcan YA, McCue MJ, Okasha AA. Measuring the technical efficiency of psychiatric hospitals. J Med Syst 1996; 20(3):141-50.
94. Thomas JW. Should episode-based economic profiles be risk adjusted to account for differences in patients' health risks? Health Serv Res 2006; 41(2):581-98.
95. Pope GC. Physician Inputs, Outputs, and Productivity, 1976-1986. Inquiry 1990; 27(2):151-60.
96. Chilingerian JA, Sherman HD. Benchmarking physician practice patterns with DEA: a multi-stage approach for cost containment. Annals of OPerations Research 1997; 67:83-116.
97. Ozcan YA. Physician benchmarking: measuring variation in practice behavior in treatment of otitis media. Health Care Manag Sci 1998; 1(1):5-17.
98. Ozcan YA, Jiang HJ, Pai CW. Do primary care physicians or specialists provide more efficient care? Health Serv Manage Res 2000; 13(2):90-6.
99. Abouleish AE, Zornow MH, Levy RS, Abate J, Prough DS. Measurement of individual clinical productivity in an academic anesthesiology department. Anesthesiology 2000; 93(6):1509-16.
100. Chilingerian JA, Sherman HD. DEA and primary care physician report cards: deriving preferred practice cones from managed care service concepts and operating strategies. Annals of Operations Research 1996; 73:35-66.
101. Pai CW, Ozcan YA, Jiang HJ. Regional variation in physician practice pattern: an examination of technical and cost efficiency for treating sinusitis. J Med Syst 2000; 24(2):103-17.
102. Chilingerian JA. Investigating non-medical factors associated with the technical efficiency of physicians in the provision of hospital services, a pilot study. Health Care Administration 1989; 85-9.
103. Chilingerian JA, Sherman HD. Managing physician efficiency and effectiveness in providing hospital services. Health Serv Manage Res 1990; 3(1):3-15.
104. Burns LR, Chilingerian JA, Wholey DR. The effect of physician practice organization on efficient utilization of hospital resources. Health Serv Res 1994; 29(5):583-603.
105. Chilingerian JA. Evaluating physician efficiency in hospitals-a multivariate-analysis of best practices. European Journal of Opereational Research 1995; 80(3):548-74.
106. Diamond HS, Goldberg E, Janosky JE. The effect of full-time faculty hospitalists on the efficiency of care at a community teaching hospital. Ann Intern Med 1998; 129(3):197-203.
107. Garg ML, Boero JF, Christiansen RG, Booher CG. Primary care teaching physicians' losses of productivity and revenue at three ambulatory-care centers. Acad Med 1991; 66(6):348-53.
G-42
108. Camasso MJ, Camasso AE. Practitioner productivity and the product content of medical care in publicly supported health centers. Soc Sci Med 1994; 38(5):733-48.
109. Defelice LC, Bradford WD. Relative inefficiencies in production between solo and group practice physicians. Health Econ 1997; 6(5):455-65.
110. Weeks WB, Wallace AE. Time and money: a retrospective evaluation of the inputs, outputs, efficiency, and incomes of physicians. Arch Intern Med 2003; 163(8):944-8.
111. Editor. Stats & facts. How is physician productivity measured? Manag Care Interface 2002; 15(9):62-3.
112. Albritton TA, Miller MD, Johnson MH, Rahn DW. Using relative value units to measure faculty clinical productivity. J Gen Intern Med 1997; 12(11):715-7.
113. Hilton C, Fisher W Jr, Lopez A, Sanders C. A relative-value-based system for calculating faculty productivity in teaching, research, administration, and patient care. Acad Med 1997; 72(9):787-93.
114. Cramer JS, Ramalingam S, Rosenthal TC, Fox CH. Implementing a comprehensive relative-value-based incentive plan in an academic family medicine department. Acad Med 2000; 75(12):1159-66.
115. Melzer SM, Molteni RA, Marcuse EK, Rivara FP. Characteristics and financial performance of a pediatric faculty inpatient attending service: a resource-based relative value scale analysis. Pediatrics 2001; 108(1):79-84.
116. Andreae MC, Freed GL. Using a productivity-based physician compensation program at an academic health center: a case study. Acad Med 2002; 77(9):894-9.
117. American Medical Group Association. Physician compensation, productivity still on the rise. Capitation Rates Data 2002; 7(8):85-7.
118. Coleman DL, Moran E, Serfilippi D et al. Measuring physicians' productivity in a Veterans' Affairs Medical Center. Acad Med 2003; 78(7):682-9.
119. Fairchild DG, McLoughlin KS, Gharib S et al. Productivity, quality, and patient satisfaction: comparison of part-time and full-time primary care physicians. J Gen Intern Med 2001; 16(10):663-7.
120. Thomas JW, Grazier KL, Ward K. Economic profiling of primary care physicians: consistency among risk-adjusted measures. Health Serv Res 2004; 39(4 Pt 1):985-1003.
121. Gaynor M, Pauly MV. Compensation and Productive Efficiency of Partnerships: Evidence from Medical Group Practice. Journal of Political Economy 1990; 98(3):544-73.
122. Conrad DA, et al. The Impact of Financial Incentives on Physician Productivity in Medical Groups. Health Serv Res 2002; 37(4):885-906.
123. Rosenman R, Friesner D. Scope and scale inefficiencies in physician practices. Health Econ 2004; 13(11):1091-116.
124. Kralewski JE, Rich EC, Feldman R et al. The effects of medical group practice and physician payment methods on costs of care. Health Serv Res 2000; 35(3):591-613.
125. Blunt E. Role and productivity of nurse practitioners in one urban emergency department. J Emerg Nurs 1998; 24(3):234-9.
126. Cutler DMMM , Newhouse JP. Price and Productivity in Managed Care Insurance. 1998.
127. Cutler DM, McClellan M, Newhouse JP. How does managed care do it? Rand J Econ 2000; 31(3):526-48.
128. Ahern M, et al. Predictors of HMO Efficiency. Applied Economics 1996; 28(11):1381-90.
129. Rollins J, Lee K, Xu Y, Ozcan YA. Longitudinal study of health maintenance organization efficiency. Health Serv Manage Res 2001; 14(4):249-62.
130. Brockett PL, et al. A Comparison of HMO Efficiencies as a Function of Provider Autonomy. J Risk Insur 2004; 71(1):1-19.
131. Siddharthan K, Ahem M, Rosenman R. Causes of cost inefficiency in HMOs. Int J Health Care Qual Assur Inc Leadersh Health Serv 2000; 13(4-5):162-9.
132. Siddharthan K, Ahern M, Rosenman R. Data envelopment analysis to determine efficiencies of health maintenance organizations. Health Care Manag Sci 2000; 3(1):23-9.
133. Rosenman R, Siddharthan K, Ahern M. Output efficiency of health maintenance organizations in Florida. Health Econ 1997; 6(3):295-302.
134. Bryce CL, Engberg JB, Wholey DR. Comparing the agreement among alternative models in evaluating HMO efficiency. Health Serv Res 2000; 35(2):509-28.
135. Carter M, Cox R. Nurse managers' use of a computer decision support system. Differences in nursing labor costs per patient day. Nurs Leadersh Forum 2000; 5(2):57-64.
G-43
136. Dexter F, Macario A, Dexter EU. Computer simulation of changes in nursing productivity from early tracheal extubation of coronary artery bypass graft patients. J Clin Anesth 1998; 10(7):593-8.
137. Chumbler NR, Geller JM, Weier AW. The effects of clinical decision making on nurse practitioners' clinical productivity. Eval Health Prof 2000; 23(3):284-305.
138. Skinner J, Fisher E, Wennberg JE. The Efficiency of Medicare. 2001.
139. Ashby J, Guterman S, Greene T. An analysis of hospital productivity and product change. Health Aff (Millwood) 2000; 19(5):197-205.
140. Ozcan YA, Cotter JJ. An assessment of efficiency of area agencies on aging in Virginia through data envelopment analysis. Gerontologist 1994; 34(3):363-70.
141. Mansley EC, Dunet DO, May DS, Chattopadhyay SK, McKenna MT. Variation in average costs among federally sponsored state-organized cancer detection programs: economies of scale? Med Decis Making 2002; 22(5 Suppl):S67-79.
142. Tyler LH, Ozcan YA, Wogen SE. Mental health case management and technical efficiency. J Med Syst 1995; 19(5):413-23.
143. Yeh J, White KR, Ozcan YA. Efficiency evaluation of community-based youth services in Virginia. Community Ment Health J 1997; 33(6):487-99.
144. DiJerome L, Dunham-Taylor J, Ash D, Brown R. Evaluating cost center productivity. Nurs Econ 1999; 17(6):334-40.
145. Ozgen H, Ozcan YA. A national study of efficiency for dialysis centers: an examination of market competition and facility characteristics for production of multiple dialysis outputs. Health Serv Res 2002; 37(3):711-32.
146. Ozcan YA, Yeh SC, McCollum D, Begun JW. Trends in labor efficiency among American hospital markets. Annals of Operations Research 1996; 67:61-81.
147. Ozcan YA. Efficiency of hospital-service production in local markets - the balance-sheet of US medical armament. Socio-Eocnomic Planning Sciences 1995; 29(2):139-50.
148. Okunade AA. Cost-Output Relation, Technological Progress, and Clinical Activity Mix of US Hospital Pharmacies. Journal of Productivity Analysis 2001; 16(2):167-93.
149. Wan TT, Wang BB. Integrated healthcare networks' performance: a growth curve modeling approach. Health Care Manag Sci 2003; 6(2):117-24.
150. Wan TT, Lin BY, Ma A. Integration mechanisms and hospital efficiency in integrated health care delivery systems. J Med Syst 2002; 26(2):127-43.
151. Andes S, Metzger LM, Kralewski J, Gans D. Measuring efficiency of physician practices using data envelopment analysis. Manag Care 2002; 11(11):48-54.
152. Schinnar AP, Kamis-Gould E, Delucia N, Rothbard AB. Organizational determinants of efficiency and effectiveness in mental health partial care programs. Health Serv Res 1990; 25(2):387-420.
153. Ozcan YA, Begun JW, McKinney MM. Benchmarking organ procurement organizations: a national study. Health Serv Res 1999; 34(4):855-74; discussion 875-8.
154. Larson EH, Hart LG, Ballweg R. National estimates of physician assistant productivity. J Allied Health 2001; 30(3):146-52.
155. Boston DW. Clinical productivity indicators for a dental general practice residency program. Spec Care Dentist 1991; 11(5):173-8.
156. Alexander JA, Wheeler JR, Nahra TA, Lemak CH. Managed care and technical efficiency in outpatient substance abuse treatment units. J Behav Health Serv Res 1998; 25(4):377-96.
157. Sinay T. Productive efficiency of rural health clinics: the Midwest experience. J Rural Health 2001; 17(3):239-50.
