icri 2011 convention presentation kurt l. salm, s.e., r.a. k. nam shiu, p.e., s.e. walker...
TRANSCRIPT

ICRI 2011 Convention Presentation
Kurt L. Salm, S.E., R.A.K. Nam Shiu, P.E., S.E.
Walker Restoration Consultants
Peter Foster, PhD., P.E.Malcolm Lim, P.E.
Universal Construction Testing

Full Scale Load Testfor
USPS Milwaukee Truck Maneuvering Area
July 21-24, 2008
Evaluations leading up to the testPlanning issues and logisticsLoad test media optionsTest procedures and code requirementsInstrumentationResults and conclusions

The Problem:
Badly deteriorated waffle slab built in 1965Serious doubts about actual load capacityLittle opportunity for routine maintenance (24/7 operations – no
shutdown time)Falling concrete debris a hazard to employees and cars parked below,
netting was installed below.

Worst case slab deterioration

Previous repair attempts failed

Section of Waffle Slab Reinforcing

The Players:
Walker Restoration – Prime Consultant to USPS
USPS operations & facilities design/construction staff (client representation)
Universal Construction Testing – Instrumentation
Nation Restoration Services – Contractor Assistance

Repair History
Numerous waffle stem repairs attempted over several years.
Walker designed top of slab repairs in 2002 Top 2” concrete replaced and new top steel in selected areas

Verification of topping and
reinforcement condition
• Cores show good concrete quality and no rebar corrosion
• No significant cracking, no spalling based in visual inspection

Evaluation of slab
Updated condition survey: May, 2008
Test area: 34’ x 36’ bay (2-way waffle slab)
Review of existing construction documents
Analysis of slab flexural capacity
278 psf working LL capacity by calculation
240 psf required LL
Deflection model in SAFE
0.42 inches at full test load
0.39 inches max per ACI 318, Ch. 20

SAFE Model
Deflection analysis for each load stage:
Load Stage
Max. Deflection
1 0.094
2 0.187
3 0.281
4 0.375
5 0.422
Test Planning
1. Explore load media options
Water
Solid media (brick pallets)
2. Impacts on time and cost
Availability of media in large quantity (430,000 pounds)
Lead time to obtain materials
Time involved to place load and remove
Shoring and safety considerations
Contractor time and cost to assemble and remove

Challenges with Water as Load MediumIssues with formwork design, details for waterproofing and accommodation of existing floor variations.Obtaining large volume in a reasonable amount of time.River water available, but polluted and had safe handling issues.Unknown silt quantity could make loading inaccurate.Fresh water from fire hydrant, but cost and available pressure was a factor (pressure loss in fire hose) given distance to nearest hydrant and height of test.Time to obtain permits and dealing with various regulatory agencies:Milw. Fire dept., WI Envir., Army COE, Milw. Streets & San.Water disposal permits also required.Possible extended time on site for set up and removal was a risk for USPS operations.Quantities: 6930 ft3 = 52,000 gal. = 5.7 ft high over test area.

Advantages of Brick Pavers as Load Medium
Wholesale brick supplier within 20 minutes of job site.Sufficient inventory was available.Skilled labor not required to set up (material handling with fork lifts).Trucking logistics and delivery were no issue.Pallets allowed accurate loading to within 1% of theoretical load.No permitting or public agency coordination required.Supplier agreed to “rent” material to our Contractor.Removal time was less than 6 hours.
With considerably less load, water becomes a viable alternative.

Select Test Location
Selection Criteria:
USPS operations restrictions such as loading docks that can be closed and keeping drive lane open at all times.
Worst case or nearly worst case condition

Test PlanningCoordination with All Players
Accommodate USPS operationsPlanning effort requires close coordination with contractor (our sub)Permitting agency compliance (water as loading media)Negotiate scope and fees with USPS and consultantsNegotiate limitation of liability (possible slab collapse)Propose and negotiate schedule with client and subconsultants

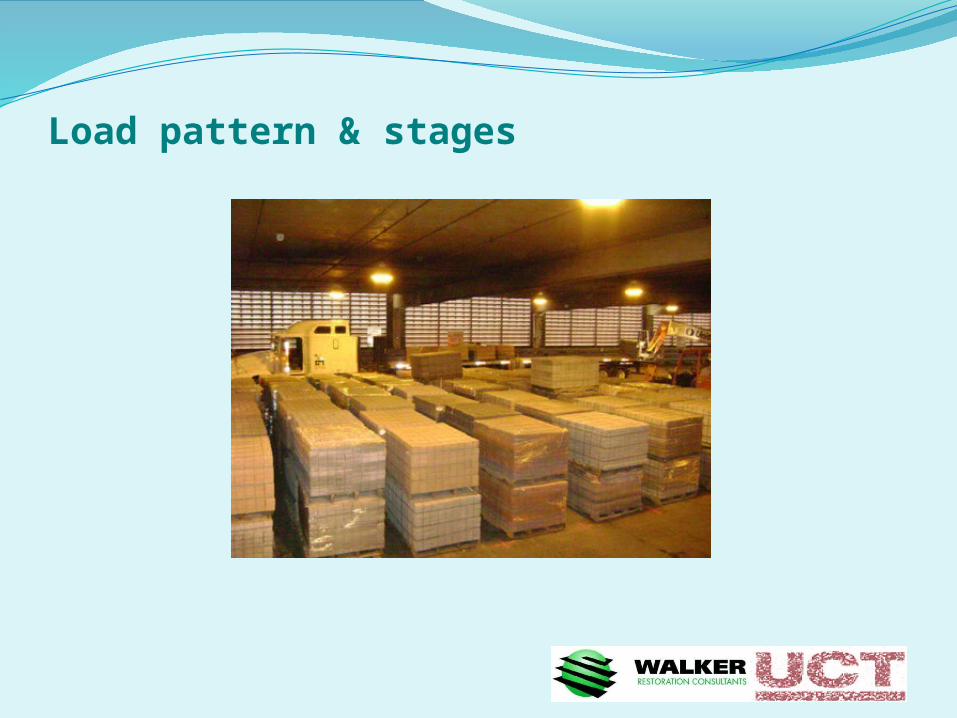
Brick pallets selected as load medium
Average weight per pallet = 3,209 lbs.

Load pattern & stages

Load pattern & stages

Load pattern & stages
Load pattern & stages

Final (5th) load stage
432,400 lbs.
Max. deflection = 0.279 inches (after 24hrs)

Load pattern & stages

Instrumentation Background
Goal was to provide accurate displacement measurements on a deteriorated, 2-way waffle slab throughout loading sequence.
Displacement transducers were placed symmetrically along midspan in both directions.
A total of nine (9) transducers were utilized. Two (2) traditional dial gages were also used.

Instrumentation BackgroundLow Voltage Displacement Transducers
Typical LVDT gauge Gauge placement

Instrumentation Background
Displacement transducers calibrated to 0.001 inches.
Transducers positioned below the test points and braided steel extension cables extended to the structure.
Each transducer was confirmed as perfectly vertical prior to the initiation of the load test.

Instrumentation Background
Displacement transducers calibrated to 0.001 inches.
Transducers positioned below the test points and braided steel extension cables extended to the structure.
Each transducer was confirmed as perfectly vertical prior to the initiation of the load test.

Instrumentation Background
Transducers connected to data acquisition hardware and signal monitored and recorded by customized data acquisition program.
Measurements taken at 15 seconds intervals throughout the entire loading program.
Represented approximately 18,000 data points.

Load Testing Protocol
Load test performed under the guidelines of ACI 318 Ch. 20.
Instrumentation was positioned and initialized prior to the application of load to obtain datum measurements.
Load media was incrementally applied in a balanced fashion.
Load was maintained for a period of 24 hours.

Load Testing Protocol
After 24 hours, load was removed and the structure allowed to rebound for an additional 24 hours.
Used to determine if structure remained elastic throughout loading sequence.
Recorded data analyzed to determine the elastic deformation over the loaded area.

Deflections noted at D3
0.00
0.05
0.10
0.15
0.20
0.25
0.30
Dis
pla
ce
me
nt
[in
.]
0.00
1.27
2.54
3.81
5.08
6.35
7.62
Dis
pla
ce
me
nt
[mm
]
Loading Load Hold Unloading Recovery
0.00
0.05
0.10
0.15
0.20
0.25
0.30
Dis
pla
ce
me
nt
[in
.]
0.00
1.27
2.54
3.81
5.08
6.35
7.62
Dis
pla
ce
me
nt
[mm
]
Loading Load Hold Unloading Recovery

Deflections noted at D1 and D5
RecoveryUnloading
0.00
0.01
0.02
0.03
0.04
0.05
0.06
0.07
0.08
0.09
0.10
Dis
pla
ce
me
nt
[in
.]
0.00
0.25
0.51
0.76
1.02
1.27
1.52
1.78
2.03
2.29
2.54
Dis
pla
ce
me
nt
[mm
]DT1 DT5
Loading Load Hold RecoveryUnloading
0.00
0.01
0.02
0.03
0.04
0.05
0.06
0.07
0.08
0.09
0.10
Dis
pla
ce
me
nt
[in
.]
0.00
0.25
0.51
0.76
1.02
1.27
1.52
1.78
2.03
2.29
2.54
Dis
pla
ce
me
nt
[mm
]DT1 DT5
Loading Load Hold

Deflections noted at D2, D4, D7 and D8
RecoveryUnloadingLoading Load Hold
0.00
0.05
0.10
0.15
0.20
0.25
0.30
Dis
pla
ce
me
nt
[in
.]
0.00
1.27
2.54
3.81
5.08
6.35
7.62
Dis
pla
ce
me
nt
[mm
]
DT2 DT4 DT7 DT8
RecoveryUnloadingLoading Load Hold
0.00
0.05
0.10
0.15
0.20
0.25
0.30
Dis
pla
ce
me
nt
[in
.]
0.00
1.27
2.54
3.81
5.08
6.35
7.62
Dis
pla
ce
me
nt
[mm
]
DT2 DT4 DT7 DT8

Deflections noted at D6 and D9
RecoveryUnloadingLoading Load Hold
0.00
0.05
0.10
0.15
0.20
0.25
Dis
pla
ce
me
nt
[in
.]
0.00
1.27
2.54
3.81
5.08
6.35
Dis
pla
ce
me
nt
[mm
]
DT6 DT9
RecoveryUnloadingLoading Load Hold
0.00
0.05
0.10
0.15
0.20
0.25
Dis
pla
ce
me
nt
[in
.]
0.00
1.27
2.54
3.81
5.08
6.35
Dis
pla
ce
me
nt
[mm
]
DT6 DT9

Ambient Temperature At Test
62
64
66
68
70
72
74
76
78
Ambient Temperature
Test Days
Tem
pera
ture
F

Results
Day 1: Load stages 1 and 2
Day 2: Load stages 3 thru 5
Day 3: Final deflection after 24 hours and rebound.
Slab passes test!Linear behaviorRebound < 25% of final Final < 0.39 in.Oh… and slab did not collapse – always a good thing…

Findings and ConclusionsCode prescribed load carrying capacity >
anticipated dead and live loading, w/ FS
Verification of available load carrying capacity, probabilistic approach
Bases to extend future service life

QUESTIONS?