icra 2012 sep mihir rakshit
TRANSCRIPT

43
I C R A B U L L E T I N
Money
Finance&
SEPTEMBER.2012
Keynes and the ContemporaryEconomic Crisis
MIHIR RAKSHIT
It were not best that we should all think alike; it is difference ofopinion that makes horse races.
Mark Twain
[W]orldly wisdom teaches us that it is better for reputation to failconventionally than to succeed unconventionally.
Keynes
I. IntroductionThe outbreak of the global economic and financial crisis in
2008 saw a resurrection of the Keynesian economics after its declineand near-total eclipse for nearly four decades. However, theresurrection turned out to be quite transitory. Since the recessionbottomed out and world economies started recovering from late 2009,1
the dominant perception concerning the problems facing the afflictednations and policies required for resolving them has shifteddramatically away from the Keynesian perspective. In this context itappears worthwhile to (a) examine how far Keynes’s ideas are usefulfor an understanding of the interplay of factors behind the currentcrisis; and (b) assess, in the light of (a), the efficacy of alternativepolicy programmes for its resolution.
Since the majority of present-day economists and policymakers do not seem to have an adequate appreciation of Keynes’s viewson macroeconomic theory and policy, as set forth in the GeneralTheory2 (Keynes, 1936), for ready reference and as a prelude to ourdiscussion in subsequent sections, we summarise some basic tenets ofthe Keynesian economics that are of especial relevance forcontemporary economic events.
The distinguishing feature of the Keynesian economics is its
1 Thanks to Keynesian policies, as we shall presently discuss.2 Henceforth all references from Keynes, unless stated otherwise, will be
from the General Theory.
Since the recession
bottomed out and
world economies
started recovering
from late 2009, the
dominant perception
concerning the
problems facing the
afflicted nations and
policies required for
resolving them has
shifted dramatically
away from the
Keynesian
perspective.

44
I C R A B U L L E T I N
Money
Finance&
SEPTEMBER.2012
refrain that the full employment equilibrium is an exception rather thanthe rule in a capitalist economy and that left to itself the economy isprone to wide fluctuations. This sets the Keynesian theory apart notonly from the (pre-Keynesian) neoclassical theory, but also from thecurrently ruling macroeconomic paradigm under which even withoutany policy intervention output and employment tend to hover close totheir full-employment (or “natural”) levels.3
Second, economic fluctuations are due primarily to volatility ofdemand for durable capital goods. In fact, a central theme of theGeneral Theory relates to “the extreme precariousness of the basis ofknowledge on which our estimates of prospective yield [on long-lastingassets] have to be made” (Keynes, p. 149). When such assets are madeliquid and easily marketable, even a hard-headed investor is guided bynear-term prospects of capital gains and losses. In well-organisedcapital markets these prospects in their turn are driven by speculators’endeavour4 at “foreseeing changes in the conventional basis ofvaluation a short time ahead of the general public” (p. 154).
Third, when investments are debt-financed—as they mostly arein developed market economies—both the borrower’s perception of riskconcerning the prospective yield and “the state of credit” or “theconfidence of lending institutions towards those who seek to borrowfrom them” (p. 158) are of overwhelming importance for the behaviourof the macroeconomy. “During the boom”, it is also emphasised, “thepopular estimation of both these risks, both borrower’s risk and lender’srisk, is apt to become imprudently low” (p. 145). The converse is truein times of depression.
Fourth, similarity of opinion regarding the future can be amajor source of instability and ineffectiveness of monetary policy incontrolling the activity of the economic system5: “. . . opinion aboutthe future of the rate of interest may be so unanimous that a smallchange in present rates may cause a mass movement into cash”
3 In the very first paragraph of the General Theory, Keynes, whileexplaining “the emphasis on the prefix general”, suggests: “…the postulates of theclassical theory are applicable to a special case only and not to the general case, thesituation which it assumes being a limiting point of the possible positions ofequilibrium. Moreover, the characteristics of the special case assumed by the classicaltheory happen not to be those of the economic society in which we actually live,with the result that its teaching is misleading and disastrous if we attempt to applyit to the facts of experience” (Keynes, p 3). So far as the temporal behaviour of theeconomy is concerned, Keynes’s conclusion is: “In conditions of laissez-faire theavoidance of wide fluctuations in employment may, therefore, prove impossiblewithout a far-reaching change in the psychology of investment markets such as thereis no reason to expect” (Keynes, p 320).
4 Keynes uses “the term speculation for the activity of forecasting thepsychology of the market, and the term enterprise for the activity of forecasting theprospective yield of assets over their whole life” (p 158).
5 “Thus this method of control”, Keynes observes, “is more precarious inthe United States, where everyone tends to hold the same opinion at the same time,than in England where differences of opinion are more usual” (p 172).
When investments
are debt-financed
both the borrower’s
perception of risk
concerning the
prospective yield
and the state of
credit or the
confidence of
lending institutions
towards those who
seek to borrow from
them are of
overwhelming
importance for the
behaviour of the
macroeconomy.

45
I C R A B U L L E T I N
Money
Finance&
SEPTEMBER.2012
(p. 172). As we shall presently note, unanimity of opinion regardingother prospective events could also be seriously destabilising.
Fifth, given the failure of the market mechanism incoordinating decisions of different groups of economic agents andensuring full employment of resources, macroeconomic outcomes areoften paradoxical and many a neoclassical conclusion, both analyticaland prescriptive, involves a serious fallacy of composition. Some of theimportant examples in this regard cited in the General Theory are theparadox of thrift, the output-enhancing effect of unproductive publicworks like digging holes and filling them up, and the folly of relying onmoney wage cuts as a means of reducing unemployment. In thisconnection Keynes (Ch. 19) also discusses at length why for boostingaggregate demand monetary policy is much superior to money wagecuts.6 Apart from the fact that the former is easier to implement,7 thelatter is liable to induce a deflation expectation, raise the burden ofdebt, and hence could be seriously counterproductive. Even monetarypolicy will however be of little avail when the economic downturn ischaracterised by high uncertainty and abnormally low privatepropensity to spend and flight to liquidity (pp. 207–8). Under theseconditions expansionary fiscal measures are imperative for revival ofthe economy.
Keeping the above and other related elements of the Keynesianeconomics in view we examine in the rest of the paper the operation ofvarious factors including policy interventions during the differentphases of the current crisis. Section II is devoted to tracing the roots ofthe crisis. This is followed in the next section by an analysis of therecessionary phase over 2008-9. An important (and apparently non-Keynesian) feature of the downturn was that, though the 2008 financialupheaval was of seismic proportions, the ensuing recession wasrelatively shallow and short, with the global economy experiencingrecovery from late 2009. Section III seeks to unearth the main reasonsbehind this fairly quick reversal of contractionary tendencies. The nextsection discusses why the revival was followed by a sharp slowdownand intensification of the crisis and focuses on some basic weaknessesof policy programmes being implemented for its resolution. The finalsection concludes.
Since the United States constituted the epicentre of the crisis,our analysis in the next three sections draws heavily on the behaviourof the US macroeconomy. However, given the close inter-countryfinancial and economic interlinkages and spiralling debt crisis in theeuro area, we also take into account how factors operating in other
6 Especially in a relatively closed economy.7 As Keynes notes, it is next to impossible to effect a proportionate
reduction in all money wages: given the structure of the labour market, a downwardadjustment in money wages will inevitably imply changes in relative wages evenwhen the demand deficiency is general, not sector-specific.
Keynes also
discusses at length
why for boosting
aggregate demand
monetary policy is
much superior to
money wage cuts.
Apart from the fact
that the former is
easier to implement,
the latter is liable to
induce a deflation
expectation, raise
the burden of debt,
and hence could be
seriously
counterproductive.

46
I C R A B U L L E T I N
Money
Finance&
SEPTEMBER.2012
major countries interacted with those in the US in intensifying ormitigating the crisis during its different phases.
II. Genesis of the CrisisThe genesis of the crisis does not, on the face of it, corroborate
the Keynesian thesis (Ch. 22). According to Keynes, it is the investment-cum-stock market booms and busts, driven by speculation rather thanlong-term fundamentals, that constitute the core of business cycles.8
Again, Keynes considers residential investments despite their durabilityand high risk to be less volatile.9 However, unlike in the case of theGreat Depression and contrary to Keynes’s observations concerning thecharacteristics of investment in housing, it was the home price bubblecoupled with financial excesses in the mortgage market that lay at theroots of the current crisis (Rakshit, 2008, 2009).
Though the genesis of the crisis was in the housing sectorrather than in other fixed investments, its behaviour closelycorresponded to the time profile of investment-cum-share market boomsand busts, as described in the General Theory. Note first that the realprice of a house10 should ideally depend on the prospective series ofreal rent during its lifetime (and the long-term interest). However, asShiller (2007) notes, between Q4 96 and Q1 06 real house prices rose byan unprecedented 86 per cent, but real rent remained practicallyunchanged, crawling up by only 4 per cent during the entire period.What is much more revealing, between Q1 02 and Q1 06, whenbullishness in the housing market was at its strongest, not only wasthere a sharp slowdown in the growth rate of real rent, but the level ofrent itself fell precipitously from Q2 04 onward (Table A.1). There canthus be little doubt that as in the run-up to the 1929 crash, home pricesduring Q4 96–Q1 06 were driven by near-term expectation of theirnorthward movement, not prospective yields during the lifetime ofresidential buildings.11 Again, since the effect of home prices on
8 As already noted in the previous section, a refrain of the General Theoryis the overwhelming role of share prices in driving private investment and theirextremely tenuous link with long-term fundamentals: “It is of the nature oforganised investment markets, under the influence of purchasers largely ignorant ofwhat they are buying and of speculators who are more concerned with forecastingthe next shift of market sentiment than with a reasonable estimate of the futureyield of capital-assets, that, when disillusion falls upon an over-optimistic and over-bought market, it should fall with sudden and even catastrophic force” (pp 315-6).
9 The reason advanced by Keynes is that the risk “can be frequentlytransferred from the investor to the occupier, or at least shared between them, bymeans of long-term contracts, the risk being outweighted in the mind of the occupierby the advantages of continuity and security of tenure”(p 163). The “risk” wouldalso be significantly less for investors keen to live in their own houses.
10 i.e., the value of a house in terms of its command over the quantum ofconsumer goods and services.
11 The magnitude of the home price bubble is indicated by Feldstein’sestimate that by 2006 the national real home price index reached a level 70 per centabove the equivalent real rent (Feldstein, 2007).
Though the genesis
of the crisis was in
the housing sector
rather than in other
fixed investments,
its behaviour closely
corresponded to the
time profile of
investment-cum-
share market booms
and busts, as
described in the
General Theory.

47
I C R A B U L L E T I N
Money
Finance&
SEPTEMBER.2012
residential investment is similar to but more significant than that ofshare prices on investment in machinery and equipment12 (as postulatedin the General Theory), for nearly a decade before the mid 2006, housebuilding became, to borrow from Keynes, “a by-product of theactivities of a casino” (p. 159).
Second, the mechanism through which the housing boomculminated in a crash closely corresponded to Keynes’s analysis of theshare market boom and bust: “. . . it is an essential characteristic of theboom that investments which will in fact yield, say, 2 per cent inconditions of a full employment are made in the expectation of a yieldof, say 6 per cent, and are valued accordingly. When the disillusioncomes this expectation is replaced by a contrary error of pessimism”(pp. 321–2). More to the point, large accumulation of capital inducedby a stock market bubble, Keynes observes in the context of the GreatDepression, cannot but end in such a disillusion: “New investmentduring the previous five years had been …on so enormous a scale thatthe prospective yield on further additions was, coolly considered,falling rapidly. Correct foresight would have brought down themarginal efficiency of capital to an unprecedentedly low figure; so thatthe ‘boom’ could not have continued on a sound basis” (p. 323).
The relentless fall in residential investment from 2006 onwardwas also preceded by a prolonged and exceptionally high residentialinvestment that tended to depress real rent and made the bustinevitable. Over 2001–05 not only did the (y-o-y) increase in growth ofresidential investment show a sharply rising trend, but the growth wasalso significantly higher than that of GDP and total capitalaccumulation. The result was that between 2000 and 2005 the ratio ofresidential investment to GDP and aggregate investment went up from4.5 and 21.6 per cent to 6.1 and 30.2 per cent respectively.Remembering that real rent depends on supply of housing in relationto incomes originating in other sectors of the economy (Rakshit, 2008),the disproportionately large increase in house building compared withthat in additions to other capital goods would inevitably depress theprospective return on residential investments even under fullemployment. The problem got exacerbated when the economicslowdown triggered by the fall in home prices in 2006 sent theprospective yield in the negative region and set the stage for ahousing-cum-economic meltdown, similar to the concerted declinein share prices, output and employment following the 1929 stockmarket crash.
12 Over the entire period, Q1 97–Q4 11, private non-residential andresidential investment were strongly correlated with share prices and home pricesrespectively; but while the correlation between growth rates of non-residentialinvestment and growth rates of the S&P 500 index was 0.70, that between temporalchanges in residential investment and the house price inflation amounted to 0.86.
The mechanism
through which the
housing boom
culminated in a
crash closely
corresponded to
Keynes’s analysis of
the share market
boom and bust.

48
I C R A B U L L E T I N
Money
Finance&
SEPTEMBER.2012
Some Economics of House Price BubbleThe natural question to ask at this stage is, why, contrary to
Keynes’s characterisation of residential investment, the behaviour of thehousing market from the late 1990s displayed all the hallmarks of thepre-1929 stock market. The answer, interestingly enough, is alsoKeynesian. Speculation (rather than “enterprise”) tends to become,according to Keynes, the predominant driver of those classes ofinvestment which are readily marketable or highly liquid13—somethingwhich investment in housing was not in Keynes’s days: the extremeilliquidity of mortgage loans with a duration of about 30 years,financial regulations and high transactions (including search) costs inthe housing market militated against large scale debt-financing ofspeculative investment in residential buildings.
By the 1990s however conditions in the housing and mortgagemarkets had changed radically. As we have documented elsewhere(Rakshit, 2008), since the early 1980s, legal, institutional andtechnological changes and financial innovations induced thereby madeboth mortgage loans and residential investments highly liquid.Deregulation of deposit rates,14 removal of ceilings on mortgage rates,abolition of the geographical boundary within which an individualmortgage lending agency had to operate,15 liberalization of the types ofmortgages that could be offered, sharp reductions (thanks to thecomputer-cum-information technology revolution) in the cost ofhandling enormous data for purposes of framing mortgages appropriateto the individual borrower’s credit-risk characteristics and developingeasily computable risk management models—all these led to game-changing financial innovations that not only boosted the flow ofmortgage loans, but also made them highly marketable through theirtransformation into collateralised debt obligations (CDOs) and otherstructured securities.16
No less important was the enormous increase in liquidity ofhouses themselves: apart from the fall in search costs to the near-zero
13 Keynes is categorical that his thesis regarding speculation (rather thanthe “genuine expectation of the professional entrepreneur”) “does not apply, ofcourse, to classes of enterprise which are not readily marketable or to which nonegotiable instrument closely corresponds”. Then he goes on to add, “The categoriesfalling within this exceptions were formerly extensive. But measured as a proportionof the total value of new investments they are rapidly declining in importance”(p. 151, fn 2).
14 Under the Depository Institutions Deregulatory and Monetary ControlAct, 1980.
15 Generally within a radius of 50 miles.16 It is interesting to note that around 90 per cent of a pool of subprime
mortgages, when bundled and tranched into CDOs, often earned an A or highercredit rating and found ready takers in the market even though each underlying loanwas illiquid and highly risky. The system of grading of mortgage-based securities(MBSs) enlarged the scope for highly leveraged investments in them through theissue of asset-backed commercial papers (ABCPs) or other short-term creditinstruments, and hence helped in deepening the market for MBSs and making themstill more liquid (to an individual investor).
Since the early
1980s, legal,
institutional and
technological
changes and
financial
innovations induced
thereby made both
mortgage loans and
residential
investments highly
liquid.

49
I C R A B U L L E T I N
Money
Finance&
SEPTEMBER.2012
level that the communication-cum-information-technology had effected,house owners could also avail of easy credit facility against their homeequity, the excess of the market value of a house over the amount ofmortgage loan outstanding. No wonder, with ever easier terms ofmortgage credit including an exceptionally high loan-to-value ratio,residential investment came to be dominated by near-term expectations,and the housing bubble during 1997–2006 assumed such unprecedentedproportions.
In view of the predominance of short-term expectations anddebt financing in the markets for housing and structured securities, theinteraction of factors magnifying the boom and bust was similar to thatdelineated in the General Theory (Ch. 22). The most important of thesefactors are: (a) the relation between speculation-driven asset prices andinvestment; (b) impact of debt-financed asset purchases on households’consumption propensities;17 and (c) large shifts in liquidity preferencein response to changes in expectations.
We have already noted how the boom and bust of residentialinvestment between 1997 and 2008 were closely related to surginghouse prices and their rapid decline. No less significant was the waypersonal consumption was driven by house price movements during thisperiod. As galloping home prices boosted households’ net worth, therewas a sharp rise in their consumption, very often financed throughborrowing against home equity. Between early 1998 and late 2005,when the real Case-Shiller (CS) index registered an increase of nearly120 per cent, personal consumption as a ratio of personal disposableincome displayed a pronounced upward trend, posting a rise of around4.5 percentage points (pps); however between Q4 05 and Q4 08, ashome prices were moving southward, the trend was in the oppositedirection and the decline in the ratio amounted to as much as 4.8 pps(Table A.1). Consider further the torrential flow of funds into themortgage and MBS markets between 1997 and 2006 and the flight toliquidity following the outbreak of the subprime crisis and demise ofLehman Brothers,18 and it is not difficult to appreciate howilluminating the General Theory analysis is in identifying the source ofthe crisis and the mechanism through which it got magnified.
Again, it was the utter oversight of basic Keynesian lessons onthe part of both regulatory authorities and agencies engaged infinancial innovations that led to their failure to appreciate how theinnovations were making the macroeconomic and financial systemhighly fragile. Before proceeding to the next phase of the crisis it thus
17 Speculators having easy access to credit are, Keynes notes, “even moreinfluenced in their readiness to spend by rises and falls in the value of theirinvestments than by the state of their income” (p 319).
18 Despite the fact that as soon as the crisis broke out the Federal Reserveand all other central banks, unlike in the early 1930s, started making huge injectionsof liquidity in a bid to revive inter-bank and other types of credit.
In view of the
predominance of
short-term
expectations and
debt financing in the
markets for housing
and structured
securities, the
interaction of factors
magnifying the
boom and bust was
similar to that
delineated in the
General Theory.

50
I C R A B U L L E T I N
Money
Finance&
SEPTEMBER.2012
seems worthwhile to highlight the fatal flaws in the financialengineering and comment on some fairly common misconceptionsconcerning the nature of policy failure in preventing the crisis.
Financial Engineering and the Crisis:Some Keynesian PerspectivesThe financial engineering, especially the large scale
transformation of high-risk, illiquid mortgage (and other) loans intohighly rated and easily marketable financial instruments, was designedto reduce the risk of extending credit for acquiring assets returns onwhich are uncertain and stretch over a period of 40-50 years. Thetransformation was aided by highly sophisticated models of riskassessment and grading of different categories of securities, vanilla aswell as synthetic. No less high-power were the risk assessment-cum-management models deployed by banks and other financial institutionsinvesting in these instruments. Paradoxically however, the instrumentsdesigned to reduce risk and strengthen the shock-absorptive capacity offinancial firms made them highly vulnerable and a major crisis waitingto happen.19
Resolution of the paradox is fairly straightforward once wetake cognizance of some of the Keynesian lessons, summarised in theintroductory section. The most important of these is the differencebetween the outcomes of individual and collective actions. Keyneshighlights in this connection “the fetish of liquidity” on the part ofinvestment institutions,20 oblivious of the fact “that there is no suchthing as liquidity of investment for the community as a whole” (p. 155,italics added). The relevance of this in the context of the current crisiscan hardly be overemphasised. Thus synthetic securities churned out ofhighly illiquid long-term mortgage loans were no doubt easilymarketable (at prevailing prices) so that for an individual financialentity investment in them financed through short-term loans would notseem to entail significant risk. But if all investors try to sell off thesecurities when large scale default on mortgage loans looms large,
19 Interestingly enough, during the bubble years households turned out tobe much more rational than hard-headed bankers and credit rating agenciesrenowned for their number crunching abilities. Given the extremely high loan-to-value ratio of mortgages, sharply rising house prices and exceptionally low teaserrates (for the initial two-three years), investment in housing was “speculative” (inthe Keynesian sense), but far from irrational: a rise in house prices would effect adisproportionately large increase in house equity, which as already noted was highlyliquid; and the loss on account of a steep fall in house prices would on the otherhand be relatively small, considering (a) the rent (explicit or implicit) enjoyed beforethe foreclosure, and (b) the fact that when the home equity had turned negative,households could walk away from mortgage liabilities without incurring any loss onother assets.
20 Keynes focuses on the anti-social nature of the fetish in view of the factthat “The social object of skilled investment should be to defeat the dark forces oftime and ignorance which envelop our future” (p. 155).
Paradoxically, the
instruments
designed to reduce
risk and strengthen
the shock-
absorptive capacity
of financial firms
made them highly
vulnerable and a
major crisis waiting
to happen.
51
I C R A B U L L E T I N
Money
Finance&
SEPTEMBER.2012
security prices would nosedive, supply of short-term loans dry up andthe “liquidity” of MBSs prove illusory.
More generally, models developed by banks for assessing andmanaging risk as also those deployed by credit rating agencies forgrading MBSs were partial in nature and did not, contrary to Keynes’steachings, take into account the interaction between the financial andreal sectors of the economy or the macroeconomic consequences oflarge scale adoption of the financial innovations. To illustrate, the highcredit ratings assigned to MBSs and their increasing share in financialfirms’ portfolio were due primarily to the fact that (i) estimates of creditrisks were based on data when default rates on all mortgage loans werecoming down sharply; and (ii) the probability of default on the part ofborrowers with different credit characteristics was taken to be largelyindependent. There was thus little cognizance of the fact that:
(a) the decline in default rates was the inevitable outcome of theunabated house price inflation from 1997 onward and theexceptionally easy credit facilities against home equity;
(b) the huge flow of funds into the mortgage market itself helped insustaining the housing bubble, creating a feedback loopbetween home prices, default rates and mortgage loans; and
(c) the rising investments in residential construction along withthat in furniture, fittings, etc., through the multiplier and theirpositive impact on investment in other sectors, boostedaggregate output and employment and hence reduced defaulton all types of credit. No wonder, the models proved so ruinousfor financial firms and the macroeconomy.21
An important reason why the financial engineering sans anappropriate macro-theoretic framework had such enormousconsequences for the bubble and the bust was the near-identity of themodels behind the engineering. As noted in Section I, Keynes identifiessimilarity of opinion concerning the future as an important factorcausing instability in the system, magnifying the amplitude offluctuations and robbing anti-cyclical monetary measures of much oftheir cutting edge. With banks and financial firms using basically thesame models/manuals for deciding on investments, their sources offinance and risk management, the agents’ behaviour became practicallyidentical. The result was a scramble for MBSs when the housing market
21 The serious limitations of these models and the near-total absence of anyKeynesian perspective in their assessment in most quarters are attested by the resultsof the stress tests undertaken by many financial firms in early 2007 and by the IMFreading (IMF, 2007) of the ongoing troubles in the mortgage market: “this weaknesshas been confined to certain portions of the subprime market (and, to a lesser extent,the Alt-A market), and is not likely to pose a serious systemic threat. Stress testsconducted by investment banks show that even under scenarios of nationwide houseprice declines that are historically unprecedented, most investors with exposure tosubprime mortgages through securitized structures will not face losses”.
The huge flow of
funds into the
mortgage market
itself helped in
sustaining the
housing bubble,
creating a feedback
loop between home
prices, default rates
and mortgage loans.
52
I C R A B U L L E T I N
Money
Finance&
SEPTEMBER.2012
was having a bull run and a stampede to exit no sooner had the homeprice inflation turned negative.22
Policy Failure in Preventing the Boom and BustOur examination of the roots of the crisis suggests the nature of
policy failures during the bubble years. Two types of failure aregenerally cited in this connection. The first is regularity, the secondrelates to the extraordinarily low policy rates maintained by theFederal Reserve.23 There was little appreciation among policy makersof the serious limitations of the Basel prudential norms concerningcapital adequacy, etc. and of the nature and magnitude of the systemicrisks being built up during the bubble years. Nor was the regulatoryframework—with separate authorities overseeing banks and otherfinancial firms—appropriate for tackling the growing financialfragility. These inadequacies were due almost entirely to the disregardof the Keynesian principles in framing the norms and regulatoryframework. It was only after the crisis had broken out did the policymakers come to appreciate the urgent need for formulating macro-prudential norms for financial firms and ensuring close coordinationamong various regulatory and supervisory authorities.
Elsewhere (Rakshit, 2008) we have discussed in some detailwhy the Fed’s interest rate policy cannot be held responsible for thebubble and the bust. Here also the reasons are Keynesian. The pre-crisis period, as already noted, was not marked by an overheatedeconomy or high inflation (Table A.1). Residential investment andhome prices were no doubt booming; but this reflected what Keynescalls (p. 323) “misdirected investment” and did not call for monetarytightening. A high enough interest rate for cooling the overheatedhousing market would not only have precipitated a recession,24 but alsocaused a much sharper fall in non-residential than residentialinvestment. Hence, as per the Keynesian analysis (Ch. 22), the durationof the downturn would then have been longer and the recoverysignificantly slower.25 Instead of monetary tightening, whose impact is
22 Apart from the instability induced by the similarity of opinion (resultingin what is nowadays called herd behaviour), it is also fairly obvious (as theKeynesian analysis implies) that it is the diversity of opinion regarding the futureprice of a security that permits its easy sale (without any loss of value) on the partof individual investors. Recall Keynes’s observation that there is no asset (other thanfiat money) that is liquid for all holders taken together.
23 We ignore here the failure to address the build-up of external imbalancessince the crisis-promoting role of global imbalances is far from clear; not only wasthere no disorderly exit from the US capital market, there was in fact a massive flowof funds to the market in the aftermath of the crash. Again, such imbalances can beaddressed only through policy coordination at the international level.
24 Recall that the main driver of growth during the period was investmentin housing.
25 To see why, note that at full employment the (real) return on housing ispositively related to the income originating in the non-housing sector: the smaller the
It was only after the
crisis had broken
out did the policy
makers come to
appreciate the
urgent need for
formulating macro-
prudential norms for
financial firms and
ensuring close
coordination among
various regulatory
and supervisory
authorities.

53
I C R A B U L L E T I N
Money
Finance&
SEPTEMBER.2012
necessarily economy-wide rather than sector specific, containment ofthe housing bubble and the associated misdirected investment requiredan effective regulatory framework for mitigating the serious systemicrisk and financial fragility engendered by the building boom.
III. The Recessionary Phase: Some Non-Keynesian andKeynesian CharacteristicsAccording to the General Theory (Ch. 22), following the burst
of the bubble the downturn in output and employment tends to be steepand cumulative, but the economic recovery sluggish, hesitant andlong-drawn. The explanation runs in terms of (a) the dynamics ofinvestment, both durable and inventory; (b) consequences of asset-pricecollapse on private spending propensities in a debt-ridden economy; (c)changes in liquidity preference or “the state of credit” along with thatin the marginal efficiency of capital; and (d) operation of the multiplier.However, the behaviour of the economy after the bursting of thehousing bubble has not always been in conformity with the Keynesianthesis.
Though the US GDP had been decelerating from Q3 06, thefirst fall in the level of output (amounting to 0.6 per cent) occurred onlyin Q3 08. Thereafter the decline was significantly steeper until it slowedto 0.1 per cent in Q4 09 since when GDP has been moving northward.Unemployment remained at a fairly low level (around 4.5 per cent)during the initial phase of the deceleration (Q3 06–Q2 07), started risingat a sluggish pace from mid-2007 to Q2 08, leaped by 70 basis points(to 6.0 per cent) in Q3 08, and rose sharply over the next five quarters,peaking at 9.9 per cent in Q4 09. From Q1 10 onward the rising level ofthe output has been accompanied with a downward drift in joblessness.
The Housing Debacle and the Upper Turning PointWe have traced the roots of the crisis to speculative excesses in
the housing and mortgage markets; but as noted above, there was a lagof more than a year between bursting of the housing boom and crisis inthe mortgage market (initially called the subprime crisis26) in mid-2007and onset of the recession from Q3 08. This seems to run counter to theGeneral Theory characterisation of the upper turning point of a typical
ratio of non-housing capital to the stock of houses, the lower will be the rent. Again,when the (sectoral) “overinvestment” in housing drives down its return (with fullemployment of resources) below the long-term interest rate, residential investmentdries up, causing demand deficiency and reducing further the prospective yields onresidential along with that on non-residential investment (Rakshit, 2008). Hencewith a higher (initial) ratio it would take longer before depreciation of the stock ofhousing and revival of non-residential capital accumulation make residentialinvestment profitable and push up the pace of recovery.
26 As we have explained elsewhere (Rakshit, 2008), this was a misnomersince the roots of the trouble lay in the entire mortgage market, not in its subprimesection alone.
There was a lag of
more than a year
between bursting of
the housing boom
and crisis in the
mortgage market in
mid-2007 and onset
of the recession
from Q3 08. This
seems to run
counter to the
General Theory
characterisation of
the upper turning
point of a typical
trade cycle.

54
I C R A B U L L E T I N
Money
Finance&
SEPTEMBER.2012
trade cycle. However, the lag is not difficult to explain in terms of theKeynesian analytical framework once we take into account somestructural features of the US and the world economy in the late 2000s.
As already noted, the prolonged housing boom was notaccompanied with any significant rise in other categories of investment.Not only did private non-residential fixed investment decline over Q201–Q1 03 following the bursting of the dotcom bubble, but even aftersuch investments had started recovering (from Q3 03), until 2004 theirgrowth was relatively modest and remained lower than that ofinvestment in housing. However, by Q2 06, when residential capitalformation started declining, non-residential investment had becomebuoyant and remained fairly robust until the financial (including thestock market) meltdown sent it tumbling from Q3 08 onward. Given thefact that the shares of non-residential fixed investments in aggregatecapital formation and GDP were substantially larger than that ofresidential investment,27 it is easy to appreciate why the downturn inoutput did not occur immediately after the collapse of constructionactivities.
The aforesaid disjunction in the phasing of the two types offixed investment was closely related (as per the General Theoryanalysis) to the asymmetric behaviour of the home price and the stockprice indices during the period. It was the sharp deceleration of houseprices in the first half of 2006 followed by their decline thereafter, thatmarked the end of the housing boom and beginning of a prolongedslump in residential investment. But despite the weakening and collapseof the housing market, stock prices exhibited an upward trendthroughout Q1 06–Q4 07. Only with the large scale failure and near-bankruptcy of financial firms in 2008 did share prices and non-residential fixed investment come crashing. (Table A.1).
But why was there a stock market surge during Q1 06-Q4 07when home prices were weakening? One reason was the widespreadperception—among not only investors in the share market, but alsoeconomists and think-tanks including the IMF—that the problem beingconfined to the subprime section of the mortgage market was quiteunlikely “to pose a serious systemic threat” (IMF, 2007), especiallysince “systemically important financial institutions began this episodewith more than adequate capital to absorb the likely level of creditlosses” (IMF, 2007a). The perception was also due in no small measureto the reputation the central bank had acquired concerning its ability tokeep the economy on an even keel. Of particular significance in thiscontext was the memory of the effectiveness of Fed’s monetary measuresin the wake of the dotcom bust: thanks to the sharp cuts in the federal
27 Thus in Q1 06 (since when residential investments turned negative) theshares of private fixed non-residential investment in gross private investment andGDP were 53.1 and 11.1 per cent respectively; the corresponding figures forresidential investment were 29.6 and 6.2 per cent respectively.
Given the fact that
the shares of non-
residential fixed
investments in
aggregate capital
formation and GDP
were substantially
larger than that of
residential
investment, it is
easy to appreciate
why the downturn in
output did not occur
immediately after
the collapse of
construction
activities.
55
I C R A B U L L E T I N
Money
Finance&
SEPTEMBER.2012
fund rate (ffr) from 6 to 1 per cent between 31 January, 2001 and 25June, 2003, GDP growth, after decelerating (but remaining positivethroughout) over Q1 01–Q4 01, started recovering from early 2002 andturned exceptionally healthy from Q3 03 onward.28 No wonder thenthat the Fed’s (and other major central banks’) aggressive cuts in policyrates and injection of huge liquidity as soon as the subprime problemshad surfaced went a long way in sustaining investors’ confidence in theresilience of the macroeconomy.
Finally, the contractionary impact of the slump in residentialinvestment was more or less neutralised by the surge in externaldemand originating in high growth of the world economy in generaland emerging market economies (EMEs) and oil-exporting countries inparticular. In 2006 and 2007 the (y-o-y) decline in residentialinvestment amounted to 7.2 and 18.7 per cent respectively; exports onthe other hand grew at the rate of 9.0 and 9.3 respectively in the twoyears. Given the much larger share of exports in GDP compared withthat of residential investment, the standalone contributions of theformer and the latter to GDP growth29 were 0.94 and –0.45 per centrespectively in 2006, and 1.02 and –1.07 per cent respectively in 2007.Only with the onset of the severe, global financial turmoil anddownturn of the world economy did export growth decelerate from 11.3per cent in Q2 08 to 6.4 per cent in Q3 08 and turn negative since then,reinforcing the recessionary impact of the slump in construction anddrying up of other sources of domestic demand.
Contractionary MechanismThe onset of the financial upheaval in late Q3 08 was followed
by a rapid decline in output over the next three quarters, with GDPfalling progressively by 3.3, 4.2 and 4.6 per cent respectively. Even inQ3 09 the decline in GDP (at 3.3 per cent) was still steep;30 but by end-2009 recessionary forces had waned and output started rising from Q110 onward.31 Let us see how far the interplay of factors behind thesteep fall in the level of economic activity following the upper turningpoint was in conformity with the Keynesian theory where the focus ison the collapse of the marginal efficiency of capital and large
28 The recovery was also aided by the sharply rising trend of residentialinvestment from Q1 02 and expansionary fiscal measures. It is worth noting that inthis instance also there was a time lag (of about six quarters) between theresumption of the bull-run in residential investment and the beginning of therecovery in share prices and non-residential fixed investment (Table A.1).
29 The contribution of (say) exports is given by the growth rate of exportsin the year times the ratio of exports to GDP in the previous year.
30 Remembering that in Q3 08, the level of output was close to its pre-crisispeak.
31 The behaviour of unemployment was in conformity with that of GDPduring the recessionary phase, Q3 08–Q4 09. Unemployment jumped from 5.3 percent in Q2 08 to 6.0 per cent in the following quarter, rose rapidly to 9.3 per cent inQ2 09, peaked at 9.9 per cent in Q4 09, and started drifting downward since then.
The Fed’s and other
major central banks’
aggressive cuts in
policy rates and
injection of huge
liquidity as soon as
the subprime
problems had
surfaced went a
long way in
sustaining investors’
confidence in the
resilience of the
macroeconomy.
56
I C R A B U L L E T I N
Money
Finance&
SEPTEMBER.2012
disinvestment in stocks associated therewith and on the impact of thecollapse on the propensity to consume and the liquidity preference.
Note first that though residential investment32 fell by nearly 25per cent during the most intense phase of recession (Q4 08–Q3 09), whatwas crucial in effecting the rapid decline in the level of economicactivity was the 16.5 per cent fall in private non-residential fixedinvestments (PNFIs). Apart from the fact that compared with the shareof residential construction in GDP (averaging 3.4 per cent during Q108–Q3 08) PNFIs’ share (at 11.7 per cent) was much larger, theirdecline severely dented investors’ confidence, intensified the bearishnessin the housing market and set the stage, a la the General Theory thesis,for a huge disinvestment in stocks.33 The fall in residential investmentand a slowdown in GDP growth had already caused a decline ininventory investments from Q4 06 and made them negative since Q4 07as subprime troubles assumed alarming proportions; but there was aquantum change in the scenario following the onset of the financialturmoil: investment in stocks plunged by 205.5, 737.3, 1101.6, 1206.3and 376.4 per cent in the five successive quarters from Q3 08 to Q3 09.The demand-dampening effect of such vertiginous falls is indicated bythe fact that though the ratio of inventory investment to GDP was onlyminus 0.1 per cent in Q1 08, the 725.4 per cent (y-o-y) growth (in thealgebraic value) of disinvestment34 in stocks in Q1 09 effected a 0.73percentage point (pp) fall in GDP, compared with the fall of 0.95 and1.05 pps caused by the decline in residential investment and PNFIrespectively in that quarter. Be that as it may, the fact that out of the3.85 per cent fall in GDP during Q4 08–Q3 09 almost the entire amountis accounted for by the (standalone) demand-dampening effect of the25.7 per cent fall in private capital formation confirms the GeneralTheory thesis regarding its overwhelming role in effecting thedownturn. Again, only when private investment had bottomed out andstarted recovering did output growth turn positive from early 2010(Table A.1).
The behaviour of household consumption was also inconformity with the Keynesian thesis.35 Following the downward driftin home prices and intensification of the subprime crisis the ratio of
32 On top of its unabated and rapid fall since Q1 06.33 The aftermath of the collapse of fixed investment, Keynes notes, will
lead to “an accumulation of surplus stocks of unfinished goods”, absorption ofwhich “represents negative investment” (p 318). Again, “the reduction of workingcapital, which is necessarily attendant on the decline in output on the downwardphase, represents a further element of disinvestment, which may be large and sincethe recession has begun, this exerts a strong cumulative influence in the downwarddirection” (p 318).
34 Since in Q1 08 inventory investment was negative, the increase in itsabsolute value in Q1 09 implies a (y-o-y) rise in the algebraic value of disinvestment.
35 Though the period Q4 08–Q3 09 saw personal consumption registering afall of 2.48 per cent compared with a 3.85 per cent fall in GDP, it needs to be notedthat disposable income fell at a slower rate than consumption.
Though residential
investment fell by
nearly 25% during
the most intense
phase of recession
what was crucial in
effecting the rapid
decline in the level
of economic activity
was the 16.5% fall
in private non-
residential fixed
investments.

57
I C R A B U L L E T I N
Money
Finance&
SEPTEMBER.2012
personal consumption to disposable income had already started falling,albeit slowly, from the last quarter of 2007. The collapse in shareprices over Q3 08–Q1 09 (with no let-up in the southward movement ofthe CS index) caused a sharp reduction in the ratio from 93.9 per centin Q3 07 to 90.3 per cent in Q2 08. The GDP-debilitating effect of thedownward shift of the consumption function was the most pronouncedduring Q4 08 and Q1 09 when the (y-o-y) decline in stock and homeprices averaged about 40 and 19 per cent respectively. Though the fallin personal disposable income amounted to a modest 1.2 per cent in thesix-month period, personal consumption expenditure went down by asmuch as 2.6 per cent. The significance of this in strengthening therecessionary forces may be appreciated from the fact that, withpersonal consumption constituting 70 per cent of GDP,36 output growthduring Q4 08–Q1 09 would have been higher by at least 1.0 pp37 hadthere been no asset price-induced fall in the consumption function.
The most spectacular consequence of the fall in asset priceswas the financial meltdown, with banks falling like nine pins, investorsscrambling for liquidity, and credit flows drying up not only toenterprises and households, but in the interbank money market as well.However, though hogging the limelight, the flight to liquidity per se didnot perhaps play a major role in accentuating the fall in fixedinvestment or (credit-driven) purchases of consumer durables: underdarkening economic prospects, the demand-side factors (as Keynesnever tires of emphasising) tend to be much more important than thewillingness of lenders in governing the actual purchases.38 The majorimpact of the liquidity crunch was on investment in working capital.The cutback in short-term credit must have forced many enterprises toreduce their holding of stocks of raw materials and of finished andsemi-finished goods below their optimal levels39: the astronomicalfigures for inventory disinvestment over Q4 08–Q2 09 must have beendue in part to producers’ inability to secure funds for meeting theirworking capital requirements. The resulting disinvestment ininventories and the multiplier operating thereon magnified thedownward pressure on aggregate demand arising from the fall in fixedinvestment and the propensity to consume.
36 In Q4 07–Q1 08.37 i.e., would have been –2.8 instead of –3.8 per cent, assuming that in the
absence of the fall in asset prices households would have reduced their consumptionproportionately to the fall in disposable income.
38 Expectations that the credit crunch was unlikely to ease in theforeseeable future might have prompted some enterprises to abandon or postponetheir plans to add to capacity; but its quantitative significance for the US economywas unlikely to have been large. However, the financial turmoil did have asignificant impact on fixed investment in quite a few emerging economies, especiallyin East Europe, where foreign capital had been an important source of investment inthe pre-crisis years.
39 i.e., what enterprises would have considered the most cost-effective inthe absence of credit constraint.
Under darkening
economic prospects,
the demand-side
factors (as Keynes
never tires of
emphasising) tend
to be much more
important than the
willingness of
lenders in governing
the actual
purchases.
58
I C R A B U L L E T I N
Money
Finance&
SEPTEMBER.2012
Duration of the PhaseThough the mechanism driving down the level of economic
activity was undoubtedly Keynesian, the recession itself was relativelyshort and shallow, and hence contrary to the General Theory delineationof a typical trade cycle. The y-o-y decline in GDP lasted for six quarters,from Q3 08 to Q4 09, and averaged no more than 2.68 per cent. On thebasis of the q-o-q output variations the recession period, Q3 08–Q2 09,was significantly shorter though the average fall in GDP was larger at5.0 per cent. The rise in unemployment, from 5.3 percent in Q2 08 to9.3 per cent in Q2 09 and further to 9.9 per cent in Q4 09, was no doubtfairly steep, but nowhere near the peak (25 per cent) attained during theGreat Depression. In view of the enormous losses suffered by financialinstitutions, the mad rush for liquidity and the mountainous debt (inrelation to income) households had become saddled with, anexplanation of the mildness and short duration of the downturn appearsto be in order. The most important factors moderating and reversingthe contractionary tendencies were (a) trans-border trade and (b) policyinitiatives, and the consequences of both, we may note, are quite easyto appreciate in terms of Keynes’s theoretical framework.
International TradeThanks to the dismantling of the barriers to trade under the
General Agreement on Tariffs and Trade (GATT) and World TradeOrganisation (WTO), trades in goods and services had become muchfreer by the time the global crisis broke out in 2008. The trade-GDPratio even in the USA, despite its large size and geo-climatic diversity,40
was as much as 31 per cent in the first half of 2008 and attested to theimportance of exports and imports in governing aggregate demand inthe economy.
Though openness could be a double-edged sword as per theKeynesian macroeconomics, for the US economy the trans-border tradeturned out to be highly salubrious during the recession. Over thisphase, there was a significantly larger fall in US imports comparedwith that in exports. During Q3 08–Q4 09 the (y-o-y) decline in exports,at 5.3 per cent, was half of the (10.46 per cent) plunge in the purchasesof goods and services from the rest of the world. The importance of thissignificantly sharper fall in imports in moderating the macroeconomicdownturn may be indicated with some rough and ready estimates. Withthe pre-crisis export- and import-GDP ratios averaging 13 and 18 percent respectively, the standalone (positive) impact of the improvementin trade balance on the US GDP growth in Q3 08–Q4 09 amounted to1.2 pps41—a huge boost when viewed against the 2.7 per cent fall inGDP registered during the period.
40 Trade as a proportion of GDP tends to be lower, the larger the size ofthe economy and the more diverse the country’s geo-climatic conditions.
41 As the ratio of trade deficit to GDP was reduced from 5.0 to 3.8 per cent.
Though the
mechanism driving
down the level of
economic activity
was undoubtedly
Keynesian, the
recession itself was
relatively short and
shallow, and hence
contrary to the
General Theory
delineation of a
typical trade cycle.

59
I C R A B U L L E T I N
Money
Finance&
SEPTEMBER.2012
The improvement in trade balance was in its turn due to theoperation of three structural factors. First, by 2007 services had becomethe overwhelming source of US GDP at the expense of industries so thatthe major part of the domestic demand for industrial products includingcapital goods and consumer durables (CGCDs) was being met throughimports. Since the downturn was led by plummeting expenditures onCGCDs, their incidence was primarily on imports, not so much ondemand for domestically produced goods and services.42 This was animportant reason for the rapid international transmission of the crisis,but in the process the downward pressure on the US economy waslessened considerably.43
The second source of succour was the fall in petroleum prices.From their height at US$124.0 per barrel (pb) in Q2 08 international oilprices came down, successively to US$118.0, US$54.4 and US$43.0 pbover the next three quarters, and even while crawling upward thereafterremained relatively subdued for quite a while. The contra-cyclicalbehaviour of crude prices constituted a built-in macrostabiliser for largeoil-importing countries: given the inelastic demand for petroleumproducts, a fall in oil prices provides a boost to domestic demand inthese countries through (i) a decline in the leakage from the income-expenditure stream (by way of imports) and (ii) an increase in householdconsumption.44 So far as the USA was concerned, during Q4 07–Q3 08petroleum imports averaged about 17 per cent of total imports andaround 3.0 per cent of GDP. The positive impact on US GDP of the 46per cent (y-o-y) fall in international oil prices during the worst phase ofthe crisis, Q4 08–Q3 09, thus amounted to as much as 1.4 pps45 andconstituted an important factor in moderating the downturn.
Finally, between 2001 and 2007 the share of major advanced(G7) countries in world output declined by nearly six pps to 42.7 percent, but that of Emerging and Developing countries rose from 37.7 to45.3 per cent (IMF, 2012). The trend was accentuated over the next twoyears with significantly poorer macro performance of advancedcountries compared with that of the EMEs. While output in the G7countries declined by 0.3 per cent in 2008 and 4.2 per cent in 2009,GDP in Emerging and Developing countries in the two years grew by
42 As noted elsewhere (Rakshit, 2010), following the outbreak of the crisisin Q3 08, during the next four quarters CGCDs and imports declined by 13.8 and13.3 per cent respectively (compared with a 4.1 per cent fall in GDP).
43 Indeed, to the extent the US marginal propensity to consume was higherthan that of its trading partners, there was also a moderation of global recession(Rakshit, 2010).
44 As households are left with a larger disposable income for expenditureon non-fuel products.
45 This is an overestimate to the extent it abstracts from the (price-induced) increase in (the volume of) petroleum imports, but the estimate also ignoresthe additional household consumption due to fall in petroleum prices. Note also thatsince the US economy is large, the fall in crude prices cannot be regarded as whollyexogenous.
The contra-cyclical
behaviour of crude
prices constituted
a built-in
macrostabiliser for
large oil-importing
countries: given the
inelastic demand for
petroleum products,
a fall in oil prices
provides a boost to
domestic demand in
these countries.
60
I C R A B U L L E T I N
Money
Finance&
SEPTEMBER.2012
6.0 and 2.8 per cent respectively. Significantly higher was growth inDeveloping Asia, at 7.7 per cent in 2008 and 7.2 per cent in 2009.Given their large weight and high trade-GDP ratio, rising incomes indeveloping countries helped considerably in preventing a repeat of theeconomic woes that had bedevilled the US and the world economy inthe 1930s.
Policy InitiativesIt cannot be sufficiently emphasised that the relative mildness
and short duration of the recession were due above all to the quick andconcerted implementation of Keynesian policies practically everywhere.The main reason why the depression in the 1930s was so deep andprolonged was the attempt by major nations to devalue their way out oftroubles sans any worthwhile measure to stimulate domesticconsumption or investment. Drawing attention to the counterproductiveconsequences of such beggar-thy-neighbour policies, Keynes emphasisesthe urgent need for nations to “learn to provide themselves with fullemployment by their domestic policy” (p. 382).46 Fortunately this timenot only was there no repeat of the economic chaos as in the 1930sbecause of widespread adoption of beggar-thy-neighbour policies,47 butthe current crisis also saw prompt and vigorous implementation of awide variety of measures by all major nations for boosting theirdomestic demand—measures that were Keynesian in both their overallthrust and specific details.
Unlike in the wake of the 1929 crash when the Federal Reserveand other central banks allowed money supply to nosedive and thefinancial system to disintegrate, at the very first sign of the liquidity-cum-banking crisis in 2007 and 2008, central banks all over the worldeffected sharp cuts in policy rates, flooded the system with liquidity andmounted, aided by ministries of finance, rescue operations for totteringbanks on an unprecedented scale.48 For making the monetary policy
46 With such a shift in the policy stance, “International trade”, Keynesgoes on to conclude, “would cease to be what it is, namely, a desperate expedient tomaintain employment at home by forcing sales on foreign markets and restrictingpurchases, which, if successful, would merely shift the problem of unemployment tothe neighbour which is worsted in the struggle, but a willing and unimpededexchange of goods and services in conditions of mutual advantage” (pp 382-3).
47 Some nations did take recourse to protectionist measures this time aswell (Rakshit, 2010), but their incidence was quite insignificant in relation to thevolume of world trade.
48 The scale of intervention by monetary authorities for preventingcollapse of the financial system is indicated by the fact that between July 2007(when the subprime crisis surfaced) and mid-2009 the Federal Reserve’s liquidityinjection-cum-support totalled US$1,155 billion, amounting to 8.1 per cent of theUS GDP (IMF, 2009). The additional liquidity provided by all advanced countrycentral banks during the period was a huge US$2,127 billion (7.6 per cent of GDP).The scale of injection by the EME central banks, at US$1703 billion, was less inabsolute terms, but far larger (at 13.5 per cent) as a ratio of the countries’ GDP. Byfar the largest was the expenditure incurred by developed country governments inpropping up weak and near-bankrupt financial institutions: as of August 2009 the
Fortunately, the
current crisis saw
prompt and
vigorous
implementation of a
wide variety of
measures by all
major nations for
boosting their
domestic demand—
measures that were
Keynesian in both
their overall thrust
and specific details.

61
I C R A B U L L E T I N
Money
Finance&
SEPTEMBER.2012
more effective, central banks also implemented a variety of unorthodoxmeasures, first recommended in the General Theory.
Drawing attention to the serious limitations of the practice ofcentral banks “to concentrate on short-term government bonds and toleave the price of long-term debts to be influenced by belated andimperfect reactions from the price of short-term debts.” (p. 206), Keynesrecommends that for anti-cyclical purposes the monetary authorityshould be “prepared to deal both ways on specified terms in debts of allmaturities and even more to deal in debts of varying degrees of risk”(p. 205). This is in fact what the Federal Reserve and other majorcentral banks did as soon as the crisis had broken out: apart fromcutting the short-term policy rates to near-zero levels, not only did thecentral banks buy large quantities of long-term securities and permitbanks to avail of medium-term funds, but the range of acceptablecollateral was also widened to include relatively high risk-assets likeMBSs .These measures along with large scale recapitalisation of bankshelped in preventing a collapse of the financial system and laying thefoundation for an early recovery.
Last but by far the most important, in a major departure fromthe then prevailing orthodoxy, policy makers everywhere instead ofrelying on purely monetary measures took recourse to large scale fiscalexpansion, as advocated in the General Theory.49 Following the outbreakof the financial crisis in September 2008, not only the US,50 but otherdeveloped country and EME governments also started implementingmassive fiscal stimulus programmes51 for boosting aggregate demand.52
cost on this count amounted to an astronomical US$9,490 billion, about 21.4 percent of the countries’ GDP.
49 Even when the central bank is prepared to buy and sell debts ofdifferent maturities, Keynes is sceptical of its ability to counter a severe collapse ofthe marginal efficiency of capital. Part of the reason lies in the intermediation costand high risk premium “even if the pure rate of interest to the lender is nil” (p 208).More crucially, “…during the downward phase, when both fixed capital and stocksof materials are for the time being redundant, the schedule of the marginal efficiencyof capital may fall so low that it can scarcely be corrected, so as to secure asatisfactory rate of new investment, by any practicable reduction in the rate ofinterest” (pp 319-20).
50 The USA took recourse to some fiscal expansion in early 2008 forcountering the GDP-debilitating consequences of the subprime crisis.
51 The programmes consisted of public spending on infrastructure,education and health; transfers or income tax reliefs to households; provision of cashfor purchases of new cars in exchange for old ones; tax rebates on a large number of(mostly durable) products; and assistance to recession-hit firms and to homeownersfacing foreclosure of their mortgages.
52 While the US fiscal stimulus under the American Recovery andReinvestment Act (ARRA) 2009 amounted to US$787 billion (5.5 per cent of theUS GDP), the budgetary stimulus provided by the G20 advanced and developingcountries totalled US$2,003.9 and US$673.2 billion respectively, and averaged asubstantial 5.9 per cent of the group’s GDP. The quantitative significance of theanti-recessionary role of the fiscal stimuli is perhaps better indicated by thedeterioration in the group’s fiscal balances by 5.9 pps between the pre-crisis year(2007) and 2009 (IMF, 2009).
Keynes recommends
that for anti-cyclical
purposes the
monetary authority
should be prepared
to deal both ways on
specified terms in
debts of all
maturities and even
more to deal in
debts of varying
degrees of risk. This
is in fact what major
central banks did as
soon as the crisis
had broken out.

62
I C R A B U L L E T I N
Money
Finance&
SEPTEMBER.2012
There can be little doubt that the budgetary stimuli constitutedby far the most important factor behind the relatively shallow recessionand early recovery, confirming the Keynesian thesis on the efficacy offiscal policy vis-à-vis monetary management. Despite the hugefinancial sector support programmes implemented by the US and otheradvanced countries and the sharp cuts in policy rates by their centralbanks, there was little revival of credit flows over Q4 08–Q3 09 and thedecline in private investments continued to be vertiginous.53 This wasespecially so for the US economy where their (y-o-y) fall during the fourquarters averaged a massive 26 per cent. Indeed, amidst the decline inall other components of aggregate demand, government consumption-cum-investment turned out to be the only source of expansion of theeconomy (Table A.1). While the rise in the government’s directpurchases of goods and services during the period (at 2.1 per cent)helped in reducing the fall in GDP by 0.8–1.0 pp,54 tax reductionsalong with enhanced transfers and subsidies also seem to have played ano mean role in moderating and then reversing the downturn inhousehold consumption and business investment.55
The efficacy of anti-recessionary measures, the Keynesiananalysis suggests, is enhanced significantly by policy coordinationamong nations. Since some of the benefits of the expansionary policy ofa nation accrue to others but its fiscal and current account balancestend to deteriorate, when countries operate in isolation, from theviewpoint of the world economy the scale of stimulus is liable to besuboptimal and the economic downturn steeper and more prolonged.Fortunately the crisis witnessed unprecedented cooperation amongnations in coordinating their stimulus programmes as well as drawingup action plans at the supranational level.
From mid November 2008 onward leaders and financeministers of the G20 countries, which account for about 87 per cent ofworld output, started meeting56 at frequent intervals for drawing up“time-bound action plans to restore global growth” and “lay the
53 This does not imply that financial stimulus measures were not necessary:their importance lay not so much in boosting demand in the short run, given thedismal state of investors’ and bankers’ expectations, but more in laying thefoundation for a sustained recovery in the medium and long run. It may however beargued that the easy money policy moderated the fall in investment; but thehypothesis is not supported by the state of credit during this period.
54 Assuming that government consumption and investment constituted 40-50 per cent of aggregate autonomous expenditure (i.e., expenditure not dependenton GDP).
55 Despite the households’ huge debt burden, thanks to massive transfers,the fall in personal consumption during Q4 08–Q4 09 was significantly less than thatin GDP.
56 Following the outbreak of the subprime crisis also there was extensiveinformation sharing, consultation and collaboration among major central banks forarresting the financial meltdown and implementing measures to meet banks’ needsfor domestic and foreign funds. This is apart from the orchestrated, deep cuts inpolicy rates effected in the aftermath of the crisis.
There can be little
doubt that the
budgetary stimuli
constituted by far
the most important
factor behind the
relatively shallow
recession and early
recovery, confirming
the Keynesian thesis
on the efficacy of
fiscal policy
vis-à-vis monetary
management.

63
I C R A B U L L E T I N
Money
Finance&
SEPTEMBER.2012
foundation for reform to help to ensure that a global crisis, such as thisone, does not happen again” (G20, 2008). The short-term action plansdrawn up in the first and second G20 summits (in Washington DC onNovember 15, 2008 and London on April 2, 2009 respectively)included close cooperation among the G20 national and regionalauthorities for promptly identifying and taking all possible steps toresolve domestic and cross-border financial crisis; collaborationbetween the IMF and the Financial Stability Forum (and its successor,the Financial Stability Board57 [FSB]) for framing macro-prudentialframework and providing early warnings of macroeconomic andfinancial risks; substantial enhancement of resources of theinternational financial institutions (IFIs) for purposes of extending tradecredit to the EMEs and helping them finance their counter-cyclicalspending including bank recapitalisation, infrastructural investmentand social support measures; and commitment to refrain fromcompetitive devaluation and minimise the negative impact of acountry’s fiscal, financial and other measures on its neighbours.
The significance of the collaborative action plans in arrestingand reversing the slide of the world economy can hardly beoveremphasised. First, the expansionary impact of the stimulusmeasures implemented by different countries was magnified by theabsence of competitive devaluation58 and attempts at minimising theadverse consequences of a nation’s policies on its neighbours. Second,arrangements for extension of trade credit and financial support todistressed EMEs for undertaking counter-cyclical policies provided aboost to their economies as well as their trading partners’. Third, thepolicy coordination enabled the G20 countries to go in forexpansionary programmes on a much bigger scale than would havebeen possible in the absence of such collaboration. Under the G20action plans the additional injection of funds into the world economyby end-2010, consisting of the committed fiscal expansion to the tune ofUS$5.0 trillion and the US$1.1 trillion worth of (extra) finance routedthrough the IFIs, amounted to be an astronomical US$6.1 trillion,around 10 per cent of (the 2008) world income. Finally, the scale andseriousness of the coordinated rescue operation played an importantpart in restoring private agents’ confidence in near-term economicprospects. No wonder then that, by the time the G20 leaders met atPittsburg (on September 24–25, 2009), the worst phase of the crisis wasover and the world economy appeared poised for a robust recovery.
57 The Financial Stability Forum (FSF) was founded in 1999 by the G7finance ministers and central bank governors. As per the G20 resolution at theLondon summit on April 2, 2009, the FSB was established, with a strengthenedmandate, as the successor to FSF. The main task of the FSB is to formulate and helpin the implementation of “effective regulatory, supervisory and other financial sectorpolicies” (G20, 2009).
58 Competitive devaluation, let us recall, was a major factor behind therapid cross-country transmission and deepening of the crisis in the 1930s.
Arrangements for
extension of trade
credit and financial
support to
distressed EMEs for
undertaking counter-
cyclical policies
provided a boost to
their economies as
well as their trading
partners’.

64
I C R A B U L L E T I N
Money
Finance&
SEPTEMBER.2012
IV. Recovery and SlowdownThanks to the mutually reinforcing effects of coordinated
stimulus programmes, 2010 saw all groups of countries staging aspectacular recovery. Between 2009 and 2010, while the worldeconomic growth went up from –0.7 to 5.3 per cent, the correspondingincreases in GDP growth of advanced and developing economies werefrom –3.7 to 3.2 per cent and from 2.8 to 7.5 per cent respectively.Particularly impressive was the recovery of the four largest, recession-hit advanced countries, the USA, Japan, Germany and the UK: incontrast to the fall in their GDP in 2009 by 3.0, 5.5, 5.1 and 3.9 percent respectively, their output growth in 2010 amounted respectively to2.4, 4.5, 3.6 and 1.8 per cent. However, since 2010 the recovery hasturned anaemic and growth started decelerating.
Like the recovery, the slowdown has also been near universal,underscoring the close economic and financial inter-linkages amongnations. The 1.3 per cent fall in the EME growth, from 7.5 per cent in2010 to 6.2 per cent in 2011, was substantial, but significantly less thanthe 50 per cent fall in growth (from 3.2 to 1.6 per cent) suffered byadvanced countries. Among the major industrialised economies, theUSA, the UK and Japan saw their output growth decelerate from asearly as Q4 10. The euro area growth, which had been a modest 1.9per cent in 2010,59 started decelerating sharply from Q2 11 and turnednegative in Q2 12 (Table A.2). A spiralling debt crisis and gallopingunemployment with falling output in many of its member countrieshave turned the euro zone into a veritable source of danger to the worldeconomy. But the scenario elsewhere has not been too rosy either, withthe threat of recession looming large over the UK, Japan’s GDPcontinuing to fall throughout 2011,60 large output gaps persisting in theUSA and GDP growth continuing to slide unabated in China, India,Brazil and most other EMEs.
The seriousness of the slide has been manifest most in themagnitude of unemployment with its attendant misery and erosion ofhuman resources. Practically everywhere not only does unemploymentas of now (mid 2012) remain far above the pre-crisis level, but its trendhas also generally been northward. While the scenario in the euro zonecrisis countries61 is now similar to what prevailed in the worst phase ofthe Great Depression, the problem of protracted unemployment hasassumed alarming proportions in many other countries as well. Thusdespite positive GDP growth since Q110 and substantial exit ofdisappointed jobseekers from the labour market, between Q4 10 andmid 2012, unemployment went up from 7.8 to 8.2 per cent in GreatBritain, and from 9.7 to 10.1 per cent in France. Even in the USA,
59 Thanks primarily to resurgence in German GDP.60 Though growth has turned positive from Q1 12.61 With unemployment at 24.8 per cent in Spain, 23.1 per cent in Greece,
15.4 per cent in Portugal and 14.8 per cent in Ireland.
A spiralling debt
crisis and galloping
unemployment with
falling output in
many of its member
countries have
turned the euro zone
into a veritable
source of danger to
the world economy.
But the scenario
elsewhere has not
been too rosy either.

65
I C R A B U L L E T I N
Money
Finance&
SEPTEMBER.2012
notwithstanding its legendary flexibility of the labour market andsignificantly better macroeconomic performance than most otheradvanced economies, it took two years for unemployment to fall by 1.2pps to 8.7 per cent in Q4 11 from its peak (9.9 per cent) in Q4 09. Thebleak employment scenario, apart from reflecting the extremelysluggish and fragile recovery, has severely dented consumer confidenceand proved a major drag on almost all economies.
Sources of SlowdownThe slowdown was due in part to the operation of some supply-
side factors. The earthquake, tsunami and disaster at a major nuclearpower plant in Japan, the world’s third largest economy, pushed downthe country’s GDP by 0.7 per cent in 2011 (compared with the 4.5 percent growth clocked in the previous year). The contractionary impactof the calamity was magnified by (a) the fall in output elsewhere due todisruption in the global supply chain and (b) the decline inconsumption62 triggered by the supply-induced loss of income.
The more important supply shock consisted in the rise inpetroleum prices due to political turmoil in the Middle East. Spot oilprices shot up from US$85.0 pb in Q4 10 to US$94.0 pb and US$102.6pb respectively in the next two quarters, and remained at an elevatedlevel thereafter until abatement of the turmoil and intensification of theeuro crisis caused prices to soften and move southward from early May2012. The shock negatively impacted the oil importing economiesincluding the USA through an increase in the countries’ oil import billand a reduction in demand for other goods because of a rise in the priceof petroleum products.
The role of the two shocks in the slowdown of global growthappears however to have been secondary. The negative impact of thecalamity in Japan was mitigated in part by enhanced governmentexpenditures on relief, rehabilitation and reconstruction.63Availabilityof substitutes of intermediate inputs produced in Japan—the worldeconomy, let us recall, was saddled with considerable excess capacity—also limited the damage due to disruption in the global supply chain.64
So far as the petroleum price shock is concerned, oil importingeconomies were no doubt adversely affected; but it needs to be notedthat (a) the demand-reducing effect of the shock was too small toaccount for the slowdown suffered by these economies in 2011, and(b) in view of the benign impact of the shock on oil exporting countries’
62 Of goods and services that were not supply constrained.63 Which the government was unlikely to incur in the absence of the
disaster.64 To the extent the calamity reduced the output of consumer and capital
goods, there would be little impact on world income: when aggregate output isdemand determined, reduction in capacity in some region does not by itself reducethe level of economic activity.
So far as the
petroleum price
shock is concerned,
oil importing
economies were no
doubt adversely
affected; but it needs
to be noted that the
demand-reducing
effect of the shock
was too small to
account for the
slowdown suffered
by these economies
in 2011.

66
I C R A B U L L E T I N
Money
Finance&
SEPTEMBER.2012
income and expenditure65 (including imports), its net consequences forthe global economy was by no means as adverse as it might appear atfirst sight. Be that as it may, since the slide has remained unabated longafter conditions in Japan and the Middle East have become normal, thetwo transitory phenomena, even if not inconsequential, cannot beconsidered crucial for a reasonably satisfactory explanation of thedeteriorating economic scenario.
The third supply-side factor at which many analysts point theiraccusing finger is the systemic troubles in the financial sector. Insupport of the thesis mention is made of how decimation of thefinancial system led to decade-long economic woes during the GreatDepression and in Japan in the 1990s. A severe logjam in financialintermediation can no doubt cause severe and protracted unemploymentand output gaps. However, as already noted, learning from theseexperiences policy makers all over the world not only flooded themarket with liquidity through both conventional and unconventionalroutes, but also mounted large scale rescue operations of distressedbanks. Thanks to these operations, by end 2009 balance sheets of bankswere in good repair and their capital adequacy more than adequate byall reckoning. The main reason for the slowdown cannot thus beattributed to the lingering weakness of the financial system, especiallywhen we remember that, banks in developing countries like India andChina, which have been experiencing deceleration in their growth since2010, remained mostly unscathed during the worst phase of thefinancial crisis. Even in the euro area the troubles being faced by banksare due primarily to the economic stagnation and decline and theconsequent rise in non-performing assets (NPAs), and not so much toinadequate shoring up of banks’ balance sheets in the wake of thefinancial crisis.
Policy Omissions and CommissionsWe have discussed in the previous section how the huge and
orchestrated stimuli immediately after September 2008 averted a deepdepression and effected a resumption of output growth in recession-hiteconomies by late 2009. However, from as early as mid 2010 policymakers changed their track and came to believe that an easy moneypolicy would be enough for sustaining recovery and the focus ofmacroeconomic programmes shifted to “fiscal consolidation” forreining in deficit and debt. In fact, though the USA, Great Britain andJapan continued with the easy money policy, many EME central banksas also the ECB raised hiked their policy rates in 2011 on top of thedebt-deficit reduction initiatives already adopted in these economies.
The policy makers’ perception concerning the need for fiscalconsolidation when output in advanced countries was as yet
65 Low price elasticity of demand for oil implies that even when its pricerise was due to supply disruptions, total earnings of producers would go up.
From as early as
mid 2010, policy
makers changed
their track and came
to believe that an
easy money policy
would be enough
for sustaining
recovery and the
focus of
macroeconomic
programmes shifted
to fiscal
consolidation for
reining in deficit
and debt.
67
I C R A B U L L E T I N
Money
Finance&
SEPTEMBER.2012
significantly below its pre-crisis level was, it cannot be sufficientlyemphasised, completely at variance with Keynes’s teachings and lessonsof history. The General Theory (Ch. 22) discusses at length how theeffect of the collapse of a boom in fixed investment tends to be long-lasting and the recovery painfully slow. Again, following the collapseprivate investment and consumption remain subdued even at a near-zero policy rate, given the huge excess capacity, the sharp rise in thedebt burden of households due to crash in asset prices on the one handand fall in incomes on the other, and the flight to liquidity along withthe rise in lenders’ risk premia. Under such a scenario the Keynesiananalysis underlines the urgent need for expansionary fiscal measuresuntil reduction of unemployment and rising earnings have restoredhouseholds’ confidence and effected a sufficient reduction in their debt-income ratio; growing capacity utilisation and profits backed by theperception that the authorities are committed to closing the shortfall inaggregate demand have caused a turnaround in private investment; andoutput growth has reduced significantly the NPAs of banks and riskpremia of lenders.
The fact that the housing boom and bust have caused a seriousimbalance in the capital structure of countries like the USA, the UK,Spain and Ireland strengthens considerably the Keynesian case for fiscalstimulus for preventing a protracted stagnation. Given the hangover oflarge stocks of housing in relation to other fixed capital assets, untilproductive capacity and incomes generated in non-housing activitiesrise sufficiently, rent and house prices would be too low to permit arevival of residential investment and create conditions required for aself-sustained recovery. But the slump in residential construction itselfprecludes full capacity utilisation and a step-up in investment in thenon-housing sector unless the government provides the required boost toaggregate demand.66
The relevance of the Keynesian theory and policy conclusionsfor the post-2010 slowdown may be illustrated with the experience ofthe US economy where monetary policy has remained expansionarythroughout and the reversal of the fiscal stimulus programme has beenconsiderably less than in most other countries. At the proximate level,one source of the US slowdown in 2011 was the sharp fall inincremental private investment67: its (y-o-y) growth jumped from –24.4per cent in 2009 to 14.0 per cent in 2010, but slumped to 5.2 per centin 2011. The main reason was the pronounced cyclicity, a la Keynes(pp. 318–9), of growth in inventory investment, from –658.2 per cent in2009 to 151.6 per cent in 2010 and then to –16.4 per cent in 2011. Theimportant point to note in this context is that GDP growth in 2010 was
66 The boost can conceivably come from the exports sector, but not whencountries that have not experienced the housing boom and bust are severely hit bycontagion and do not undertake vigorous fiscal expansion.
67 Accounting for around 12.3 per cent of GDP.
The fact that the
housing boom and
bust have caused a
serious imbalance in
the capital structure
of countries like the
USA, the UK, Spain
and Ireland
strengthens
considerably the
Keynesian case for
fiscal stimulus for
preventing a
protracted
stagnation.

68
I C R A B U L L E T I N
Money
Finance&
SEPTEMBER.2012
driven partly by the sharp rise in inventory investment from itsabysmally low (negative) level in the previous year as producers triedto rebuild their stocks for sustaining the higher level of output. But onceinventory holding had reached its optimum level, the rate of additionsto stocks was liable to come down sharply unless GDP growth waspushed up by fixed investment or policy-driven components ofaggregate demand. There was some revival of PFNI in 2011; but thiswas more than neutralised by the depressed residential investment andfiscal policy reversal.
A perusal of Table A.1 suggests how crucial the prematureattempt at fiscal consolidation was in triggering the slowdown in theUS. Though the Bush tax cuts, originally scheduled to expire in end2010, were extended by two more years and parts of the centralgovernment stimulus package consisting of the payroll tax cut,investment tax credit and enhanced unemployment insurance were toend only in January 2013, by early 2011 federal infrastructuralspending had largely tapered off and the substantial support for statesand local bodies under the Recovery Act come to a halt. As a resultcompared with the 0.7 (y-o-y) growth of government consumption andinvestment (GCI) in 2010, GCI recorded a 3.1 per cent fall in 2011.68
Though continuation of tax cuts, enhanced unemployment insurance,etc. spared the US economy from a double-dip recession, the role of thecutback in GCI behind the growth slowdown can hardly beoveremphasised, remembering that (a) the share of GCI in GDP was asubstantial 21.1 per cent in 2010; and (b) not only has GCI a muchlarger expansionary effect than tax cuts or transfers, but fiscalmultipliers also tend to be high when output gap is large and the policyrate has hit the zero lower bound. Take cognizance of the confidence-sagging effects of the prospective withdrawal of a number of fiscalstimuli currently in force along with the contractionary consequences ofthe Fiscal Consolidation Programmes (FCPs), and identification of thevillain of the piece even for the US economy seems fairlystraightforward.
Policy omissions and commissions have been more glaring inEurope. In the UK monetary policy remained expansionary, with theBOE keeping the policy rate unchanged even after the recession hadended. But though compared with the USA the recession in the euroarea was deeper, output revival slower and the employment situationsignificantly worse,69 not only were the ECB’s policy rates (1.00–2.00
68 GCI had in fact been decelerating since mid 2009 but its growthremained positive throughout 2010 until the last quarter. From Q1 10 not only didthe absolute level of GCI start falling, but the decline also tended to becomeprogressively steeper.
69 In 2009 the euro area GDP declined by 4.4 per cent compared with the3.0 per cent fall in the US output. In 2010 output growth was 2.4 per cent andunemployment 9.6 per cent in the USA; but in the euro area GDP growth was 1.9per cent and unemployment 10.1 per cent.
Take cognizance of
the confidence-
sagging effects of
the prospective
withdrawal of a
number of fiscal
stimuli currently in
force along with the
contractionary
consequences of the
Fiscal Consolidation
Programmes and
identification of the
villain of the piece
even for the US
economy seems
fairly
straightforward.

69
I C R A B U L L E T I N
Money
Finance&
SEPTEMBER.2012
per cent) higher than the federal fund rates throughout 2009 and 2010,but in 2011 the ECB also effected a 50 bp increase in the rate (to 1.50per cent) in two stages, on April 13 and July 13.70
Much more damaging (and contra-Keynesian) than in the USAwas the cutback in the fiscal stimulus programme in the euro zone asalso in the UK. Apart from the serious hangover from the housing boomand bust in Great Britain and many euro area countries, private fixedinvestment, the main driver of self-sustained recovery, after a fewquarters’ anaemic growth started decelerating sharply, from Q4 10 inthe UK and Q2 11 in the euro area, and turned negative fairly soon(Table A.2). Even so, the cutback in fiscal stimulus in the UK and eurozone, initiated from Q2 10 and Q1 10 respectively, has remained inforce. Thus growth in government consumption in Great Britain and theeuro area declined from 0.5 and 0.7 per cent in 2010 to 0.2 and –0.3per cent respectively in 2011. Given the large multiplier effect ofgovernment consumption and its 23–24 per cent share in GDP in thetwo economies, the negative impact of the deceleration/decline of thiscomponent of autonomous demand was far from inconsequential. Noless adverse were the effects of cutbacks in transfers along with taxincreases, and of the erosion of consumer and investor confidenceinduced by fiscal retrenchments.
We have already noted how from early 2011 private fixedinvestment suffered sharp deceleration and turned negative. Matterswere made much worse by the downward shift in the consumptionfunction, remembering that private consumption constituted around 60per cent of GDP. From Q1 11 onward there was a sharp fall in thegrowth of household consumption relatively to that of GDP almostthroughout the EU. Indeed, not only in distressed economies likeIreland, Italy and Spain, but in Great Britain also despite a positive(albeit declining) GDP growth, the level of household consumption fellin 2011 (Table A.2). The downward trend in the consumption-GDPratio has become much more pronounced since Q4 11, contrary to whatone would expect71 in times of stagnation or declining output. Thesharp slowdown and resurgence of recessionary tendencies in Europe, itis thus clear, have been due primarily to (a) the direct, demand-debilitating effects of the FCPs when recovery was yet to take firmroots; and (b) the consequent negative impact of the programmes onconsumers and private investors.
Debt, Deficit and Fiscal AusterityOur analysis suggests why and how the FCPs in the euro zone,
drawn up in utter disregard of Keynes’s teachings, have instead of
70 In fact, it was not until the crisis had assumed alarming proportions didthe ECB cut the rate from 1.50 to 1.25 per cent on November 9 and to 1.00 per centon December 14, 2011 and follow up the cuts by injecting a total of •1 trillion intwo stages, first in December 2011 and the second in February 2012. But thestimulus was too little, too late.
Much more
damaging and
contra-Keynesian
than in the USA was
the cutback in the
fiscal stimulus
programme in the
euro zone as also in
the UK.

70
I C R A B U L L E T I N
Money
Finance&
SEPTEMBER.2012
resolving the debt-deficit problem made it much more intractable. Notefirst that the FCPs were based on too optimistic (and completelyunwarranted) an estimate of the prospective revival of privateconsumption and investment. Second, the policy makers grosslyunderestimated the contractionary effect of the FCPs. One source ofunderestimation was neglect of the confidence-sagging effect of thewithdrawal of the fiscal stimulus itself.72 There appears to have beenlittle appreciation of the fact that, since under the programmes thecutback in deficits was to be achieved more through reduction ingovernment spending than tax increases and since fiscal multiplierstend to be large in economies with large underutilised capacity andpervasive credit constraints, the negative consequences of the FCPswere likely to be substantial.
Third, little account was taken of the spill-over effects of FCPson other economies. When countries in both the euro area andelsewhere were trying simultaneously to cut their deficits and debts, themutually reinforcing contractionary effects of the programmes in aclosely inter-connected global economy tended to make themcounterproductive.
Finally, unlike an expansionary monetary policy including QE,the major part of the demand-creating effect of fiscal stimuli, especiallyof public consumption and investment, materialises almostimmediately. The implication is that, even with a cheap money policyin force, a fiscal retrenchment in times of fledging recovery tends todrag the economy down.73 Add to that the ineffectiveness of monetarystimulus following a crash and rapid international transmission ofcycles, and it is not difficult to appreciate how the orchestrated FCPsnipped the recovery in the bud and intensified both the recession andrepayment problems of high-debt countries in the euro area.
But what about the widespread perception among policymakers and the IMF regarding the spiralling costs of public borrowingundermining the viability of government finances and dentinginvestors’ confidence? The perception was apparently justified by thesharp northward movement of interest rates on public debts of, and thepayments problems faced by, the crisis country governments in Europe.But the remedial course of action being implemented—comprisingcontinuation of FCPs everywhere along with severe austerity in crisiseconomies despite their shrinking levels of output and employment—have intensified rather than helped in resolving the crisis. Fairlyelementary considerations suggest why under the prevailing economicscenario cutbacks in fiscal stimuli (let alone fiscal retrenchments) donot make economic sense on grounds of either budgetary viability orlonger term growth.
71 a la the permanent income or the textbook Keynesian hypothesis.72 In fact, there was a presumption among policy makers that the FCPs
would boost investors’ confidence.73 As happened in the United States in 1937 and Japan in 1997.
When countries in
both the euro area
and elsewhere
were trying
simultaneously to
cut their deficits and
debts, the mutually
reinforcing
contractionary
effects of the
programmes in a
closely inter-
connected global
economy tended to
make them
counterproductive.
71
I C R A B U L L E T I N
Money
Finance&
SEPTEMBER.2012
74 Because of what is called the hysteresis effect (Phelps, 1972; De Long etal, 2012).
75 In fact, given the difference among fiscal multipliers, a combination ofvarious budgetary instruments can provide a pre-stipulated boost to aggregatedemand along with a reduction in budget deficit (Rakshit, 2005). The problem inthis context is more political than economic.
First, the classical canons of fiscal prudence, Keynes never tiresof emphasising, come into their own only when output is close to thefull-employment level, not when productive capacity is grosslyunderutilised and private propensity to spend extremely weak. Withzero marginal opportunity cost of resources, additional incomesgenerated through operation of fiscal multipliers then constitute a freelunch to the society in the short run.
Second, while an increase in government expenditures oninfrastructure, health and education adds directly to the economy’sstock of productive resources, such expenditures tend also to raiseprivate investment because of their salubrious supply-side impact onexpected returns on other categories of capital formation. Privateinvestment is also positively affected by measures like time-boundschemes of investment tax rebates and the boost to aggregate demandand capacity utilisation effected by fiscal stimuli. The result is anincrease in the economy’s full-employment level of output andgovernment revenue in the medium run if not in the long run.
Third, it is now widely recognised that large and prolongedunemployment and excess capacity lead to substantial withdrawal ofdiscouraged jobseekers from the labour market; loss of skill andundermining of morale of the unemployed; reduced opportunities of“learning by doing” for younger workers, by far the worst victims ofjoblessness; and sharp cuts in firms’ expenditures on R&D. A fiscalstimulus programme can thus prevent a protracted slide in theeconomy’s productive capacity and the (full-employment) growthpotential.74
Given the salubrious short and longer term effects of fiscalstimuli on the output (and hence of revenue) potential, the debt-deficitproblem engendered by fiscal expansion would be far from intractable.One reason is that, even in the short run (with no supply-side effect),the deficit would be moderate if the government relies more onincreases in expenditure, especially on infrastructural investment andHRD, than on tax cuts.75 What is no less important to recognise, in adepressed economy debt financing of budget deficits poses littleproblem when the government can borrow from the central bank: suchborrowing does not add to the government’s indebtedness to the publicand hence to its future debt service obligations, remembering that thecentral bank itself is a government-owned organisation (Rakshit, 2005).The absence of such central bank accommodation amidst large scaleunemployment and declining levels of economic activity suggests that,though orchestrated FCPs constitute the main reason behind the euro
The classical canons
of fiscal prudence,
Keynes never tires of
emphasising, come
into their own only
when output is
close to the full-
employment level,
not when productive
capacity is grossly
underutilised and
private propensity to
spend extremely
weak.
72
I C R A B U L L E T I N
Money
Finance&
SEPTEMBER.2012
crisis, at a more fundamental level its roots lie in the flawed design ofthe bloc’s economic arrangements: while a member country has littleautonomy over its monetary, fiscal or exchange rate policies, there isno central authority entrusted with its macrostabilisation either.
A glaring manifestation of the deficiency is the similaritybetween the deflationary policies pursued under the gold standard inpre-Keynesian days (when budget deficits were anathema) and theausterity measures being implemented for resolving the paymentsproblems. As Keynes (Ch. 19) notes, for a small open economy themeasures can conceivably provide a boost to aggregate demandthrough a fall in domestic vis-à-vis foreign prices. But it is muchsimpler to attain the same goal through devaluation—an option notopen to euro nations, but which Iceland, the worst victim of the globalcrisis, took full advantage of.
Since both domestic deflation and devaluation arecounterproductive when the economic malaise is pervasive amongnations, absence of the exchange-rate-policy autonomy is not a majorsource of the problem. Much more serious is a government’s inabilityto borrow from a national central bank and the absence of a lender oflast resort to domestic banks. The result has been that, thoughgovernment debts are denominated in euro (and were quite moderate tobegin with in countries like Ireland and Spain), over the last five yearstheir consequences have become similar to that under the goldstandard. No wonder, accelerating debt service obligations due toplunging revenues and large expenditures on bank rescues combinedwith fiscal austerity have created a vicious circle of falling incomes,rising deficits and debts (as a ratio of GDP), hardening interest rates ongovernment bonds and deepening banking troubles with growing NPAs.
The euro crisis is generally ascribed to the unwillingness on thepart of the rich euro zone countries like Germany to bear the cost ofextending financial support to crisis countries. However, given thesubstantial excess capacity throughout the currency area, there is noopportunity cost of implementing in unison by crisis and non-crisiscountries expansionary fiscal programmes, financed through borrowingfrom the ECB if and when necessary. This would enable the peripheralnations to bring down their deficit and debt (as ratios of GDP),remembering that (a) fiscal multipliers under collaborative FSPs tend tobe large and (b) the northern nations account for the major part of thearea’s GDP. The enhanced revenue, reduction in expenditure on socialsecurity, etc. and salubrious impact of the FSPs on banks’ balancesheets imply that the net ECB finance needed for supporting theprogrammes would not be large even in the short run. Also substantialwould be the gains of non-crisis countries by way of larger output andlower unemployment in the short run and higher (NAIRU) growth in thelong run. It is the absence of such a perspective, reminiscent of the pre-Keynesian macroeconomics, that seems to lie at the root of thecounterproductive policy package adopted by euro zone authorities
Accelerating debt
service obligations
due to plunging
revenues and large
expenditures on
bank rescues
combined with
fiscal austerity have
created a vicious
circle of falling
incomes, rising
deficits and debts,
hardening interest
rates on government
bonds and
deepening banking
troubles with
growing NPAs.
73
I C R A B U L L E T I N
Money
Finance&
SEPTEMBER.2012
including the so-called troika (the European Commission, the ECB andthe IMF).
V. Summary and Conclusions1. The lessons of the Keynesian economics that help in
explaining the interplay of factors including policy omissions andcommissions behind the global crisis are: (a) volatility of demand forfixed investments, especially when they are made highly liquid and theopinion of economic agents is similar; (b) impact of major shifts in themarginal efficiency of capital on inventory investment, liquiditypreference and the consumption function, particularly when investmentsare debt financed; (c) the folly of relying on protectionist measuresincluding devaluation or on domestic deflation; (d) superiority of fiscalto monetary policies for dealing with a collapse of the marginalefficiency of capital; and (e) major differences between macroeconomicconsequences of fiscal “prudence” and private thrift in a full-employment and demand-deficient economy.
2. The roots of the crisis lay in the boom and bust in residentialinvestments, not in other fixed investments. But thanks to the similarityof the models used in churning out MBSs and assessing their risk-returnprofiles for purposes of portfolio management, investments in housingacquired all the characteristics that tend to foster speculative boomsand busts and trigger a cumulative downturn as described in theGeneral Theory.
3. An important non-Keynesian feature of the crisis was thatthe recession was relatively short and shallow. The reasons howeverare completely Keynesian. In terms of Keynes’s analytical framework itis not difficult to appreciate how in a closely interconnected worldeconomy high growth in EMEs moderated the recession in advancedcountries. Much more important was the role of the simultaneous andcoordinated Keynesian expansionary measures implemented bypractically all nations as soon as the crisis broke out.
4. Recovery of the world economy in late 2009 and 2010 soongave way to a sharp slowdown everywhere, resurgence of recessionarytendencies in many countries, and outbreak of a spiralling debt crisis inthe euro zone. While the genesis of the global slowdown may be tracedto the orchestrated fiscal consolidation programmes being implementedby almost all nations since 2010, the euro area trouble is due primarilyto the near-total lack of macro-policy autonomy of crisis countriescompounded by the pre-Keynesian prescription being followed by theeuro zone authorities and the IMF.
An important non-
Keynesian feature of
the crisis was that
the recession was
relatively short and
shallow. The
reasons however
are completely
Keynesian.
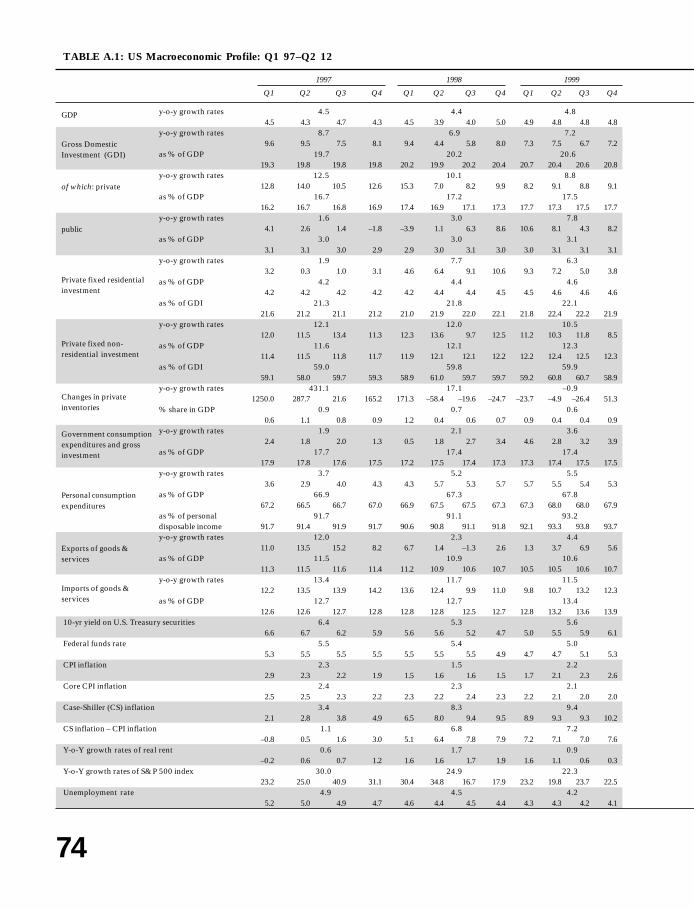
74
I C R A B U L L E T I N
Money
Finance&
SEPTEMBER.2012
TABLE A.1: US Macroeconomic Profile: Q1 97–Q2 12
1997 1998 1999
Q1 Q2 Q3 Q4 Q1 Q2 Q3 Q4 Q1 Q2 Q3 Q4
y-o-y growth rates 4.5 4.4 4.84.5 4.3 4.7 4.3 4.5 3.9 4.0 5.0 4.9 4.8 4.8 4.8
y-o-y growth rates 8.7 6.9 7.29.6 9.5 7.5 8.1 9.4 4.4 5.8 8.0 7.3 7.5 6.7 7.2
as % of GDP 19.7 20.2 20.619.3 19.8 19.8 19.8 20.2 19.9 20.2 20.4 20.7 20.4 20.6 20.8
y-o-y growth rates 12.5 10.1 8.812.8 14.0 10.5 12.6 15.3 7.0 8.2 9.9 8.2 9.1 8.8 9.1
as % of GDP 16.7 17.2 17.516.2 16.7 16.8 16.9 17.4 16.9 17.1 17.3 17.7 17.3 17.5 17.7
y-o-y growth rates 1.6 3.0 7.84.1 2.6 1.4 –1.8 –3.9 1.1 6.3 8.6 10.6 8.1 4.3 8.2
as % of GDP 3.0 3.0 3.13.1 3.1 3.0 2.9 2.9 3.0 3.1 3.0 3.0 3.1 3.1 3.1
y-o-y growth rates 1.9 7.7 6.33.2 0.3 1.0 3.1 4.6 6.4 9.1 10.6 9.3 7.2 5.0 3.8
as % of GDP 4.2 4.4 4.64.2 4.2 4.2 4.2 4.2 4.4 4.4 4.5 4.5 4.6 4.6 4.6
as % of GDI 21.3 21.8 22.121.6 21.2 21.1 21.2 21.0 21.9 22.0 22.1 21.8 22.4 22.2 21.9
y-o-y growth rates 12.1 12.0 10.512.0 11.5 13.4 11.3 12.3 13.6 9.7 12.5 11.2 10.3 11.8 8.5
as % of GDP 11.6 12.1 12.311.4 11.5 11.8 11.7 11.9 12.1 12.1 12.2 12.2 12.4 12.5 12.3
as % of GDI 59.0 59.8 59.959.1 58.0 59.7 59.3 58.9 61.0 59.7 59.7 59.2 60.8 60.7 58.9
y-o-y growth rates 431.1 17.1 –0.91250.0 287.7 21.6 165.2 171.3 –58.4 –19.6 –24.7 –23.7 –4.9 –26.4 51.3
% share in GDP 0.9 0.7 0.60.6 1.1 0.8 0.9 1.2 0.4 0.6 0.7 0.9 0.4 0.4 0.9
y-o-y growth rates 1.9 2.1 3.62.4 1.8 2.0 1.3 0.5 1.8 2.7 3.4 4.6 2.8 3.2 3.9
as % of GDP 17.7 17.4 17.417.9 17.8 17.6 17.5 17.2 17.5 17.4 17.3 17.3 17.4 17.5 17.5
y-o-y growth rates 3.7 5.2 5.53.6 2.9 4.0 4.3 4.3 5.7 5.3 5.7 5.7 5.5 5.4 5.3
as % of GDP 66.9 67.3 67.867.2 66.5 66.7 67.0 66.9 67.5 67.5 67.3 67.3 68.0 68.0 67.9
as % of personal 91.7 91.1 93.2disposable income 91.7 91.4 91.9 91.7 90.6 90.8 91.1 91.8 92.1 93.3 93.8 93.7y-o-y growth rates 12.0 2.3 4.4
11.0 13.5 15.2 8.2 6.7 1.4 –1.3 2.6 1.3 3.7 6.9 5.6as % of GDP 11.5 10.9 10.6
11.3 11.5 11.6 11.4 11.2 10.9 10.6 10.7 10.5 10.5 10.6 10.7y-o-y growth rates 13.4 11.7 11.5
12.2 13.5 13.9 14.2 13.6 12.4 9.9 11.0 9.8 10.7 13.2 12.3as % of GDP 12.7 12.7 13.4
12.6 12.6 12.7 12.8 12.8 12.8 12.5 12.7 12.8 13.2 13.6 13.910-yr yield on U.S. Treasury securities 6.4 5.3 5.6
6.6 6.7 6.2 5.9 5.6 5.6 5.2 4.7 5.0 5.5 5.9 6.1Federal funds rate 5.5 5.4 5.0
5.3 5.5 5.5 5.5 5.5 5.5 5.5 4.9 4.7 4.7 5.1 5.3CPI inflation 2.3 1.5 2.2
2.9 2.3 2.2 1.9 1.5 1.6 1.6 1.5 1.7 2.1 2.3 2.6Core CPI inflation 2.4 2.3 2.1
2.5 2.5 2.3 2.2 2.3 2.2 2.4 2.3 2.2 2.1 2.0 2.0Case-Shiller (CS) inflation 3.4 8.3 9.4
2.1 2.8 3.8 4.9 6.5 8.0 9.4 9.5 8.9 9.3 9.3 10.2CS inflation – CPI inflation 1.1 6.8 7.2
–0.8 0.5 1.6 3.0 5.1 6.4 7.8 7.9 7.2 7.1 7.0 7.6Y-o-Y growth rates of real rent 0.6 1.7 0.9
–0.2 0.6 0.7 1.2 1.6 1.6 1.7 1.9 1.6 1.1 0.6 0.3Y-o-Y growth rates of S&P 500 index 30.0 24.9 22.3
23.2 25.0 40.9 31.1 30.4 34.8 16.7 17.9 23.2 19.8 23.7 22.5Unemployment rate 4.9 4.5 4.2
5.2 5.0 4.9 4.7 4.6 4.4 4.5 4.4 4.3 4.3 4.2 4.1
GDP
Gross DomesticInvestment (GDI)
of which: private
public
Private fixed residentialinvestment
Private fixed non-residential investment
Changes in privateinventories
Government consumptionexpenditures and grossinvestment
Personal consumptionexpenditures
Exports of goods &services
Imports of goods &services
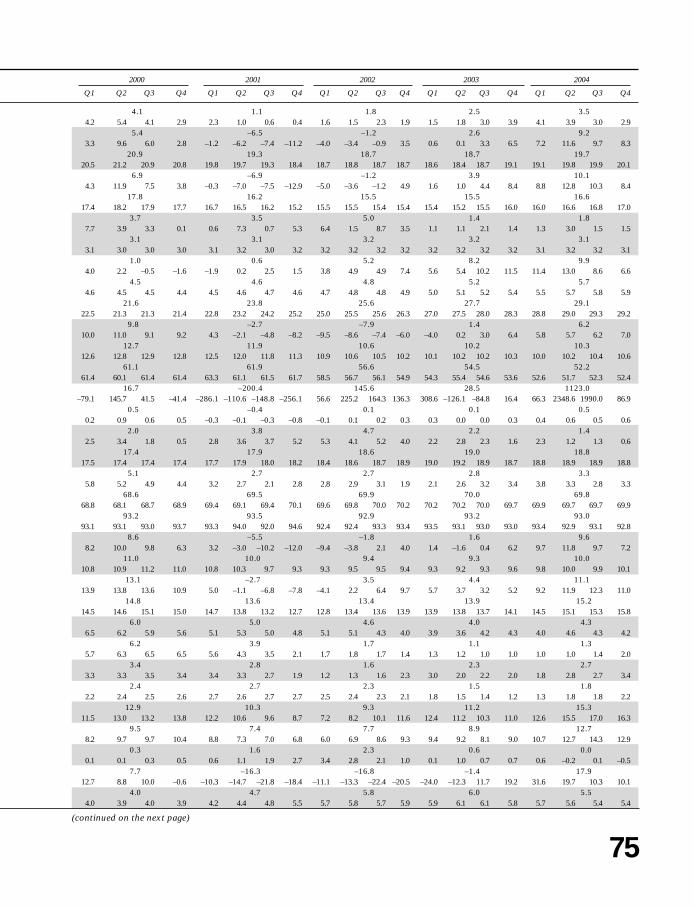
75
I C R A B U L L E T I N
Money
Finance&
SEPTEMBER.2012
2000 2001 2002 2003 2004
Q1 Q2 Q3 Q4 Q1 Q2 Q3 Q4 Q1 Q2 Q3 Q4 Q1 Q2 Q3 Q4 Q1 Q2 Q3 Q4
4.1 1.1 1.8 2.5 3.54.2 5.4 4.1 2.9 2.3 1.0 0.6 0.4 1.6 1.5 2.3 1.9 1.5 1.8 3.0 3.9 4.1 3.9 3.0 2.9
5.4 –6.5 –1.2 2.6 9.23.3 9.6 6.0 2.8 –1.2 –6.2 –7.4 –11.2 –4.0 –3.4 –0.9 3.5 0.6 0.1 3.3 6.5 7.2 11.6 9.7 8.3
20.9 19.3 18.7 18.7 19.720.5 21.2 20.9 20.8 19.8 19.7 19.3 18.4 18.7 18.8 18.7 18.7 18.6 18.4 18.7 19.1 19.1 19.8 19.9 20.1
6.9 –6.9 –1.2 3.9 10.14.3 11.9 7.5 3.8 –0.3 –7.0 –7.5 –12.9 –5.0 –3.6 –1.2 4.9 1.6 1.0 4.4 8.4 8.8 12.8 10.3 8.4
17.8 16.2 15.5 15.5 16.617.4 18.2 17.9 17.7 16.7 16.5 16.2 15.2 15.5 15.5 15.4 15.4 15.4 15.2 15.5 16.0 16.0 16.6 16.8 17.0
3.7 3.5 5.0 1.4 1.87.7 3.9 3.3 0.1 0.6 7.3 0.7 5.3 6.4 1.5 8.7 3.5 1.1 1.1 2.1 1.4 1.3 3.0 1.5 1.5
3.1 3.1 3.2 3.2 3.13.1 3.0 3.0 3.0 3.1 3.2 3.0 3.2 3.2 3.2 3.2 3.2 3.2 3.2 3.2 3.2 3.1 3.2 3.2 3.1
1.0 0.6 5.2 8.2 9.94.0 2.2 –0.5 –1.6 –1.9 0.2 2.5 1.5 3.8 4.9 4.9 7.4 5.6 5.4 10.2 11.5 11.4 13.0 8.6 6.6
4.5 4.6 4.8 5.2 5.74.6 4.5 4.5 4.4 4.5 4.6 4.7 4.6 4.7 4.8 4.8 4.9 5.0 5.1 5.2 5.4 5.5 5.7 5.8 5.9
21.6 23.8 25.6 27.7 29.122.5 21.3 21.3 21.4 22.8 23.2 24.2 25.2 25.0 25.5 25.6 26.3 27.0 27.5 28.0 28.3 28.8 29.0 29.3 29.2
9.8 –2.7 –7.9 1.4 6.210.0 11.0 9.1 9.2 4.3 –2.1 –4.8 –8.2 –9.5 –8.6 –7.4 –6.0 –4.0 0.2 3.0 6.4 5.8 5.7 6.2 7.0
12.7 11.9 10.6 10.2 10.312.6 12.8 12.9 12.8 12.5 12.0 11.8 11.3 10.9 10.6 10.5 10.2 10.1 10.2 10.2 10.3 10.0 10.2 10.4 10.6
61.1 61.9 56.6 54.5 52.261.4 60.1 61.4 61.4 63.3 61.1 61.5 61.7 58.5 56.7 56.1 54.9 54.3 55.4 54.6 53.6 52.6 51.7 52.3 52.4
16.7 –200.4 145.6 28.5 1123.0–79.1 145.7 41.5 –41.4 –286.1 –110.6 –148.8 –256.1 56.6 225.2 164.3 136.3 308.6 –126.1 –84.8 16.4 66.3 2348.6 1990.0 86.9
0.5 –0.4 0.1 0.1 0.50.2 0.9 0.6 0.5 –0.3 –0.1 –0.3 –0.8 –0.1 0.1 0.2 0.3 0.3 0.0 0.0 0.3 0.4 0.6 0.5 0.6
2.0 3.8 4.7 2.2 1.42.5 3.4 1.8 0.5 2.8 3.6 3.7 5.2 5.3 4.1 5.2 4.0 2.2 2.8 2.3 1.6 2.3 1.2 1.3 0.6
17.4 17.9 18.6 19.0 18.817.5 17.4 17.4 17.4 17.7 17.9 18.0 18.2 18.4 18.6 18.7 18.9 19.0 19.2 18.9 18.7 18.8 18.9 18.9 18.8
5.1 2.7 2.7 2.8 3.35.8 5.2 4.9 4.4 3.2 2.7 2.1 2.8 2.8 2.9 3.1 1.9 2.1 2.6 3.2 3.4 3.8 3.3 2.8 3.3
68.6 69.5 69.9 70.0 69.868.8 68.1 68.7 68.9 69.4 69.1 69.4 70.1 69.6 69.8 70.0 70.2 70.2 70.2 70.0 69.7 69.9 69.7 69.7 69.9
93.2 93.5 92.9 93.2 93.093.1 93.1 93.0 93.7 93.3 94.0 92.0 94.6 92.4 92.4 93.3 93.4 93.5 93.1 93.0 93.0 93.4 92.9 93.1 92.8
8.6 –5.5 –1.8 1.6 9.68.2 10.0 9.8 6.3 3.2 –3.0 –10.2 –12.0 –9.4 –3.8 2.1 4.0 1.4 –1.6 0.4 6.2 9.7 11.8 9.7 7.2
11.0 10.0 9.4 9.3 10.010.8 10.9 11.2 11.0 10.8 10.3 9.7 9.3 9.3 9.5 9.5 9.4 9.3 9.2 9.3 9.6 9.8 10.0 9.9 10.1
13.1 –2.7 3.5 4.4 11.113.9 13.8 13.6 10.9 5.0 –1.1 –6.8 –7.8 –4.1 2.2 6.4 9.7 5.7 3.7 3.2 5.2 9.2 11.9 12.3 11.0
14.8 13.6 13.4 13.9 15.214.5 14.6 15.1 15.0 14.7 13.8 13.2 12.7 12.8 13.4 13.6 13.9 13.9 13.8 13.7 14.1 14.5 15.1 15.3 15.8
6.0 5.0 4.6 4.0 4.36.5 6.2 5.9 5.6 5.1 5.3 5.0 4.8 5.1 5.1 4.3 4.0 3.9 3.6 4.2 4.3 4.0 4.6 4.3 4.2
6.2 3.9 1.7 1.1 1.35.7 6.3 6.5 6.5 5.6 4.3 3.5 2.1 1.7 1.8 1.7 1.4 1.3 1.2 1.0 1.0 1.0 1.0 1.4 2.0
3.4 2.8 1.6 2.3 2.73.3 3.3 3.5 3.4 3.4 3.3 2.7 1.9 1.2 1.3 1.6 2.3 3.0 2.0 2.2 2.0 1.8 2.8 2.7 3.4
2.4 2.7 2.3 1.5 1.82.2 2.4 2.5 2.6 2.7 2.6 2.7 2.7 2.5 2.4 2.3 2.1 1.8 1.5 1.4 1.2 1.3 1.8 1.8 2.2
12.9 10.3 9.3 11.2 15.311.5 13.0 13.2 13.8 12.2 10.6 9.6 8.7 7.2 8.2 10.1 11.6 12.4 11.2 10.3 11.0 12.6 15.5 17.0 16.3
9.5 7.4 7.7 8.9 12.78.2 9.7 9.7 10.4 8.8 7.3 7.0 6.8 6.0 6.9 8.6 9.3 9.4 9.2 8.1 9.0 10.7 12.7 14.3 12.9
0.3 1.6 2.3 0.6 0.00.1 0.1 0.3 0.5 0.6 1.1 1.9 2.7 3.4 2.8 2.1 1.0 0.1 1.0 0.7 0.7 0.6 –0.2 0.1 –0.5
7.7 –16.3 –16.8 –1.4 17.912.7 8.8 10.0 –0.6 –10.3 –14.7 –21.8 –18.4 –11.1 –13.3 –22.4 –20.5 –24.0 –12.3 11.7 19.2 31.6 19.7 10.3 10.1
4.0 4.7 5.8 6.0 5.54.0 3.9 4.0 3.9 4.2 4.4 4.8 5.5 5.7 5.8 5.7 5.9 5.9 6.1 6.1 5.8 5.7 5.6 5.4 5.4
(continued on the next page)

76
I C R A B U L L E T I N
Money
Finance&
SEPTEMBER.2012
2005 2006 2007
Q1 Q2 Q3 Q4 Q1 Q2 Q3 Q4 Q1 Q2 Q3 Q4
y-o-y growth rates 3.1 2.7 1.93.3 3.1 3.1 2.8 3.0 3.0 2.2 2.4 1.2 1.7 2.5 2.2
y-o-y growth rates 6.1 4.1 –2.89.7 4.3 4.2 6.2 6.0 7.3 4.3 –1.3 –4.0 –2.8 –2.1 –2.4
as % of GDP 20.3 20.6 19.620.3 20.0 20.1 20.8 20.9 20.9 20.6 20.0 19.8 19.9 19.6 19.1
y-o-y growth rates 5.6 2.8 –3.210.1 3.7 3.5 5.1 4.4 6.2 3.5 –3.0 –5.3 –3.1 –2.5 –2.0
as % of GDP 17.2 17.4 16.417.2 16.9 17.0 17.6 17.8 17.6 17.4 16.8 16.6 16.7 16.4 15.9
y-o-y growth rates 1.9 5.0 4.41.2 1.0 1.5 3.9 5.0 6.6 4.4 4.2 4.9 3.3 4.9 4.4
as % of GDP 3.1 3.2 3.33.1 3.1 3.1 3.2 3.1 3.2 3.2 3.2 3.2 3.3 3.3 3.3
y-o-y growth rates 6.3 –7.2 –18.77.6 6.1 6.1 5.3 2.3 –4.6 –11.0 –15.7 –18.6 –17.4 –18.2 –20.7
as % of GDP 6.1 5.7 4.55.9 6.1 6.2 6.3 6.2 5.9 5.5 5.2 4.9 4.7 4.3 4.0
as % of GDI 30.2 27.7 22.829.3 30.5 30.9 30.1 29.6 28.2 26.9 26.0 25.0 23.6 22.1 20.7
y-o-y growth rates 6.7 8.0 6.58.8 7.5 6.1 4.5 8.0 8.3 7.9 7.8 5.0 5.9 7.1 7.9
as % of GDP 10.7 11.3 11.710.6 10.7 10.7 10.7 11.1 11.2 11.3 11.4 11.5 11.6 11.8 11.8
as % of GDI 52.6 54.7 59.552.0 53.3 53.2 51.7 53.1 53.8 55.2 56.8 58.0 58.4 59.9 61.8
y-o-y growth rates –18.5 187.8 –54.774.4 –80.3 –81.2 13.1 –28.0 367.7 472.0 –60.7 –73.7 –38.1 –46.5 –60.4
% share in GDP 0.4 0.4 0.20.7 0.1 0.1 0.6 0.5 0.5 0.5 0.2 0.1 0.3 0.3 0.1
y-o-y growth rates 0.3 1.4 1.30.2 0.0 0.5 0.7 1.6 1.6 0.8 1.5 0.4 1.2 1.9 1.9
as % of GDP 18.8 18.8 19.118.7 18.8 18.9 18.7 18.8 18.8 18.9 18.8 18.9 19.0 19.1 19.2
y-o-y growth rates 3.4 2.9 2.33.2 3.8 3.7 2.8 3.1 2.7 2.5 3.2 2.7 2.5 2.3 1.7
as % of GDP 69.7 69.5 69.769.5 69.8 69.9 69.7 69.3 69.4 69.8 69.6 69.8 69.6 69.5 69.8
as % of personaldisposable income 94.9 93.8 93.8
94.7 95.0 95.1 94.8 94.0 93.8 93.9 93.5 93.6 93.8 93.9 93.6y-o-y growth rates 6.8 9.0 9.3
6.6 7.2 6.5 6.7 8.8 8.3 8.5 10.2 7.8 7.7 11.6 10.1as % of GDP 10.3 11.0 11.8
10.2 10.4 10.3 10.5 10.7 10.9 11.0 11.3 11.5 11.6 12.0 12.4y-o-y growth rates 6.2 6.1 2.4
8.8 5.8 4.9 5.2 6.6 6.6 7.2 4.1 3.7 3.1 2.1 0.8as % of GDP 16.1 16.7 16.9
15.7 15.9 16.0 16.6 16.6 16.8 17.0 16.6 16.7 16.8 16.9 17.210-yr yield on U.S. Treasury securities 4.3 4.8 4.6
4.3 4.2 4.2 4.5 4.6 5.1 4.9 4.6 4.7 4.8 4.7 4.3Federal funds rate 3.2 5.0 5.0
2.5 2.9 3.5 4.0 4.5 4.9 5.2 5.2 5.3 5.3 5.1 4.5CPI inflation 3.4 3.2 2.9
3.0 2.9 3.8 3.7 3.7 3.9 3.3 2.0 2.4 2.7 2.3 4.0Core CPI inflation 2.1 2.5 2.3
2.3 2.1 2.0 2.1 2.1 2.5 2.8 2.7 2.6 2.3 2.1 2.3Case-Shiller (CS) inflation 15.8 7.8 –3.8
16.6 15.9 15.1 15.5 13.7 10.0 5.6 1.7 –0.6 –2.6 –4.5 –7.7CS inflation – CPI inflation 12.4 4.5 –6.7
13.5 13.0 11.3 11.9 10.0 6.1 2.2 –0.2 –3.0 –5.3 –6.9 –11.7Y-o-Y growth rates of real rent –0.4 0.3 1.4
0.0 0.0 –0.9 –0.5 –0.6 –0.6 0.4 2.1 2.1 1.7 1.7 0.0Y-o-Y growth rates of S&P 500 index 6.8 8.5 12.8
5.2 5.2 10.9 5.8 7.7 8.4 5.2 12.9 11.0 16.9 15.6 7.7Unemployment rate 5.1 4.6 4.6
5.3 5.1 5.0 5.0 4.7 4.6 4.6 4.4 4.5 4.5 4.7 4.8
GDP
Gross DomesticInvestment (GDI)
of which: private
public
Private fixed residentialinvestment
Private fixed non-residential investment
Changes in privateinventories
Government consumptionexpenditures and grossinvestment
Personal consumptionexpenditures
Exports of goods &services
Imports of goods &services
Source: Bureau of Economic Analysis, US Department of Commerce(www.bea.gov); Bureau of Labor Statistics, US Department of Labor(www.bls.gov); Standard & Poor’s (www.standardandpoors.com).

77
I C R A B U L L E T I N
Money
Finance&
SEPTEMBER.2012
2008 2009 2010 2011 2012
Q1 Q2 Q3 Q4 Q1 Q2 Q3 Q4 Q1 Q2 Q3 Q4 Q1 Q2 Q3 Q4 Q1 Q2
–0.3 –3.0 2.4 1.81.6 1.0 –0.6 –3.3 –4.2 –4.6 –3.3 –0.1 1.9 2.5 2.8 2.4 1.8 1.9 1.6 2.0 2.4 2.2
–8.1 –21.0 7.8 2.0–4.2 –6.4 –8.8 –13.1 –20.6 –25.3 –24.1 –14.0 –0.5 9.9 15.0 6.8 2.0 0.7 –1.5 6.5 9.5 8.8
18.1 14.7 15.5 15.518.6 18.5 18.0 17.2 15.4 14.5 14.2 14.8 15.1 15.5 15.8 15.4 15.1 15.3 15.4 16.1 16.2 16.3
–10.2 –24.4 14.0 5.2–4.2 –7.7 –11.1 –17.8 –26.3 –30.8 –27.9 –12.8 5.0 17.5 22.6 10.7 4.4 3.9 1.5 10.9 14.1 13.0
14.6 11.1 12.0 12.315.3 15.0 14.5 13.6 11.8 10.8 10.5 11.3 11.6 12.0 12.3 12.0 11.9 12.1 12.2 13.0 13.1 13.3
6.5 1.2 –1.6 –7.04.8 6.7 7.6 6.9 4.2 2.4 0.1 –2.1 –3.0 –1.6 –0.5 –1.1 –3.7 –7.8 –9.7 –6.6 –5.0 –4.3
3.5 3.6 3.5 3.23.3 3.4 3.5 3.6 3.6 3.7 3.7 3.5 3.4 3.5 3.5 3.4 3.3 3.2 3.1 3.1 3.0 3.0
–23.9 –22.0 –3.6 –1.2–23.8 –24.3 –23.3 –24.4 –26.2 –27.9 –20.7 –13.3 –6.4 5.0 –7.2 –5.7 –3.2 –7.1 1.4 3.9 9.3 10.7
3.3 2.5 2.3 2.23.6 3.4 3.2 2.9 2.7 2.5 2.5 2.5 2.4 2.5 2.3 2.3 2.2 2.2 2.2 2.3 2.4 2.4
18.2 17.2 15.2 14.519.4 18.6 17.9 17.1 17.2 17.0 17.9 16.8 15.9 16.0 14.3 14.6 14.8 14.6 14.5 14.1 14.6 14.7
–0.7 –18.0 0.9 8.66.0 2.8 –2.0 –9.4 –16.7 –20.1 –19.7 –15.7 –7.7 –0.3 3.7 7.7 6.8 7.4 10.1 10.2 12.5 10.2
11.6 9.7 9.2 9.811.8 11.7 11.6 11.2 10.4 9.8 9.4 9.1 9.0 9.2 9.3 9.4 9.4 9.7 10.0 10.2 10.3 10.4
64.1 65.6 59.7 63.463.5 63.5 64.2 65.3 67.1 67.5 66.5 61.4 59.7 59.3 58.6 61.0 62.1 63.0 65.2 63.1 63.8 63.7
–311.7 –658.2 151.6 –16.4–172.3 –131.6 –205.5 –737.3 –1101.6 –1206.3 –376.4 51.7 120.3 117.9 152.3 216.0 –0.7 –17.2 –104.5 56.7 87.8 141.1
–0.3 –1.1 0.4 0.2–0.1 –0.1 –0.3 –0.6 –1.2 –1.5 –1.4 –0.3 0.2 0.3 0.8 0.3 0.2 0.2 0.0 0.5 0.5
2.6 3.7 0.7 –3.12.8 2.4 2.6 2.7 2.3 4.3 4.1 4.0 2.7 1.1 0.1 –1.3 –2.3 –3.2 –3.8 –3.3 –2.2 –2.4
20.1 21.2 21.1 20.319.7 19.9 20.4 20.6 20.8 21.3 21.5 21.4 21.2 21.2 21.1 20.8 20.6 20.5 20.2 19.9 19.7 19.5
–0.5 –1.9 1.8 2.50.9 0.4 –1.0 –2.5 –2.7 –3.1 –1.6 –0.3 0.7 1.8 1.9 2.9 3.1 2.7 2.5 1.9 1.8 1.9
70.2 70.5 70.5 71.270.2 70.2 70.4 70.0 70.2 70.3 70.9 70.5 70.6 70.4 70.3 70.6 71.3 71.2 71.2 71.0 71.1 71.0
91.0 91.8 91.8 92.992.1 90.3 91.5 90.3 91.1 90.8 92.7 92.8 92.1 91.3 91.6 92.3 92.0 92.6 93.2 93.8 93.5 93.1
6.3 –9.0 11.2 6.79.8 11.3 6.4 –2.5 –11.6 –14.1 –10.5 0.3 10.7 13.1 12.1 8.8 8.7 7.4 6.5 4.3 4.0 4.3
12.9 11.4 12.7 13.912.7 13.3 13.4 12.2 10.9 11.0 11.4 12.1 12.3 12.6 12.8 13.2 13.7 13.9 14.1 13.8 13.9 14.0
–2.7 –13.4 12.5 4.9–0.3 –1.4 –3.3 –5.8 –15.4 –18.5 –13.7 –6.1 6.7 16.7 15.9 10.9 9.3 4.4 2.2 3.5 3.2 4.7
17.9 14.1 16.2 17.717.9 18.5 18.7 16.4 13.7 13.4 14.3 15.2 15.7 16.2 16.4 16.6 17.5 17.8 17.7 17.7 17.9 17.9
3.7 3.3 3.2 2.83.7 3.9 3.9 3.3 2.7 3.3 3.5 3.5 3.7 3.5 2.8 2.9 3.5 3.2 2.4 2.0 2.0 1.8
1.9 0.2 0.2 0.13.2 2.1 1.9 0.5 0.2 0.2 0.2 0.1 0.1 0.2 0.2 0.2 0.2 0.1 0.1 0.1 0.1 0.2
3.8 –0.3 1.7 3.14.2 4.3 5.3 1.6 –0.2 –1.0 –1.6 1.5 2.4 1.8 1.2 1.2 2.1 3.3 3.8 3.3 2.8
2.3 1.7 1.0 1.72.4 2.3 2.5 2.0 1.7 1.8 1.5 1.7 1.3 1.0 0.9 0.6 1.1 1.5 1.9 2.2 2.2
–15.8 –13.0 1.3 –3.9–12.4 –15.5 –16.9 –18.4 –18.6 –16.7 –11.5 –5.3 0.9 4.3 1.6 –1.6 –3.4 –4.4 –3.9 –3.8 –3.3
–19.6 –12.7 –0.4 –7.0–16.6 –19.8 –22.2 –19.9 –18.5 –15.8 –9.9 –6.8 –1.5 2.5 0.4 –2.9 –5.6 –7.7 –7.6 –7.2 –6.1
–0.1 2.6 –1.4 –1.4–0.4 –0.7 –1.5 2.0 3.5 3.9 3.6 –0.5 –2.0 –1.8 –1.1 –0.7 –1.0 –1.9 –1.8 –0.9 –0.3
–17.1 –19.1 21.7 11.5–5.2 –8.4 –15.9 –39.0 –40.2 –34.9 –20.5 19.4 39.1 27.1 10.1 10.6 16.2 16.2 12.0 1.8 3.4 2.4
5.8 9.3 9.6 9.05.0 5.3 6.0 6.9 8.3 9.3 9.6 9.9 9.8 9.6 9.5 9.6 9.0 9.0 9.1 8.7 8.3 8.2
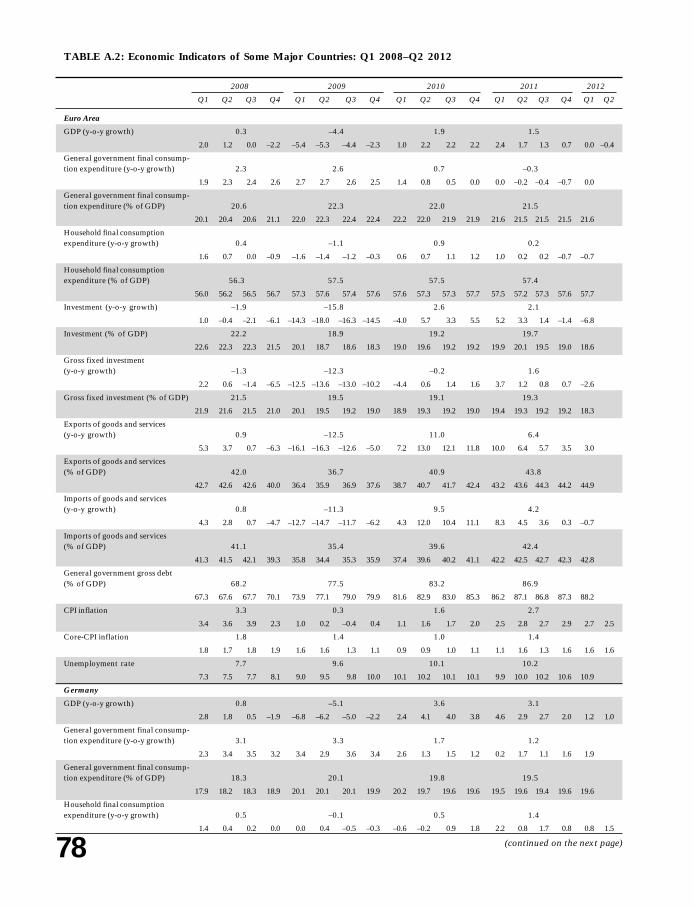
78
I C R A B U L L E T I N
Money
Finance&
SEPTEMBER.2012
TABLE A.2: Economic Indicators of Some Major Countries: Q1 2008–Q2 2012
2008 2009 2010 2011 2012
Q1 Q2 Q3 Q4 Q1 Q2 Q3 Q4 Q1 Q2 Q3 Q4 Q1 Q2 Q3 Q4 Q1 Q2
Euro Area
GDP (y-o-y growth) 0.3 –4.4 1.9 1.5
2.0 1.2 0.0 –2.2 –5.4 –5.3 –4.4 –2.3 1.0 2.2 2.2 2.2 2.4 1.7 1.3 0.7 0.0 –0.4
General government final consump-tion expenditure (y-o-y growth) 2.3 2.6 0.7 –0.3
1.9 2.3 2.4 2.6 2.7 2.7 2.6 2.5 1.4 0.8 0.5 0.0 0.0 –0.2 –0.4 –0.7 0.0
General government final consump-tion expenditure (% of GDP) 20.6 22.3 22.0 21.5
20.1 20.4 20.6 21.1 22.0 22.3 22.4 22.4 22.2 22.0 21.9 21.9 21.6 21.5 21.5 21.5 21.6
Household final consumptionexpenditure (y-o-y growth) 0.4 –1.1 0.9 0.2
1.6 0.7 0.0 –0.9 –1.6 –1.4 –1.2 –0.3 0.6 0.7 1.1 1.2 1.0 0.2 0.2 –0.7 –0.7
Household final consumptionexpenditure (% of GDP) 56.3 57.5 57.5 57.4
56.0 56.2 56.5 56.7 57.3 57.6 57.4 57.6 57.6 57.3 57.3 57.7 57.5 57.2 57.3 57.6 57.7
Investment (y-o-y growth) –1.9 –15.8 2.6 2.1
1.0 –0.4 –2.1 –6.1 –14.3 –18.0 –16.3 –14.5 –4.0 5.7 3.3 5.5 5.2 3.3 1.4 –1.4 –6.8
Investment (% of GDP) 22.2 18.9 19.2 19.7
22.6 22.3 22.3 21.5 20.1 18.7 18.6 18.3 19.0 19.6 19.2 19.2 19.9 20.1 19.5 19.0 18.6
Gross fixed investment(y-o-y growth) –1.3 –12.3 –0.2 1.6
2.2 0.6 –1.4 –6.5 –12.5 –13.6 –13.0 –10.2 –4.4 0.6 1.4 1.6 3.7 1.2 0.8 0.7 –2.6
Gross fixed investment (% of GDP) 21.5 19.5 19.1 19.3
21.9 21.6 21.5 21.0 20.1 19.5 19.2 19.0 18.9 19.3 19.2 19.0 19.4 19.3 19.2 19.2 18.3
Exports of goods and services(y-o-y growth) 0.9 –12.5 11.0 6.4
5.3 3.7 0.7 –6.3 –16.1 –16.3 –12.6 –5.0 7.2 13.0 12.1 11.8 10.0 6.4 5.7 3.5 3.0
Exports of goods and services(% of GDP) 42.0 36.7 40.9 43.8
42.7 42.6 42.6 40.0 36.4 35.9 36.9 37.6 38.7 40.7 41.7 42.4 43.2 43.6 44.3 44.2 44.9
Imports of goods and services(y-o-y growth) 0.8 –11.3 9.5 4.2
4.3 2.8 0.7 –4.7 –12.7 –14.7 –11.7 –6.2 4.3 12.0 10.4 11.1 8.3 4.5 3.6 0.3 –0.7
Imports of goods and services(% of GDP) 41.1 35.4 39.6 42.4
41.3 41.5 42.1 39.3 35.8 34.4 35.3 35.9 37.4 39.6 40.2 41.1 42.2 42.5 42.7 42.3 42.8
General government gross debt(% of GDP) 68.2 77.5 83.2 86.9
67.3 67.6 67.7 70.1 73.9 77.1 79.0 79.9 81.6 82.9 83.0 85.3 86.2 87.1 86.8 87.3 88.2
CPI inflation 3.3 0.3 1.6 2.7
3.4 3.6 3.9 2.3 1.0 0.2 –0.4 0.4 1.1 1.6 1.7 2.0 2.5 2.8 2.7 2.9 2.7 2.5
Core-CPI inflation 1.8 1.4 1.0 1.4
1.8 1.7 1.8 1.9 1.6 1.6 1.3 1.1 0.9 0.9 1.0 1.1 1.1 1.6 1.3 1.6 1.6 1.6
Unemployment rate 7.7 9.6 10.1 10.2
7.3 7.5 7.7 8.1 9.0 9.5 9.8 10.0 10.1 10.2 10.1 10.1 9.9 10.0 10.2 10.6 10.9
Germany
GDP (y-o-y growth) 0.8 –5.1 3.6 3.1
2.8 1.8 0.5 –1.9 –6.8 –6.2 –5.0 –2.2 2.4 4.1 4.0 3.8 4.6 2.9 2.7 2.0 1.2 1.0
General government final consump-tion expenditure (y-o-y growth) 3.1 3.3 1.7 1.2
2.3 3.4 3.5 3.2 3.4 2.9 3.6 3.4 2.6 1.3 1.5 1.2 0.2 1.7 1.1 1.6 1.9
General government final consump-tion expenditure (% of GDP) 18.3 20.1 19.8 19.5
17.9 18.2 18.3 18.9 20.1 20.1 20.1 19.9 20.2 19.7 19.6 19.6 19.5 19.6 19.4 19.6 19.6
Household final consumptionexpenditure (y-o-y growth) 0.5 –0.1 0.5 1.4
1.4 0.4 0.2 0.0 0.0 0.4 –0.5 –0.3 –0.6 –0.2 0.9 1.8 2.2 0.8 1.7 0.8 0.8 1.5
(continued on the next page)

79
I C R A B U L L E T I N
Money
Finance&
SEPTEMBER.2012
Household final consumptionexpenditure (% of GDP) 54.7 56.9 56.0 55.8
54.0 54.3 55.0 55.6 57.3 57.5 56.6 56.3 56.2 55.9 55.7 56.1 55.9 55.4 55.8 56.0 55.8
Gross investment (y-o-y growth) 0.8 –15.7 9.5 8.1
1.3 1.0 1.6 –0.6 –13.9 –18.7 –15.6 –14.4 0.2 17.6 7.9 12.4 9.6 8.6 6.8 7.4 –0.1
Gross investment (% of GDP) 19.4 16.5 17.3 18.2
19.8 18.9 19.9 18.9 17.6 15.8 16.7 15.9 16.9 17.7 17.3 17.2 17.9 18.7 18.1 18.1 17.7
Gross fixed investment(y-o-y growth) 1.0 –11.3 5.2 6.7
3.2 2.0 1.6 –2.8 –12.5 –11.5 –11.2 –10.1 –0.7 6.5 7.5 7.4 11.5 5.5 4.2 5.6 0.3
Gross fixed investment (% of GDP) 18.6 17.2 17.5 18.2
18.7 18.4 18.6 18.7 17.6 17.2 17.1 17.0 16.9 17.6 17.7 17.6 18.1 18.1 18.1 18.3 18.0
Exports of goods and services(y-o-y growth) 2.2 –13.5 13.4 8.5
7.1 5.1 2.3 –5.6 –16.7 –17.3 –13.7 –6.4 7.9 16.7 15.1 13.9 12.5 7.5 8.2 5.6 5.2
Exports of goods and services(% of GDP) 48.0 41.9 46.7 50.1
48.6 48.6 48.6 46.3 42.1 40.9 41.9 42.7 43.9 46.7 47.8 48.2 49.1 49.9 51.0 50.3 51.1
Imports of goods and services(y-o-y growth) 3.0 –9.2 11.6 7.9
4.9 4.0 4.0 –0.9 –8.0 –11.8 –9.9 –7.1 3.4 16.1 12.2 14.7 9.8 6.9 8.5 6.3 5.0
Imports of goods and services(% of GDP) 41.8 37.0 41.3 45.1
41.6 41.5 43.1 41.1 38.7 35.9 36.8 36.4 38.8 41.6 42.1 42.7 43.9 45.2 45.8 45.6 45.8
Current account balance(US$ billion) 227.0 197.7 196.3 204.7
66.0 67.0 54.4 39.6 32.9 45.0 56.6 63.2 45.8 41.7 48.9 59.8 53.5 45.7 53.4 52.1 51.9
Current account balance(% of GDP) 6.2 5.9 6.0 5.7
7.1 6.9 5.9 5.0 4.3 5.6 6.6 7.1 5.5 5.3 6.1 7.0 6.2 5.0 5.8 6.0 6.1
General government gross debt(% of GDP) 66.1 72.5 77.2 81.7
65.4 66.3 65.8 66.7 68.8 72.8 73.9 74.4 74.6 75.4 75.6 83.0 82.0 81.8 81.6 81.2
CPI inflation 2.8 0.2 1.2 2.5
3.1 3.0 3.3 1.7 0.8 0.2 –0.4 0.3 0.8 1.0 1.2 1.6 2.2 2.5 2.6 2.6 2.4 2.1
Core-CPI inflation 1.3 1.3 0.6 1.2
1.6 1.1 1.3 1.3 1.3 1.6 1.3 1.2 0.8 0.4 0.6 0.7 0.9 1.4 1.3 1.2 1.3 1.4
Unemployment rate 7.5 7.8 7.1 6.0
8.0 7.7 7.2 7.2 7.6 7.9 7.9 7.7 7.5 7.2 6.9 6.7 6.3 6.0 5.9 5.6 5.6
France
GDP (y-o-y growth) –0.2 –3.0 1.6 1.7
1.6 0.5 –0.5 –2.3 –4.3 –3.7 –3.1 –1.0 1.0 1.6 1.9 1.7 2.4 1.7 1.5 1.2 0.3 0.3
General government final consump-tion expenditure (y-o-y growth) 1.3 2.6 1.7 0.3
0.9 0.8 1.4 1.9 2.1 2.6 2.7 2.8 2.6 2.1 1.5 0.7 0.5 0.1 0.1 0.3 0.8 1.3
General government final consump-tion expenditure (% of GDP) 23.3 24.8 24.9 24.6
22.9 23.1 23.4 23.8 24.3 24.7 25.0 25.1 25.0 24.9 24.8 24.8 24.6 24.6 24.5 24.5 24.5
Household final consumptionexpenditure (y-o-y growth) 0.2 0.2 1.4 0.2
1.6 0.7 –0.4 –1.0 –0.8 0.0 0.3 1.3 1.4 1.2 1.8 1.3 1.4 0.2 –0.2 –0.7 –0.5 0.2
Household final consumptionexpenditure (% of GDP) 55.0 56.0 56.0 55.6
54.7 55.1 55.1 55.2 55.8 56.1 56.1 56.1 55.9 55.9 56.1 55.9 55.5 55.5 55.5 55.8
Gross investment (y-o-y growth) –1.1 –15.5 1.4 8.0
3.2 0.7 –1.9 –6.2 –13.9 –18.1 –18.3 –11.5 –6.0 2.1 6.4 3.1 12.9 9.7 6.5 3.0 –4.7 –2.9
Gross investment (% of GDP) 21.9 18.9 19.2 20.6
22.3 22.1 22.0 21.3 19.9 18.7 18.2 18.9 18.6 19.3 19.6 19.4 20.9 20.8 20.7 20.1 20.0
2008 2009 2010 2011 2012
Q1 Q2 Q3 Q4 Q1 Q2 Q3 Q4 Q1 Q2 Q3 Q4 Q1 Q2 Q3 Q4 Q1 Q2
(continued on the next page)

80
I C R A B U L L E T I N
Money
Finance&
SEPTEMBER.2012
Gross fixed investment(y-o-y growth) 0.2 –10.4 1.1 3.6
5.2 2.4 –0.9 –6.1 –11.0 –11.7 –11.1 –7.8 –3.6 0.8 3.3 3.7 5.0 3.3 2.4 3.5 1.1 1.3
Gross fixed investment (% of GDP) 21.3 19.5 19.4 20.1
21.5 21.6 21.4 20.6 20.0 19.5 19.3 19.2 19.1 19.4 19.5 19.6 19.9 20.0 20.1 20.4 20.3
Exports of goods and services(y-o-y growth) –0.7 –11.7 9.2 5.5
4.1 0.3 –0.9 –6.1 –15.3 –13.8 –12.1 –5.7 5.9 9.6 10.8 10.5 7.4 5.1 4.4 5.1 4.0 3.2
Exports of goods and services(% of GDP) 26.9 23.4 25.5 26.9
27.6 27.3 27.3 25.5 23.4 23.2 23.4 23.6 24.6 25.4 25.9 26.2 26.5 26.7 27.1 27.4 27.5
Imports of goods and services(y-o-y growth) 0.7 –9.4 8.5 5.3
4.6 1.0 –0.3 –2.7 –10.0 –11.5 –11.3 –4.9 2.8 9.0 13.1 9.0 10.7 6.0 2.9 1.5 –1.0 1.4
Imports of goods and services(% of GDP) 29.1 25.2 27.7 29.7
29.3 29.5 29.7 27.7 25.4 24.7 24.8 25.9 26.3 27.5 28.3 28.5 30.0 29.6 29.8 29.5 29.9
Current account balance(US$ billion) –50.0 –34.5 –40.5 –54.7
–8.9 –16.3 –15.7 –9.1 –8.4 –9.8 –4.0 –12.3 –8.0 –7.9 –9.6 –15.0 –16.4 –15.9 –13.4 –9.0 –14.8
Current account balance(% of GDP) –1.7 –1.3 –1.6 –2.0
–1.2 –2.2 –2.2 –1.4 –1.4 –1.5 –0.6 –1.8 –1.2 –1.3 –1.5 –2.3 –2.4 –2.2 –1.9 –1.3 –2.2
General government gross debt(% of GDP) 66.8 75.9 82.4 85.5
65.8 66.3 66.8 68.2 71.5 75.4 77.5 79.1 81.2 83.7 82.0 82.5 84.5 86.2 85.4 86.0
CPI inflation 3.2 0.1 1.7 2.3
3.3 3.7 3.6 2.0 0.7 –0.2 –0.5 0.4 1.5 1.8 1.8 1.9 2.0 2.2 2.3 2.6 2.6 2.3
Core-CPI inflation 1.8 1.4 1.0 1.1
1.8 1.8 1.8 1.7 1.6 1.5 1.5 1.1 1.0 0.9 1.0 1.0 0.8 1.2 1.0 1.4 1.5 1.7
unemployment rate 7.8 9.5 9.8 9.7
7.5 7.6 7.8 8.2 8.9 9.5 9.6 10.0 9.9 9.7 9.8 9.7 9.6 9.6 9.6 9.8 10.1
Italy
GDP (y-o-y growth) –1.2 –5.5 1.8 0.6
0.4 –0.3 –1.8 –3.0 –6.9 –6.5 –5.1 –3.5 1.1 1.8 1.9 2.3 1.3 1.0 0.4 –0.5 –1.4 –2.5
General government final consump-tion expenditure (y-o-y growth) 0.6 0.8 –0.6 –0.9
0.1 0.6 0.7 0.9 0.8 1.2 0.6 0.5 –0.1 –0.6 –0.6 –1.1 –0.2 –0.9 –1.1 –1.3 –1.2
General government final consump-tion expenditure (% of GDP) 20.1 21.4 21.1 20.5
19.5 20.2 20.0 20.5 21.2 21.3 21.6 21.3 21.2 21.2 21.1 21.0 20.7 20.4 20.4 20.6 20.8
Household final consumptionexpenditure (y-o-y growth) –0.8 –1.6 1.2 0.2
0.0 –0.6 –1.1 –1.5 –2.5 –2.1 –1.4 –0.3 0.9 0.9 1.4 1.5 1.3 1.1 –0.2 –1.3 –2.4
Household final consumptionexpenditure (% of GDP) 58.8 59.9 60.3 60.9
58.7 58.1 59.3 59.2 59.6 59.8 60.0 60.3 60.2 59.7 60.4 60.8 60.8 60.7 60.8 61.2 61.4
Gross investment (y-o-y growth) –3.9 –16.9 8.0 –3.8
0.0 –0.8 –6.9 –7.7 –18.2 –20.9 –15.5 –13.1 2.9 9.4 7.8 12.0 1.8 –1.1 –4.5 –11.4 –14.3
Gross investment (% of GDP) 21.6 18.8 20.2 19.6
21.9 22.0 21.5 21.1 19.9 18.7 18.2 18.5 19.8 20.6 19.9 20.4 20.7 20.3 19.3 18.2 17.5
Gross fixed investment(y-o-y growth) –3.8 –11.6 1.7 –1.2
–1.1 –1.6 –4.3 –8.2 –12.5 –13.6 –12.7 –7.7 –0.7 2.1 3.8 1.7 0.5 –0.2 –1.9 –3.2 –7.6
Gross fixed investment (% of GDP) 21.0 19.4 19.5 19.6
21.3 21.0 21.2 20.5 19.9 19.3 19.1 19.3 19.4 19.5 19.7 19.5 19.8 19.7 19.5 19.2 18.8
Exports of goods and services(y-o-y growth) –2.8 –17.5 11.4 6.4
2.8 0.3 –4.0 –10.2 –22.9 –21.4 –16.3 –9.2 7.9 12.4 12.2 13.0 10.0 6.6 6.1 2.9 1.7
2008 2009 2010 2011 2012
Q1 Q2 Q3 Q4 Q1 Q2 Q3 Q4 Q1 Q2 Q3 Q4 Q1 Q2 Q3 Q4 Q1 Q2
(continued on the next page)
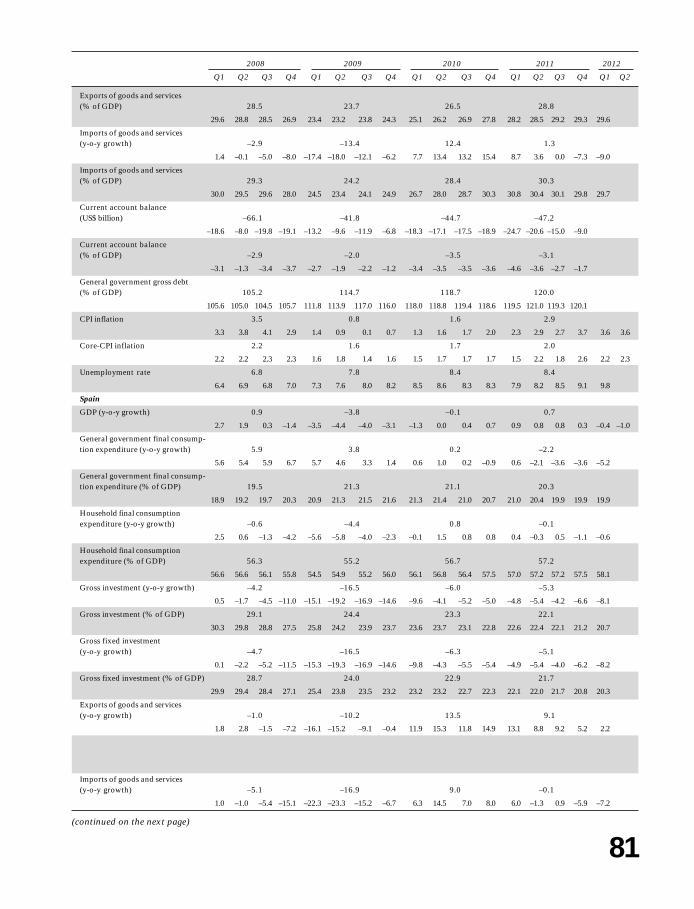
81
I C R A B U L L E T I N
Money
Finance&
SEPTEMBER.2012
Exports of goods and services(% of GDP) 28.5 23.7 26.5 28.8
29.6 28.8 28.5 26.9 23.4 23.2 23.8 24.3 25.1 26.2 26.9 27.8 28.2 28.5 29.2 29.3 29.6
Imports of goods and services(y-o-y growth) –2.9 –13.4 12.4 1.3
1.4 –0.1 –5.0 –8.0 –17.4 –18.0 –12.1 –6.2 7.7 13.4 13.2 15.4 8.7 3.6 0.0 –7.3 –9.0
Imports of goods and services(% of GDP) 29.3 24.2 28.4 30.3
30.0 29.5 29.6 28.0 24.5 23.4 24.1 24.9 26.7 28.0 28.7 30.3 30.8 30.4 30.1 29.8 29.7
Current account balance(US$ billion) –66.1 –41.8 –44.7 –47.2
–18.6 –8.0 –19.8 –19.1 –13.2 –9.6 –11.9 –6.8 –18.3 –17.1 –17.5 –18.9 –24.7 –20.6 –15.0 –9.0
Current account balance(% of GDP) –2.9 –2.0 –3.5 –3.1
–3.1 –1.3 –3.4 –3.7 –2.7 –1.9 –2.2 –1.2 –3.4 –3.5 –3.5 –3.6 –4.6 –3.6 –2.7 –1.7
General government gross debt(% of GDP) 105.2 114.7 118.7 120.0
105.6 105.0 104.5 105.7 111.8 113.9 117.0 116.0 118.0 118.8 119.4 118.6 119.5 121.0 119.3 120.1
CPI inflation 3.5 0.8 1.6 2.9
3.3 3.8 4.1 2.9 1.4 0.9 0.1 0.7 1.3 1.6 1.7 2.0 2.3 2.9 2.7 3.7 3.6 3.6
Core-CPI inflation 2.2 1.6 1.7 2.0
2.2 2.2 2.3 2.3 1.6 1.8 1.4 1.6 1.5 1.7 1.7 1.7 1.5 2.2 1.8 2.6 2.2 2.3
Unemployment rate 6.8 7.8 8.4 8.4
6.4 6.9 6.8 7.0 7.3 7.6 8.0 8.2 8.5 8.6 8.3 8.3 7.9 8.2 8.5 9.1 9.8
Spain
GDP (y-o-y growth) 0.9 –3.8 –0.1 0.7
2.7 1.9 0.3 –1.4 –3.5 –4.4 –4.0 –3.1 –1.3 0.0 0.4 0.7 0.9 0.8 0.8 0.3 –0.4 –1.0
General government final consump-tion expenditure (y-o-y growth) 5.9 3.8 0.2 –2.2
5.6 5.4 5.9 6.7 5.7 4.6 3.3 1.4 0.6 1.0 0.2 –0.9 0.6 –2.1 –3.6 –3.6 –5.2
General government final consump-tion expenditure (% of GDP) 19.5 21.3 21.1 20.3
18.9 19.2 19.7 20.3 20.9 21.3 21.5 21.6 21.3 21.4 21.0 20.7 21.0 20.4 19.9 19.9 19.9
Household final consumptionexpenditure (y-o-y growth) –0.6 –4.4 0.8 –0.1
2.5 0.6 –1.3 –4.2 –5.6 –5.8 –4.0 –2.3 –0.1 1.5 0.8 0.8 0.4 –0.3 0.5 –1.1 –0.6
Household final consumptionexpenditure (% of GDP) 56.3 55.2 56.7 57.2
56.6 56.6 56.1 55.8 54.5 54.9 55.2 56.0 56.1 56.8 56.4 57.5 57.0 57.2 57.2 57.5 58.1
Gross investment (y-o-y growth) –4.2 –16.5 –6.0 –5.3
0.5 –1.7 –4.5 –11.0 –15.1 –19.2 –16.9 –14.6 –9.6 –4.1 –5.2 –5.0 –4.8 –5.4 –4.2 –6.6 –8.1
Gross investment (% of GDP) 29.1 24.4 23.3 22.1
30.3 29.8 28.8 27.5 25.8 24.2 23.9 23.7 23.6 23.7 23.1 22.8 22.6 22.4 22.1 21.2 20.7
Gross fixed investment(y-o-y growth) –4.7 –16.5 –6.3 –5.1
0.1 –2.2 –5.2 –11.5 –15.3 –19.3 –16.9 –14.6 –9.8 –4.3 –5.5 –5.4 –4.9 –5.4 –4.0 –6.2 –8.2
Gross fixed investment (% of GDP) 28.7 24.0 22.9 21.7
29.9 29.4 28.4 27.1 25.4 23.8 23.5 23.2 23.2 23.2 22.7 22.3 22.1 22.0 21.7 20.8 20.3
Exports of goods and services(y-o-y growth) –1.0 –10.2 13.5 9.1
1.8 2.8 –1.5 –7.2 –16.1 –15.2 –9.1 –0.4 11.9 15.3 11.8 14.9 13.1 8.8 9.2 5.2 2.2
Exports of goods and services(% of GDP) 26.6 23.9 27.0 30.1
26.4 26.9 29.0 23.9 22.6 23.5 26.0 23.5 24.7 26.6 29.4 27.4 28.8 29.4 32.7 29.6 30.0
Imports of goods and services(y-o-y growth) –5.1 –16.9 9.0 –0.1
1.0 –1.0 –5.4 –15.1 –22.3 –23.3 –15.2 –6.7 6.3 14.5 7.0 8.0 6.0 –1.3 0.9 –5.9 –7.2
2008 2009 2010 2011 2012
Q1 Q2 Q3 Q4 Q1 Q2 Q3 Q4 Q1 Q2 Q3 Q4 Q1 Q2 Q3 Q4 Q1 Q2
(continued on the next page)

82
I C R A B U L L E T I N
Money
Finance&
SEPTEMBER.2012
Imports of goods and services(% of GDP) 32.3 25.7 29.1 30.7
33.4 33.5 32.9 29.4 25.0 24.6 26.4 26.9 27.3 29.5 29.4 30.3 31.0 30.6 31.1 30.2 30.5
Current account balance(US$ billion) –154.6 –70.2 –62.6 –52.6
–39.9 –44.3 –41.5 –28.9 –20.6 –12.9 –19.0 –17.7 –15.0 –16.6 –18.2 –12.8 –16.5 –12.1 –15.2 –8.8
Current account balance(% of GDP) –9.6 –4.8 –4.5 –3.5
–9.8 –10.4 –10.1 –8.2 –6.0 –3.6 –5.1 –4.6 –4.2 –5.0 –5.4 –3.6 –4.5 –3.1 –4.0 –2.4
General government gross debt(% of GDP) 37.2 48.8 58.4 66.3
35.5 36.0 36.9 40.2 43.5 47.5 50.2 53.9 55.7 57.8 58.8 61.2 64.7 66.1 66.0 68.5
CPI inflation 4.1 –0.2 2.0 3.1
4.5 4.7 5.0 2.5 0.5 –0.7 –1.0 0.2 1.3 2.3 2.0 2.5 3.2 3.3 2.9 2.7 1.9 1.9
Core-CPI inflation 2.4 0.9 0.8 1.2
2.4 2.2 2.5 2.5 1.6 1.2 0.5 0.3 0.1 0.8 1.1 1.2 1.1 1.4 1.0 1.1 0.8 0.8
Unemployment rate 11.4 18.0 20.1 21.7
9.2 10.5 11.8 14.0 16.7 17.9 18.5 19.0 19.4 20.1 20.3 20.5 20.7 20.9 22.0 23.0 23.8
Ireland
GDP (y-o-y growth) –2.1 –5.5 –0.8 1.4
–0.5 –1.0 0.0 –6.9 –6.1 –5.0 –6.7 –4.1 –2.5 –1.7 0.8 0.4 –0.6 2.6 0.8 2.9 1.4
General government final consump-tion expenditure (y-o-y growth) 1.3 –3.7 –4.6 –4.3
2.2 2.3 0.2 0.5 –1.1 –2.6 –5.4 –5.7 –6.7 –4.4 –3.6 –3.8 –3.2 –4.7 –3.5 –5.9 –3.4
General government final consump-tion expenditure (% of GDP) 19.2 20.4 19.2 18.4
18.5 19.4 19.2 19.7 20.9 20.1 20.3 20.4 19.2 19.0 18.8 19.8 19.0 18.4 18.6 17.6 18.4
Household final consumptionexpenditure (y-o-y growth) –0.3 –5.7 0.6 –2.3
3.5 –0.6 –0.8 –3.3 –6.9 –5.2 –6.4 –4.3 –0.5 0.7 1.6 0.5 –1.6 –2.3 –4.0 –1.4 –2.2
Household final consumptionexpenditure (% of GDP) 50.5 49.2 50.0 48.8
50.0 50.5 50.7 50.7 48.8 49.0 49.2 49.9 49.2 49.5 49.9 51.3 50.1 48.0 48.4 48.5 47.8
Gross investment (y-o-y growth) –13.3 –30.4 –20.0 –8.7
–12.5 –7.6 7.8 –40.9 –32.0 –31.7 –38.1 –19.6 –28.2 –16.6 –14.8 –20.3 –1.2 –10.7 –15.0 –7.8 3.6
Gross investment (% of GDP) 21.2 14.2 12.0 10.9
23.6 21.2 22.5 17.4 15.2 14.6 14.0 13.0 11.6 12.7 12.2 11.5 11.6 11.4 10.8 9.9 11.4
Gross fixed investment(y-o-y growth) –10.1 –27.1 –22.6 –12.5
–6.4 –10.7 –1.7 –21.6 –31.6 –24.0 –30.2 –22.7 –28.6 –15.9 –23.1 –22.6 –6.6 –17.9 –18.0 –7.5 6.5
Gross fixed investment (% of GDP) 21.9 15.9 12.0 10.2
24.8 21.4 22.7 18.8 17.0 16.1 15.8 14.6 11.9 13.0 11.5 11.6 11.0 10.3 9.6 9.7 11.0
Exports of goods and services(y-o-y growth) –1.1 –3.9 6.2 5.1
0.7 0.1 –1.2 –3.8 –4.2 –3.8 –4.2 –3.2 1.6 4.7 10.1 8.3 6.3 6.5 3.0 4.6 6.0
Exports of goods and services(% of GDP) 84.0 90.8 101.0 104.9
81.8 83.1 83.9 87.3 90.2 90.9 90.7 91.5 95.4 99.5 103.7 105.3 105.5 102.4 105.7 106.1 108.4
Imports of goods and services(y-o-y growth) –2.8 –9.8 3.7 –0.1
0.5 –0.9 –3.2 –7.7 –10.7 –8.7 –12.3 –7.3 –3.8 2.8 8.6 7.0 7.6 –1.0 –3.2 –3.9 1.1
Imports of goods and services(% of GDP) 74.9 74.7 82.1 83.0
74.4 74.5 75.4 75.3 75.2 75.0 73.1 75.3 75.5 81.2 83.7 88.0 86.3 80.6 82.7 82.5 86.1
Current account balance(US$ billion) –15.3 –5.0 2.3 2.5
–4.5 –3.8 –4.9 –2.0 –2.0 –1.8 –1.4 –1.4 –0.6 –0.3 1.2 0.8 0.0 –0.3 0.8 –0.3 –0.1
2008 2009 2010 2011 2012
Q1 Q2 Q3 Q4 Q1 Q2 Q3 Q4 Q1 Q2 Q3 Q4 Q1 Q2 Q3 Q4 Q1 Q2
(continued on the next page)

83
I C R A B U L L E T I N
Money
Finance&
SEPTEMBER.2012
Current account balance(% of GDP) –5.7 –2.9 0.5 0.1
–6.5 –5.5 –7.3 –3.4 –3.6 –3.2 –2.4 –2.4 –1.1 –0.7 2.3 1.6 –0.1 –0.5 1.4 –0.5 –0.2
General government gross debt(% of GDP) 35.7 59.5 84.4 103.9
27.5 32.4 38.7 44.2 51.2 59.5 62.3 65.1 78.3 78.4 88.4 92.5 100.4 102.3 104.5 108.2
CPI inflation 3.1 –1.7 –1.6 1.2
3.4 3.6 3.3 2.1 0.2 –1.6 –2.6 –2.8 –2.4 –2.1 –1.2 –0.6 0.8 1.3 1.1 1.5 1.7 1.9
Core-CPI inflation 1.6 –1.3 –2.4 –0.2
1.9 2.1 1.3 1.1 0.2 –1.2 –1.8 –2.3 –2.9 –2.8 –1.9 –1.8 –0.9 0.1 –0.2 0.2 0.6 0.6
Unemployment rate 6.3 11.9 13.7 14.5
4.9 5.5 6.9 7.9 10.3 11.9 12.5 12.8 13.0 13.5 13.7 14.5 14.2 14.3 14.7 14.7 14.8
United Kingdom
GDP (y-o-y growth) –1.0 –3.9 1.8 0.8
2.7 0.5 –2.4 –4.6 –6.1 –5.4 –3.3 –0.9 1.2 2.1 2.4 1.5 1.4 0.5 0.5 0.6 –0.2 –0.8
General government final consump-tion expenditure (y-o-y growth) 1.7 0.8 0.5 0.2
0.5 1.6 1.5 3.1 0.4 0.6 1.2 0.9 1.8 1.2 –0.3 –0.9 –0.6 –0.3 0.3 1.2 3.0
General government final consump-tion expenditure (% of GDP) 21.9 23.4 22.8 22.4
21.3 21.7 21.8 22.7 23.2 23.4 23.6 23.3 23.1 22.9 22.6 22.7 22.5 22.3 22.2 22.4 23.0
Household final consumptionexpenditure (y-o-y growth) –1.6 –3.0 1.3 –1.2
1.9 –0.4 –2.6 –5.1 –4.5 –4.5 –2.8 –0.1 0.2 2.4 1.7 1.0 0.1 –1.3 –1.8 –1.6 –0.9
Household final consumptionexpenditure (% of GDP) 60.8 61.4 61.7 61.7
60.6 60.4 61.4 60.8 61.8 61.3 61.1 61.4 61.2 61.9 61.6 61.9 61.8 61.7 61.3 61.9 61.9
Gross investment (y-o-y growth) –6.0 –18.5 10.1 0.7
6.5 2.8 –12.2 –20.9 –27.3 –23.0 –17.2 –6.4 9.3 5.5 17.8 7.6 –2.6 3.8 1.3 0.4 0.6
Gross investment (% of GDP) 17.1 14.2 15.1 14.9
18.6 17.9 16.6 15.3 14.3 14.5 13.8 14.0 15.2 14.5 15.7 14.9 14.1 15.1 15.9 14.5 14.5
Gross fixed investment(y-o-y growth) –4.5 –13.5 3.5 –1.4
4.2 –0.7 –8.1 –13.4 –18.3 –16.4 –10.6 –8.7 2.3 3.0 5.4 3.4 –2.5 0.0 –2.0 –0.9 1.9
Gross fixed investment (% of GDP) 16.8 14.9 14.9 14.2
18.0 16.9 16.2 16.0 15.6 14.8 14.6 14.6 15.2 14.5 15.0 14.8 14.2 14.3 14.2 14.2 14.7
Changes in inventories( y-o-y growth) –13.6 –189.3 125.7 736.6
81.6 145.5 –69.5 –211.8 –323.7 –129.6 –319.8 15.8 98.1 90.2 192.3 122.1 –215.4 2902.9 137.5 121.3 –237.8
Changes in inventories(% of GDP) 0.3 –0.8 0.2 0.6
0.5 1.0 0.3 –0.7 –1.3 –0.3 –0.8 –0.6 –0.1 –0.1 0.7 0.1 –0.2 0.7 1.6 0.2 –0.4
Exports of goods and services(y-o-y growth) 1.2 –8.2 6.4 4.5
3.1 2.8 0.5 –1.6 –9.1 –11.3 –9.0 –3.2 2.6 7.8 7.2 7.9 10.2 2.8 2.6 2.4 –1.0
Exports of goods and services(% of GDP) 29.8 28.9 30.5 32.5
28.1 30.3 30.7 30.2 28.9 28.4 28.6 29.5 29.4 30.7 30.4 31.6 32.4 32.2 32.4 33.0 32.2
Imports of goods and services(y-o-y growth) –1.8 –10.9 8.0 0.6
1.4 2.2 –3.5 –7.1 –13.2 –14.2 –11.7 –4.6 4.1 8.3 10.7 8.7 4.3 0.5 –1.3 –1.2 0.7
Imports of goods and services(% of GDP) 32.1 30.3 32.7 34.1
31.0 32.8 33.1 31.5 30.6 30.2 29.7 30.7 31.5 32.6 32.8 33.8 33.4 34.0 34.4 34.4 34.3
Current account balance(US$ billion) –26.4 –27.7 –57.6 –46.5
–1.2 –9.3 –7.3 –8.2 –6.4 –16.1 –3.5 –1.1 –14.9 –12.6 –14.5 –15.7 –10.1 –7.0 –18.1 –11.4 –17.5
2008 2009 2010 2011 2012
Q1 Q2 Q3 Q4 Q1 Q2 Q3 Q4 Q1 Q2 Q3 Q4 Q1 Q2 Q3 Q4 Q1 Q2
(continued on the next page)
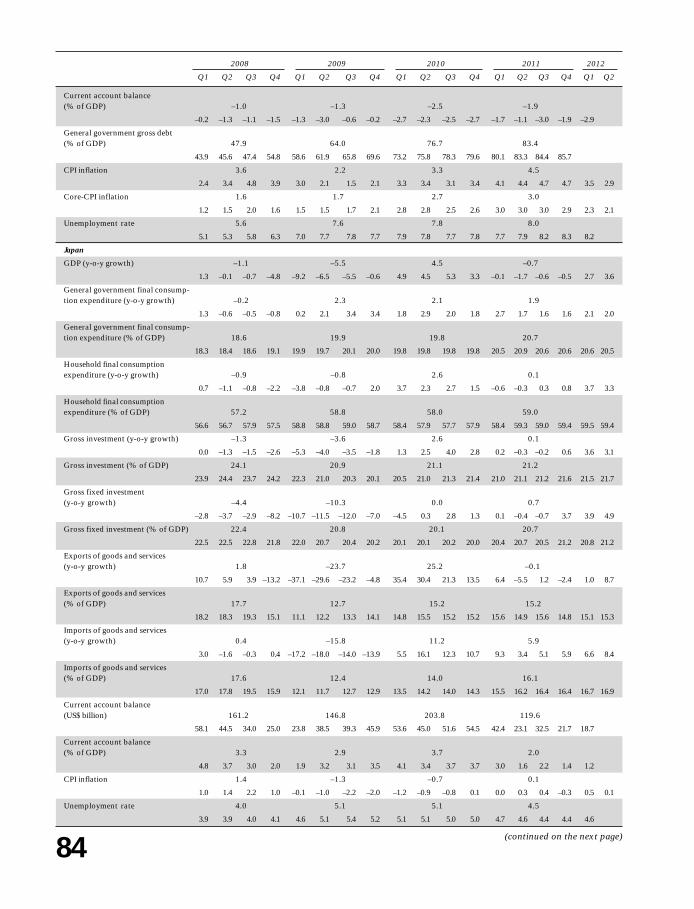
84
I C R A B U L L E T I N
Money
Finance&
SEPTEMBER.2012
Current account balance(% of GDP) –1.0 –1.3 –2.5 –1.9
–0.2 –1.3 –1.1 –1.5 –1.3 –3.0 –0.6 –0.2 –2.7 –2.3 –2.5 –2.7 –1.7 –1.1 –3.0 –1.9 –2.9
General government gross debt(% of GDP) 47.9 64.0 76.7 83.4
43.9 45.6 47.4 54.8 58.6 61.9 65.8 69.6 73.2 75.8 78.3 79.6 80.1 83.3 84.4 85.7
CPI inflation 3.6 2.2 3.3 4.5
2.4 3.4 4.8 3.9 3.0 2.1 1.5 2.1 3.3 3.4 3.1 3.4 4.1 4.4 4.7 4.7 3.5 2.9
Core-CPI inflation 1.6 1.7 2.7 3.0
1.2 1.5 2.0 1.6 1.5 1.5 1.7 2.1 2.8 2.8 2.5 2.6 3.0 3.0 3.0 2.9 2.3 2.1
Unemployment rate 5.6 7.6 7.8 8.0
5.1 5.3 5.8 6.3 7.0 7.7 7.8 7.7 7.9 7.8 7.7 7.8 7.7 7.9 8.2 8.3 8.2
Japan
GDP (y-o-y growth) –1.1 –5.5 4.5 –0.7
1.3 –0.1 –0.7 –4.8 –9.2 –6.5 –5.5 –0.6 4.9 4.5 5.3 3.3 –0.1 –1.7 –0.6 –0.5 2.7 3.6
General government final consump-tion expenditure (y-o-y growth) –0.2 2.3 2.1 1.9
1.3 –0.6 –0.5 –0.8 0.2 2.1 3.4 3.4 1.8 2.9 2.0 1.8 2.7 1.7 1.6 1.6 2.1 2.0
General government final consump-tion expenditure (% of GDP) 18.6 19.9 19.8 20.7
18.3 18.4 18.6 19.1 19.9 19.7 20.1 20.0 19.8 19.8 19.8 19.8 20.5 20.9 20.6 20.6 20.6 20.5
Household final consumptionexpenditure (y-o-y growth) –0.9 –0.8 2.6 0.1
0.7 –1.1 –0.8 –2.2 –3.8 –0.8 –0.7 2.0 3.7 2.3 2.7 1.5 –0.6 –0.3 0.3 0.8 3.7 3.3
Household final consumptionexpenditure (% of GDP) 57.2 58.8 58.0 59.0
56.6 56.7 57.9 57.5 58.8 58.8 59.0 58.7 58.4 57.9 57.7 57.9 58.4 59.3 59.0 59.4 59.5 59.4
Gross investment (y-o-y growth) –1.3 –3.6 2.6 0.1
0.0 –1.3 –1.5 –2.6 –5.3 –4.0 –3.5 –1.8 1.3 2.5 4.0 2.8 0.2 –0.3 –0.2 0.6 3.6 3.1
Gross investment (% of GDP) 24.1 20.9 21.1 21.2
23.9 24.4 23.7 24.2 22.3 21.0 20.3 20.1 20.5 21.0 21.3 21.4 21.0 21.1 21.2 21.6 21.5 21.7
Gross fixed investment(y-o-y growth) –4.4 –10.3 0.0 0.7
–2.8 –3.7 –2.9 –8.2 –10.7 –11.5 –12.0 –7.0 –4.5 0.3 2.8 1.3 0.1 –0.4 –0.7 3.7 3.9 4.9
Gross fixed investment (% of GDP) 22.4 20.8 20.1 20.7
22.5 22.5 22.8 21.8 22.0 20.7 20.4 20.2 20.1 20.1 20.2 20.0 20.4 20.7 20.5 21.2 20.8 21.2
Exports of goods and services(y-o-y growth) 1.8 –23.7 25.2 –0.1
10.7 5.9 3.9 –13.2 –37.1 –29.6 –23.2 –4.8 35.4 30.4 21.3 13.5 6.4 –5.5 1.2 –2.4 1.0 8.7
Exports of goods and services(% of GDP) 17.7 12.7 15.2 15.2
18.2 18.3 19.3 15.1 11.1 12.2 13.3 14.1 14.8 15.5 15.2 15.2 15.6 14.9 15.6 14.8 15.1 15.3
Imports of goods and services(y-o-y growth) 0.4 –15.8 11.2 5.9
3.0 –1.6 –0.3 0.4 –17.2 –18.0 –14.0 –13.9 5.5 16.1 12.3 10.7 9.3 3.4 5.1 5.9 6.6 8.4
Imports of goods and services(% of GDP) 17.6 12.4 14.0 16.1
17.0 17.8 19.5 15.9 12.1 11.7 12.7 12.9 13.5 14.2 14.0 14.3 15.5 16.2 16.4 16.4 16.7 16.9
Current account balance(US$ billion) 161.2 146.8 203.8 119.6
58.1 44.5 34.0 25.0 23.8 38.5 39.3 45.9 53.6 45.0 51.6 54.5 42.4 23.1 32.5 21.7 18.7
Current account balance(% of GDP) 3.3 2.9 3.7 2.0
4.8 3.7 3.0 2.0 1.9 3.2 3.1 3.5 4.1 3.4 3.7 3.7 3.0 1.6 2.2 1.4 1.2
CPI inflation 1.4 –1.3 –0.7 0.1
1.0 1.4 2.2 1.0 –0.1 –1.0 –2.2 –2.0 –1.2 –0.9 –0.8 0.1 0.0 0.3 0.4 –0.3 0.5 0.1
Unemployment rate 4.0 5.1 5.1 4.5
3.9 3.9 4.0 4.1 4.6 5.1 5.4 5.2 5.1 5.1 5.0 5.0 4.7 4.6 4.4 4.4 4.6
2008 2009 2010 2011 2012
Q1 Q2 Q3 Q4 Q1 Q2 Q3 Q4 Q1 Q2 Q3 Q4 Q1 Q2 Q3 Q4 Q1 Q2
(continued on the next page)

85
I C R A B U L L E T I N
Money
Finance&
SEPTEMBER.2012
China
GDP (y-o-y growth) 9.1 8.4 10.3 9.3
10.6 10.1 9.0 6.8 6.1 7.9 8.9 10.7 11.9 10.3 9.3 9.8 9.7 9.5 9.1 8.9 8.1 7.6
Index of industrial production 13.9 12.9 12.2 14.1
17.8 16.0 16.0 5.7 8.3 10.7 13.9 18.5 8.3 13.7 13.3 13.5 14.8 15.1 13.8 12.8 11.9 9.5
Current account balance (US$ billion) 1218.7
– 400.7 – 426.1 – 364.4 – 284.4 282.2 289.1 316.3 331.1 298.7 – 303.2 259.3 201.7 196.4
Current account balance (% of GDP) 5.0
– 6.9 – 7.2 – 5.8 – 4.7 4.9 5.6 5.5 4.1 4.0 – 4.0 2.9 2.1 2.3
Budget balance (% of GDP) 0.3 –3.8 –2.5 –1.8
0.5 0.4 0.4 –0.1 –3.7 –4.3 –3.4 –3.8 –2.9 –2.6 –2.2 –2.2 –1.7 –2.1 –1.8 –1.6 –2.1 –2.3
CPI inflation 5.9 –0.5 2.4 5.6
8.3 7.1 7.1 1.2 –1.2 –1.7 –0.8 1.9 –1.6 2.9 3.6 4.6 5.4 6.4 6.1 4.5 3.6 2.2
Unemployment rate 9.0 10.2 9.6 6.1
– – – – – – – – – – – – – – – – 4.1 4.1
Brazil
GDP (y-o-y growth) 5.2 –0.3 7.6 2.7
6.3 6.5 7.1 0.9 –2.4 –2.4 –1.5 5.3 9.1 8.8 7.1 5.3 4.1 3.3 2.2 1.4 0.7 0.5
General government final consump-tion expenditure (y-o-y growth) 3.1 3.1 4.2 2.0
4.3 1.7 5.0 1.6 3.5 2.3 0.4 6.4 3.3 5.5 5.1 3.1 2.1 2.8 1.3 1.5 3.3 2.8
General government final consump-tion expenditure (% of GDP) 20.2 21.2 21.1 20.7
20.0 20.0 19.9 20.8 21.5 21.2 21.1 21.0 21.2 21.3 21.2 21.0 20.6 20.5 20.7 20.9 21.0
Household final consumptionexpenditure (y-o-y growth) 5.7 4.4 7.0 4.1
6.4 6.1 7.5 2.7 1.8 3.8 4.6 7.5 8.3 6.3 6.0 7.2 5.9 5.6 3.0 2.0 2.4 2.4
Household final consumptionexpenditure (% of GDP) 58.9 61.1 59.6 60.3
58.9 58.4 57.8 60.6 61.7 61.9 61.0 60.0 59.8 59.8 59.3 59.6 59.7 59.8 60.5 61.4 61.1
Gross fixed investment(y-o-y growth) 13.7 –6.6 22.2 4.9
15.7 17.0 18.5 3.6 –13.1 –13.2 –9.3 9.3 29.9 27.5 20.3 11.0 8.6 6.2 2.8 1.9 –2.2 –3.7
Gross fixed investment (% of GDP) 19.1 18.0 19.5 19.3
18.3 19.0 19.7 19.4 17.1 17.5 18.3 19.2 19.3 19.6 19.5 19.4 19.5 19.3 19.1 19.2 18.7
Exports of goods and services(y-o-y growth) 0.6 –9.1 11.6 4.5
–0.9 5.6 3.5 –5.8 –12.2 –10.1 –10.2 –3.9 14.0 7.2 12.1 13.0 3.6 6.8 4.2 3.4 5.9 –2.1
Exports of goods and services(% of GDP) 13.6 11.0 10.9 11.9
12.2 12.8 13.6 16.1 12.5 11.6 10.3 9.7 10.5 11.0 10.8 11.2 11.2 11.7 11.9 12.8 11.9
Imports of goods and services(y-o-y growth) 15.5 –7.7 36.5 10.2
14.5 22.2 19.3 6.1 –13.5 –12.9 –11.4 7.1 41.3 38.6 40.3 25.7 13.8 14.7 5.9 6.2 6.6 1.5
Imports of goods and services(% of GDP) 13.5 11.2 11.9 12.6
12.1 12.8 13.2 15.7 12.4 11.2 10.5 10.6 11.5 12.1 12.1 11.8 12.0 12.4 12.8 13.4 13.3
Current account balance(US$ billion) –28.2 –24.3 –47.3 –52.5
–10.3 –6.6 –6.0 –5.3 –4.9 –2.2 –4.9 –12.2 –11.9 –11.9 –11.5 –11.9 –14.8 –11.3 –10.6 –15.8 –12.1
Current account balance(% of GDP) –1.7 –1.4 –2.2 –2.1
–2.5 –1.4 –1.3 –1.6 –1.5 –0.6 –1.1 –2.5 –2.4 –2.3 –2.1 –2.0 –2.4 –1.7 –1.7 –2.7 –2.0
India
GDP (y-o-y growth) 6.3 6.8 9.2 7.1
8.9 7.1 6.9 2.4 3.9 6.5 7.6 9.2 12.6 8.7 7.8 7.8 6.2 9.0 6.9 6.2 5.6
2008 2009 2010 2011 2012
Q1 Q2 Q3 Q4 Q1 Q2 Q3 Q4 Q1 Q2 Q3 Q4 Q1 Q2 Q3 Q4 Q1 Q2
(continued on the next page)
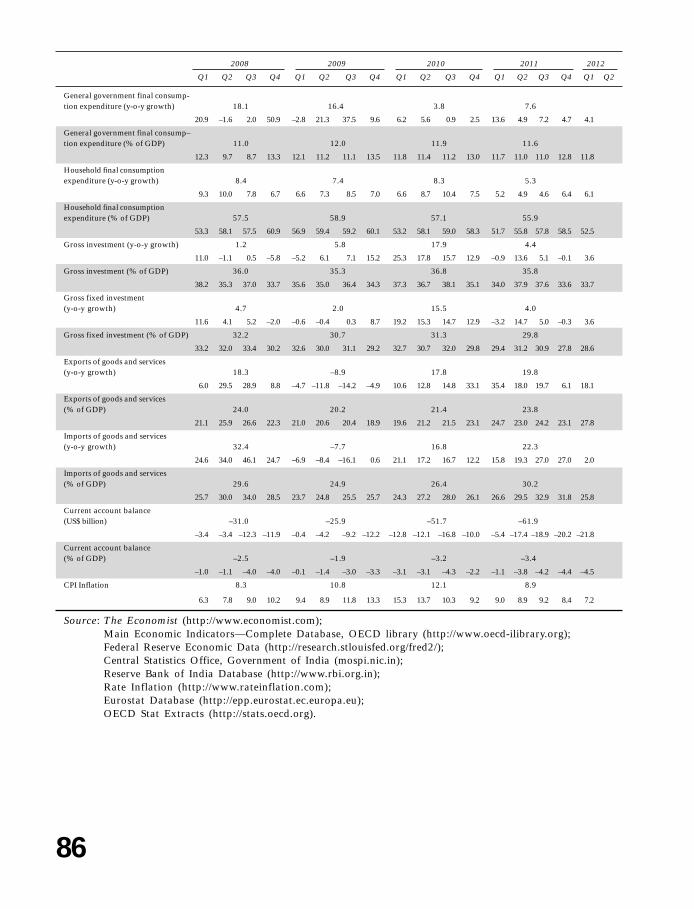
86
I C R A B U L L E T I N
Money
Finance&
SEPTEMBER.2012
General government final consump-tion expenditure (y-o-y growth) 18.1 16.4 3.8 7.6
20.9 –1.6 2.0 50.9 –2.8 21.3 37.5 9.6 6.2 5.6 0.9 2.5 13.6 4.9 7.2 4.7 4.1
General government final consump–tion expenditure (% of GDP) 11.0 12.0 11.9 11.6
12.3 9.7 8.7 13.3 12.1 11.2 11.1 13.5 11.8 11.4 11.2 13.0 11.7 11.0 11.0 12.8 11.8
Household final consumptionexpenditure (y-o-y growth) 8.4 7.4 8.3 5.3
9.3 10.0 7.8 6.7 6.6 7.3 8.5 7.0 6.6 8.7 10.4 7.5 5.2 4.9 4.6 6.4 6.1
Household final consumptionexpenditure (% of GDP) 57.5 58.9 57.1 55.9
53.3 58.1 57.5 60.9 56.9 59.4 59.2 60.1 53.2 58.1 59.0 58.3 51.7 55.8 57.8 58.5 52.5
Gross investment (y-o-y growth) 1.2 5.8 17.9 4.4
11.0 –1.1 0.5 –5.8 –5.2 6.1 7.1 15.2 25.3 17.8 15.7 12.9 –0.9 13.6 5.1 –0.1 3.6
Gross investment (% of GDP) 36.0 35.3 36.8 35.8
38.2 35.3 37.0 33.7 35.6 35.0 36.4 34.3 37.3 36.7 38.1 35.1 34.0 37.9 37.6 33.6 33.7
Gross fixed investment(y-o-y growth) 4.7 2.0 15.5 4.0
11.6 4.1 5.2 –2.0 –0.6 –0.4 0.3 8.7 19.2 15.3 14.7 12.9 –3.2 14.7 5.0 –0.3 3.6
Gross fixed investment (% of GDP) 32.2 30.7 31.3 29.8
33.2 32.0 33.4 30.2 32.6 30.0 31.1 29.2 32.7 30.7 32.0 29.8 29.4 31.2 30.9 27.8 28.6
Exports of goods and services(y-o-y growth) 18.3 –8.9 17.8 19.8
6.0 29.5 28.9 8.8 –4.7 –11.8 –14.2 –4.9 10.6 12.8 14.8 33.1 35.4 18.0 19.7 6.1 18.1
Exports of goods and services(% of GDP) 24.0 20.2 21.4 23.8
21.1 25.9 26.6 22.3 21.0 20.6 20.4 18.9 19.6 21.2 21.5 23.1 24.7 23.0 24.2 23.1 27.8
Imports of goods and services(y-o-y growth) 32.4 –7.7 16.8 22.3
24.6 34.0 46.1 24.7 –6.9 –8.4 –16.1 0.6 21.1 17.2 16.7 12.2 15.8 19.3 27.0 27.0 2.0
Imports of goods and services(% of GDP) 29.6 24.9 26.4 30.2
25.7 30.0 34.0 28.5 23.7 24.8 25.5 25.7 24.3 27.2 28.0 26.1 26.6 29.5 32.9 31.8 25.8
Current account balance(US$ billion) –31.0 –25.9 –51.7 –61.9
–3.4 –3.4 –12.3 –11.9 –0.4 –4.2 –9.2 –12.2 –12.8 –12.1 –16.8 –10.0 –5.4 –17.4 –18.9 –20.2 –21.8
Current account balance(% of GDP) –2.5 –1.9 –3.2 –3.4
–1.0 –1.1 –4.0 –4.0 –0.1 –1.4 –3.0 –3.3 –3.1 –3.1 –4.3 –2.2 –1.1 –3.8 –4.2 –4.4 –4.5
CPI Inflation 8.3 10.8 12.1 8.9
6.3 7.8 9.0 10.2 9.4 8.9 11.8 13.3 15.3 13.7 10.3 9.2 9.0 8.9 9.2 8.4 7.2
Source: The Economist (http://www.economist.com);Main Economic Indicators—Complete Database, OECD library (http://www.oecd-ilibrary.org);Federal Reserve Economic Data (http://research.stlouisfed.org/fred2/);Central Statistics Office, Government of India (mospi.nic.in);Reserve Bank of India Database (http://www.rbi.org.in);Rate Inflation (http://www.rateinflation.com);Eurostat Database (http://epp.eurostat.ec.europa.eu);OECD Stat Extracts (http://stats.oecd.org).
2008 2009 2010 2011 2012
Q1 Q2 Q3 Q4 Q1 Q2 Q3 Q4 Q1 Q2 Q3 Q4 Q1 Q2 Q3 Q4 Q1 Q2

87
I C R A B U L L E T I N
Money
Finance&
SEPTEMBER.2012
ReferencesDe Long, J. Bradford, and Lawrence H. Summers (2012), “Fiscal Policy in a
Depressed Economy”, Conference on the Brookings Papers on EconomicActivity, March.
Feldstein, Martin (2007), “Remarks”, Jackson Hole Symposium on Housing,Housing Finance and Monetary Policy (Sponsored by the Federal ReserveBank of Kansas City), August 31-September 1.
Fisher, Irving (1933), “The Debt-Deflation Theory of Great Depressions”,Econometrica, Vol. I, No. 4.
G20 (2008), Declaration of the Summit on Financial Markets and the WorldEconomy, Washington DC, November 15, www.g20.utoronto.ca.
——— (2009), Declaration of the Summit on Strengthening the Financial System,London, April 2, www.g20.utoronto.ca.
IMF (2007), Global Financial Stability Report, Washington DC, InternationalMonetary Fund, April.
——— (2007a), Global Financial Stability Report, Washington DC, InternationalMonetary Fund, October.
——— (2009), The State of Public Finances Cross-Country Fiscal Monitor,November, 2009.
——— (2012) September 2011 World Economic Outlook Database, accessed inApril 2012.
——— (2012 a), World Economic Outlook Update, April.Keynes, J.M. (1936), The General Theory of Employment, Interest and Money,
Macmillan, London.Phelps, Edmund S. (1972), Inflation Policy and Unemployment Theory, W.W.
Norton, New York.Rakshit, Mihir (2005), “Budget Deficit: Sustainability, Solvency and Optimality”, in
A. Bagchi (ed.), Readings in Public Finance, Oxford University Press, NewDelhi.
——— (2007), “Inflation in a Developing Economy: Theory and Policy”, Money &Finance, September; reprinted in Mihir Rakshit, Macroeconomics of Post-Reform India, Oxford University Press, 2009, New Delhi.
——— (2008), “The Subprime Crisis: A Primer”, Money & Finance, May.——— (2009), “The IMF on the Global Crisis and Its Resolution”, Development
and Change, Vol 40, No. 6.——— (2010), “Global Downturn and Cross-Border Trade: Some Theoretical and
Policy Perspectives”, Economic and Political Weekly, May 1.——— (2011), “Inflation and Relative Prices in India 2006–10: Some Analytical
and Policy Issues”, Economic and Political Weekly, April 16.Shiller, Robert J. (2007), “Understanding Recent Trends in House Prices and Home
Ownership”, Jackson Hole Symposium on Housing, Housing Finance andMonetary Policy (Sponsored by the Federal Reserve Bank of Kansas City),August 31-September 1, 2007.

88
I C R A B U L L E T I N
Money
Finance&
SEPTEMBER.2012