icici strategy - moneycontrol.com
TRANSCRIPT
ICICI Securities Ltd. | Retail Equity Research
October 8, 2018
Q2FY19E Result Preview
Healthy Q2; magnitude of margin reset key ahead
The high base of last year due to GST implementation and delayed
festive season this year are likely to have some impact on the overall
revenue growth of consumption oriented sectors. However, despite the
same, we believe the economy has shown some resilience, evident
from the fact that revenues of Sensex companies are expected to grow
~14% YoY & ~3% QoQ. The growth is largely supported by companies
in oil & gas (higher crude prices resulting in higher realisation), FMCG
(led by organic volume growth) and IT space (attributable to higher
share of digital segment & new deal wins). However, the same was
partly offset by the subdued performance of the auto & banking space.
Further, an uptick in overall economic activity has resulted in strong
order wins of | 34,419 crore for listed capital goods companies
Investors’ sentiment over the past fortnight has remained cautious
primarily on the back of 1) rupee which has dropped to all-time low of
>73.50 against the dollar; 2) Brent crude prices climbing to a four year
high of $86.1/barrel on the back of supply constraints and 3) interest
rates which have started to move northwards. Thus, all three factors
will have a negative impact on the economy, clearly visible in the
broader index, which is down ~9%. Rupee depreciation against the
dollar & higher crude prices will further widen the current account
deficit (CAD) & also pose a risk of higher inflation, going forward. FIIs
have pulled out >| 18,000 crore in YTDCY18 of which >80% is in the
last 15 days. Further, with rising interest rates in India, cyclical sectors
with weaker balance sheets would face challenges due to an increase in
financing cost. Thus, we believe there could be a downward revision in
earning across sectors post the adverse movement in macro
parameters. Though measures taken in the past (increasing custom
duty, relaxed overseas borrowing restriction and others) has not
meaningfully yielded results, we believe the government will manage
its finances taking appropriate steps, going forward
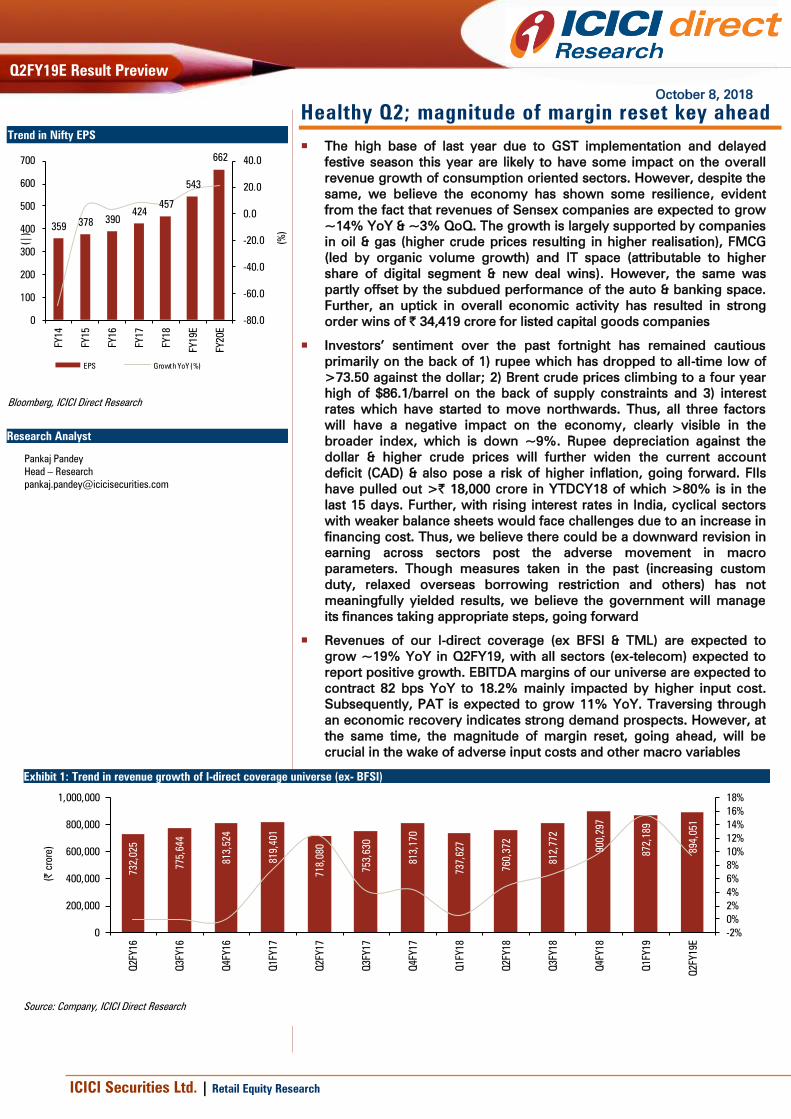
Revenues of our I-direct coverage (ex BFSI & TML) are expected to
grow ~19% YoY in Q2FY19, with all sectors (ex-telecom) expected to
report positive growth. EBITDA margins of our universe are expected to
contract 82 bps YoY to 18.2% mainly impacted by higher input cost.
Subsequently, PAT is expected to grow 11% YoY. Traversing through
an economic recovery indicates strong demand prospects. However, at
the same time, the magnitude of margin reset, going ahead, will be
crucial in the wake of adverse input costs and other macro variables
Exhibit 1: Trend in revenue growth of I-direct coverage universe (ex- BFSI)
732,025
775,644
813,524
819,401
718,080
753,630
813,170
737,627
760,372
812,772
900,297
872,189
894,051
-2%
0%
2%
4%
6%
8%
10%
12%
14%
16%
18%
0
200,000
400,000
600,000
800,000
1,000,000
Q2FY16
Q3FY16
Q4FY16
Q1FY17
Q2FY17
Q3FY17
Q4FY17
Q1FY18
Q2FY18
Q3FY18
Q4FY18
Q1FY19
Q2FY19E
(| crore)
Source: Company, ICICI Direct Research
Trend in Nifty EPS
359378 390
424
457
543
662
-80.0
-60.0
-40.0
-20.0
0.0
20.0
40.0
0
100
200
300
400
500
600
700
FY14
FY15
FY16
FY17
FY18
FY19E
FY20E
(%
)
(|
)
EPS Growth YoY (%)
Source:
Bloomberg, ICICI Direct Research
Research Analyst
Pankaj Pandey
Head – Research

ICICI Securities Ltd. | Retail Equity ResearchPage 2
Performance of Sensex companies
For Q2FY19E, we expect Sensex earnings (ex–BFSI & TML) to report
growth of 15% YoY. Though of late, the intensity of provision has
moderated, the profitability of BFSI is likely to see de-growth of 21%
YoY, primarily dragged down by SBI, which is likely to report a loss for
the fourth consecutive quarter. TML’s earnings have also been more
volatile in the past due to currency fluctuation and margin pressures.
Overall growth is mainly supported by the oil & gas, FMCG and capital
goods sectors, which are expected to report earnings growth of 20%,
16.2% and11.5% YoY, respectively. On the flip side, earnings growth of
Sensex based auto companies (ex-TML) is expected to decline ~5%
YoY, largely dragged by MSIL
Five companies, which are among the chart topper in terms of
profitability growth include Tata Steel (attributable to higher volume &
realisation), ONGC (higher crude prices is resulting in higher
realisation), Yes Bank (led by higher advances growth), TCS (led by deal
ramp up) and ITC (higher volume growth from the cigarette segment)
On flip side, Tata Motors (TML), SBI and Bharti Airtel are expected to
report losses during the quarter. TML’s performance was impacted due
to de-growth in JLR volume & unfavourable currency movement while
higher provisioning will have a negative effect of SBI’s profitability.
Bharti Airtel’s performance is impacted by a weak India wireless
performance on elevated competitive intensity. Further, Vedanta’s profit
is likely to de-grow 41% YoY, post a decline in prices of major base
metals along with the ongoing shutdown of its copper smelter
Exhibit 2: Trend in profitability of Sensex companies…
5.2
-4.7
-1.8
15.8
3.6
18.8
10.8
-7.7
0.6
3.3
6.5
0.1
-4.0
0.0
-10.0
-5.0
0.0
5.0
10.0
15.0
20.0
25.0
0
10000
20000
30000
40000
50000
60000
70000
Q1FY16 Q2FY16 Q3FY16 Q4FY16 Q1FY17 Q2FY17 Q3FY17 Q4FY17 Q1FY18 Q2FY18 Q3FY18 Q4FY18 Q1FY19 Q2FY19E
PAT YoY Growth
0
Pre provisioning profit (PPP) of banks in Sensex companies Provisions of banks in Sensex companies
33757
41924
34604
41829
37200
38034
0
10000
20000
30000
40000
50000
Q1FY18 Q2FY18 Q3FY18 Q4FY18 Q1FY19 Q2FY19E
| crore
16238
29214
27478 44486
31612
25698
0
10000
20000
30000
40000
50000
Q1FY18 Q2FY18 Q3FY18 Q4FY18 Q1FY19Q2FY19E
| crore
Source: Company, ICICI Direct Research
ICICI Securities Ltd. | Retail Equity Research
Page 3
What we expect our coverage universe to report; emerging trends
Revenues of our I-direct coverage (ex-BFSI, TML) are expected to grow
~19% YoY in Q2FY19, with all sectors (ex-telecom) expected to report
positive growth. The major revenue driver is the oil & gas sector
(account for 28% of revenue) is expected to see ~45% YoY growth.
Among other major sectors, IT & metals are expected to report 16%
YoY & 11% YoY growth, respectively. The auto sector (accounting for
~17% of our universe revenue) is likely to report moderate growth of
~6% YoY basis, primarily due to subdued volume growth of major
OEMs. For capital goods companies, Q2FY19 is expected to be strong
with robust order wins across companies. Our coverage capital goods
companies have registered strong order inflows worth | 34,419 crore
led by order uptake in L&T. On the flip side, telecom is the only sector
that is expected to witness revenue de-growth of 9% YoY, impacted by
competitive pressure as well as interconnect usage charge cut
For the banking sector, Q2FY19E is expected to witness healthy credit
traction as latest data by RBI indicates 13.5% YoY growth. This is an
improvement vs. ~12.8% YoY growth seen in Q1FY19. One of the
reasons contributing to higher credit growth is the shift towards
banking channel vs. debt market owing to a rise in interest rates. The
deposit growth is lower at ~8.6% YoY. Improving CD ratio and
relatively steady slippages estimated in Q2FY19E would lead to steady
margins for banks. This is despite 5-10 bps rise in deposit rates during
the quarter. Asset quality pressure, especially from the corporate book,
would continue in Q2FY19E. We expect GNPA for coverage banks to
increase 18% YoY to ~| 336800 crore in Q2FY19E, similar to traction in
Q1FY19. Provisions may remain elevated for the sector owing to ageing
of NPLs. For our coverage universe, we expect total provisions at ~|
24000 crore, similar to Q1FY19E. The commentary with regard to bank’s
exposure of ~| 50000 crore to the beleaguered IL&FS would be keenly
watched. There were no major resolutions in Q2FY19E compared to
two steel accounts seen in Q1FY19. Despite healthy NII traction
estimated, PAT for the coverage universe seems subdued YoY owing to
elevated provisioning. The QoQ traction seems higher owing to large
losses (| 4876 crore) booked by SBI in Q1FY19. Excluding SBI, PAT
growth for the coverage universe in Q2FY19 is 20.3% YoY and 3% QoQ
The quarterly performance of the auto sector in Q2FY19 was marred by
the high base of the corresponding period last year due to a sales pick-
up post GST transition (July-September 2018). Volume growth was also
muted across segments due to shifting of festive season by a month
and one-offs primarily driven by uneven distribution of rainfall (floods in
Kerala) and ownership linked to driving license (2W in West Bengal).
Overall auto volume growth for the quarter was at 6.7% YoY and 3.3%
QoQ. The 2W segment witnessed resilience while PV volumes
remained soft during the quarter. The 3W segment, however, witnessed
robust prospects amid abolition of the permit system in key states. In
the CV space, the positive momentum continued amid a pick-up in
infrastructure activity. Tractor volumes declined mainly due to the high
base of the last year. The key raw material used in the sector was on the
uptick. Steel prices were up 16.4% YoY while aluminium was up nearly
11.4%. This will limit the margin expansion at key OEMs as we believe
the companies resorted to limited price hikes sensing softer demand
scenario. Ex-Tata Motors, for our sectoral coverage, we expect sales &
PAT to grow 11.6% & 5.8%, respectively. For Tata Motors, Q2FY19 is
expected to be challenging amid a decline in sales at JLR (27% YoY,
15% QoQ) and sharp depreciation of rupee, which will impact its
financial performance

ICICI Securities Ltd. | Retail Equity ResearchPage 4
For capital goods companies, Q2FY19E is expected to be strong with
robust order wins across companies. The coverage companies have
registered strong order inflows worth | 34,419 crore led by order
uptake in L&T. BEL also won its largest ever order worth | 9200 crore.
Overall, the coverage universe revenue is expected to grow 11.4%
owing to stable execution rates at engineering and power T&D EPC
companies like L&T, ABB, BEL, KEC, Thermax & Kalpataru Power.
EBITDA for the coverage universe is expected to grow 24.6% with
some margin expansion whereas PAT is expected to grow 13.2%. In the
bearings space, companies like SKF, Timken and NRB are likely to
report strong double digit topline growth of 12-16% on account of
robust volume growth of ~9%, ~32%, and ~30% in 2W, 3W and
commercial vehicle, respectively. We also expect stable EBITDA
margins as we believe pass through in input prices and improving
utilisation will offset the forex impact, if any, during the quarter
EBITDA margins of the coverage universe (ex-BFSI) is likely to contract
100 bps YoY to 17.6%
Moderate revenue growth and margin contraction YoY are likely to
impact the profitability of our I-direct coverage universe, which is
expected to report modest PAT growth of 5% YoY
Exhibit 4: Trend in profitability of I-direct coverage universe (ex- BFSI)
-30.0
-20.0
-10.0
0.0
10.0
20.0
30.0
40.0
0.0
20,000.0
40,000.0
60,000.0
80,000.0
100,000.0
Q1FY17 Q2FY17 Q3FY17 Q4FY17 Q1FY18 Q2FY18 Q3FY18 Q4FY18 Q1FY19Q2FY19E
(%
)
(| C
rore)
Source: Company, ICICI Direct Research
Exhibit 3: Trend in EBITDA margins of I-direct coverage universe (ex- BFSI)
18.118.2
17.6
17.2
18.618.6
17.7
18.3
17.6
16.0
16.5
17.0
17.5
18.0
18.5
19.0
Q2FY17 Q3FY17 Q4FY17 Q1FY18 Q2FY18 Q3FY18 Q4FY18E Q1FY19 Q2FY19E
(%
)
Source: Company, ICICI Direct Research

ICICI Securities Ltd. | Retail Equity ResearchPage 5
Defensives: Consumption sectors - beneficiary of low base…
(Sector composition: consumer discretionary, IT, FMCG, healthcare)
Key highlights:
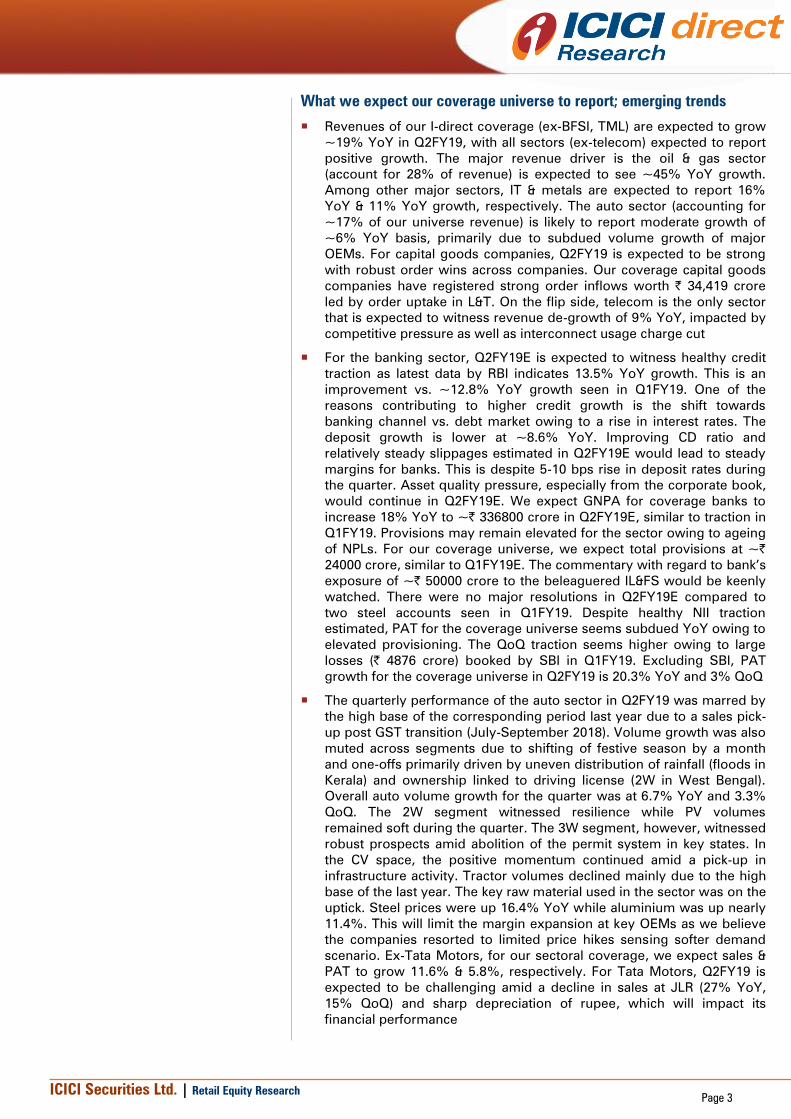
There are some pre-signs of a demand revival as defensives continue to
show some strength for a second consecutive quarter. Our I-direct
defensive universe, for yet another quarter is likely to report double
digit growth of 13.4% YoY that will be among the best in the last seven
quarters. Further, the growth is largely broad based (revenue growth in
the range of 8-16%) within the space. IT is the top growing sector within
the space, primarily attributable to improving deal wins, higher share of
digital segment and reducing pressure on legacy business. The FMCG
sector is likely to report organic volume driven (6-8%) revenue growth
mainly on the back of strengthening rural incomes, higher pre-election
spends by the government, new launches across segments. The
healthcare sector will be impacted by high base & supply constraints
from China will dilute some of the currency tailwinds, thus resulting in
revenue growth of ~10% YoY. Our consumer discretionary universe is
expected to grow 8% YoY, mainly due to high base & early festive
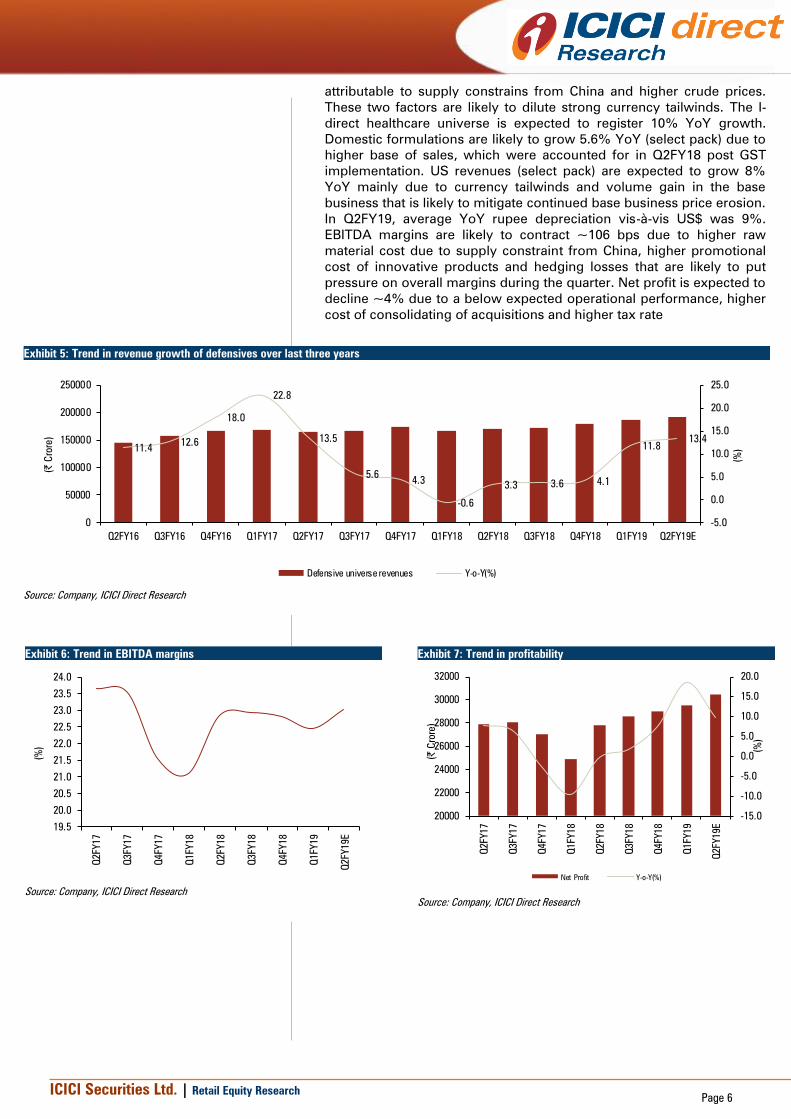
season last year. The EBITDA margin of our I-direct defensive universe
is likely to expand 20 bps YoY to 23% supported by FMCG (due to
lower cost of its key inputs) & IT sector (due to rupee depreciation)
In the IT space, improving deal wins, higher share of digital segment
and reducing pressure on legacy business are expected to be key
drivers of growth in the quarter. This coupled with Q2 being a
seasonally strong quarter, Tier-I IT companies are expected to report
constant currency (CC) growth of 1.3-3.9% sequentially. TCS is
anticipated to lead the growth led by deal ramp ups while Wipro is
expected to lag taking into account impact of divestment of hosted data
centre services. Among mid-tier companies, Cyient, MindTree and NIIT
Tech are expected to report healthy growth driven by deal wins and
digital competencies. Taking into consideration the US$ appreciation
against all major currencies, cross currency could act as a headwind of
80-110 bps to reported dollar growth. However, rupee depreciation by
4.6% QoQ would overweigh these headwinds. This is expected to lead
to ~70-100 bps expansion in margins across IT companies.
Commentary on outlook for key verticals like BFSI, retail and
communication has to be watched. Going ahead, we expect Infosys to
report better growth based on accelerated rate of new deal wins
(estimated US$1.5 billion in Q2FY19E vs $1.1 billion in Q1FY19) and
improvement in digital wallet share
Our FMCG coverage universe is expected to continue robust growth
this quarter also whereby sales are expected to grow 12.5% mainly on
the back of strengthening rural incomes, higher pre-election spend by
the government, new launches across sectors and gradual shift towards
premiumisation. We expect organic volume growth of 6-8% across
companies. With a gradual improvement in rural income levels on the
back of government measures and conclusion of normal monsoons in
2018, we expect rural growth to outpace urban growth, thereby
supporting higher volume growth trajectory of our FMCG universe.
Continued focus on digital advertisement should help restrict marketing
spend thereby improve operating margins. However, a steep rise in
crude oil prices (45% YoY), which is used for packaging, would restrict
operating margins expansion to 102 bps for our FMCG universe. We
estimate 15.9% YoY net profit growth for our coverage universe
After a strong showing in Q1FY19 due to base effect and currency
tailwinds, we expect some consolidation in the pharma sector’s Q2
financials due to 1) higher base and 2) cost pressure, which can be
ICICI Securities Ltd. | Retail Equity ResearchPage 6
attributable to supply constrains from China and higher crude prices.
These two factors are likely to dilute strong currency tailwinds. The I-
direct healthcare universe is expected to register 10% YoY growth.
Domestic formulations are likely to grow 5.6% YoY (select pack) due to
higher base of sales, which were accounted for in Q2FY18 post GST
implementation. US revenues (select pack) are expected to grow 8%
YoY mainly due to currency tailwinds and volume gain in the base
business that is likely to mitigate continued base business price erosion.
In Q2FY19, average YoY rupee depreciation vis-à-vis US$ was 9%.
EBITDA margins are likely to contract ~106 bps due to higher raw
material cost due to supply constraint from China, higher promotional
cost of innovative products and hedging losses that are likely to put
pressure on overall margins during the quarter. Net profit is expected to
decline ~4% due to a below expected operational performance, higher
cost of consolidating of acquisitions and higher tax rate
Exhibit 5: Trend in revenue growth of defensives over last three years
11.412.6
18.0
22.8
13.5
5.64.3
-0.6
3.3 3.6 4.1
11.8
13.4
-5.0
0.0
5.0
10.0
15.0
20.0
25.0
0
50000
100000
150000
200000
250000
Q2FY16 Q3FY16 Q4FY16 Q1FY17 Q2FY17 Q3FY17 Q4FY17 Q1FY18 Q2FY18 Q3FY18 Q4FY18 Q1FY19 Q2FY19E
(%
)
(| C
rore)
Defensive universe revenues Y-o-Y(%)
Source: Company, ICICI Direct Research
Exhibit 6: Trend in EBITDA margins
19.5
20.0
20.5
21.0
21.5
22.0
22.5
23.0
23.5
24.0
Q2FY17
Q3FY17
Q4FY17
Q1FY18
Q2FY18
Q3FY18
Q4FY18
Q1FY19
Q2FY19E
(%
)
Source: Company, ICICI Direct Research
Exhibit 7: Trend in profitability
-15.0
-10.0
-5.0
0.0
5.0
10.0
15.0
20.0
20000
22000
24000
26000
28000
30000
32000
Q2FY17
Q3FY17
Q4FY17
Q1FY18
Q2FY18
Q3FY18
Q4FY18
Q1FY19
Q2FY19E
(%
)
(| C
rore)
Net Profit Y-o-Y(%)
Source: Company, ICICI Direct Research

ICICI Securities Ltd. | Retail Equity ResearchPage 7
Cyclicals: Uptick in capacity utilisation driving cyclical recovery
(Sector composition: auto, cement, capital goods, metals, power,
infrastructure, real estate, oil & gas and telecom)
Key Highlights
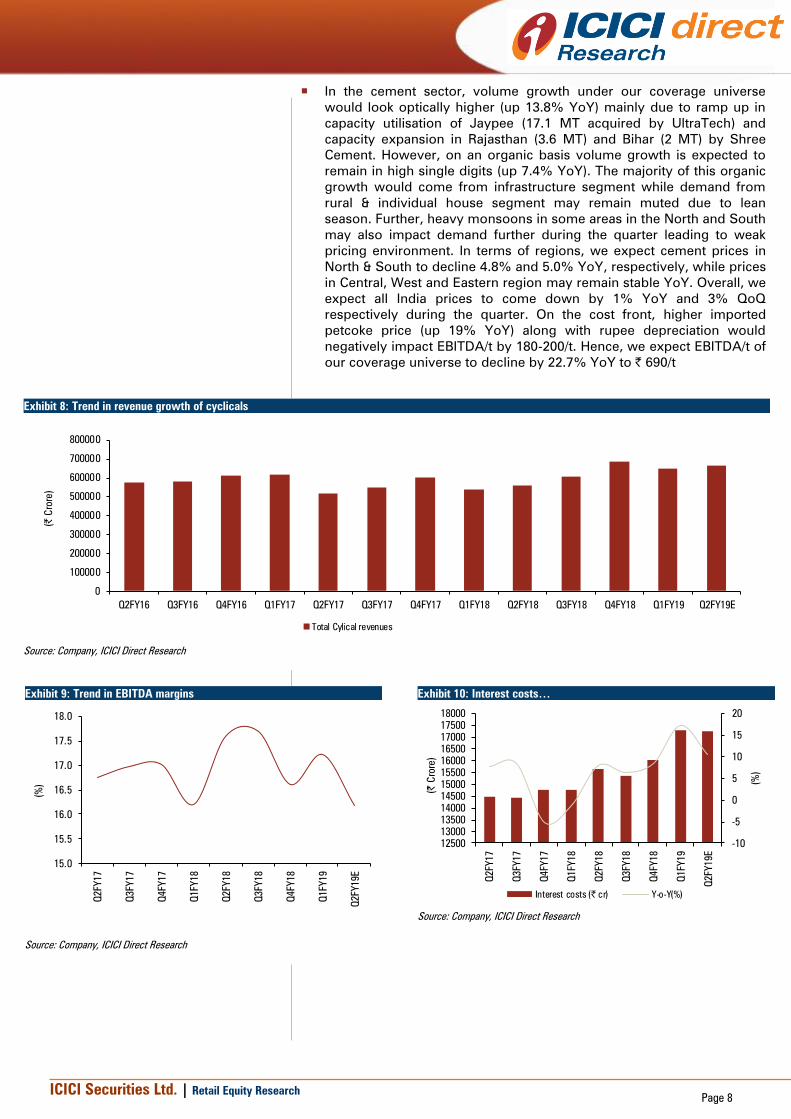
For Q2FY19, the I-direct cyclical universe is expected to register
revenue growth of 19% YoY, mainly supported by the oil & gas sector,
which is driven by downstream oil marketing companies (OMCs) on
account of rise in product realisation due to high crude oil prices. Apart
from that, all major sectors are likely to report revenue growth in the
narrow range of 9-12%. The metals space is likely to report revenue
growth of 11% YoY, primarily supported by the ferrous space (with
names like Tata Steel & JSW steel). For capital goods companies,
Q2FY19 is expected to be strong with robust order wins across
companies. The auto space, one of the major sectors in cyclicals, is
expected to report flat revenue growth mainly on the back of subdued
volume growth from leading OEMs during the quarter. In the cement
sector, volume growth under our coverage universe would look
optically higher (up 13.8% YoY) mainly due to a ramp up in capacity
utilisation & expansion by players. The performance of telecom players
in the seasonally weak Q2 is expected to be further marred by another
round of discounting by Jio on its second anniversary in September
2018 and higher diesel prices. Further, except metals, real estate &
capital goods, operational profitability of other cyclicals sectors is likely
to remain under pressure. We expect EBITDA margins of our I-direct
cyclical universe to contract 141 bps YoY to 16.2%
Developments like tough sanctions on Iran and lower production from
countries like Venezuela have led to fears of further tightening of oil
supply and led to increase in crude oil prices. However, expected
subsidy burden on upstream oil companies will lead to a decline in their
net realisations QoQ. Domestic gas demand and continued LNG
imports from consuming sectors will lead to steady volume growth for
gas utility companies on a YoY basis. However, high spot LNG prices
and rupee depreciation during the quarter will have an impact on
margins QoQ as well as YoY. Benchmark Singapore GRMs remained
flattish during the quarter at US$6.1/bbl in Q2FY19. However, product
spreads for important petroleum products for Indian refiners weakened
in Q2FY19 and will impact operational GRMs. However, inventory gains
would continue to provide some support to the GRMs of OMCs
In the metals space, domestic steel consumption grew 6.5% YoY during
July-August 2018 after increasing 8.9% YoY during April-June 2018.
Despite a seasonally weak quarter, steel prices remained flattish QoQ,
we expect steel prices to increase in H2FY19E once construction and
infrastructure activities resume post monsoon resulting in demand pick
up. For Q2FY19E, we expect EBITDA/tonne of domestic steel
companies to decline sequentially on the back of flattish realisations
and increased key raw materials prices (coking coal and iron ore). We
expect the domestic operations of Tata Steel to report EBITDA/tonne of
| 16500/tonne (vs. | 17077/tonne in Q1FY19). Similarly, JSW Steel on a
standalone basis is likely to report an EBITDA/tonne of | 10250/tonne
(vs. | 12590/tonne in Q1FY19). On the non-ferrous front, prices of all
base metals remained volatile during the quarter taking cues from
developments around the trade tussle between the US and China.
During Q2FY19, average zinc prices were at US$2535/tonne down
14.4% YoY, 18.5% QoQ. Lead prices were down 10% YoY, 12% QoQ to
US$2098/tonne. Copper prices were down 3.7% YoY, 11.1% QoQ to
US$6117/tonne while aluminium prices were up 2.2% YoY, down
11.1% QoQ to US$2054/tonne
ICICI Securities Ltd. | Retail Equity Research
Page 8
In the cement sector, volume growth under our coverage universe
would look optically higher (up 13.8% YoY) mainly due to ramp up in
capacity utilisation of Jaypee (17.1 MT acquired by UltraTech) and
capacity expansion in Rajasthan (3.6 MT) and Bihar (2 MT) by Shree
Cement. However, on an organic basis volume growth is expected to
remain in high single digits (up 7.4% YoY). The majority of this organic
growth would come from infrastructure segment while demand from
rural & individual house segment may remain muted due to lean
season. Further, heavy monsoons in some areas in the North and South
may also impact demand further during the quarter leading to weak
pricing environment. In terms of regions, we expect cement prices in
North & South to decline 4.8% and 5.0% YoY, respectively, while prices
in Central, West and Eastern region may remain stable YoY. Overall, we
expect all India prices to come down by 1% YoY and 3% QoQ
respectively during the quarter. On the cost front, higher imported
petcoke price (up 19% YoY) along with rupee depreciation would
negatively impact EBITDA/t by 180-200/t. Hence, we expect EBITDA/t of
our coverage universe to decline by 22.7% YoY to | 690/t
Exhibit 8: Trend in revenue growth of cyclicals
0
100000
200000
300000
400000
500000
600000
700000
800000
Q2FY16 Q3FY16 Q4FY16 Q1FY17 Q2FY17 Q3FY17 Q4FY17 Q1FY18 Q2FY18 Q3FY18 Q4FY18 Q1FY19 Q2FY19E
(| C
rore)
Total Cylical revenues
Source: Company, ICICI Direct Research
Exhibit 9: Trend in EBITDA margins
15.0
15.5
16.0
16.5
17.0
17.5
18.0
Q2FY17
Q3FY17
Q4FY17
Q1FY18
Q2FY18
Q3FY18
Q4FY18
Q1FY19
Q2FY19E
(%
)
Source: Company, ICICI Direct Research
Exhibit 10: Interest costs…
-10
-5
0
5
10
15
20
12500
13000
13500
14000
14500
15000
15500
16000
16500
17000
17500
18000
Q2FY17
Q3FY17
Q4FY17
Q1FY18
Q2FY18
Q3FY18
Q4FY18
Q1FY19
Q2FY19E
(%
)
(| C
rore)
Interest costs (| cr) Y-o-Y(%)
Source: Company, ICICI Direct Research

ICICI Securities Ltd. | Retail Equity ResearchPage 9
Apparel
Delay in festive season and weak Onam sales to impact revenues
The base quarter (July & August 2017) was impacted due to lower
offtake by trade channels on account of uncertainty related to the
implementation of GST. However, delay in festive season to Q3FY19
and weak onam sales (due to Kerala floods) are expected to negate the
positive impact of low base effect in Q2FY19. We expect our coverage
universe to report moderate revenue growth of 12% YoY in Q2FY19.
We anticipate KKCL to report revenue de-growth of 4% YoY to | 160.3
crore (albeit on strong base of Q2FY18). We expect Arvind’s textile
division to report revenue growth of 10% YoY (2% de-growth
sequentially) mainly led by new garmenting facility and growth in
woven segment. Arvind’s Brand & Retail segment is expected to sustain
its strong revenue trajectory and anticipate revenue growth of 15% YoY
in Q2FY19. Page is expected to register revenue growth of 15% YoY,
led by 9% volume growth and 7% increase in average selling price.
With no immediate capacity coming on stream, we expect Vardhman
Textiles to report revenue growth 6% YoY. We expect Rupa to report
revenue growth of 11% YoY on favourable base of Q2FY18 (7% decline
in revenues).
Cotton prices at its peak; may negatively impact gross margins
Average cotton prices (Shankar-6) in Q2FY19 have risen by 12% YoY to
| ~132/kg (up 9% sequentially). Increase in cotton prices was largely on
the back of damage by pink bollworm and delayed monsoon in some
states. Going forward, cotton prices are expected to remain elevated for
cotton season 2018-19 on account of anticipated decline in cotton
production by 5% to 35.5 million bales (1 bale= 170 kg) and sustained
domestic demand. Higher yarn prices are expected to keep margin
pressure for apparel players in the near term.
Over the past couple of quarters, Page has increased the proportion of
outsourced products leading to lower gross margins. However, it has
exhibited commendable cost rationalisation measures which have
yielded better EBITDA margins. Hence, we expect Page to report
margin expansion to the tune of 130 bps YoY. We anticipate margins for
KKCL to decline 240 bps YoY on account of negative operating
leverage. For Rupa we expect EBITDA margins to decline 100 bps YoY
on account of higher advertisement spends and pressure on input cost.
We expect EBITDA margins for Vardhman textiles to improve 400 bps
YoY to 17% due to a deflated base (Q2FY18 had one of the lowest
EBITDA margin at13.7% due to high cost cotton inventory).
Exhibit 11: Estimates for Q2Y19E: (Apparel) (| Crore)
Revenue EBITDA PAT
Q2FY19E YoY QoQ Q2FY19E YoY QoQ Q2FY19E YoY QoQ
Arvind Ltd 3,025.8 15.1 5.8 260.1 22.5 5.6 76.0 17.8 18.1
Kewal Kiran 160.3 -4.3 51.3 43.0 -12.0 99.8 32.0 -8.9 130.2
Page Industries 717.3 14.6 -12.0 156.0 21.5 -17.6 102.4 21.8 -17.7
Rupa & Co. 276.1 11.2 50.5 39.8 3.7 90.1 22.9 6.1 123.2
Vardhman Tex 1,618.1 6.2 -4.8 274.0 38.6 -6.2 146.8 10.2 -7.8
Total 5,797.6 11.6 2.3 772.8 23.5 0.3 380.1 12.3 2.2
Change (%)
Company
Change (%)Change (%)
Source: ICICI Direct Research
Topline & Profitability (Coverage Universe)
4785
4703
5084
4976
5060
0
1000
2000
3000
4000
5000
6000
Q2FY17
Q3FY17
Q4FY17
Q1FY18
Q2FY18E
| C
rore
0.0
2.0
4.0
6.0
8.0
10.0
12.0
14.0
16.0
18.0
(%
)
Revenue EBITDA Margin PAT Margin
Cotton prices (domestic & international)
60
70
80
90
100
110
120
130
140
150
160
Sep-13
Mar-14
Sep-14
Mar-15
Sep-15
Mar-16
Sep-16
Mar-17
Sep-17
Mar-18
Sep-18
|
0.4
0.5
0.6
0.7
0.8
0.9
1
$
|/kg (LHS) $/ Pound
Indian textile exports to US
3401
3665
3639
3682
2419
3316
3605
3579
3707
2185
0
1000
2000
3000
4000
CY2014 CY2015 CY2016 CY2017 YTD-18
US
$ (M
n)
Apparel Non- Apparel
Research Analyst
Bharat Chhoda
Cheragh Sidhwa
ICICI Securities Ltd. | Retail Equity ResearchPage 10
Lower export incentives result in subdued Exports for YTD-18
According to the data provided by Office of Textile and Apparel
(OTEXA), India’s textile exports to the US in YTD 18 (January-July)
witnessed subdued growth owing to intense competition from
countries like Bangladesh & Vietnam and recent cut in duty drawback
rates. India’s apparel exports to the US for YTD18 grew marginally by
4.0% YoY US$2419 million, while non-apparel exports remained flattish
at US$2185 million.
Exhibit 12: Company specific view (Apparel)
Company Remarks
Kewal Kiran With various e-commerce players, resorting to aggressive promotional offers, KKCL
has refrained away form giving heavy discounts in order not to dilute the brand image.
We expect the repercussions of the same to impact the volume growth in the quarter.
We anticipate KKCL to report revenue de-growth of 4% YoY to | 160.3 crore, Also,
delay in festive season to Q3FY19 and weak Onam sales are expected to impact
revenue growth. We expect EBITDA margins to decline 240 bps YoY to 26.8% on the
back of negative operating leverage. Subsequently we expect PAT to decline 9% YoY
to | 32.0 crore
Page
Industries
We expect Page to register healthy topline growth of 15.0% YoY to | 718.1 crore,
driven by volume growth of 9% to 46.4 million pieces and realisation growth of 7% YoY
to | 155/piece. On the segmental front, we expect revenues from women's segment
to increase by 24% YoY, while men's segment is expected to grow by 16% YoY.
Positive operating leverage is expected to enhance EBITDA margins by 130 bps YoY to
21.8%. Consequently, we expect PAT to grow 22.0% YoY to | 102.5 crore.
Rupa &
Company
We expect Rupa (standalone) to register steady revenue growth of 11% YoY to |
276.1 crore owning to low base effect (7% revenue de-growth in Q2FY18). EBITDA
margins are expected to decline 100 bps YoY to 14.4% on account of increase in yarn
prices and higher spends on promotional expense. Consequently we expect PAT to
increase 6% YoY to | 23.0 crore
Vardhman
Textiles
With no immediate capacity coming on stream, we expect VTL revenues to increase
by 6% YoY to | 1618 crore. In Q2FY18 the company had one of the lowest EBITDA
margin at13.7% due to high cost cotton inventory. On a deflated base, we expect
EBITDA margins to improve by 400 bps YoY to 17.0%. Higher tax rate and lower other
income is expected to restrict PAT growth. Hence, we expect PAT to increase 10.2%
YoY to | 147 crore.
Arvind Ltd We expect Arvind's textile division to report 10% YoY revenue growth, mainly driven
by growth in garmenting and woven segment. Denim segment is expected to remain
under pressure in the near term. Revenues from Brands and Retail segment is
expected to increase by 15% YoY. The management indicated that there was certain
loss of revenues owing to weak onam sales and delay in festive season. On a
consolidated basis, we expect Arvind to report 16% revenue growth YoY to | 3068
crore. EBITDA margins are likely to expand 70 bps YoY to 8.8%, with absolute EBITDA
increasing 27% YoY to | 269 crore.
Source: Company, ICICI Direct Research
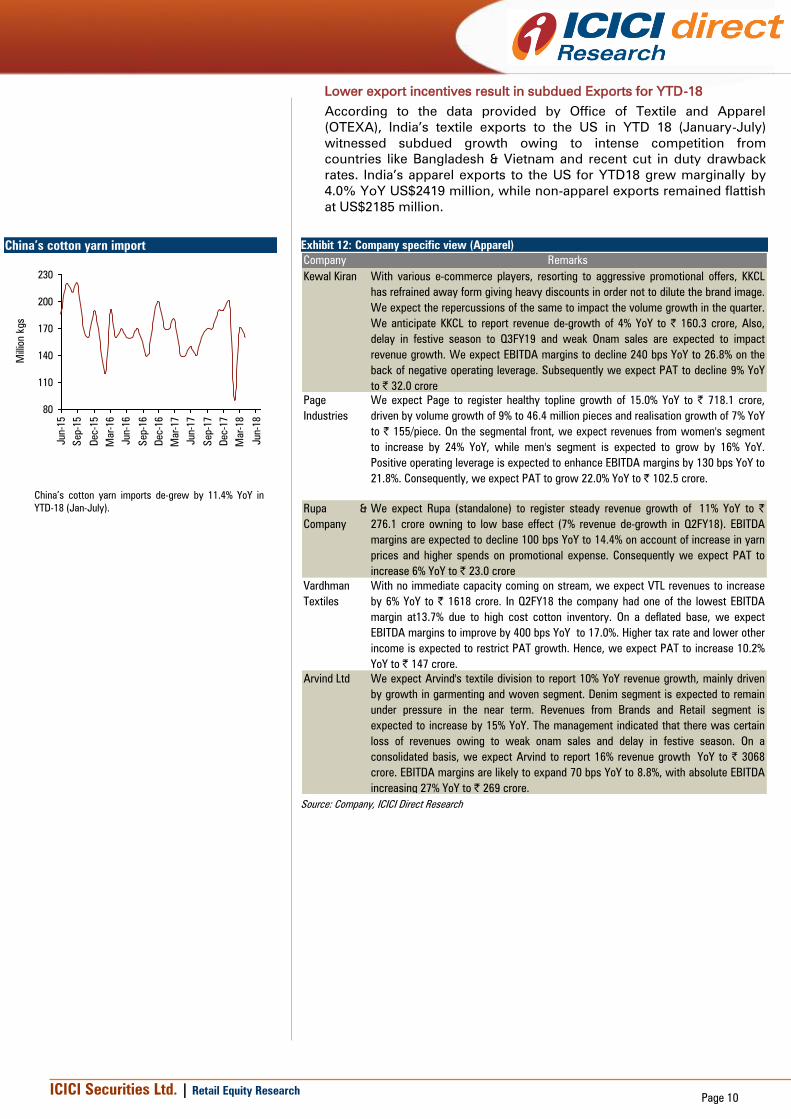
China’s cotton yarn imports de-grew by 11.4% YoY in
YTD-18 (Jan-July).
China’s cotton yarn import
80
110
140
170
200
230
Jun-15
Sep-15
Dec-15
Mar-16
Jun-16
Sep-16
Dec-16
Mar-17
Jun-17
Sep-17
Dec-17
Mar-18
Jun-18
Million kgs
ICICI Securities Ltd. | Retail Equity ResearchPage 11
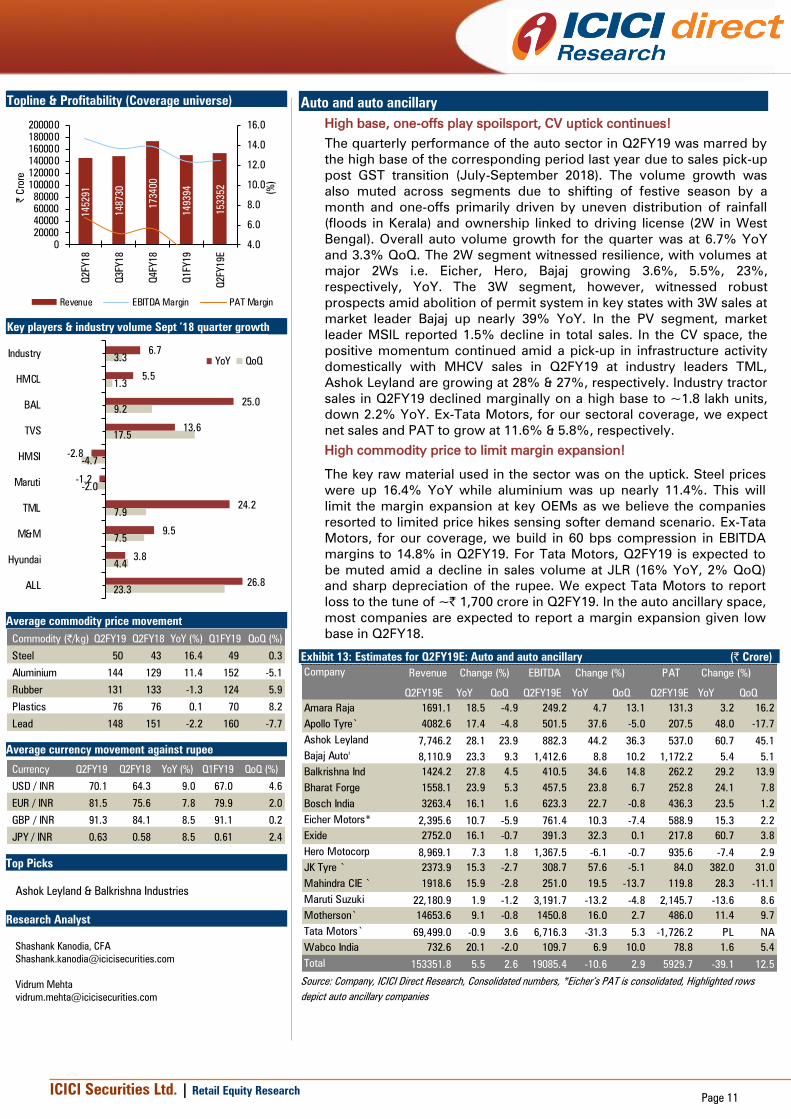
Auto and auto ancillary
High base, one-offs play spoilsport, CV uptick continues!
The quarterly performance of the auto sector in Q2FY19 was marred by
the high base of the corresponding period last year due to sales pick-up
post GST transition (July-September 2018). The volume growth was
also muted across segments due to shifting of festive season by a
month and one-offs primarily driven by uneven distribution of rainfall
(floods in Kerala) and ownership linked to driving license (2W in West
Bengal). Overall auto volume growth for the quarter was at 6.7% YoY
and 3.3% QoQ. The 2W segment witnessed resilience, with volumes at
major 2Ws i.e. Eicher, Hero, Bajaj growing 3.6%, 5.5%, 23%,
respectively, YoY. The 3W segment, however, witnessed robust
prospects amid abolition of permit system in key states with 3W sales at
market leader Bajaj up nearly 39% YoY. In the PV segment, market
leader MSIL reported 1.5% decline in total sales. In the CV space, the
positive momentum continued amid a pick-up in infrastructure activity
domestically with MHCV sales in Q2FY19 at industry leaders TML,
Ashok Leyland are growing at 28% & 27%, respectively. Industry tractor
sales in Q2FY19 declined marginally on a high base to ~1.8 lakh units,
down 2.2% YoY. Ex-Tata Motors, for our sectoral coverage, we expect
net sales and PAT to grow at 11.6% & 5.8%, respectively.
High commodity price to limit margin expansion!
The key raw material used in the sector was on the uptick. Steel prices
were up 16.4% YoY while aluminium was up nearly 11.4%. This will
limit the margin expansion at key OEMs as we believe the companies
resorted to limited price hikes sensing softer demand scenario. Ex-Tata
Motors, for our coverage, we build in 60 bps compression in EBITDA
margins to 14.8% in Q2FY19. For Tata Motors, Q2FY19 is expected to
be muted amid a decline in sales volume at JLR (16% YoY, 2% QoQ)
and sharp depreciation of the rupee. We expect Tata Motors to report
loss to the tune of ~| 1,700 crore in Q2FY19. In the auto ancillary space,
most companies are expected to report a margin expansion given low
base in Q2FY18.
Exhibit 13: Estimates for Q2FY19E: Auto and auto ancillary (| Crore)
Company Revenue Change (%) EBITDA Change (%) PAT Change (%)
Q2FY19E YoY QoQ Q2FY19E YoY QoQ Q2FY19E YoY QoQ
Amara Raja 1691.1 18.5 -4.9 249.2 4.7 13.1 131.3 3.2 16.2
Apollo Tyre` 4082.6 17.4 -4.8 501.5 37.6 -5.0 207.5 48.0 -17.7
Ashok Leyland 7,746.2 28.1 23.9 882.3 44.2 36.3 537.0 60.7 45.1
Bajaj Auto' 8,110.9 23.3 9.3 1,412.6 8.8 10.2 1,172.2 5.4 5.1
Balkrishna Ind 1424.2 27.8 4.5 410.5 34.6 14.8 262.2 29.2 13.9
Bharat Forge 1558.1 23.9 5.3 457.5 23.8 6.7 252.8 24.1 7.8
Bosch India 3263.4 16.1 1.6 623.3 22.7 -0.8 436.3 23.5 1.2
Eicher Motors* 2,395.6 10.7 -5.9 761.4 10.3 -7.4 588.9 15.3 2.2
Exide 2752.0 16.1 -0.7 391.3 32.3 0.1 217.8 60.7 3.8
Hero Motocorp 8,969.1 7.3 1.8 1,367.5 -6.1 -0.7 935.6 -7.4 2.9
JK Tyre ` 2373.9 15.3 -2.7 308.7 57.6 -5.1 84.0 382.0 31.0
Mahindra CIE ` 1918.6 15.9 -2.8 251.0 19.5 -13.7 119.8 28.3 -11.1
Maruti Suzuki 22,180.9 1.9 -1.2 3,191.7 -13.2 -4.8 2,145.7 -13.6 8.6
Motherson` 14653.6 9.1 -0.8 1450.8 16.0 2.7 486.0 11.4 9.7
Tata Motors` 69,499.0 -0.9 3.6 6,716.3 -31.3 5.3 -1,726.2 PL NA
Wabco India 732.6 20.1 -2.0 109.7 6.9 10.0 78.8 1.6 5.4
Total 153351.8 5.5 2.6 19085.4 -10.6 2.9 5929.7 -39.1 12.5
Source: Company, ICICI Direct Research, Consolidated numbers, *Eicher’s PAT is consolidated, Highlighted rows
depict auto ancillary companies
Topline & Profitability (Coverage universe)
145291
148730
173400
149394
153352
4.0
6.0
8.0
10.0
12.0
14.0
16.0
0
20000
40000
60000
80000
100000
120000
140000
160000
180000
200000
Q2FY18
Q3FY18
Q4FY18
Q1FY19
Q2FY19E
(%
)
| C
rore
Revenue EBITDA Margin PAT Margin
Key players & industry volume Sept ’18 quarter growth
(%)
6.7
5.5
25.0
13.6
-2.8
-1.2
24.2
9.5
3.8
26.8
3.3
1.3
9.2
17.5
-4.7
-2.0
7.9
7.5
4.4
23.3
Industry
HMCL
BAL
TVS
HMSI
Maruti
TML
M&M
Hyundai
ALL
YoY QoQ
Average commodity price movement
Commodity (|/kg) Q2FY19 Q2FY18 YoY (%) Q1FY19 QoQ (%)
Steel 50 43 16.4 49 0.3
Aluminium 144 129 11.4 152 -5.1
Rubber 131 133 -1.3 124 5.9
Plastics 76 76 0.1 70 8.2
Lead 148 151 -2.2 160 -7.7
Average currency movement against rupee
Currency Q2FY19 Q2FY18 YoY (%) Q1FY19 QoQ (%)
USD / INR 70.1 64.3 9.0 67.0 4.6
EUR / INR 81.5 75.6 7.8 79.9 2.0
GBP / INR 91.3 84.1 8.5 91.1 0.2
JPY / INR 0.63 0.58 8.5 0.61 2.4
Top Picks
Ashok Leyland & Balkrishna Industries
Research Analyst
Shashank Kanodia, CFA
Vidrum Mehta

ICICI Securities Ltd. | Retail Equity ResearchPage 12
Exhibit 14: Company specific view- OEM)
Company Remarks
Ashok Leyland Ashok Leyland is expected to report a robust performance in Q2FY19 primarily driven by
healthy 27% volume growth in the CV space. Total CV sales volume in Q2FY19 were at
51,958 units comprising LCV sales volume of 13,572 units, up 42% YoY and MHCV
sales volume of 38,386 units, up 22% YoY. LCV to MHCV mix in Q2FY19 was at 26:74
vs. 23:77 in Q2FY18. Consequent net sales in Q2FY19 are expected at | 7746 crore, up
28% YoY. EBITDA in Q2FY19 is expected at | 882 crore (EBITDA margins at 11.4%, up
130 bps YoY). PAT in Q2FY19 is expected at | 537 crore, up 60% YoY
Bajaj Auto Bajaj Auto is expected to report a healthy Q2FY19 performance primarily driven by
robust volume growth (up 25% YoY) amid a depreciating currency. Total 2W sales
volume in Q2FY19 was at 11.3 lakh units, up 23% YoY while 3W sales volume were at
2.1 lakh units, up 39% YoY. Domestic volume growth was at 19% in the 2W segment &
32% in the 3W segment. In Q2FY19, on account of increasing share of entry level
products, we expect domestic ASPs to decline to | 59173/unit. Consequent net sales
are expected at | 8111 crore, up 23% YoY. EBITDA in Q2FY19 is expected at | 1413
crore with consequent EBITDA margins at 17.4%, up 10 bps QoQ. PAT in Q2FY19 is
expected at | 1172 crore, up 5.4% YoY
Eicher Motors Eicher Motors is expected to report a stable performance in Q2FY19. Royal Enfield (2W)
sales volume in Q2FY19 was at 2.1 lakh units, up 3.6% YoY amid supply disruption at
one of its key facilities (volume lost of 10,000 units). CV sales at the VECV business
segment were at 18,940 up 24% YoY. Consequent net sales in Q2FY19 is expected at |
2396 crore, up 11% YoY. EBITDA is expected at | 761 crore with consequent EBITDA
margins at 31.8%, down 10 bps YoY. PAT in Q2FY19 is expected at | 589 crore, up
15.3% YoY. Consolidated PAT also includes profit from JV, which is expected at | 73.1
crore
Escorts Topline is expected to increase 24.5% YoY to | 1002 crore on the back of core tractor
business whose volumes were up ~27% YoY with volumes at ~14,978 units. Tractor
revenues are expected to grow ~31% YoY to ~| 801 crore. EBITDA margins are
expected to decline 54 bps QoQ to 7.8%, mainly driven by higher input cost & negative
operating leverage. We expect topline at ~| 1002 crore & PAT at ~| 46 crore for
Q4FY17
Hero MotoCorp Hero MotoCorp is expected to report a steady performance in Q2FY19 amid a marginal
hit on volumes due to price cut by one of its key competitor and pressure on raw
material costs. Total 2W sales volume in Q2FY19 were at 21.3 lakh units, up 5.5 % YoY.
It includes likely ~15% de-growth in the scoter segment and likely ~8% growth in the
motorcycle segment. Consequent net sales in Q2FY19 are expected at | 8969 crore, up
7.3% YoY. EBITDA in Q2FY19 is expected at | 1368 crore (EBITDA margins at 15.2%,
down 40 bps QoQ). PAT in Q2FY19 is expected at | 936 crore, down 7.4% YoY (high
margins in base quarter, 17.4% in Q2FY18)
M&M Revenues are expected to grow 8.6% YoY to | 11953 crore on the back of ~7.1% YoY Maruti Suzuki We expect Maruti to report a muted performance in Q2FY19 primarily driven by
marginal de-growth in sales volume, increase in raw material price as well as sharp
depreciation of Indian currency vs. Yen (down 8.5% YoY). Total domestic car sales in
Q2FY19 were at 4.5 lakh units, down 1.2% YoY while total sales including exports were
at 4.8 lakh units, down 1.5% YoY. Consequent net sales in Q2FY19 is expected at |
22181 crore, up 1.9% YoY. EBITDA in Q2FY19 is expected at | 3192 crore (EBITDA
margins at 14.4%, down 50 bps QoQ). PAT in Q2FY19 is expected at | 2146 crore,
down 13.6% YoY
Tata Motors Tata Motors is expected to report a muted performance in Q2FY19, primarily tracking
sales de-growth at JLR and sharp depreciation of the rupee (forex loss). On the
domestic front, the performance was strong with total vehicle sales at 1.9 lakh units, up
24% YoY. On the JLR front, total wholesale sales are expected at 1.3 lakh units, down
16% YoY and 2% QoQ. Sequentially, with focus on cost control, we expect EBITDA
margins to improve 30 bps QoQ at JLR to 6.5%. On a consolidated basis, sales in
Q2FY19 are expected at | 69,499 crore, down 0.9% YoY. EBITDA is expected at | 6716
crore (EBITDA margins at 9.7%, up 20 bps QoQ). At the PAT level, we expect Tata
Motors to report a loss of | 1726 crore (includes forex loss of | 1140 crore vs. | 1007
crore reported in Q1FY19)
Source: Company, ICICI Direct Research
Maruti Suzuki’s sales performance 395 492
431
462
490
-4.8
24.7
-12.4
7.16.2
-15
-10
-5
0
5
10
15
20
25
30
0
100
200
300
400
500
600
Q1FY18Q2FY18Q3FY18Q4FY18Q1FY19
(%
)
(000's
)
Sales QoQ growth
Ashok Leyland’s sales performance
28
41 4
7
59
42
-40.2
43.8
13.9
25.9
-28.3
-60
-40
-20
0
20
40
60
0
10
20
30
40
50
60
70
Q1FY18Q2FY18Q3FY18Q4FY18Q1FY19
(%
)
(000's
)
Sales QoQ growth
Eicher Motor’s sales performance
196 2
18
223
250
242
0.0
11.4
2.2
12.3
-3.3
-8
-3
2
7
12
17
22
0
40
80
120
160
200
240
280
Q1FY18 Q2FY18 Q3FY18 Q4FY18 Q1FY19
(%
)
(000's
)
Sales QoQ growth

ICICI Securities Ltd. | Retail Equity ResearchPage 13
Exhibit 15: Company specific view- Ancillaries
Company Remarks
Amara Raja
Batteries
(ARBL)
ARBL's revenue is expected to grow 18% YoY to | 1,691 crore, driven by automotive
volume growth & price hike. It had reported strong EBITDA margin in Q2FY18. Hence,
the margin may look soft, down 194 bps YoY. However, with average prices of lead
down 2.2% YoY & 7.7% QoQ to | 148/kg, the margin is likely to expand 235 bps QoQ to
14.7%. PAT is expected to grow 3% YoY to | 131 crore
Apollo Tyres
(APL)
APL's consolidated revenue is likely to grow 17% YoY to | 4,083 crore supported by
strong domestic CV demand. Average price of natural rubber declined 1.3% YoY; but
increased 5.9% QoQ to | 131/kg. The input cost of other crude derivatives will further
create some pressure on margins on a QoQ basis. Thus, EBITDA margins are likely to
expand 180 bps YoY to 12.3% (low base of Q2FY18) but may remain flat QoQ. PAT is
likely to increase 48% YoY to | 208 crore
Balkrishna
Industries (BIL)
Revenues are expected to increase 27.8% YoY to | 1,424 crore, driven by 1) volume
growth of 14% YoY to 56,237 MT & 2) favourable currency movement. Despite input
cost pressure, higher operating leverage & better product mix will expand its EBITDA
margins by 147 bps YoY to 28.8% (within the management guidance of 28-30%). PAT is
expected to increase 29.2% YoY to | 262 crore
Bharat Forge BFL's domestic revenues are expected to grow 24% YoY to | 624 crore, on the back of
strong M&HCV demand (account ~50% of its revenue) while exports are likely to grow
28% YoY to | 903 crore driven by US class 8 truck volumes. EBITDA margins are
expected to remain flat YoY at 29.4% as operating leverage benefit will largely be offset
by rising input cost. PAT is likely to grow 24% YoY to | 253 crore
Bosch Bosch is likely to report highest ever quarterly revenue, which is expected to increase
16% YoY to | 3,263 crore. The strong OEM production in CV will drive its revenue but
the same will be partly offset by subdued volume in the PV & tractor space. Operating
leverage is expected to drive its EBITDA margin that is likely to expand 100 bps YoY to
19.1%. PAT is expected to grow 23.5% YoY to | 436 crore
Exide Industries
(EIL)
EIL’s revenue is expected to grow 16% YoY to | 2752 crore driven by the automotive
space. Apart from enjoying a leadership position in the OEM space, its strategy of
rebuilding & capturing the unorganised players share will drive its replacement growth.
Its EBITDA margin is likely to expand 12bps QoQ to 14.2%. PAT is expected to increase
34% YoY to | 218 crore after EIL had exceptional expense of | 42 crore in Q2FY18
JK Tyre (JKTIL) Consolidated revenues are expected to grow 15.3% YoY to | 2,374 crore driven by
strong CV OEM demand & lower Chinese import in replacement market. Labour
restructuring in its Mexican subsidiary will improve its performance. JKTIL reported a
weak Q2FY18 operational performance mainly impacted by high input cost. Thus, YoY
performance would relatively look better. EBITDA margin may expand 350 bps YoY to
13%. PAT is expected at | 84 crore vs. | 17 crore in Q2FY18
Mahindra CIE
Automotive
Standalone business is expected to be driven by healthy production volumes of its top
three clients, which account for ~60% of its revenue. Thus, its revenue is expected to
grow 12% YoY to | 542 crore. EBITDA margins are likely to remain flat YoY at 10% with
PAT expected at | 29 crore. At the consolidated level, we expect revenue & EBITDA of
| 1919 crore & | 251 crore, respectively
Motherson
Sumi
On a consolidated basis, revenues are expected to grow 9.1% YoY to | 14,654 crore as
it is expected to witness decent demand growth across its business. Further favourable
currency movement will benefit MSSL while the change in new accounting standard
may impact its SMP & standalone business. Its EBITDA margin is likely to expand 59
bps YoY to 9.9%. PAT is expected to grow 11% YoY to | 486 crore
Wabco India
(WIL)
WIL's revenue is expected to increase 20.1% YoY to | 733 crore mainly driven by the
strong domestic M&HCV production (up >25% YoY). Higher input cost & poor product
mix (higher share of revenue from trading & export business) will impact EBITDA
margin, which is likely to contract 180 bps YoY to 15%. Thus, PAT is expected to
increase 2% YoY to | 79 crore
Source: Company, ICICI Direct Research
Hero MotoCorp’s sales performance
2023
1709
2002 2107
2134
9.1
-15.5
17.1
5.2
1.3
-25
-15
-5
5
15
25
1000
1200
1400
1600
1800
2000
2200
Q2FY18 Q3FY18 Q4FY18 Q1FY19 Q2FY19
(%
)
(000's
)
Sales QoQ growth
Bajaj Auto’s sales performance
1072
1001
1045
1227
1339
20.6
-6.5
4.4
17.3
9.2
-10
0
10
20
30
0
500
1000
1500
Q2FY18 Q3FY18 Q4FY18 Q1FY19 Q2FY19
(%
)
(000's
)
Sales QoQ growth

ICICI Securities Ltd. | Retail Equity ResearchPage 14
Banking and Financial Institutions
The financial sector at the end of the Q2FY19E quarter was plagued by
concerns on liquidity front, asset-liability mismatch and management
changes. NBFCs and within them housing finance companies were
impacted the most on account of these concerns. Banks on the other
hand could fare better in the rising interest rate scenario owing to better
pricing power in the credit market vs. NBFCs.
Credit growth of sector improving further in Q2FY19
One of the key highlights of the sector in Q2FY19E has been the
continued improvement in credit traction. As per the latest data by the
RBI, advances increased 13.5% YoY to ~| 88 lakh crore as on
September 14, 2018. This is an improvement compared to ~12.8% YoY
growth seen in Q1FY19. The growth continued to be led by retail book
(up ~18%) while large corporate loans remain sluggish at ~2% YoY.
One of the reasons contributing to higher credit growth is the shift
towards banking channel vs. debt market owing to a rise in interest
rates. Deposit growth is lower at ~8.6% YoY to | 115.7 lakh crore. This
entails a rise in CD ratio to 76% vs. 72.8% seen last year.
NII growth to be healthy on steady NIMs & lower interest reversals
Improving CD ratio and relatively steady slippages estimated in
Q2FY19E would lead to steady margins for the banks in Q2FY19E. This
is despite a 5-10 bps rise in deposit rates during the quarter. For our
coverage universe, we expect NII growth at 14.4% YoY to | 52077 crore
led by 17.3% YoY traction seen in NII of private banks. PSU banks are
also estimated to clock double digit YoY growth. There were no major
resolutions in Q2FY19E compared to two steel accounts seen in
Q1FY19 which boosted NII in Q1FY19. The impact of Essar Steel’s
account resolution is estimated to flow in Q3FY19E
Credit cost to stay elevated on ageing NPLs
Asset quality pressure, especially from corporate book, would continue
in Q2FY19E. Thus, slippages from this segment are estimated to be
steady QoQ. We expect GNPA for coverage banks to increase 18% YoY
to ~| 336800 crore in Q2FY19E, similar to traction in Q1FY19.
Provisions would remain elevated for the sector owing to ageing of
NPLs. For our coverage universe, we expect total provisions at ~|
24000 crore, similar to that seen in Q1FY19E. We estimate relief on the
credit cost front to accrue in H2FY19E. The stay by the Supreme Court
with regard to stressed assets of the power sector would slow the
resolution process. Thus, the impact would be seen in Q3FY19E.
Further, commentary with regard to banks exposure of
~| 50000 crore to the beleaguered company IL&FS would be keenly
watched.
Treasury gains to stay muted though relatively better vs. Q1FY19
G-sec yields in Q2FY19E have increased at a lower rate of 10 bps to
8.02% in Q2FY19E vs. 50 bps rise seen in Q1FY19. Thus, bank’s
treasury gains would be relatively better (though muted) than in
Q1FY19.
Earnings traction to stay muted now but rising interest rate scenario to
bode well for banks going ahead
Despite healthy NII traction estimated, PAT for the coverage universe
seems subdued YoY owing to elevated provisioning & lower treasury
gains expected as mentioned above. The QoQ traction seems higher
owing to large losses (| 4876 crore) booked by SBI in Q1FY19.
Excluding SBI, PAT growth for the coverage universe in Q2FY19 is
20.3% YoY and 3% QoQ.
Bandhan Bank would continue to report a strong set of numbers
followed by Yes Bank on the back of robust credit growth.
Net interest income (Coverage Universe) 22307
23082
23977
26179
24825
24704
24301
25214
26261
27252
20829
22225
26540
21677
24805
0
20000
40000
60000
80000
100000
Q2FY18
Q3FY18
Q4FY18
Q1FY19
Q2FY19E
(| C
rore)
PSB Private NBFC
PPP (Coverage Universe)
23042
15405
18550
14979
16388
18848
19729
20425
21612
22209
11367
13756
14069
11423
12154
0
10000
20000
30000
40000
50000
60000
Q2FY18
Q3FY18
Q4FY18
Q1FY19
Q2FY19E
(|
Crore)
PSB Private NBFC
Net Profit (Coverage Universe)
-10820
-4347
-1208
8331
9367
6739
9652
10508
2275
2552
2734
2856
2809
-15000
-10000
-5000
0
5000
10000
15000
Q2FY18
Q3FY18
Q4FY18
Q1FY19
Q2FY19E(
| C
rore)
PSB Private NBFC
* Numbers in chart excludes HDFC and Indian Bank
Top Picks
Axis Bank
SBI
Research Analyst
Kajal Gandhi
Vasant Lohiya
Vishal Narnolia

ICICI Securities Ltd. | Retail Equity Research
Page 15
Earnings of retail based private banks like IndusInd Bank are expected
to remain strong both on business and PAT front. Mid-size bank like
City Union Bank would continue to deliver a healthy set of numbers.
Federal Bank should sustain >20% YoY credit growth though earnings
would increase at a lower rate owing to higher credit cost.
Exhibit 16: Estimates for Q2FY19E ( | Crore)
NII PPP NP
Q2FY19E YoY QoQ Q2FY19E YoY QoQ Q2FY19E YoY QoQ
Bank of Baroda 4255.9 14.4 -2.9 2984.3 -1.9 -0.7 350.7 -1.3 -33.6
SBI 20569.2 10.7 -5.6 13403.9 -33.0 11.9 -1558.4 NA NA
Total 24825.1 11.3 -5.2 16388.3 -28.9 9.4 -1207.8 NA NA
Axis Bank 5055.1 11.4 -2.2 3892.4 3.0 -11.0 555.7 28.5 -20.7
Bandhan Bank 1068.3 54.0 3 844.6 42.0 2.9 494.4 49.3 2.6
City Union Bank 394.7 11.2 5.4 315.7 -1.4 5.4 165.0 14.0 2.2
DCB 286.3 15.4 4.9 144.0 15.7 1.8 73.5 24.9 5.8
Federal Bank 1059.1 17.8 8.1 664.1 13.8 10.2 311.0 17.7 18.4
HDFC Bank 11366.8 16.6 5.1 9342.2 19.5 8.0 4930.4 18.8 7.1
Indusind Bank 2194.4 20.5 3.4 1962.4 20.1 2.7 1091.5 24.0 5.4
J&K Bank 709.6 -1.8 2.7 329.0 -9.7 -0.2 61.4 LP 16.7
Kotak Bank 2710.4 17.2 4.9 2098.6 21.7 3.3 1193.2 20.0 16.4
Yes Bank 2407.3 27.7 8.5 2551.3 33.8 3.9 1261.7 25.8 0.1
Total 27252.2 17.3 3.8 22144.3 17.5 2.5 10137.8 21.7 5.0
Total Banks 52077.2 14.4 -0.7 38532.5 -8.0 5.3 8930.0 -13.0 68.4
LIC HF 913.4 2.9 -6.8 818.6 1.6 -13.8 491.7 0.5 -13.4
Rel Cap 4884.2 -7.0 5.2 339.8 -23.4 9.5 252.9 -28.1 -7.0
Bajaj Finance 2442.4 40.2 -3.4 1499.6 38.4 -7.7 751.6 35.0 -10.1
Bajaj Finserv 9554.4 26.4 8.9 2043.2 39.1 2.7 916.4 40.5 11.0
SBI Life Insurance 7010.2 30.2 47.4 7452.3 0.0 13.8 396.8 76.0 12.0
Total 24804.7 19.1 14.4 12153.5 8.0 6.4 2809.3 23.5 -1.6
Change (%) Change (%) Change (%)
Public Sector Banks
Private Banks
NBFCs
LP denotes loss to profit, * Figures are excluding HDFC and Indian Bank
Source: Company, ICICI Direct Research

ICICI Securities Ltd. | Retail Equity ResearchPage 16
Exhibit 17: Company specific view (Banks)
Bank of Baroda On asset quality, surge in GNPA accretion seen in Q4FY18 is not expected to
continue in Q1FY19. However, slippage from watchlist (| 10039 crore) could not be
ruled out. Despite moderation in slippages, credit cost is seen to remain elevated at
93% of PPP, owing to ageing of stressed assets. Write-back of | 208 crore from
resolution of Bhushan Steel (Exposure - | 1600 crore) to partially offset pressure on
profitability. Credit traction is seen to continue at healthy pace of 11.5% YoY, led by
continuance of robust growth in retail segment. Therefore, NII growth is expected
at ~20% YoY. Rise in G-sec yield to impact treasury income and thereby non-
interest income. PAT expected at | 134.6 crore compared to loss in Q4FY18.
State Bank of
India
SBI expected to report NII growth of 10% to |19326 crore as incremental slippages
should be lower than Q4 and MCLR hike of 10 bps to support NIM. Also with
slippages seen around |6000-8000 crore, provisions should also be lower QOQ.
Benefit of Bhushan Steel recovery can refllect in writeback of provisions of ~|1000-
1500 crore leading to overall NPA provisions at |9200 crore, Investment provisions
are expected to stay elevated at |3500 crore. WIth system credit growth at ~12%
SBI should have grown around 7-8% in credit to |2058600 crore. Deposits growth
is seen around 6% YoY. Thereby we expect marginal PAT at |1046 crore vs loss in
Q4FY18.
Axis Bank For Axis Bank, healthy growth in advances would continue at 17% YoY to | 451012
crore. This will be led by retail & SME segments. With bulk of the stress assets
recognised during Q4FY18 (slippages in Q4 were | 16356 crore), incremental
slippages in Q1FY18 is estimated to be lower QoQ. Accordingly, credit cost would
also witness a decline in Q1FY19E but would still be on a higher side. We expect
the bank to report muted earnings of | 198 crore in Q1FY19E vs. loss of | 2189
crore seen in Q4FY18.
City Union Bank Consistent performance in seen on business growth as well as operational
performance. Advances growth is expected steady at ~16.8% YoY to | 28103
crore, led by retail and SME. On operational front, NII growth is seen at 13.8% YoY
to | 390 crore. Rise in G-sec yields to impact non-interest income during the
quarter. Credit cost is seen to remain lower on YoY and QoQ basis at | 82 crore
(26% of PPP). Led by steady operational performance and marginally lower
provision, PAT is seen at | 263 crore; up 16% YoY. Incremental slippage to remain
in 1.7-2% range, in-line with management guidance. Asset quality to remain broadly
stable with GNPA at 3-3.2%.
DCB Bank For Q1FY19, core operational performance is seen to remain healthy with NII
growth of 19.1% YoY, led by stable margin above ~4% and 28% YoY growth in
advances. Healthy traction in credit is to be led by growth in mortgage and SME
segment. Treasury income is seen to keep non-interest income growth muted at |
73.5 crore, down 14% YoY, led by higher trading income in Q1FY18. Factoring in
steady run rate of net GNPA accretion at ~|20 crore, GNPA ratio is expected to
remain below 2%. With credit cost remaining steady at | 36 crore (26% of PPP),
PAT is expected at | 67.8 crore, up 3.9% YoY, owing to higher trading income in
Q1FY18
Source: Company, ICICI Direct Research
C-D Ratio (Industry)
69.9
71.872.5 72.7
73.675.1 75.4
24.840.4
51.4
176.2 131.2
110.0
20
60
100
140
180
65
70
75
80
Mar-17
May-17
Jul-17
Sep-1
7
Nov-17
Jan-18
Mar-18
May-18
Jul-18
Sep-1
8
(%
)
CD Ratio Incremental CD Ratio (RHS)
Asset Quality (Coverage Universe)
7.6 7.78.5 8.2
3.8 3.7 4.03.7
0.0
2.0
4.0
6.0
8.0
10.0
Q2FY18 Q3FY18 Q4FY18 Q1FY19
(%)
GNPA ratio NNPA rat io
NPA trend (Coverage Universe)
PSB
Bank of Baroda 57375 2.7 23184 3.6
SBI 218840 2.8 102236 3.0
Private Banks
Axis Bank 31029 -5.0 14007 -6.0
City Union Bank 877 3.0 483 2.0
DCB 421 5.0 162 5.0
Federal Bank 3070 7.0 1734 7.0
Indusind Bank 1828 5.0 800 5.0
J&K Bank 6442 3.2 2882 3.6
Kotak Mahindra Bank 4055 4.0 1588 4.0
Yes Bank 3226 14.2 1439 14.0
Q2FY19E
GNPA (|
crore)
QoQ
Growth(%)
NNPA (|
crore)
QoQ
Growth(%)

ICICI Securities Ltd. | Retail Equity Research
Page 17
Exhibit 18: Company specific view contd. (Banks)
Jammu &
Kashmir Bank
For J&K Bank, balance sheet growth is seen remaining healthy with advances
increasing ~20% YoY. However, interest reversal related to rehabilitated accounts
may keep earnings growth muted. Operational performance is seen remaining
muted with NII growth at 2.7% YoY to | 710 crore, post interest reversal of ~75
crore related to exposure to rehabilitated accounts. Cost to income ratio may
stabilise at ~60%. Slippages are seen moderate but subdued PPP, ageing of assets
and MTM losses on investment book may keep credit cost elevated at ~72% of
PPP. PAT is seen at | 61 crore, down 14% YoY. With a moderation in slippages,
overall asset quality may remain steady. However, exposure to rehabilitated
account at | 4129 crore continues to remain under watch
Kotak Mahindra
Bank
Steady performance is seen on both growth as well as asset quality. Advances
growth is seen at ~22% YoY, led by retail and small business. Asset quality may
remain resilient with GNPA stable at ~2.2%. Healthy traction in NII and other
income may lead to PPP growth of 22% YoY. Post a rise in provision, seen in
Q1FY19 led by investment book, credit cost is seen stabilising at ~14-15 bps of
advances (~13% of PPP). Impact of eKYC norms to be seen on traction of customer
addition, especially in '811' product. With recent stricter stance of the central bank,
clarity regarding plan to reduce promoter stake is to be seen
Yes Bank For Yes Bank, the robust traction in business is expected to continue. Deposits are
expected to increase ~41% YoY to | 222784 crore while ~60% YoY increase is
estimated in advances to | 239542 crore. Margins are seen in the range of ~3.2-
3.3%. Asset quality is expected to be stable with GNPA ratio in the range of 1.3-
1.4%. The earnings trajectory is expected to remain healthy at 24.6% YoY to | 1250
crore, though a bit slower compared to the run rate seen in previous quarters. The
management commentary and progress with regard to top management rejig and
also with regard to divergence would be keenly seen
IndusInd Bank We expect IndusInd Bank's overall consistent performance to continue in Q2FY19E.
We expect growth of 27% YoY to | 157056 crore led by both corporate finance &
consumer finance segment. Within consumer, CV financing, credit cards & personal
loans would continue with healthy growth. Margins are expected to be strong at
~3.8-3.9% range. This would lead to NII growth of 20.5% YoY to | 2194 crore. PAT
of | 1091 crore is expected, up 24% YoY while asset quality should remain largely
steady. However, the management commentary on exposure to IL&FS and progress
on merger with Bharat Financial would be keenly observed
Bandhan Bank Bandhan Bank is expected to report robust growth and asset quality performance.
Growth in AUM is seen remaining ahead of 30% YoY, led by micro loans. However,
non-micro loans are seen with growth >100% YoY. Margins are seen remaining
steady at ~10%. Led by robust growth in advances, NII growth is seen at 54% YoY
to | 1068 crore. Operational performance may remain steady with PAT at | 494
crore, up 49% YoY. Asset quality may remain stable with GNPA ratio at 1.35%.
Restriction on branch addition will not hamper business growth. The management
plans on reducing promoter stake to 40% will hold the key for future developments
in the bank
Source: Company, ICICI Direct Research

ICICI Securities Ltd. | Retail Equity ResearchPage 18
Exhibit 19: Company specific view (NBFCs)
LIC Housing
Finance
We expect advances growth of ~14.0% YoY to | 172615 crore. Individual home
loans (~95% of the portfolio) are also expected to increase ~13% YoY while
developer loans traction is expected to be at higher rate YoY. Margins remain the
key monitorable factor for LIC HF, which is expected at ~2.3%. We expect NPAs to
be lower than ~1.2% in Q1FY19. Estimate PAT of ~| 492 crore, flat YoY
Reliance Capital Reliance Capital is expected to report revenue growth of 5% QoQ to | 4884 crore,
not comparable YoY. MF AUM is expected to remain flat YoY led by declines in
September and weak growth in July and August 2018. Life insurance and general
insurance are expected to report an improvement in premium growth. Tight liquidity
conditions are expected to keep growth in HFC and CF on the lower side with
impact on margins. Hence, overall PAT is seen at | 253 crore, a decline of 7% QoQ
Bajaj Finance For Bajaj Finance Q2 is seasonally a weak quarter compared to Q1 and Q3.
However, led by the consumer finance segment, we estimate AUM will increase
35% YoY to | 97520 crore. Calculated margins of ~9.6% are expected with NII
growth of 40% YoY | 2442 crore. Asset quality may stay healthy while provisions
are seen steady QoQ. PAT of | 752 crore is expected, up 35% YoY (down 10% QoQ)
Bajaj Finserv General insurance premium growth is expected to be robust at 35% YoY to | 3342
crore. Life insurance premium growth of 22% YoY is also going to be better than
Q1FY19. With the combined ratio expected to continue below 100%, general
insurance earnings are expected to remain healthy at 30% YoY while life insurance
profitability is seen picking up at 20% YoY. Bajaj Finance is expected to continue its
AUM growth at 35% in the September quarter though liquidity lightness can impact
future growth. Overall PAT growth is seen at 40% YoY to | 916.4 crore
SBI Life
Insurance
Net premium income is expected to grow strong at 30% YoY to | 7010 crore, led by
an uptick in single premium (group). Healthy growth in individual regular premium
and 38% YoY growth in renewals is seen supporting topline. Owing to growth in
single premium, APE is expected to grow 8% YoY to | 256 crore. A sharp rise in
interest rates is expected to have a marginal impact on current P&L. However, it
will impact half yearly EV by 3-4% as investment valuations go lower. Accordingly,
policyholder’s surplus is seen higher. Healthy income from investment and
ploughing back policyholders reserves, shareholders PAT is expected at | 344 crore
Source: Company, ICICI Direct Research

ICICI Securities Ltd. | Retail Equity ResearchPage 19
Building materials
Oversupplied MDF segment to soften realisations; impact revenues
Previously, it was expected that MDF sales would boost the topline,
bottomline of plywood manufacturers as it is a high-margin product
with a huge opportunity in the Indian market. However, MDF
manufacturing capacity in India has doubled to 1.2 million CBM in
the past nine months, leading to oversupply of the product. This, in
turn, led MDF realisations to soften in Q1FY19. In order to capture
market share in such an intensely competitive MDF market,
companies in our plywood coverage universe are expected to take
3-9% price cuts, leading realisations to soften even further. Also,
revenues from plywood business are expected to remain stable vis-
à-vis Q2FY18 numbers. Hence, we expect overall revenues of our
plywood universe to grow 13.4%YoY to | 1044.2 crore in Q2FY19E.
Macro headwinds to put pressure on margins of BM universe...
Companies in our building materials universe faced operational
disruption in Q2FY19 due to factors like trucker’s strike and Kerala
floods. These headwinds are expected to restrict sales volume
growth of companies in Q2FY19E leading to low revenue growth
YoY amid stiff competition from unorganised players. Additionally,
increase in crude prices and weakening rupee have led to an
increase in gas and raw material prices like phenolic glue, urea
formaldehyde, etc, thus putting pressure on EBITDA margins.
Consequently, we expect overall EBITDA margins of our tiles
universe to contract 230 bps YoY to 12.5% in Q2FY19E.
Tiles universe revenues expected to grow 4.0% YoY...
Our tiles universe is expected to post volume growth of 6.8% YoY
to 31.9 MSM due to operational disruption caused by macro factors
in Q2FY19. Consequently, revenues are expected to grow 4.0%
YoY to | 1147 crore. We expect EBITDA margins to contract 350
bps YoY to 11.3% on account of higher gas prices. Hence, we
expect the bottomline to de-grow 28.7% YoY to | 53.9 crore.
Plywood universe revenues expected to grow 13.4% YoY...
We expect the topline of plywood universe to grow 13.4% YoY to
| 1044.2 crore mainly led by an increase in MDF sales volumes.
However, with MDF realisations expected to fall further amid
intensifying competition, we expect EBITDA margins to contract
110 bps YoY to 13.9%. Consequently, we expect PAT of our
plywood universe to de-grow 15.6% YoY to | 64.6 crore.
Exhibit 20: Estimates for Q2FY19E (Tiles) (| crore)
Revenue EBITDA PAT
Q2FY19E YoY QoQ Q2FY19E YoY QoQ Q2FY19E YoY QoQ
Kajaria Ceramics 712.9 6.2 8.5 103.5 -15.2 6.9 49.6 -22.2 8.7
Somany Ceramics 434.1 0.5 19.9 25.8 -36.9 19.6 11.0 -48.2 31.3
Total 1,147.0 4.0 12.5 129.3 -20.6 9.2 60.6 -28.7 12.2
Change (%)Change (%)
Company
Change (%)
Source: Company, ICICI Direct Research
Exhibit 21: Estimates for Q2FY19E (Plywood) (| crore)
Revenue EBITDA PAT
Q2FY19E YoY QoQ Q2FY19E YoY QoQ Q2FY19E YoY QoQ
Century Plyboards 580.3 22.3 8.0 84.8 14.5 -2.1 43.0 7.0 -5.3
Greenply Industries 440.3 -1.3 8.8 60.6 -5.0 31.9 21.6 -40.6 -9.2
Total 1,020.7 10.9 8.3 145.3 5.5 9.7 64.6 -15.6 -6.7
Change (%)
Company
Change (%) Change (%)
Source: Company, ICICI Direct Research
Topline & Profitability (Tiles universe)
1103
1047
1277
1019
1147
600
800
1000
1200
1400
Q2FY18
Q3FY18
Q4FY18
Q1FY19
Q2FY19E
| C
rore
3.0
6.0
9.0
12.0
15.0
18.0
(%
)
Revenue EBITDA Margin PAT Margin
Topline & Profitability (Plywood universe)
921
909 9
81
942 1
021
0.0
4.0
8.0
12.0
16.0
20.0
700
800
900
1000
1100
Q2FY18
Q3FY18
Q4FY18
Q1FY19
Q2FY19E
(%
)
| C
rore
Revenue EBITDA Margin PAT Margin
Sales Volume Trend (Tiles Universe)
16.4
17.4
17.6
20.2
17.8
9.3
12.5
11.8
15.9
13.1
0
6
12
18
24
Q1FY18
Q2FY18
Q3FY18
Q4FY18
Q1FY19E
(MS
M)
Kajaria Ceramics Somany Ceramics
Top pick of sector
Kajaria Ceramics
Research Analyst
Deepak Purswani, CFA
Harsh Pathak

ICICI Securities Ltd. | Retail Equity ResearchPage 20
Exhibit 22: Company specific view (Tiles coverage universe)
Company Remarks
Kajaria Ceramics We expect Kajaria Ceramics to post moderate sales volume growth of 10.6% YoY
to 19.3 million square metre (MSM) in Q2FY19E against management guidance of
12-15% for FY19E due to disruption in the business like the trucker’s strike and
Kerala floods. On the realisation front, Kajaria hiked its prices by ~1-1.5% for the
ceramic portfolio in Q2FY19. Overall, we expect revenues to grow 6.2% YoY to |
712.9 crore. On the EBITDA margin front, we expect it to contract 370 bps YoY due
to a sharp rise in gas prices following higher crude oil and weakening rupee.
Consequently, the bottomline is expected to post de-growth of 22.2% YoY to | 49.6
crore
Somany
Ceramics
We expect Somany to post low volume growth of 9.0% YoY to 13.6 MSM given the
impact of Kerala floods (| 15-20 crore), trucker’s strike (| 25-30 crore) and stricter
working capital controls implemented by the company in Q1FY19. In Q2FY19,
Somany also hiked its prices by 1-1.5% for its products. Overall, we expect
revenues to remain flattish at | 434.1 crore. Furthermore, EBITDA margins are
expected to contract 350 bps YoY to 5.9% due to increasing gas prices and
weakening rupee. Current gas prices are at | 39/SCM against | 33/SCM in
Q1FY19. Consequently, we expect PAT to de-grow 48.2% YoY to | 11.0 crore
Source: Company, ICICI Direct Research
Exhibit 23: Company specific view (Plywood coverage universe)
Company Remarks
Century Plyboard With incremental contribution from the MDF division, which commenced
operations in Q3FY18, we expect the topline to grow robustly by 22.3% YoY to |
580.3 crore. We expect the MDF division to operate at 70% capacity utilisation and
clock revenues worth | 72.4 crore. Plywood & allied division revenues are
expected to grow 6.1% YoY at | 324.4 crore. As MDF manufacturing capacity in
India has doubled in the past few months, realisations have softened. We expect
EBITDA margins to contract 100 bps YoY to 14.6% due to an increase in materials
cost coupled with a fall in realisations from the MDF division. Overall, we expect
the bottomline to grow 7.0% YoY to | 43.0 crore mainly led by topline growth
Greenply
Industries
We expect plywood revenues to contract 2.3% YoY to | 307.8 crore due to a fall in
YoY realisations and flattish sales volumes. MDF division revenues are expected to
grow by 8.8% YoY to | 132.5 crore led by strong volume growth due to capacity
addition at the Andhra plant. Due to overcapacity within the MDF segment and
intensifying competition, the company took 8-9% price cuts, which may cause
realisations to fall in Q2FY19E. Overall, we expect topline to de-grow by 1.3% YoY
to | 440.3 crore. EBITDA margins are expected to contract 170 bps YoY to 12.6%
due to higher material cost and fall in realisations. Consequently, we expect the
bottomline to de-grow 37.1% YoY to | 22.9 crore due to higher depreciation, higher
interest cost, higher tax rate & fall in MDF realisations compared to Q2FY18
Source: Company, ICICI Direct Research
Major News during Q2FY19
Century
Plywood
According to media reports, Century Plywood has said
it is banking on increased prices and exports to offset
the impact of costlier raw material imports and the
company's exposure to dollar denominated debt amid a
weakening rupee. It is considering increasing prices of
certain products by 1-2%. Also, out of its $27 million -
denominated debt, $17 million has already been booked
at an exchange rate of | 69 per US$, which leaves $10
million exposed to currency fluctuations

ICICI Securities Ltd. | Retail Equity ResearchPage 21
Cement
Seasonally weak quarter; non-trade segment to drive volume growth…
Although Q2FY19E is expected to remain weak seasonally due to
monsoons, we expect majority of volume growth to come from non-
trade segment (i.e. institutional segment) driven by government led
infra projects. We expect volume growth of 7.4% YoY on a like-to-like
basis. With capacity expansion by UltraTech, Shree Cement, we expect
I-direct universe volume growth of 13.8% YoY during the quarter. In
terms of regions, we expect South (Andhra Pradesh, Telangana),
Central, Eastern regions to report better volume growth vs. other
regions. Companies in AP, Telangana may report healthy double digit
growth mainly driven by higher infra spending by government. Heavy
floods in Kerala may negatively impact demand in Q2FY19E.
...higher non-trade share, weak retail demand to keep pricing under
pressure
As per our channel checks, realisation at the pan-India level has
declined 1.0% YoY, 3.0% QoQ to | 307/bag. The fall in pan-India
realisation was mainly due to pricing pressure in north (down 4.8%
YoY) and South (5.2% YoY). Prices in the east and western region have
broadly remained stable while the central region reported 1.8%
increase in prices YoY due to the low base of the previous year.
Consequently, we expect companies in our coverage universe to report
2.2% YoY decline in realisation to | 4,685/t.
UltraTech, Shree Cement to stay ahead of curve in volume growth
Our coverage universe is expected to report 11.4% YoY increase in
cement revenues led by 13.8% YoY increase in volumes. Company
wise, we expect UltraTech to report volume growth of 23% YoY mainly
due to acquisition of Jaiprakash Associates. Further, Shree Cement is
expected to register volume growth of 16.8% YoY mainly led by
capacity expansion. In addition, the low base of last year and higher
demand in the central region is expected to drive Heidelberg’s revenues
(up 12.1% YoY) in Q2FY19E. The bottomline of our universe is expected
to decline 17.1% YoY to | 1,214.6 crore led by lower operating margins
and higher interest expenses.
Higher input cost to dent EBITDA/t
Higher pet coke prices (up 19% YoY) and rise in diesel prices are
expected to dent EBITDA/t by 180-200/t. Hence, EBITDA/t is expected to
decline 22.7% YoY to | 690/t.
Exhibit 1: Estimates for Q2FY19E (| Crore)
Revenue EBITDA PAT
Q1FY19E YoY QoQ Q1FY19E YoY QoQ Q1FY19E YoY QoQ
ACC^ 3,559.1 7.4 -4.7 423.0 -14.6 -10.6 262.8 -18.3 -1.3
Ambuja^ 2,953.6 3.3 1.1 503.8 -22.6 -7.6 283.3 -27.8 -6.2
Heidelberg 479.9 11.2 -5.3 77.5 34.8 -10.7 32.1 96.9 -10.3
India Cement * 1,377.0 -5.8 1.2 150.4 -19.0 -29.5 14.3 -46.0 -71.5
JK Cement 1,097.1 5.3 -12.2 149.1 -24.6 -28.6 43.8 -45 -55
JK Laxmi Cement 954.1 5.9 -6.6 105.2 -12.5 -19.7 21.0 -25.6 -48.0
Mangalam Cement 269.1 6.5 -7.4 9.0 -77.0 -76.1 -5.6 PL PL
Ramco Cements 1,178.9 14.6 -2.3 261.1 -10.1 -7.2 123.1 -21.0 -12.5
Sagar Cements 271.6 4.9 -7.9 34.6 -18.6 -10.8 4.5 -54.4 -4.0
Shree Cement * 3,016.5 17.3 10.0 662.2 -7.2 -8.0 353.1 -19.8 -21.0
Star Cement 466.2 8.8 0.4 126.2 -20.6 -20.9 71.6 -33.4 -30.6
UltraTech Cem 8,752.2 32.1 -0.9 1,677.4 7.5 -4.0 691.6 -22.3 -11.8
Total 24,375.2 15.1 -1.0 4,179.4 -7.4 -10.0 1,895.6 -23.6 -17.2
Company
Change (%) Change (%) Change (%)
Source: Company, ICICI direct Research ^Q3CY18 result
Topline & Profitability (Coverage universe)
19475
21657
24746
24713
21701
0
4000
8000
12000
16000
20000
24000
Q2FY18
Q3FY18
Q4FY18
Q1FY19
Q2FY19E
| C
rore
4.0
6.0
8.0
10.0
12.0
14.0
16.0
18.0
20.0
(%
)
Revenue EBITDA Margin PAT Margin
All-India quarterly cement dispatches
40
60
80
100
Q1FY17
Q2FY17
Q3FY17
Q4FY17
Q1FY18
Q2FY18
Q3FY18
Q4FY18
Q1FY19
Q2FY19
million t
onnes
-20.0
-10.0
0.0
10.0
20.0
30.0
%
Cement dispatches (LHS) YoY growth (RHS)
Monthly production growth YoY (%) – Till July 2018
21.9
13.0
13.2
10.8
-13.3
-15.8
-1.4
-3.3
1.0
0.7
-1.3
17.7
19.6 23.0
13.5
-6.0
-5.2
0.1
16.9
-20.0
-15.0
-10.0
-5.0
0.0
5.0
10.0
15.0
20.0
25.0
Jan
Feb
Mar
Apr
May
Jun
Jul
Aug
Sep
Oct
Nov
Dec
2018 2017
Top pick of the sector
Heidelberg Cement
Research Analyst
Rashesh Shah

ICICI Securities Ltd. | Retail Equity ResearchPage 22
Exhibit 2: Company specific view
Company Remarks
ACC Healthy demand in the eastern region led by a pick-up in IHB (accounts for 27% of
ACC's capacity) and government led infra projects are expected to drive cement
volumes (up 7.5% YoY) in Q2FY19. However, weak pricing environment (down 1%
YoY, 3% QoQ) due to monsoon and higher power & freight costs may bring down
EBITDA/t by 5.7%% YoY during the quarter
Ambuja Cement Ambuja is expected to report higher volume growth of 9.6% YoY mainly due to last
year's low base and healthy demand from infra segments in its key area of
operations. With healthy volume growth, we expect EBITDA/t to broadly be
maintained YoY despite a weak pricing environment and cost pressure, However,
we expect net profit to decline 8.3% YoY mainly due to higher tax outgo during the
current quarter
UltraTech Cement UltraTech Cement is expected to report volume growth of 23% YoY in Q2FY19E
mainly led by organic growth of 7.8% YoY and acquisition of Jaypee assets
(utilisation up from 35% in Q2FY18 to 70.0% in Q2FY19E). However, EBITDA/t is
expected to decline 15.6% QoQ to | 783/t mainly led by higher pet coke (i.e. 60%
of fuel mix) and diesel prices
Shree Cement Capacity expansion of 3.6 MT in Rajasthan and 2 MT in Bihar is expected to result
in 16.8% YoY increase in cement volumes. This, along with healthy power segment
revenues, led by higher spot prices, may keep revenue growth healthy. However,
the company's higher dependence on imported petcoke and weak prices in the
northern region may keep margins under check during the quarter
India Cement India Cement is expected to report healthy capacity utilisation (up from 69% in
Q2FY18 to 73% in Q2FY19) mainly led by a pick-up in demand in Tamil Nadu due to
better sand availability and higher infra spending in AP & Telangana regions.
However, EBITDA/t is expected to decline 27.6% YoY to | 486/t on account of
higher input cost and pricing pressure
JK Cement JK Cement is expected to report low single digit volume growth (up 1.1% YoY)
mainly due to last year’s high base impact. This, along with weak realisations, may
lead to 3.0% YoY drop in grey cement revenues. On the other hand, white cement
may report revenue growth of 6% YoY led by healthy demand and strong prices.
Blended EBITDA/t is expected to fall 39.6% YoY mainly led by 81% YoY decline in
grey cement EBITDA/t partly offset by healthy growth in white cement EBITDA/t
JK Lakshmi
Cement
The company is expected to report below industry average volume growth due to
reduced focus on the non-trade segment. Average realisation during the quarter
may also go down 2% YoY in the northern region due to monsoons and weak
demand from the trade segment. Higher power & freight cost may continue to
pressurise margins. We expect EBITDA/t to decline 23.8% YoY to | 385/t during
the quarter
Mangalam
Cement
Higher sales to the non-trade segment and ramp up in expanded capacity in Uttar
Pradesh are expected to drive volumes (up 7.6% YoY) in Q2FY19E. However, higher
share in the non-trade segment along with higher cost pressure may result in a
sharp fall in EBITDA/t during the quarter. Further, the company is expected to
report a loss at the net level mainly led by lower operating margins and higher
depreciation
Heidelberg
Cement
The company is expected to report topline growth of 12.1% YoY to | 470.8 crore
mainly led by volume growth of 7.8% YoY (driven by higher retail demand in the
central region) and 4% YoY increase in realisations (due to consolidation in the
industry and low base in last year). However, EBITDA/t is expected to decline
17.5% YoY mainly due to higher power & fuel costs
Source: Company, ICICI Direct Research
Sales volume (Coverage Universe)
Million tonnes Q2FY19E Q2FY18 YoY (%) Q1FY19 QoQ (%)
ACC 6.4 6.0 7.5 7.1 -9.9
Ambuja 5.5 5.0 9.6 6.4 -13.7
UltraTech* 16.2 13.1 23.0 17.5 -7.6
Shree Cem 5.7 4.9 16.8 7.0 -18.5
India Cem 2.8 2.7 5.1 3.1 -7.7
JK Cement* 2.2 2.2 1.1 2.3 -2.8
JK Lakshmi 2.0 1.9 4.1 2.3 -14.0
Mangalam 0.7 0.6 7.6 0.7 0.0
Heidelberg 1.1 1.1 7.8 1.3 -9.8
Star Cement 0.6 0.4 25.6 0.8 -31.8
Ramco Cement 2.4 2.2 11.4 2.6 -8.1
Sagar Cement 0.7 0.6 16.1 0.7 -10.0
Total 46.2 40.6 13.8 51.7 -10.6
* blended sales volume (grey & white)
RE
Region-wise cement retail prices
|/50 kg bag Q2FY19 Q2FY18 YoY (%) Q1FY19 QoQ (%)
North 268 282 -4.8 274 -2.0
East 248 247 0.3 250 -0.6
South 334 353 -5.2 358 -6.7
West 297 298 -0.4 321 -7.5
Central 299 294 1.8 300 -0.2
North East 398 390 2.2 402 -1.0
Average 307 311 -1.0 317 -3.1
Cement Realisations (Coverage Universe)
| per tonne Q2FY19E Q2FY18 YoY (%) Q1FY19 QoQ (%)
ACC 5090 5125 -0.7 5204 -2.2
Ambuja 4600 4621 -0.5 4736 -2.9
UltraTech 4825 5001 -3.5 4946 -2.4
Shree Cem 4075 4169 -2.2 4105 -0.7
India Cem^ 4380 4652 -5.8 4401 -0.5
JK Cement* 4843 4981 -2.8 4819 0.5
JK Lakshmi 4010 4110 -2.4 4038 -0.7
Mangalam 3890 3929 -1.0 3910 -0.5
Heidelberg 4120 3962 4.0 4237 -2.8
Star Cement 6228 6436 -3.2 6422 -3.0
Ramco Cement 4483 4783 -6.3 4544 -1.3
Sagar Cement 3679 4092 -10.1 3709 -0.8
Average 4685 4791 -2.2 4746 -1.3
* Blended realisations (grey cement +white cement), ^ including
excise duty in Q1FY18
EBITDA per tonne (Coverage Universe)
| per tonne Q2FY19E Q2FY18 YoY (%) Q1FY19 QoQ (%)
ACC 560 594 -5.7 752 -25.5
Ambuja 700 706 -0.8 977 -28.3
UltraTech* 783 1028 -23.9 928 -15.6
Shree Cem 707 1132 -37.5 763 -7.3
India Cem 486 672 -27.6 508 -4.2
JK Cement* 563 932 -39.6 650 -13.4
JK Lakshmi 385 505 -23.8 410 -6.2
Mangalam 45 453 -90.0 70 -35.3
Heidelberg 681 825 -17.4 915 -25.6
Star Cement 1442 1778 -18.9 1636 -11.9
Ramco Cement^ 857 1401 -38.9 959 -10.7
Sagar Cement 432 669 -35.5 492 -12.2
Average 690 893 -22.7 825 -16.4
*blended (grey + white), ^Blended (Cement +Power)
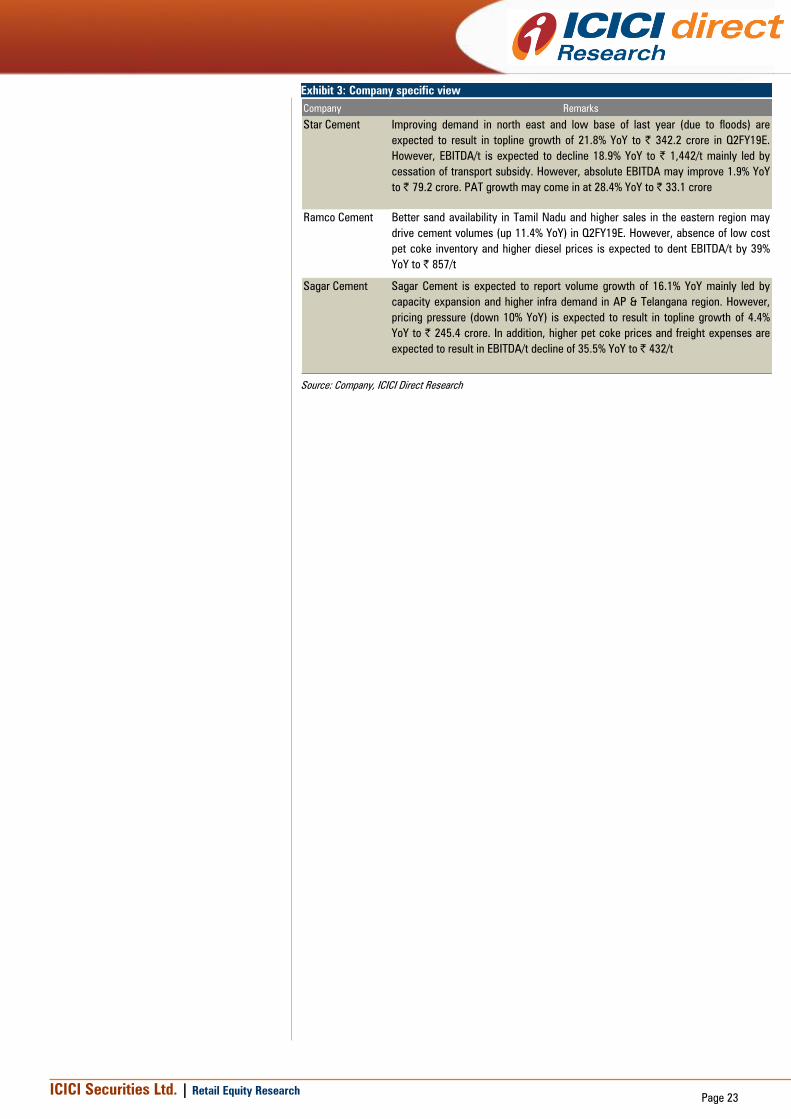
ICICI Securities Ltd. | Retail Equity ResearchPage 23
Exhibit 3: Company specific view
Company Remarks
Star Cement Improving demand in north east and low base of last year (due to floods) are
expected to result in topline growth of 21.8% YoY to | 342.2 crore in Q2FY19E.
However, EBITDA/t is expected to decline 18.9% YoY to | 1,442/t mainly led by
cessation of transport subsidy. However, absolute EBITDA may improve 1.9% YoY
to | 79.2 crore. PAT growth may come in at 28.4% YoY to | 33.1 crore
Ramco Cement Better sand availability in Tamil Nadu and higher sales in the eastern region may
drive cement volumes (up 11.4% YoY) in Q2FY19E. However, absence of low cost
pet coke inventory and higher diesel prices is expected to dent EBITDA/t by 39%
YoY to | 857/t
Sagar Cement Sagar Cement is expected to report volume growth of 16.1% YoY mainly led by
capacity expansion and higher infra demand in AP & Telangana region. However,
pricing pressure (down 10% YoY) is expected to result in topline growth of 4.4%
YoY to | 245.4 crore. In addition, higher pet coke prices and freight expenses are
expected to result in EBITDA/t decline of 35.5% YoY to | 432/t
Source: Company, ICICI Direct Research
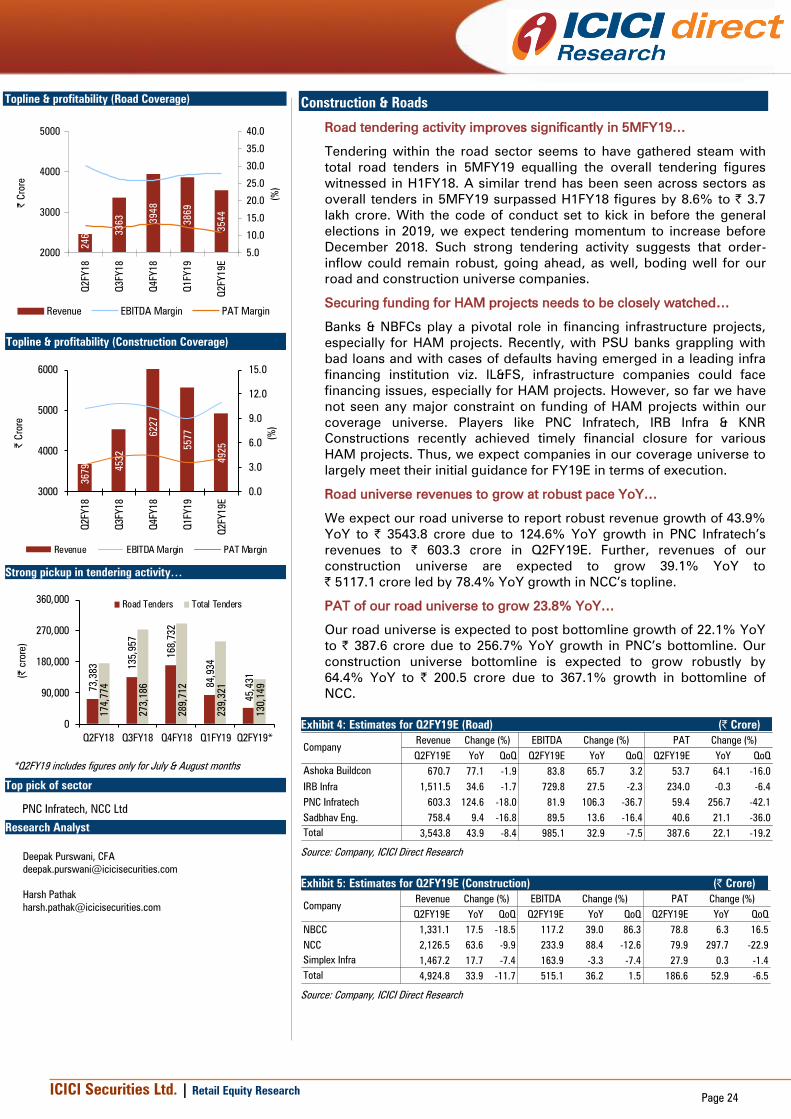
ICICI Securities Ltd. | Retail Equity ResearchPage 24
Construction & Roads
Road tendering activity improves significantly in 5MFY19…
Tendering within the road sector seems to have gathered steam with
total road tenders in 5MFY19 equalling the overall tendering figures
witnessed in H1FY18. A similar trend has been seen across sectors as
overall tenders in 5MFY19 surpassed H1FY18 figures by 8.6% to | 3.7
lakh crore. With the code of conduct set to kick in before the general
elections in 2019, we expect tendering momentum to increase before
December 2018. Such strong tendering activity suggests that order-
inflow could remain robust, going ahead, as well, boding well for our
road and construction universe companies.
Securing funding for HAM projects needs to be closely watched…
Banks & NBFCs play a pivotal role in financing infrastructure projects,
especially for HAM projects. Recently, with PSU banks grappling with
bad loans and with cases of defaults having emerged in a leading infra
financing institution viz. IL&FS, infrastructure companies could face
financing issues, especially for HAM projects. However, so far we have
not seen any major constraint on funding of HAM projects within our
coverage universe. Players like PNC Infratech, IRB Infra & KNR
Constructions recently achieved timely financial closure for various
HAM projects. Thus, we expect companies in our coverage universe to
largely meet their initial guidance for FY19E in terms of execution.
Road universe revenues to grow at robust pace YoY…
We expect our road universe to report robust revenue growth of 43.9%
YoY to | 3543.8 crore due to 124.6% YoY growth in PNC Infratech’s
revenues to | 603.3 crore in Q2FY19E. Further, revenues of our
construction universe are expected to grow 39.1% YoY to
| 5117.1 crore led by 78.4% YoY growth in NCC’s topline.
PAT of our road universe to grow 23.8% YoY…
Our road universe is expected to post bottomline growth of 22.1% YoY
to | 387.6 crore due to 256.7% YoY growth in PNC’s bottomline. Our
construction universe bottomline is expected to grow robustly by
64.4% YoY to | 200.5 crore due to 367.1% growth in bottomline of
NCC.
Exhibit 4: Estimates for Q2FY19E (Road) (| Crore)
Revenue EBITDA PAT
Q2FY19E YoY QoQ Q2FY19E YoY QoQ Q2FY19E YoY QoQ
Ashoka Buildcon 670.7 77.1 -1.9 83.8 65.7 3.2 53.7 64.1 -16.0
IRB Infra 1,511.5 34.6 -1.7 729.8 27.5 -2.3 234.0 -0.3 -6.4
PNC Infratech 603.3 124.6 -18.0 81.9 106.3 -36.7 59.4 256.7 -42.1
Sadbhav Eng. 758.4 9.4 -16.8 89.5 13.6 -16.4 40.6 21.1 -36.0
Total 3,543.8 43.9 -8.4 985.1 32.9 -7.5 387.6 22.1 -19.2
Change (%)
Company
Change (%) Change (%)
Source: Company, ICICI Direct Research
Exhibit 5: Estimates for Q2FY19E (Construction) (| Crore)
Revenue EBITDA PAT
Q2FY19E YoY QoQ Q2FY19E YoY QoQ Q2FY19E YoY QoQ
NBCC 1,331.1 17.5 -18.5 117.2 39.0 86.3 78.8 6.3 16.5
NCC 2,126.5 63.6 -9.9 233.9 88.4 -12.6 79.9 297.7 -22.9
Simplex Infra 1,467.2 17.7 -7.4 163.9 -3.3 -7.4 27.9 0.3 -1.4
Total 4,924.8 33.9 -11.7 515.1 36.2 1.5 186.6 52.9 -6.5
Change (%) Change (%) Change (%)
Company
Source: Company, ICICI Direct Research
Topline & profitability (Road Coverage)
2463 3363
3948
3869
3544
2000
3000
4000
5000
Q2FY18
Q3FY18
Q4FY18
Q1FY19
Q2FY19E
| C
rore
5.0
10.0
15.0
20.0
25.0
30.0
35.0
40.0
(%
)
Revenue EBITDA Margin PAT Margin
Topline & profitability (Construction Coverage)
3679 4532
6227
5577
4925
0.0
3.0
6.0
9.0
12.0
15.0
3000
4000
5000
6000
Q2FY18
Q3FY18
Q4FY18
Q1FY19
Q2FY19E
(%
)
| C
rore
Revenue EBITDA Margin PAT Margin
Strong pickup in tendering activity…
73,383 135,957
168,732
84,934
45,431
174,774
273,186
289,712
239,321
130,149
0
90,000
180,000
270,000
360,000
Q2FY18 Q3FY18 Q4FY18 Q1FY19 Q2FY19*
(| crore)
Road Tenders Total Tenders
*Q2FY19 includes figures only for July & August months
Top pick of sector
PNC Infratech, NCC Ltd
Research Analyst
Deepak Purswani, CFA
Harsh Pathak

ICICI Securities Ltd. | Retail Equity ResearchPage 25
Exhibit 6: Company specific view (Road coverage universe)
Company Remarks
Ashoka Buildcon We expect revenue to grow by 77.1% YoY to | 670.7 crore on account of low base
effect and improvement in execution. Furthermore, we expect EBITDA margins to
contract 90 bps YoY to 12.5% in line with management guidance band of 12.5-13%.
On the profitability front, we expect PAT to grow robustly by 64.1% YoY to | 53.7
crore led by strong topline growth.
Key monitorable: Management guidance on execution ahead
IRB Infrastructure We expect topline to grow at a robust 34.6% YoY to | 1511.5 crore led by 35.2%
YoY growth in construction revenues. Toll revenues are expected to grow strongly
by 50.4% YoY to | 537.9 due to low base effect following transfer seven BOT
projects to IRB InvIT. We expect EBITDA margins to contract by 270 bps YoY to
48.3% due to higher expected cost of materials in Q2FY19E. Consequtively, the
bottomline is expected to remain flattish YoY at | 234.0 crore.
Key monitorable: Management guidance on execution
PNC Infratech Given the healthy pace of execution and receipt of appointed dates of several big
ticket projects, we expect the topline to grow significantly by 124.6% YoY to |
603.3 crore. EBITDA margins are expected to contract 120 bps YoY to 13.6% on
account of higher raw material expenses. Overall, we expect the bottomline to
grow 3.6x YoY to | 59.4 crore mainly led by strong execution
Key monitorable: Management commentary on progress on HAM projects
Sadbhav
Engineering
We expect the topline to grow by 9.4% YoY to | 758.4 crore led by ramp-up in
execution of seven HAM projects that achieved financial closure in Q1FY19.
Moreover, EBITDA margins are expected to expand 40 bps YoY at 11.8%.
Consequently, we expect the bottomline to grow at a robust 21.1% YoY to | 40.6
crore led by topline growth, margin expansion and higher other income
Key monitorable: Improvement in execution
Source: Company, ICICI Direct Research
Road Coverage Universe
Interest expense* trend
11.2
8.4
6.7
7.8
8.6
6.0
9.0
12.0
15.0
Q2FY18
Q3FY18
Q4FY18
Q1FY19
Q2FY19E
(%
)
*Interest Expenses as %age of Sales
Major news during Q2FY19
Ashoka
Buildcon
Ashoka Buildcon's subsidiary has received
arbitral payment worth | 22.4 crore with respect
to project viz. construction of 4/6 lane access
controlled Chittorgarh Bypass - NH-79, in
Rajasthan
IRB Infra IRB Infra has achieved financial closure for two
HAM projects - | 617 crore for NH-32 Puducherry-
Poondiyankuppam stretch of 38/ km; and | 1209
crore for Poondiyankuppam-Sattanathpuram on
the same NH-32
PNC Infratech
PNC Triveni Sangam Highways Pvt Ltd - wholly
owned subsidiary of PNC Infratech, has achieved
financial closure for Chakeri Allahabad section NH-
2 HAM project in Uttar Pradesh
After being declared the L1 bidder for the fourth
package of Nagpur-Mumbai Six Lane Super
Communication Expressway EPC project on May
31, 2018, PNC Infratech has received a letter of
award from MSRDC on August 30, 2018 for the
negotiated contract price of | 1999.5 crore
Road Sector
NHAI has secured | 25,000 crore loan from SBI in
a single tranche at a bare interest rate of 7.99%
The funds will be used to meet the road
construction target of 45 km/day
As per media reports, the government may ease
land purchase norms to push road projects.
Currently, 80% land has to be acquired before
construction starts. This threshold may be
lowered to 50%
According to media reports, Road Transport and
Highway Minister Nitin Gadkari has said that risk
averse bankers are slowing construction of
infrastructure projects in India

ICICI Securities Ltd. | Retail Equity ResearchPage 26
Exhibit 7: Company specific view (Construction coverage universe)
Company Remarks
NBCC Recently, the Delhi High Court asked NBCC to apply for fresh clearances and
allowed the company to go ahead with redevelopment work in six Delhi colonies.
The court's decision on only Nauroji Nagar is pending, which is expected to come
in mid-October. While this will help the company ramp up its execution to meet its
FY19E target, we do not expect a significant improvement in NBCC's execution in
this quarter. Though the management has maintained its initial guidance of 30-35%
topline growth for FY19E, we expect NBCC's PMC revenues to grow 16.8% YoY to |
1171.9 crore in Q2FY19E. On EBITDA margin front, we expect NBCC's margin to
improve 140 bps YoY to 8.8% as real estate margin were depressed in Q2FY18 (2%
vs. 20% in Q2FY19E). In the PMC division, we expect EBIT margin of 12% (8.8%
after un-allocable expenses) in Q2FY19E. Overall, the bottomline is expected to
grow 6.3% YoY to | 78.8 crore following higher tax rate
Key monitorable: Tendering of contracts to third party & execution
Simplex
Infrastructure
With recoveries from old debtors worth | 130 crore, QIP proceeds and internal
accruals, the company has reduced its debt to | 3119 crore vs. | 3600 crore in
FY18. Furthermore, with improved leverage position and a strong order book
position (3.2x TTM revenues), we expect execution to improve and expect its
topline to grow 17.7% YoY to | 1467.2 crore. We expect EBITDA margins to remain
stable at 11.2% QoQ. Furthermore, we expect the YoY bottomline to remain flattish
at | 27.9 crore on account of an increase in tax rate despite reduction in interest
expenses (| 108.6 crore vs. | 117.6 crore in Q2FY18)
Key monitorable: Management commentary on debtors recovery
NCC Ltd We expect NCC to maintain its strong execution momentum during the quarter
given its strong order book position (4.1x TTM revenues). Consequently, we expect
the topline to grow at 63.6% YoY to | 2126.5 crore given the low base following
GST regime and improved execution. Furthermore, EBITDA margins are expected to
expand 150 bps YoY at 11.0% as new orders have better margin profile. Overall, we
expect bottomline to grow robustly by 4.0x YoY to | 79.9 crore
Key monitorable: Management commentary on execution
Source: Company, ICICI Direct Research
Construction Coverage Universe
De-leveraging on top of mind of construction
players…
5.6
4.8
3.6
4.0
4.3
3.0
4.0
5.0
6.0
7.0
Q2FY18
Q3FY18
Q4FY18
Q1FY19
Q2FY19E
(%
)
*Interest Expenses as %age of Sales
Major News during Q2FY19
Infrastructure
sector
The Maharashtra Cabinet has approved the
implementation of two metro rail projects Dahisar-
Mira Bhayander and Andheri- CSIM Airport
collectively worth | 6607 crore
NCC
NCC has received four new orders totalling |
3592.5 crore (ex GST). Out of this, two orders of
| 671.5 crore pertain to buildings division, one
order of | 2850 crore pertains to roads division
and another order of | 70.9 crore pertains to
water & environment division. The execution
period of these proiects is 24-30 months
The Union Cabinet has sanctioned | 1216.9 crore
for construction of a new terminal at Jayaprakash
Narayan International Airport in Patna. NCC has
been shortlisted for the construction of the
terminal building
NBCC
The Delhi High Court in its interim order on July 4,
2018, banned felling of trees city till further
orders. On September 21, 2018, the Ministry of
Housing and Urban Affairs informed the Delhi
High Court that they redesigned their project
wherein, 6997 trees will be affected instead of
20696 earlier. On October 4, 2018, the Delhi High
Court asked NBCC to go ahead with
redevelopment of six residential projects after
applying for fresh environmental & other
clearances
NBCC has received in principle approval from Air
India to monetise/redevelop its land parcel at
Connaught Place & Vasant Vihar in Delhi
On September 5, 2018, NBCC told the Supreme
Court that it can complete 15 housing projects
with 46,575 flats of Amrapali Group within 36
months at a construction cost of ~| 8500 crore.
On September 14, 2018, the SC appointed NBCC
to develop stalled projects of the Amrapali Group.
On September 17, 2018, the central government
proposed to the SC that NBCC would take over all
unfinished project in Noida and Greater Noida of
~10,000 homebuyers in Three C group of
companies, 30,000 in Jaypee and 5,923 in
Unitech affected by non-delivery of flats

ICICI Securities Ltd. | Retail Equity ResearchPage 27
Consumer Discretionary
Higher base, GST rate cut to weigh on festive inventory build-up
I-direct consumer discretionary (CD) universe is likely to record sales
growth of ~8% YoY on a relatively higher base of Q2FY18 (due to early
Diwali and inventory build-up post GST). Paints companies are likely to
record volume growth of ~7% YoY led by decorative segment while
industrial paint demand may remain muted owing to lower offtake from
the automotive industry. The industry also had to pass on GST rate cut
(up to 10 percentage point) to customers. This would completely offset
the price hike (of ~3%) taken during the period. As a result, paint
companies are likely to record muted performance during the period.
On the electrical goods front, V-Guard’s revenue is likely grow at a
lower rate of ~5% YoY due to floods in Kerala during Q2 (We believe
revenue loss of ~| 30 crore due to flood). Further, lean period coupled
with higher inventory at dealer level would continue to weigh on the
performance of cooling product companies like Voltas, Symphony.
However, Bajaj Electrical, Havells (including Lloyd) are likely to record
CD sales growth of 19%, 10% YoY, supported by increase in dealer
penetration and relatively diversified product ranges respectively.
Under the plastic piping segment, Astral Poly is likely to record sales
growth of ~15% YoY led by similar volume growth owing to new
capacity addition.
Higher input cost to weigh on EBITDA margin
The I-direct CD universe is likely to face pressure in gross margin due to
adverse currency movement (| depreciated ~9% YoY against US$)
higher crude price (up ~51% YoY) and VAM (up ~18% YoY). This
coupled with passing on GST rate cut benefit to customers, we believe
the EBITDA margin of paint would be down ~200 bps YoY. Higher VAM
prices would also weigh on the gross margin of Pidilite. Electronic
goods companies such as Voltas, V-Guard and Symphony are likely to
record a contraction in EBITDA margin in the range of ~100-200 bps
YoY considering lower operating leverage.
Estimate PAT de-growth on EBITDA margin contraction
Considering the core factor such as lower sales growth coupled with
contraction in EBITDA margin, we believe the I-direct coverage universe
will record PAT de-growth of ~8% YoY. We believe a favourable base
coupled with non-core revenue of Bajaj Electricals and Supreme
Industries would lead to PAT growth of ~37% YoY and 24% YoY,
respectively, in Q2FY19.
Exhibit 8: Estimates for Q2FY19E (Consumer Discretionary) (| Crore)
Company Revenue EBITDA PAT
Q2FY19E YoY QoQ Q2FY19E YoY QoQ Q2FY19E YoY QoQ
Asian Paints 4,389.9 2.9 0.0 757.4 -5.5 -13.4 486.2 -18.1 -14.9
Astral Poly Technik 596.8 14.8 25.1 80.6 5.6 3.4 38.2 -2.5 1.5
Bajaj Electricals 1,107.7 18.4 -2.8 62.2 44.8 -22.1 25.9 36.5 -36.1
Essel Propack 700.1 9.4 10.2 124.1 -6.2 11.3 47.9 -9.5 14.1
Havells 1,953.1 9.9 -24.8 263.7 2.6 -15.5 175.7 2.7 -16.5
Kansai Nerolac 1,134.2 -2.6 -18.1 195.5 -11.7 -14.8 127.8 -11.6 -14.1
Pidilite Industries 1,687.4 10.3 -8.0 382.9 1.8 0.3 257.7 1.9 7.0
Supreme Industries 1,242.4 17.8 -7.7 175.3 21.8 -5.6 87.8 24.0 -35.5
Symphony 179.7 -2.5 NM 59.1 -8.0 NM 33.9 -33.0 NM
V-Guard Industries 585.0 4.5 -7.9 64.4 -3.9 38.6 44.2 -5.0 28.5
Voltas Ltd 1,112.1 7.3 -48.2 84.7 -1.2 -65.2 81.8 -14.2 -56.3
Time Technoplast 813.5 12.2 4.1 111.4 1.9 -7.4 40.0 -4.8 -7.5
Total 15,501.9 7.7 -11.1 2,361.2 -0.7 -11.4 1,447.2 -8.3 -14.7
Change (%) Change (%) Change (%)
Source: Company, ICICI direct Research
Topline & Profitability (Coverage universe) 14393
15332
17769
17447
15502
0
2000
4000
6000
8000
10000
12000
14000
16000
Q2FY18
Q3FY18
Q4FY18
Q1FY19
Q2FY19E
| C
rore
4.0
6.0
8.0
10.0
12.0
14.0
16.0
18.0
(%
)
Revenue EBITDA Margin PAT Margin
EBITDA margin (%) movement
EBITDA margin Q2FY18 Q3FY18 Q4FY18 Q1FY19 Q2FY19
Asian Paints 18.8 20.9 18.7 19.9 17.3
Kansai Nerolac 19.0 16.8 15.3 16.6 17.2
Pidilite Ind 24.6 24.0 18.4 20.8 22.7
Essel Propack 20.7 19.2 18.5 17.6 17.7
Havells 14.5 13.3 14.1 12.0 13.5
Bajaj Ele 4.6 6.1 8.4 7.0 5.6
V-Guard 12.0 9.4 5.7 7.3 11.0
Voltas 8.3 8.6 12.4 11.3 7.6
Supreme Ind 13.6 15.5 19.5 13.8 14.1
Astral Poly 14.7 13.9 18.2 16.3 13.5
Symphony 34.8 39.9 31.9 1.3 32.9
Time Techno 15.1 15.4 15.5 15.4 13.7
Titanium dioxide (|/kg) price trend
0
50
100
150
200
250
300
350
Jan-16
Apr-16
Jul-16
Oct-16
Jan-17
Apr-17
Jul-17
Oct-17
Jan-18
Apr-18
Jul-18
(|
/kg)
58
60
62
64
66
68
70
72
74
(|
vs $
)
TiO2 Price | movement
Research Analyst
Sanjay Manyal
Hitesh Taunk

ICICI Securities Ltd. | Retail Equity ResearchPage 28
Exhibit 9: Company specific view for Q2FY19E
Asian Paints With volume growth of ~8% YoY, Asian Paints is likely to record muted
sales growth of ~3% YoY to~| 4390 crore in Q2FY19. We believe a
decline in realisation of ~5% YoY would be largely on account of GST rate
cut. We believe higher raw material cost coupled with depreciation in
rupee would keep gross margin under check. As a result, the EBITDA
margin is likely to decline 150 bps YoY to ~17%. As a result, adjusted
PAT would decline ~8% YoY to | 486 crore
Astral Poly Technik Astral Poly is likely to record net sales growth of ~15% YoY to | 597
crore. On the segment front, piping segment revenue growth of ~15%
YoY to | 441 crore would largely be driven by same amount of volume
growth due to starting of a new production facility in Rajasthan. Revenue
growth of the adhesive division may increase ~15% YoY to ~| 147 crore
led by addition of new capacity. We believe EBITDA margins will decline
~120 bps YoY to 13.5% mainly due to higher other expenditure led by
various branding activities for the adhesive business. Finally, PAT is likely
to decline ~3% YoY to ~| 38 crore led by higher depreciation and
interest outgo
Bajaj Electricals BEL is likely to record sales growth of ~18% YoY to ~| 1108 crore in
Q2FY19E, led by both consumer durable and E&P segment. We believe
CD sales will grow ~19% YoY to | 613 crore on the back of lower base
(on account of GST related de-stocking) and steady growth in coverage of
dealers (through Range Reach Expansion Program). We believe the E&P
business will grow ~17% YoY to | 494 crore owing to strong order book.
The EBITDA margin may increase ~102 bps YoY to 5.6%, mainly due to a
recovery in profitability from the CD segment. PAT may grow ~37% YoY
~| 26 crore on a slight recovery in sales and EBITDA margin
Essel Propack EPL's revenue is likely to grow ~9% YoY to | 700 crore in Q2FY19E. We
believe stabilisation of plants coupled with a recovery in demand in
America and EAP regions would drive sales growth by ~15% each to ~|
183 crore and ~| 148 crore, respectively. We believe sales growth in
these regions was partly offset by flattish sales in AMESA regions, which
would be impacted by a change in packaging norms in the pharma
category. Higher raw material cost coupled with lower operating leverage
would translate into an EBITDA margin decline of ~300 bps YoY to ~18%
YoY. As a result, PAT is likely to decline ~10% YoY to ~| 48 crore
Havells India Consolidated sales is expected to grow ~10% YoY to | 1953 crore
supported by growth in switchgear, cable & ECD segment by 14%, ~10%
& 9% ~| 377 crore, | 624 crore and ~| 646 crore, respectively. Under
ECD segment, the Lloyd business (led by AC segment) may see muted
growth of ~3% YoY on a comparable base due to lean season. We
believe lower operating leverage coupled with higher raw material cost
would weigh on overall EBITDA margin that is likely to fall ~100 bps YoY
to 13.5%. As a result, PAT growth may remain flat at 3% YoY to ~| 176
crore
Kansai Nerolac We expect Kansai a sales decline of ~3% YoY at ~| 1134 crore in
Q2FY19E led by ~6% YoY decline realisation (due to GST rate cut).
Largely on a high base, the volume growth at ~3% YoY would be driven
by the decorative segment whereas industrial segment volume growth
would remain under pressure on account of lower passenger vehicle
production of its main client. Higher raw material cost coupled with rupee
depreciation would weigh on gross margin. As a result, the EBITDA
margin may decline ~180 bps YoY to ~17% in Q2FY19E. As a result, PAT
may decline ~12% YoY to | 128 crore
Source: Company, ICICI Direct Research
Volume growth movement of paint companies
0.0
5.0
10.0
15.0
20.0
Q3FY16
Q1FY17
Q3FY17E
Q1FY18E
Q3FY18E
Q1FY19E
Asian Paints Kansai Nerolac
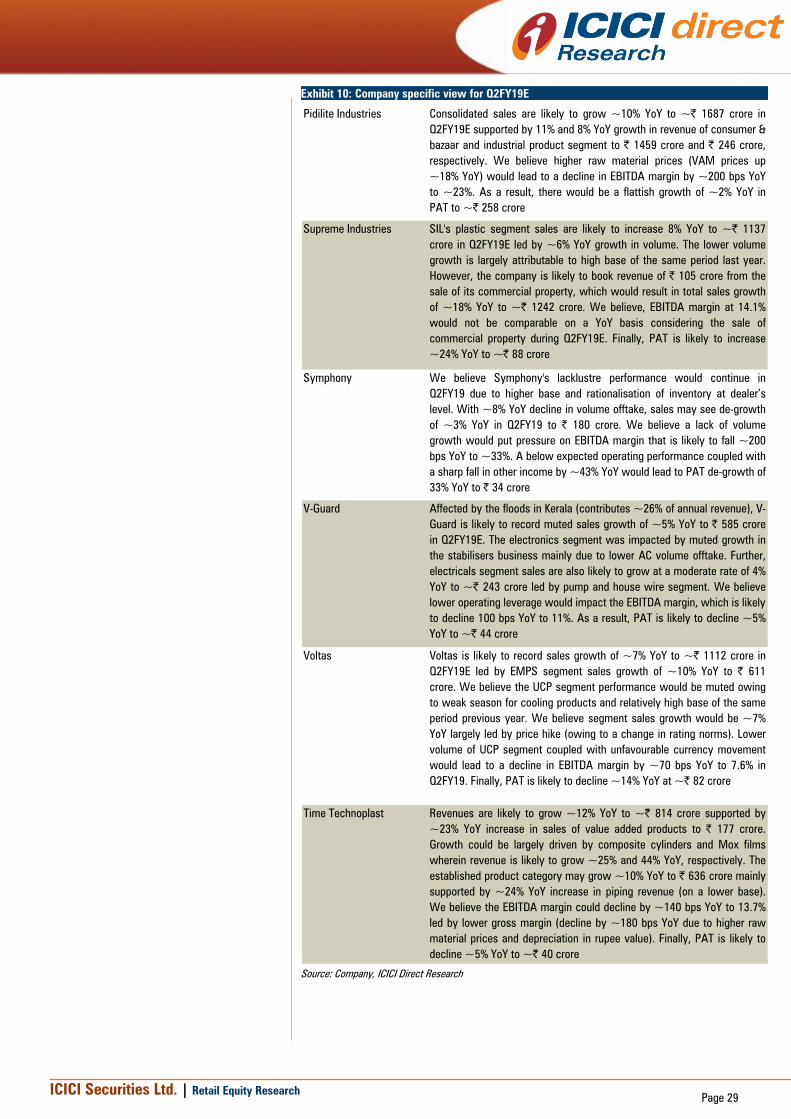
ICICI Securities Ltd. | Retail Equity ResearchPage 29
Exhibit 10: Company specific view for Q2FY19E
Pidilite Industries Consolidated sales are likely to grow ~10% YoY to ~| 1687 crore in
Q2FY19E supported by 11% and 8% YoY growth in revenue of consumer &
bazaar and industrial product segment to | 1459 crore and | 246 crore,
respectively. We believe higher raw material prices (VAM prices up
~18% YoY) would lead to a decline in EBITDA margin by ~200 bps YoY
to ~23%. As a result, there would be a flattish growth of ~2% YoY in
PAT to ~| 258 crore
Supreme Industries SIL's plastic segment sales are likely to increase 8% YoY to ~| 1137
crore in Q2FY19E led by ~6% YoY growth in volume. The lower volume
growth is largely attributable to high base of the same period last year.
However, the company is likely to book revenue of | 105 crore from the
sale of its commercial property, which would result in total sales growth
of ~18% YoY to ~| 1242 crore. We believe, EBITDA margin at 14.1%
would not be comparable on a YoY basis considering the sale of
commercial property during Q2FY19E. Finally, PAT is likely to increase
~24% YoY to ~| 88 crore
Symphony We believe Symphony's lacklustre performance would continue in
Q2FY19 due to higher base and rationalisation of inventory at dealer’s
level. With ~8% YoY decline in volume offtake, sales may see de-growth
of ~3% YoY in Q2FY19 to | 180 crore. We believe a lack of volume
growth would put pressure on EBITDA margin that is likely to fall ~200
bps YoY to ~33%. A below expected operating performance coupled with
a sharp fall in other income by ~43% YoY would lead to PAT de-growth of
33% YoY to | 34 crore
V-Guard Affected by the floods in Kerala (contributes ~26% of annual revenue), V-
Guard is likely to record muted sales growth of ~5% YoY to | 585 crore
in Q2FY19E. The electronics segment was impacted by muted growth in
the stabilisers business mainly due to lower AC volume offtake. Further,
electricals segment sales are also likely to grow at a moderate rate of 4%
YoY to ~| 243 crore led by pump and house wire segment. We believe
lower operating leverage would impact the EBITDA margin, which is likely
to decline 100 bps YoY to 11%. As a result, PAT is likely to decline ~5%
YoY to ~| 44 crore
Voltas Voltas is likely to record sales growth of ~7% YoY to ~| 1112 crore in
Q2FY19E led by EMPS segment sales growth of ~10% YoY to | 611
crore. We believe the UCP segment performance would be muted owing
to weak season for cooling products and relatively high base of the same
period previous year. We believe segment sales growth would be ~7%
YoY largely led by price hike (owing to a change in rating norms). Lower
volume of UCP segment coupled with unfavourable currency movement
would lead to a decline in EBITDA margin by ~70 bps YoY to 7.6% in
Q2FY19. Finally, PAT is likely to decline ~14% YoY at ~| 82 crore
Time Technoplast Revenues are likely to grow ~12% YoY to ~| 814 crore supported by
~23% YoY increase in sales of value added products to | 177 crore.
Growth could be largely driven by composite cylinders and Mox films
wherein revenue is likely to grow ~25% and 44% YoY, respectively. The
established product category may grow ~10% YoY to | 636 crore mainly
supported by ~24% YoY increase in piping revenue (on a lower base).
We believe the EBITDA margin could decline by ~140 bps YoY to 13.7%
led by lower gross margin (decline by ~180 bps YoY due to higher raw
material prices and depreciation in rupee value). Finally, PAT is likely to
decline ~5% YoY to ~| 40 crore
Source: Company, ICICI Direct Research
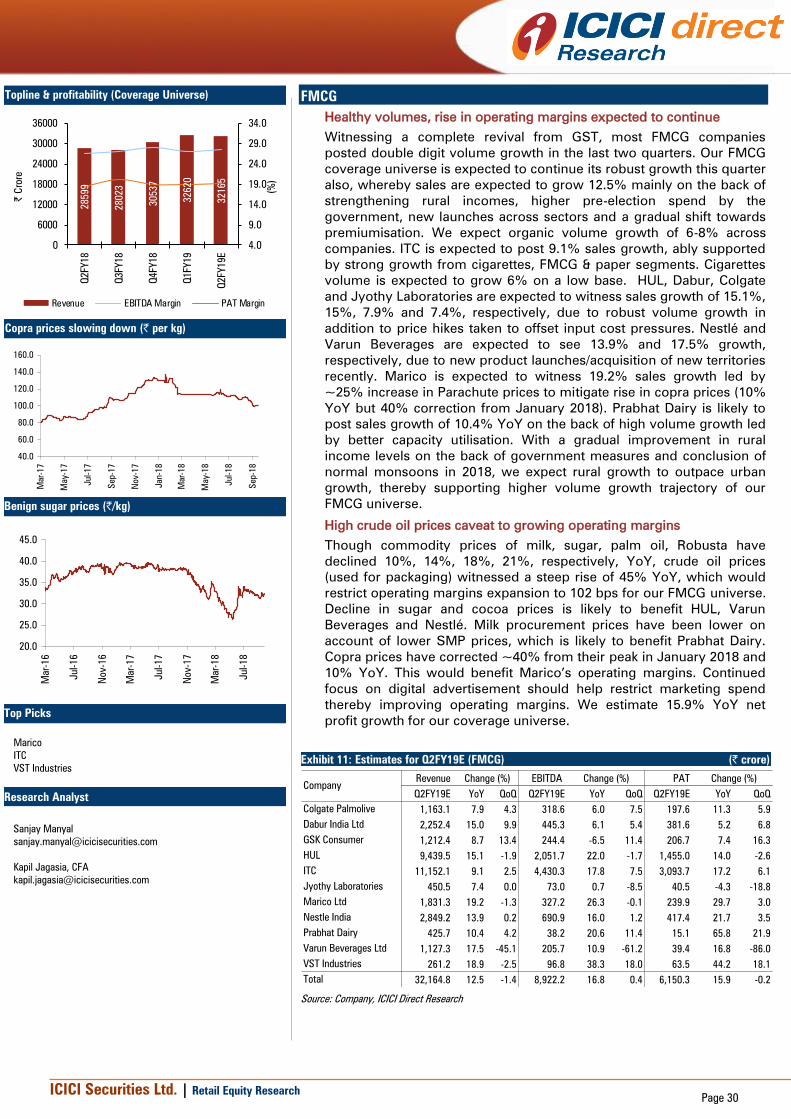
ICICI Securities Ltd. | Retail Equity ResearchPage 30
FMCG
Healthy volumes, rise in operating margins expected to continue
Witnessing a complete revival from GST, most FMCG companies
posted double digit volume growth in the last two quarters. Our FMCG
coverage universe is expected to continue its robust growth this quarter
also, whereby sales are expected to grow 12.5% mainly on the back of
strengthening rural incomes, higher pre-election spend by the
government, new launches across sectors and a gradual shift towards
premiumisation. We expect organic volume growth of 6-8% across
companies. ITC is expected to post 9.1% sales growth, ably supported
by strong growth from cigarettes, FMCG & paper segments. Cigarettes
volume is expected to grow 6% on a low base. HUL, Dabur, Colgate
and Jyothy Laboratories are expected to witness sales growth of 15.1%,
15%, 7.9% and 7.4%, respectively, due to robust volume growth in
addition to price hikes taken to offset input cost pressures. Nestlé and
Varun Beverages are expected to see 13.9% and 17.5% growth,
respectively, due to new product launches/acquisition of new territories
recently. Marico is expected to witness 19.2% sales growth led by
~25% increase in Parachute prices to mitigate rise in copra prices (10%
YoY but 40% correction from January 2018). Prabhat Dairy is likely to
post sales growth of 10.4% YoY on the back of high volume growth led
by better capacity utilisation. With a gradual improvement in rural
income levels on the back of government measures and conclusion of
normal monsoons in 2018, we expect rural growth to outpace urban
growth, thereby supporting higher volume growth trajectory of our
FMCG universe.
High crude oil prices caveat to growing operating margins
Though commodity prices of milk, sugar, palm oil, Robusta have
declined 10%, 14%, 18%, 21%, respectively, YoY, crude oil prices
(used for packaging) witnessed a steep rise of 45% YoY, which would
restrict operating margins expansion to 102 bps for our FMCG universe.
Decline in sugar and cocoa prices is likely to benefit HUL, Varun
Beverages and Nestlé. Milk procurement prices have been lower on
account of lower SMP prices, which is likely to benefit Prabhat Dairy.
Copra prices have corrected ~40% from their peak in January 2018 and
10% YoY. This would benefit Marico’s operating margins. Continued
focus on digital advertisement should help restrict marketing spend
thereby improving operating margins. We estimate 15.9% YoY net
profit growth for our coverage universe.
Exhibit 11: Estimates for Q2FY19E (FMCG) (| crore)
Revenue EBITDA PAT
Q2FY19E YoY QoQ Q2FY19E YoY QoQ Q2FY19E YoY QoQ
Colgate Palmolive 1,163.1 7.9 4.3 318.6 6.0 7.5 197.6 11.3 5.9
Dabur India Ltd 2,252.4 15.0 9.9 445.3 6.1 5.4 381.6 5.2 6.8
GSK Consumer 1,212.4 8.7 13.4 244.4 -6.5 11.4 206.7 7.4 16.3
HUL 9,439.5 15.1 -1.9 2,051.7 22.0 -1.7 1,455.0 14.0 -2.6
ITC 11,152.1 9.1 2.5 4,430.3 17.8 7.5 3,093.7 17.2 6.1
Jyothy Laboratories 450.5 7.4 0.0 73.0 0.7 -8.5 40.5 -4.3 -18.8
Marico Ltd 1,831.3 19.2 -1.3 327.2 26.3 -0.1 239.9 29.7 3.0
Nestle India 2,849.2 13.9 0.2 690.9 16.0 1.2 417.4 21.7 3.5
Prabhat Dairy 425.7 10.4 4.2 38.2 20.6 11.4 15.1 65.8 21.9
Varun Beverages Ltd 1,127.3 17.5 -45.1 205.7 10.9 -61.2 39.4 16.8 -86.0
VST Industries 261.2 18.9 -2.5 96.8 38.3 18.0 63.5 44.2 18.1
Total 32,164.8 12.5 -1.4 8,922.2 16.8 0.4 6,150.3 15.9 -0.2
Change (%) Change (%)
Company
Change (%)
Source: Company, ICICI Direct Research
Topline & profitability (Coverage Universe)
28599
28023
30537
32620
32165
4.0
9.0
14.0
19.0
24.0
29.0
34.0
0
6000
12000
18000
24000
30000
36000
Q2FY18
Q3FY18
Q4FY18
Q1FY19
Q2FY19E
(%
)
| C
rore
Revenue EBITDA Margin PAT Margin
Copra prices slowing down (| per kg)
40.0
60.0
80.0
100.0
120.0
140.0
160.0
Mar-17
May-17
Jul-1
7
Sep-17
Nov-17
Jan-1
8
Mar-18
May-18
Jul-1
8
Sep-18
Benign sugar prices (|/kg)
20.0
25.0
30.0
35.0
40.0
45.0
Mar-16
Jul-16
Nov-16
Mar-17
Jul-17
Nov-17
Mar-18
Jul-18
Top Picks
Marico
ITC
VST Industries
Research Analyst
Sanjay Manyal
Kapil Jagasia, CFA

ICICI Securities Ltd. | Retail Equity ResearchPage 31
Exhibit 12: Company specific view (FMCG)
Colgate We expect 7.2% YoY sales growth on the back of ~4% volume growth in addition to
the price hike taken by the company recently. The company has started witnessing
input cost inflation due to a rise in crude oil and sorbitol prices, which we expect
would result in marginal contraction in operating margin by 32 bps to 27.4% YoY. CPIL
has already taken a price hike of 5% in Colgate Dental Cream (CDC) in July 2018 to
mitigate this impact. Net profit is likely to grow 11.3% YoY to |197.6 crore
Dabur The company is expected to post 15% YoY sales growth on the back of 16.7% growth
in domestic operations with volumes growing ~9%. We expect this growth to be
contributed by strong demand from rural regions. However, international operations
may see slower growth of 10.6% due to currency depreciation in emerging markets.
Along with an increase in commodity price inflation, the company's higher advertising
spend should result in EBITDA margin contraction by 166 bps to 19.8%. PAT is
estimated to increase marginally by 5.2% to | 381.6 crore
GSK
Consumer
Healthcare
GSK Consumer is expected to post sales growth of 8.7% YoY benefitting from price
cuts taken by the company as GST rates were cut from 28% to 18% on malt based
beverages in November 2017. We expect a 320 bps contraction in operating margins
to 20.2%. This is mainly due to an increase in commodity prices such as barley and
wheat on a YoY basis in addition to increase in operating costs i.e. higher employee
cost & advertisement spend. Net profit is likely to grow 7.4% to | 206.7 crore
HUL The company is likely to witness 13.6% sales growth mainly led by volume growth of 7-
8% on account of supply chain benefits under GST regime in addition to price hikes of
~5% taken during the quarter. The company should be able to report 149 bps
expansion in operating margins to 21.7% in spite of higher raw material &
advertisement costs, benefiting from a focus on premiumisation, cost cutting and
market share gains. We expect net profit to grow 16.5% to | 1494.6 crore
ITC We expect ITC to post 8.1% sales growth during the quarter mainly due to robust
growth from cigarettes, FMCG & paper segment. The cigarettes segment is likely to
witness ~6% volume growth on a low base (6% volume de-growth in Q2FY18). FMCG
segment is likely to post 16% growth in sales on the back of new launches during the
quarter. The paper business is likely to post 10% growth in sales. With improving
margins in the FMCG business and higher realisations in the cigarette business, net
profit is likely to grow 17.2% to | 3093.7 crore
Jyothy Labs Jyothy Labs is expected to post tepid sales growth of 7.4% impacted by floods in the
Kerala region, which contributes around 25-30% of the company's sales. Though
Jyothy Labs has taken an average price hike of 5% across product portfolio to mitigate
rising input cost pressure, we expect its operating margins to contract 109 bps to
16.2% due to higher material costs and advertising spend. We expect net profit to
decline marginally by 4.3% to | 40.5 crore
Marico The company is likely to witness 19.2% sales growth, primarily led by strong growth in
the domestic business on account of ~25% increase in Parachute prices. The price
increase has been on account of ~15% YoY increase in copra prices. The international
business is expected to increase 10.5% during the quarter. On account of a steep price
hike taken in the Parachute portfolio, we expect operating margins to expand 100 bps.
Net profit is expected to increase 29.7% to | 239.9 crore
Source: Company, ICICI Direct Research
Crude oil prices spikes ($/barrel)
0
15
30
45
60
75
90
Nov-15
Mar-16
Jul-16
Nov-16
Mar-17
Jul-17
Nov-17
Mar-18
Jul-18

ICICI Securities Ltd. | Retail Equity ResearchPage 32
Exhibit 13: Company specific view (FMCG)
Nestlé India We expect Nestlé India to grow 13.9% YoY to | 2,849.2 crore on the back of a foray
into new segments and a slew of new launches. New launches and venture into high
growth segments should help drive volume growth for the quarter. Its operating
margins are likely to improve 55 bps to 24.2% as its major raw materials i.e. milk,
coffee and sugar prices are in a downward trajectory. We expect net profit to grow
21.7% to | 417.4 crore during the quarter
Prabhat
Dairy
Revenue is expected to grow 10.4% to |425.7 crore driven by increasing capacity
utilisation of the cheese facility, which should perk up higher volumes for the company
during the quarter. Milk procurement prices have been down ~10% YoY to | 22. We
expect operating margins of the company to improve 76 bps YoY to 9%. Net profit
during the quarter is expected to grow to | 15.1 crore
Varun
Beverages
VBL is expected to witness 17% sales growth to | 1127.3 crore on the back of
acquisition of new territories over the last year and inclusion of Tropicana juices in the
company's portfolio. However, Tropicana juices segment are not margin accretive
currently. This may result in operating margins contraction of 100 bps to 18.2%. The
company is expected to report net profit growth of 16.7% to | 39.4 crore
VST
Industries
The company is expected to post 18.8% sales growth during the quarter primarily led
by ~6% volume growth in addition to a shift in the revenue mix towards high priced
cigarettes ('Total' at | 6/stick and 'Edition' at | 10/stick). We expect 50% contribution
from 64 mm cigarettes with the remaining 50% volume contribution from 69 mm or
above category. Operating margins are expected to surge 523 bps to 37.1% on the
back of robust topline growth. We expect net profit to grow 44.2% to | 63.5 crore
Source: Company, ICICI Direct Research

ICICI Securities Ltd. | Retail Equity ResearchPage 33
Healthcare
Currency tailwinds but base effect, cost pressure to the fore
After a strong showing in Q1FY19 due to base effect and currency tailwinds,
we expect some consolidation in Q2 financials due to 1) higher base and 2)
cost pressure, which can be attributable to supply constraints from China
and higher crude prices. These two factors are likely to dilute strong
currency tailwinds in Q2. I-direct healthcare universe is expected to register
9.7% YoY growth to | 42494 crore. Domestic formulations are likely to
grow 5.6% YoY (select pack) due to higher base of sales, which were
accounted in Q2FY18 post GST implementation. US revenues (select pack)
are expected to grow 8% YoY mainly due to currency tailwinds and volume
gain in the base business that is likely to mitigate continued base business
price erosion. In Q2FY19, average YoY rupee depreciation vis-à-vis US$
was 9%. Europe (select pack) is likely to grow 11% YoY on the back of
currency tailwinds, new launches and acquisition. Growth in other
emerging markets is likely to be driven by new launches. On the hospitals
front, growth is likely to be driven by newly commissioned hospitals.
On the companies front, Torrent, Narayana and Jubilant Life are likely to
register strong sales growth on the back of acquisitions while Natco –
(windfall of gCopaxone), Biocon (Syngene and biologics tractions) and
Syngene (lower base) are expected to register above 20% revenue growth.
On the other hand, Ajanta Pharma, Cadila, Cipla and Indoco are likely to
report negative revenue growth mainly due to high base.
EBITDA to increase ~4% YoY
EBITDA of the I-direct healthcare universe is expected to grow a mere 4%
YoY to | 8573 crore. EBITDA margins are likely to contract 106 bps YoY to
20%. Higher raw material cost due to supply constraint from China, higher
promotional cost of innovative products and hedging losses are likely to put
pressure on overall margins during the quarter.
Adjusted net profit to decline 4% YoY
Net profit is expected to decline ~4% YoY to | 4627 crore, mainly due to
lower operational performance, higher cost of consolidating of acquisitions
and higher tax rate (23.9% vs. 22.5% in Q2FY18).
Exhibit 14: Estimates for Q2FY19E (| Crore)
Revenue EBITDA PAT
Q2FY19E YoY QoQ Q2FY19E YoY QoQ Q2FY19E YoY QoQ
Ajanta Pharma 516.6 -4.4 1.1 154.2 -16.1 -2.1 110.1 -16.5 4.1
Alembic Pharma 952.3 20.7 10.4 171.4 -4.3 13.5 116.1 -4.5 28.4
Aurobindo Pharma 4,638.9 4.6 9.1 964.3 -13.7 35.6 601.9 -23.0 32.1
Biocon 1,245.4 28.6 10.8 275.5 51.2 15.8 141.6 105.9 18.2
Cadila Healthcare 2,986.6 -7.6 3.2 611.3 -28.7 -5.2 375.4 -25.4 -18.6
Divi's Lab 1,012.4 13.7 1.7 364.5 31.5 3.6 275.1 33.0 3.4
Cipla 4,042.4 -1.0 2.6 771.0 -4.1 6.1 368.9 -12.7 -16.1
Dr. Reddys 3,857.7 8.4 3.2 730.0 9.1 -5.0 361.1 18.2 -24.2
Glenmark 2,540.0 12.6 17.3 431.8 11.2 24.5 217.8 1.7 -6.5
Indoco Remedies 262.9 -7.7 20.9 38.1 -6.8 229.5 11.4 -42.5 LP
IPCA Labs 950.5 10.0 11.3 147.3 -1.1 29.2 89.4 -7.3 36.4
Jubilant Life Sc. 2,090.3 27.3 0.6 447.1 46.1 2.2 212.4 65.6 6.0
Lupin 4,032.1 2.0 4.6 616.4 -27.7 17.0 222.2 -51.2 9.6
Narayana Hrudayalaya 696.8 24.6 6.8 51.8 -13.7 9.3 5.4 -70.2 LP
Natco Pharma 560.1 31.3 4.0 248.9 104.2 14.4 185.0 118.2 1.9
Sunpharma 7,698.1 15.8 6.6 1,655.1 20.3 3.0 964.8 5.8 -2.4
Syngene International 418.2 24.8 3.0 142.2 25.3 30.2 93.9 22.1 42.2
Torrent Pharma 1,900.4 33.0 1.5 499.8 51.9 4.8 177.0 -13.2 8.6
Apollo Hospitals 2,092.4 13.0 9.5 252.0 13.9 11.2 97.4 37.4 61.9
Total 42,494.1 9.7 6.0 8,572.7 4.2 8.9 4,627.1 -4.1 1.5
Change (%) Change (%) Change (%)
Company
Source: Company, ICICI Direct Research
Topline & Profitability (Coverage universe)
38752
39781
40196
40087
42494
0
5000
10000
15000
20000
25000
30000
35000
40000
Q2FY18
Q3FY18
Q4FY18
Q1FY19
Q2FY19E
| C
rore
0.0
5.0
10.0
15.0
20.0
25.0
(%
)
Revenue EBITDA Margin PAT Margin
USFDA approvals for Jun-Sep 2018 (Coverage Universe)
Company Final Tentative
Ajanta Pharma 3 2
Aurobindo Pharma 12 2
Cadila Healthcare 14 3
Cipla 9 0
Dr. Reddy's Labs 2 1
Glenmark Pharma 2 0
Jubilant Life 0 0
Lupin 4 2
Natco 0 0
Sun Pharma 2 0
Source: USFDA, ICICI Direct Research
Currency Movement
90
100
110
120
130
Sep-16
Nov-16
Jan-17
Mar-17
May-17
Jul-17
Sep-17
Nov-17
Jan-18
Mar-18
May-18
Jul-18
Sep-18
USDINR EUROINR
Top picks of sector
Divi’s Lab
Syngene International
Research Analyst
Siddhant Khandekar
Mitesh Shah

ICICI Securities Ltd. | Retail Equity ResearchPage 34
Ajanta Pharma Revenues are expected to decline 4.4% YoY to | 517 crore mainly due to high
base of domestic formulations and shrinking African tender opportunity. EBITDA
margins are expected to decline 415 bps to 29.8% YoY on account of higher fixed
overheads at new facilities. Net profit is likely to decline 16.5% YoY to | 110 crore
mainly due to a below expected operational performance
Alembic Pharma Revenues are expected to grow 21% YoY to | 952 crore mainly due to 40% growth
in international formulations led by strong growth in ex-US export business.
EBITDA margins are expected to contract 470 bps to 18% on account of an
adverse product mix. Net profit is expected to decline 4.5% YoY to | 116 crore
mainly due to lower expected EBITDA
Apollo Hospitals Standalone sales are likely to grow ~13% YoY to | 2092 crore mainly due to
~19% growth in the pharmacy business and 9% growth in the healthcare service
business. The pharmacy business is expected to be largely driven by addition of
new pharmacies while the hospital segment is expected to be driven by strong
growth in new hospitals. EBITDA margins are likely to remain at ~12%. Net profit
is expected to increase 37% YoY to | 97 crore mainly due to a strong operational
performance and lower tax rate (21% vs. 28% in Q2FY18)
Aurobindo
Pharma
Revenues are expected to grow ~5% YoY to | 4639 crore mainly due to currency
tailwinds. The US business is expected to grow a mere 3% YoY on a higher base.
EBITDA margins are likely to decline 440 bps to 20.8% due to a higher base and
higher raw material cost owing to China supply constraints. Net profit may decline
23% YoY to | 602 crore due to a below expected operational performance and
higher tax rate (25% vs. 20.2% in Q2FY18)
Biocon Revenues are likely to grow ~29% YoY to | 1245 crore on the back of strong
growth expectation in Syngene (due to currency tailwinds, lower base) and
biologics segment. EBITDA margins may improve 330 bps to ~22%. Net profit is
expected to grow 106% YoY to | 142 crore mainly due to a strong operational
performance and lower tax rate (22% vs. 33.8% in Q2FY18)
Cadila
Healthcare
Revenues are expected to decline ~8% YoY to | 2987 crore mainly due to high
base in the US and India. EBITDA margins are likely to contract ~600 bps YoY to
20.5% mainly due to high base of gLialda exclusivity in the US. Subsequently, net
profit is expected to decline ~25% YoY to | 375 crore
Cipla Revenues are expected to decline ~1% YoY to | 4042 crore. The 5% YoY decline
in domestic formulations on a higher base, are likely to be offset by ~20% growth
in the US. EBITDA margins are expected decline 63 bps YoY to 19.1%. Net profit is
expected to decline ~13% YoY | 369 crore due to a below expected operational
performance, lower other income and higher tax rate
Divi's
Laboratories
Revenues are expected to grow ~14% YoY to | 1012 crore due to lower base,
currency tailwinds and favourable market scenarios owing to China supply
constraints. EBITDA margins are expected to increase 486 bps to ~36% YoY due
to a better product mix and favourable currency movement. Net profit is expected
to grow 33% YoY to | 275 crore mainly due to a strong operational performance
Dr Reddy's Revenues are likely to grow ~8% YoY to | 3858 crore mainly due to ~10%
growth in each India and the US formulations. EBITDA margins are expected to
remain at ~19%. Net profit is expected to grow ~18% YoY to | 361 crore mainly
due to a strong operational performance
Source: Company, ICICI Direct Research
Exhibit 15: Company specific view Expected growth (%) in Domestic formulations
(| crore) Q2FY19E Q2FY18 Var. (%) Q1FY19 Var. (%)
Ajanta 172.9 172.0 0.6 172.0 0.6
Alembic 363.8 346.5 5.0 294.1 23.7
Biocon 158.3 175.9 -10.0 147.0 7.7
Cadila 921.3 894.5 3.0 892.6 3.2
Glenmark 810.2 710.7 14.0 663.3 22.1
Indoco 169.4 188.2 -10.0 149.7 13.2
Ipca 446.0 424.7 5.0 400.9 11.2
Lupin 1,228.9 1,159.3 6.0 1,192.4 3.1
Cipla 1,563.7 1,646.0 -5.0 1,544.0 1.3
Dr Reddy's 700.7 637.0 10.0 607.4 15.4
Sun Pharma 2,332.1 2,221.0 5.0 2,152.0 8.4
Torrent 829.3 607.0 36.6 830.0 -0.1
Total 9,696.5 9,182.8 5.6 9,045.4 7.2
Expected growth (%) in the US
(| crore) Q2FY19E Q2FY18 Var. (%) Q1FY19 Var. (%)
Aurobindo 2,152.5 2,098.9 2.6 1,889.6 13.9
Cadila 1,310.8 1,643.6 -20.3 1,229.6 6.6
Cipla 739.2 617.3 19.8 670.0 10.3
Glenmark 773.6 727.1 6.4 703.7 9.9
Lupin 1,244.8 1,361.1 -8.5 1,185.8 5.0
Dr Reddy's 1,565.6 1,431.8 9.3 1,590.3 -1.6
Sun Pharma 2,773.0 1,986.2 39.6 2,543.7 9.0
Torrent 338.7 255.0 32.8 334.0 1.4
Total 10,898.1 10,121.0 7.7 10,146.7 7.4
Expected growth (%) in Europe
(| crore) Q2FY19E Q2FY18 Var. (%) Q1FY19 Var. (%)
Aurobindo 1238.2 1113.5 11.2 1199.1 3.3
Cadila 65.3 54.4 20.0 61.8 5.6
Glenmark 240.0 200.0 20.0 219.8 9.2
Dr Reddy's 218.2 242.4 -10.0 201.6 8.2
Lupin 172.8 144.0 20.0 213.0 -18.9
Torrent 256.4 221.0 16.0 251.0 2.1
Total 2190.8 1975.3 10.9 2146.3 2.1
Expected growth (%) in Latin America
(| crore) Q2FY19E Q2FY18 Var. (%) Q1FY19 Var. (%)
Glenmark 110.0 104.7 5.0 97.6 12.7
Torrent 160.8 120.0 34.0 169.0 -4.9
Total 270.8 224.7 20.5 266.6 1.6
Latin America

ICICI Securities Ltd. | Retail Equity ResearchPage 35
Exhibit 16: Company specific view
Glenmark
Pharma
Revenues are expected to grow 12.6% YoY to | 2540 crore mainly due to 14%
growth in domestic formulations. US revenues are expected to grow 6% YoY.
EBITDA margins are likely to remain at ~17%. Net profit is expected to grow mere
~2% YoY to | 214 crore due to higher tax rate (27% vs. 21.6% in Q2FY18)
Indoco
Remedies
Revenues are likely to decline ~8% YoY to | 263 crore mainly due to 10% YoY
decline in domestic sales on a higher base. EBITDA margins are likely to remain at
~14.5%. Net profit is expected to decline 42.5% YoY to | 11.4 crore mainly due to
a below expected operational performance and higher tax rate (21% vs -3.5% in
Q2FY18)
Ipca
Laboratories
Revenues are expected to grow 10% YoY to | 950 crore mainly due to 20% growth
in export formulations. Domestic formulations are likely to grow 5% YoY. EBITDA
margins are likely to decline 174 bps to 15.5% mainly due to an adverse product
mix. Net profit is expected to decline ~7% YoY to | 89 crore due to a below
expected operational performance and higher tax rate (21% vs. 12% in Q2FY18)
Jubilant Life
Science
Revenues are expected grow ~27% YoY to | 2090 crore mainly due to
consolidation of Triad Pharmacy. Margins are expected to improve 275 bps to
21.4% YoY mainly due to a better segment mix. Net profit is expected to grow
~66% YoY to | 212 crore due to a strong operational performance
Lupin Revenues are expected to grow a mere ~2% YoY to | 4032 crore on the back of
domestic formulations, which are likely to grow 6%. US sales are likely to decline
8.5% YoY due to lack of meaningful launches. EBITDA margins are likely to decline
630 bps to 15.3% mainly due to an adverse product mix and higher sales
promotional expenses. Net profit is expected to decline 51% YoY to | 222 crore
owing to a below expected operational performance and lower other income
Narayana
Hrudalaya
Revenues are likely to grow ~25% YoY to | 696 crore mainly due to strong growth
in new hospitals and acquisition of remaining stake in Cayman Islands hospital.
EBITDA margins are likely to decline 330 bps to 7.4% YoY mainly due to an
increase in doctor payouts and expenses related to new facilities. Net profit is
expected to decline ~70% YoY to | 5.4 crore mainly due to a below expected
operational performance, higher interest cost and depreciation
Natco Pharma Revenues are expected to grow 31% YoY to | 560 crore mainly due to complex
products launches in the US (gCopaxone, gDoxil) under partnership. EBITDA
margins are likely to increase to 44% from 28.6% YoY mainly due to continued
gCopaxone windfall. Subsequently, net profit is expected to grow 118% YoY to |
185 crore
Sun Pharma Revenues are likely to increase ~16% YoY to | 7698 crore mainly due to ~40%
expected increase in US sales (ex-Taro) on the back of volume gains in existing
products and new launches post Halol resolution. EBITDA margins are expected to
increase 82 bps YoY to 21.5%. Net profit is expected to increase 6% YoY to | 965
crore due to a strong operational performance, which is likely to be partly offset by
higher tax rate (18% vs 10% in Q2FY18)
Syngene Revenues are likely to grow ~25% YoY to | 418 crore on the back of currency
tailwinds and lower base of the fire incident. EBITDA margins are expected to be
in the range of 32-34%. Net profit is expected to grow 22% to | 94 crore mainly
due to a strong operational performance
Torrent Pharma Revenues are expected to increase ~33% YoY to | 1900 mainly due to
consolidation of Unichem's domestic sales. Excluding Unichem consolidation,
domestic sales are expected to decline ~1% YoY due to higher base. EBITDA
margins are expected to increase 327 bps YoY to 26.3% mainly due to a better
product mix. Net profit is expected to decline ~13% YoY to | 177 crore mainly
due to additional acquisition cost of interest and amortisation
Source: Company, ICICI Direct Research
Expected growth (%) in API
e
(| crore) Q2FY19E Q2FY18 Var. (%) Q1FY19 Var. (%)
Aurobindo 787.2 771.8 2.0 748.0 5.2
Alembic 177.5 142.0 25.0 180.0 -1.4
Cadila 102.2 92.9 10.0 109.5 -6.7
Glenmark 236.6 236.6 0.0 210.1 12.6
Divi's Lab 487.3 443.0 10.0 475.3 2.5
Indoco 15.5 14.7 5.0 15.6 -1.2
Ipca Labs 213.2 193.8 10.0 217.8 -2.1
Lupin 270.3 265.0 2.0 358.1 -24.5
Cipla 201.4 212.0 -5.0 200.0 0.7
Dr Reddy's 576.7 565.4 2.0 540.9 6.6
API 68.2 58.3 17.0 67.0 1.8
Sun Pharma 434.0 413.4 5.0 416.7 4.2
Unichem 25.0 24.5 2.0 21.9 14.1
Total 3595.2 3433.5 4.7 3560.9 1.0
API
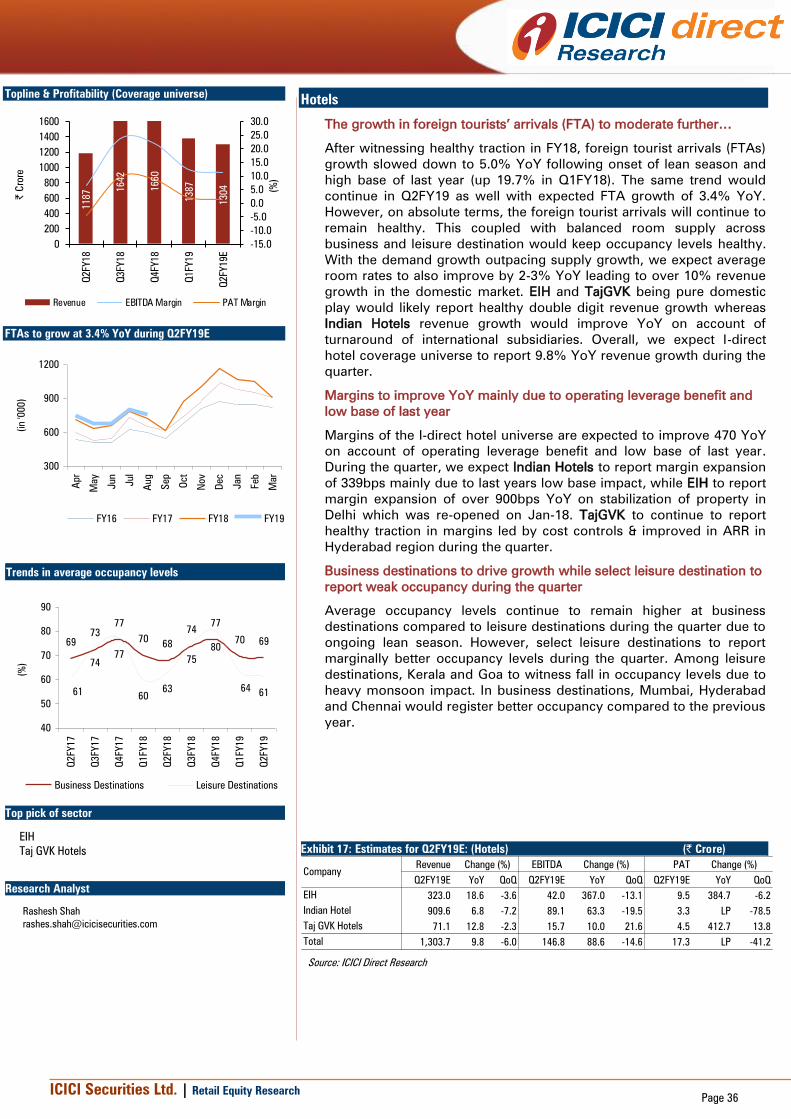
ICICI Securities Ltd. | Retail Equity ResearchPage 36
Hotels
The growth in foreign tourists’ arrivals (FTA) to moderate further…
After witnessing healthy traction in FY18, foreign tourist arrivals (FTAs)
growth slowed down to 5.0% YoY following onset of lean season and
high base of last year (up 19.7% in Q1FY18). The same trend would
continue in Q2FY19 as well with expected FTA growth of 3.4% YoY.
However, on absolute terms, the foreign tourist arrivals will continue to
remain healthy. This coupled with balanced room supply across
business and leisure destination would keep occupancy levels healthy.
With the demand growth outpacing supply growth, we expect average
room rates to also improve by 2-3% YoY leading to over 10% revenue
growth in the domestic market. EIH and TajGVK being pure domestic
play would likely report healthy double digit revenue growth whereas
Indian Hotels revenue growth would improve YoY on account of
turnaround of international subsidiaries. Overall, we expect I-direct
hotel coverage universe to report 9.8% YoY revenue growth during the
quarter.
Margins to improve YoY mainly due to operating leverage benefit and
low base of last year
Margins of the I-direct hotel universe are expected to improve 470 YoY
on account of operating leverage benefit and low base of last year.
During the quarter, we expect Indian Hotels to report margin expansion
of 339bps mainly due to last years low base impact, while EIH to report
margin expansion of over 900bps YoY on stabilization of property in
Delhi which was re-opened on Jan-18. TajGVK to continue to report
healthy traction in margins led by cost controls & improved in ARR in
Hyderabad region during the quarter.
Business destinations to drive growth while select leisure destination to
report weak occupancy during the quarter
Average occupancy levels continue to remain higher at business
destinations compared to leisure destinations during the quarter due to
ongoing lean season. However, select leisure destinations to report
marginally better occupancy levels during the quarter. Among leisure
destinations, Kerala and Goa to witness fall in occupancy levels due to
heavy monsoon impact. In business destinations, Mumbai, Hyderabad
and Chennai would register better occupancy compared to the previous
year.
Exhibit 17: Estimates for Q2FY19E: (Hotels) (| Crore)
Revenue EBITDA PAT
Q2FY19E YoY QoQ Q2FY19E YoY QoQ Q2FY19E YoY QoQ
EIH 323.0 18.6 -3.6 42.0 367.0 -13.1 9.5 384.7 -6.2
Indian Hotel 909.6 6.8 -7.2 89.1 63.3 -19.5 3.3 LP -78.5
Taj GVK Hotels 71.1 12.8 -2.3 15.7 10.0 21.6 4.5 412.7 13.8
Total 1,303.7 9.8 -6.0 146.8 88.6 -14.6 17.3 LP -41.2
Company
Change (%)Change (%) Change (%)
Source: ICICI Direct Research
Topline & Profitability (Coverage universe)
1187 1
642
1660
1387
1304
-15.0
-10.0
-5.0
0.0
5.0
10.0
15.0
20.0
25.0
30.0
0
200
400
600
800
1000
1200
1400
1600
Q2FY18
Q3FY18
Q4FY18
Q1FY19
Q2FY19E
(%
)
| C
rore
Revenue EBITDA Margin PAT Margin
FTAs to grow at 3.4% YoY during Q2FY19E
300
600
900
1200
Apr
May
Jun
Jul
Aug
Sep
Oct
Nov
Dec
Jan
Feb
Mar
(in
'000)
FY16 FY17 FY18 FY19
Trends in average occupancy levels
73
77
7068
77
69
74
60
75
61
69
74
70
61
77
63
80
64
40
50
60
70
80
90
Q2FY17
Q3FY17
Q4FY17
Q1FY18
Q2FY18
Q3FY18
Q4FY18
Q1FY19
Q2FY19
(%
)
Business Destinations Leisure Destinations
Top pick of sector
EIH
Taj GVK Hotels
Research Analyst
Rashesh Shah

ICICI Securities Ltd. | Retail Equity ResearchPage 37
Exhibit 18: Company specific view
Company Remarks
Indian Hotels On the revenue front, we expect domestic revenue growth of 9.3% YoY in line
with industry growth following improved RevPAR while international segment is
expected to witness growth of 3.9%. Margins are expected to improve mainly
due to low base of last year and a better operating matrix in the domestic
segment. Further, lower interest costs to lead to better profitability during the
quarter vs loss reported last year
EIH With the re-opening of the Delhi property, we expect EIH to report healthy
revenue growth of over 18.6% YoY vs. growth of 0.2% last year. ARR is
expected to increase ~2% YoY supported by healthy occupancy. Margins to
improve sharply YoY on account of leverage benefit and low base of last year
Taj GVK Hotel On the standalone front, we expect revenue growth of 12.8% YoY led by
improved ARRs. OPM margins are expected to improve sharply on QoQ basis as
last quarter's margins were lower due to renovation expenses.Further, better
opearting performance from JV property to lead to healthy profit growth during
the quarter
Source: ICICI Direct Research

ICICI Securities Ltd. | Retail Equity ResearchPage 38
Information Technology
Seasonal strength, deal wins, currency: Key drivers…
Improving deal wins, higher share of digital segment and reducing
pressure on legacy business is expected to be key drivers of growth in
the quarter. This coupled with Q2 being a seasonally strong quarter,
Tier-I IT companies are expected to report constant currency (cc)
growth of 1.3-3.9% sequentially. TCS is anticipated to lead the growth
led by deal ramp ups while Wipro is expected to lag taking into account
impact of divestment of hosted data centre services (~US$23 mn).
Among mid tier, Cyient, MindTree and NIIT Tech are expected to report
healthy growth driven by deal wins and digital competencies. Taking
into consideration of US$ appreciation against all major currencies,
cross currency could act as a headwind of 80-110 bps to reported $
growth. However, rupee depreciation by 4.6% QoQ would overweigh
these headwinds. This would lead to ~70-100 bps expansion in margins
across IT companies. Although TCS is expected to report best
performance on QoQ basis amongst Tier 1 players, expensive valuation
(~23.3 FY20E EPS) factors in most of the positives. We prefer Infosys
among tier-1 based on accelerated rate of new deal wins (estimated
US$1.5 billion in Q2FY19E vs $1.1 billion in Q1FY19) and anticipated
improvement in digital wallet share.
Margins to expand aided by rupee benefit…
Cross currency coupled with wage hike and hedging would act as
headwind to margins. However, it would be more than offset by rupee
depreciation. We expect TCS to report 150 bps QoQ expansion (no
wage hike), Infosys (+70 bps), Wipro (+50 bps on adjusted basis) while
HCL EBIT margins could decline by 20 bps owing to partial wage hike
and weak IP seasonality.
Midcap to witness a healthy quarter…
Cyient (5.2% QoQ), Mindtree (3.2% QoQ) and NIIT Tech (3.2% QoQ) are
expected to lead on the back of healthy deal pipeline and positioning in
digital. While, TechM is anticipated to witness a soft quarter owing to
weakness in enterprise business. On EBITDA margin front, midcap
companies are expected to observe an expansion QoQ of 70-150 bps
except for Persistent and KPIT who would see impact of full wage hike.
Demand trends across key verticals and deal pipeline to be watched…
Improving demand environment, healthy deal wins and rising focus on
digital competencies are expected to play out in favour of FY19E.
Commentary on outlook for key verticals such as BFSI, retail and
communication has to be watched out for. In our view, investor interest
would be demand outlook for key verticals, digital and deal pipeline.
Exhibit 19: Estimates for Q2FY19E (| Crore)
Revenue EBITDA PAT
Q2FY19E YoY QoQ Q2FY19E YoY QoQ Q2FY19E YoY QoQ
Cyient 1,185.6 22.8 9.8 152.9 8.5 16.2 95.2 -14.5 15.4
Eclerx 358.3 8.3 1.8 85.3 -10.6 8.9 57.2 -35.5 -4.8
Firstsource Sol 897.5 2.8 -2.3 131.0 19.5 2.3 92.3 34.3 4.2
HCL Tech 14,580.0 17.3 5.1 3,353.4 21.5 3.9 2,351.2 7.5 -2.2
Infosys 20,266.8 15.4 6.0 5,451.8 15.9 8.7 4,057.4 8.9 12.3
InfoEdge 255.9 13.6 -1.4 85.8 -3.4 1.8 71.2 -9.4 13.0
KPIT Tech 1,070.2 16.8 5.6 118.8 31.6 -3.3 77.9 30.4 0.6
Mindtree 1,746.1 31.1 6.5 263.7 71.1 14.1 174.1 39.6 10.0
NIIT Technologies 898.5 21.9 8.9 152.7 28.4 16.9 96.1 43.2 12.0
Persistent Systems 889.1 16.8 6.6 140.2 21.1 0.1 82.7 0.1 -5.3
TCS 36,403.1 19.2 6.3 10,156.5 24.4 12.0 7,905.4 22.6 7.7
Tech Mahindra 8,602.7 13.1 3.9 1,488.3 34.6 9.7 947.3 13.3 5.5
Wipro 14,780.8 10.1 5.7 2,788.2 -1.3 0.9 2,201.4 0.5 3.8
Total 101,934.5 16.2 5.7 24,368.5 19.0 8.4 18,209.4 13.3 6.6
Change (%)
Company
Change (%) Change (%)
Source: Company, ICICI Direct Research
Topline & profitability (Coverage universe)
87713
89228
91693
96444
101955
0.0
5.0
10.0
15.0
20.0
25.0
30.0
0
10000
20000
30000
40000
50000
60000
70000
80000
90000
Q2FY18
Q3FY18
Q4FY18
Q1FY19
Q2FY19E
(%
)
| C
rore
Revenue EBITDA Margin PAT Margin
Dollar growth, QoQ
IT Services Q2FY19E Q1FY19 Growth (%)
TCS 5,196.0 5,051.0 2.9
Infosys 2,892.8 2,831.0 2.2
Wipro ^ 2,026.1 2,026.5 (0.0)
HCL Tech 2,081.1 2,055.0 1.3
Tech Mahindra 1,227.9 1,224.1 0.3
Mindtree 249.2 241.5 3.2
KPIT Technologies 152.8 150.5 1.5
Cyient 169.2 160.8 5.2
NIIT Technologies 128.2 124.3 3.2
Persistent Systems 126.9 123.6 2.7
eClerx 49.7 49.2 1.1
BPO (in |)
Firstsource 897.5 919.1 (2.3)
Internet (in |)
Info Edge 255.9 259.5 (1.4)
^ IT services
Top picks of the sector
Infosys
Cyient
Research Analysts
Devang Bhatt
Deepti Tayal

ICICI Securities Ltd. | Retail Equity ResearchPage 39
Exhibit 20: Company specific view
Company Remarks
TCS Constant currency revenues are expected to grow 3.9% QoQ while US$ revenue is
expected to grow 2.9% QoQ to $5,196 million led by ramp up of deal wins in H2FY18.
Rupee revenues may grow 6.3% QoQ to | 36,403 crore owing to 4.6% QoQ rupee
depreciation against US$. EBIT margins could expand 150 bps QoQ to 26.5% on
account of operational efficiency, rupee depreciation benefit and absence of wage
hike. Investor interest: Growth momentum in BFSI and retail, deal TCV and ramp up of
deals, margin trajectory
Infosys In a seasonally strong quarter for Infosys, constant currency revenues are expected
to grow 3% QoQ with cross currency impact of 80 bps to dollar growth. US$
revenues are expected to grow 2.2% QoQ to $2,893 million. Rupee revenue may grow
6% to | 20,267 crore. EBIT margins may expand 70 bps QoQ to 24.4% primarily
owing to rupee tailwind partly offset by impact of wage hike for 15% of employees.
Investor interest: outlook for BFSI, deal pipeline and attrition at key positions
Wipro Global IT services constant currency revenues could grow 1.3% QoQ led by positives
from across sectors (except healthcare) and aided by one-month consolidation of
Alight acquisition amounting to $12.5 million. However, cross currency headwind and
divestment of hosted data services may lead to IT services US$ revenues to remain
flat QoQ to $2,026 million. Global IT services rupee revenue may grow 5.4% while
consolidated revenues could grow 5.7% to | 14,780 crore. Global IT services EBIT
margins may expand 50 bps QoQ (on adjusted basis from 15.6%) to 16.1% mainly
owing to operational efficiency and rupee benefit partly offset by two-month wage
hike impact. Investor interest: Demand outlook across healthcare, communication &
utilities vertical, margin enhancement levers, view for H2FY19E
HCL Tech Dollar revenues are expected to grow 1.3% QoQ to $2,081 million mainly on the back
of two-month consolidation of Actian acquisition (~$17 million) in the quarter while
organic growth is expected to be soft (0.4% QoQ). Rupee revenue could increase
5.1% to | 14,580 crore. EBIT margins could decline 20 bps QoQ to 19.5% on account
of partial wage hike & weak IP seasonality partly countered by rupee benefit. Investor
interest: Growth recovery in IMS, growth in other revenue segments and outlook on
ER&D segment
Tech Mahindra We expect US$ revenues to increase 0.3% QoQ to $1,227.9 million on account of
recent deal wins in communications segment partly countered by muted performance
in enterprise segment. Rupee revenues may grow 3.9% QoQ to | 8,603 crore. EBITDA
margins may expand 90 bps QoQ to 17.3% owing to currency benefit partly countered
by a partial wage hike. Investor Interest: Glimpse on telecom vertical trajectory and
5G opportunity, deal pipeline and conversion
Info Edge We expect revenues to grow 13.6% YoY to | 256 crore led by continued growth
momentum in Naukri business (13% YoY) and healthy growth in 99 acres (20% YoY).
EBITDA margins may expand 100 bps QoQ to 33.5% post sharp expansion of 780 bps
QoQ in Q1FY19. Investor interest: Directional path of IT hiring in Naukri segment,
update on Zomato and PolicyBazaar and new investment opportunities
MindTree We expect dollar revenues to increase 3.2% QoQ to $249 million led by deal ramp
ups, expected stability at top client and improved contribution from digital segment.
Rupee revenue may grow 6.5% QoQ to | 1,746 crore. EBITDA margins may expand
100 bps QoQ to 15.1% mainly owing to rupee tailwind. Investor interest: Top clients
trajectory, deal TCV, digital pipeline and FY19E outlook
Persistent
Systems
We expect dollar revenues to grow 2.7% QoQ to $127 million mainly led by growth in
digital and services business. Rupee revenues may grow 6.6% QoQ to | 889 crore.
EBITDA margins could decline 100 bps sequentially to 15.8% owing to wage hike
impact partly evened out by rupee depreciation benefit. Investor interest:
Commentary on four revenue business segments, revenue trajectory for FY19E taking
into account strong seasonality in Q3, deal pipeline
Source: Company, ICICI Direct Research
EBIT margin impact
EBIT margins Q2FY19E Q1FY19 Change (bps)
TCS 26.5 25.0 150
Infosys 24.4 23.7 70
Wipro ^ 16.1 17.5 (140)
HCL Tech 19.5 19.7 (20)
EBITDA margins
Tech Mahindra 17.3 16.4 90
Mindtree 15.1 14.1 100
KPIT Technologies 11.1 12.1 (100)
Cyient 12.9 12.2 70
NIIT Technologies 17.0 15.8 120
Persistent Systems 15.8 16.8 (100)
eClerx 23.8 22.3 150
BPO
Firstsource 14.6 13.9 70
Internet (in |)
Info Edge 33.5 32.5 100
^ IT Services
$/|
50
55
60
65
70
75
80
Oct-14
Jan-15
Apr-15
Jul-15
Oct-15
Jan-16
Apr-16
Jul-16
Oct-16
Jan-17
Apr-17
Jul-17
Oct-17
Jan-18
Apr-18
Jul-18
Oct-18
|
|/$
$ vs. global currencies
0.6
0.7
0.8
0.9
1.0
1.1
Oct-14
Jan-15
Apr-15
Jul-15
Oct-15
Jan-16
Apr-16
Jul-16
Oct-16
Jan-17
Apr-17
Jul-17
Oct-17
Jan-18
Apr-18
Jul-18
Oct-18
$/Euro $/GBP AUD/$
Inter-quarter, average US$ has appreciated 4.6%, 2.4%, 4.2% and
3.3% against |, Euro, GBP and AU$ respectively.

ICICI Securities Ltd. | Retail Equity ResearchPage 40
Company specific view
Company Remarks
Cyient We expect dollar revenues to grow 5.2% QoQ to $169 million mainly led by ~23%
QoQ growth in seasonally strong Design Led Manufacturing (DLM) business. Rupee
revenues may grow 9.8% QoQ to | 1,186 crore. EBITDA margins may expand 70 bps
QoQ to 12.9% owing to rupee benefit countered by partial wage hike. Investor
interest: Update on business segments, especially utilities & geospatial, revenue
growth outlook for FY19E and margin guidance update (given 14%) in the wake of
Q1FY19 margins
eClerx Rupee revenues may grow 1.8% sequentially to | 358 crore while dollar revenues are
expected to grow 1.1% QoQ to $49.7 million. EBITDA margins may expand 150 bps
QoQ to 23.8% owing to absence of wage hike and currency benefit. Investor interest:
Outlook for H2FY19E in light of expected deal closures, margin trajectory, top clients
stability and BFSI demand update
NIIT Tech Led by growth momentum across three major verticals (banking, insurance and
travel), digital portfolio and order book conversion, dollar revenues are expected to
grow 3.2% QoQ to US$128 million. Rupee revenues may grow 8.9% QoQ to | 898.5
crore. EBITDA margins may expand 120 bps QoQ to 17% on account of revenue
growth, currency benefit and absence of wage hike in the quarter. Investor interest:
Deal TCV, demand momentum across focus verticals, update on FY19E revenue and
margin outlook
KPIT Tech Dollar revenues may grow 1.5% QoQ to $152.8 million led by digital and engineering
services. Rupee revenue could grow 5.6% QoQ to | 1070 crore. EBITDA margins
could decline 100 bps QoQ to 11.1% mainly on account of wage hike partly offset by
rupee benefit. Investor Interest: Update on merger with Birlasoft, FY19E revenue and
margin guidance, outlook on engineering and automotive segment
Firstsource
Solutions
We expect rupee revenues to decline 2.3% sequentially to | 897.5 crore on account
of weakness in top client (24.7% of revenue in Q1FY19). EBITDA margins may expand
70 bps QoQ to 14.6% owing to absence of wage hike and operational efficiency.
Investor interest: Update on top client, revenue guidance update for FY19E, outlook
on BFSI and healthcare business
Source: Company, ICICI Direct Research

ICICI Securities Ltd. | Retail Equity ResearchPage 41
Logistics
Container volume growth continues to stay in double digits
Domestic container volume growth (up 9% on a YTD basis) has
begun to complement the strong container volume for Indian
Railways in the Exim segment (up 15%). Indian Railways has grown
6% to 495 MMT in overall cargo volumes while it has grown 14% to
25 MMT in container volumes. Majority of YTD growth in cargo
volumes was derived from bulk commodities like coal (49% of overall
tonnage), which grew 13% whereas cement and iron ore (~10% each
of overall tonnage) grew -9% and 2%, respectively. In the container
segment, YTD Exim volumes remained robust with growth of 15%
YoY to 20 MT whereas domestic volumes grew 9% to 5 MT. Indian
Railways is also a beneficiary of rising diesel prices, as cargo volumes
tend to shift from road to railways during such times. However, with
the pickup in import volumes along the ports in East coast, the lead
distance for the Indian railways is expected to remain muted.
Surface players benefit from E-Way bill; fuel hike to be passed on
Inter-state E-Way bill (implemented from April 1, 2018) has improved
the operational efficiency of major surface players and the turnaround
times by 18-20% (Icra report). Companies in our coverage universe
have undergone a smooth transition (with minor glitches) to the new
system, with the help of their robust IT infrastructure and trained
staff. Also, higher crude prices would help organised players to gain
market share, as organised players (unlike unorganised players) were
able to effectively pass through the higher crude prices (average price
US$75.3 per barrel) to majority of their customers, with a formula
driven tariff generation (revised twice each month.
Major port traffic, air freight volumes show good performance
The major port traffic data (12 ports) has shown FY19 YTD (April-
August) growth of 5% to 288 MMT in overall cargo handled and 9%
in container volumes to 60 MMT. Also, air freight data (domestic) has
grown strongly at 12% YoY (for April-August) to 0.47 MMT. However,
at the same time, the market share for coverage company (BlueDart)
has de-grown to 17.5% (earlier 19.8%) to 0.08 MMT.
Sector to be driven by surface players, margins to remain range-bound
Revenues of our logistics coverage universe are expected to grow
10.5% YoY to | 3772 crore (| 3682 crore in Q1FY19). Profitability of
surface players would drive overall EBITDA and PAT growth of 6.3%
and 9.3% to | 564 crore and | 402 crore, respectively.
Exhibit 21: Estimates for Q2FY19E: (Logistics) (| crore)
Revenue EBITDA PAT
Q2FY19E YoY QoQ Q2FY19E YoY QoQ Q2FY19E YoY QoQ
Blue Dart 730.9 4.0 -0.3 58.5 -23.8 31.3 31.6 -23.6 43.2
Container Corporation 1,574.4 10.1 0.4 313.2 11.0 -2.2 271.0 21.6 7.4
GATI Ltd 446.4 10.0 -2.0 17.0 -12.4 -22.3 1.6 -92.1 -70.8
Gujarat Pipavav 163.0 7.4 -7.4 91.3 10.2 -0.1 48.0 8.6 1.9
TCI Express 244.3 20.0 -1.3 24.3 23.3 -9.8 15.7 20.6 -2.4
Transport Corp 613.3 17.9 5.5 60.1 20.1 17.1 33.9 32.7 20.2
Total 3,772.4 10.5 0.3 564.3 6.3 1.5 401.9 9.3 8.2
Change (%) Change (%)
Company
Change (%)
Source: Company, ICICI Direct Research
Topline & Profitability (Coverage universe)
3415
3740
3832
3762
3772
0.0
2.0
4.0
6.0
8.0
10.0
12.0
14.0
16.0
18.0
0
400
800
1200
1600
2000
2400
2800
3200
3600
Q2FY18
Q3FY18
Q4FY18
Q1FY19
Q2FY19E
(%
)
| C
rore
Revenue EBITDA Margin PAT Margin
Port container Volumes in an uptrend…
758
775
836
800
660
680
700
720
740
760
780
800
820
840
860
June'1
7
July
'17
Aug'1
7
Sep'1
7
Oct'1
7
Nov'1
7
Dec'1
7
Jan'1
8
Feb'1
8
Mar'1
8
Apr'1
8
May'1
8
Jun'1
8
Jul'18
Aug'1
8
('0
00 TEU
s)
Top Pick
Transport Corporation of India
Container Corporation of India
Research Analyst
Bharat Chhoda
Harshal Mehta

ICICI Securities Ltd. | Retail Equity ResearchPage 42
Exhibit 22: Company specific view
Company Remarks
Container
Corporation
Throughput container volumes are expected to grow 13% YoY to 985668 TEUs.
Robust Exim volumes (up 14% YoY) will be supported by rising domestic volumes (up
8% YoY). Resultant core revenues are expected to grow 4% YoY, mainly due to
expected 9% YoY decline in Exim realisation (ex-incentives) whereas domestic
realisation is expected to remain flat. EBITDA margins are expected to improve due to
a better operational performance (higher double stacking, lower empties etc) resulting
in 137 bps YoY expansion to 21.3% with absolute EBITDA of | 313 crore (up 11%
YoY). Additionally, the presence of export incentives during the quarter could result in
22% growth in reported PAT
Transport
Corporation of
India
Freight revenues are expected to grow 10% YoY while supply chain and shipping are
expected to grow 18% and 40% YoY (mainly due to addition of a ship), respectively.
Hence, resultant revenues are expected to grow 18% YoY to | 613 crore, aided by a
smooth transitioning to E-way system. Increased contribution from high margin SCS,
shipping business and effective passage of crude prices to customers (marginal
impact to company), is expected to lead to improvement of 18 bps in EBITDA margin
to 9.8%. Absolute EBITDA is expected to grow 20% YoY. A robust operational
performance coupled with higher other income may result in robust PAT growth of
33% YoY
BlueDart Revenues are expected to remain flat at | 716 crore. However, a shift in volumes
from air to surface and higher fuel prices would lead EBITDA margins to contract 292
bps YoY to 8%. Absolute EBITDA may de-grow 25% YoY to | 57 crore. Subsequently,
PAT is expected to de-grow 25%, mainly due to a weak operational performance
(further decline in PAT arrested by lower interest costs)
Gujarat Pipavav
Port
Container volumes are expected to grow 12% YoY to 179200 TEUs, post addition of a
liner from parent in Q4FY18. However, bulk volumes are expected to remain
rangebound. Higher competition from ports in the vicinity would keep a tab on
realisations. Ancillary revenues (RoRo, liquid) would remain supportive to softness in
the mainstream business. Overall revenues are expected to grow 7% YoY. EBITDA
margins are expected to increase 261 bps YoY mainly due to higher operating
leverage, leading to EBITDA growth of 10% YoY. PAT is expected to grow 9% YoY to |
48 crore
Gati KWE is expected to clock revenues of | 298 crore, entailing YoY growth of 10%. Also,
e-commerce revenues that have revived in Q1, post experiencing de-growth for five
consecutive quarters, would support standalone revenues, which is expected to grow
5% YoY. Kausar revenues are expected to grow 5% YoY. Consolidated revenues are
expected to grow 10% YoY to | 446 crore. Operating margins may contract 96 bps to
3.8%, as the company is expected to be marginally impacted due to higher crude
prices. Resultant EBITDA is expected to de-grow 12% YoY. However, PAT is expected
to de-grow 92%, mainly due to the presence of an exceptional income of | 25 crore in
Q2FY18
TCI Express Revenues are expected to grow 20% YoY to | 244 crore, on the back of strong
ongoing growth in the express cargo industry and smooth implementation of E-way
bill. However, EBITDA margins are expected to expand mere 30 bps to 10%, mainly
due to partial impact of hike in crude prices (80% passed on to the customers).
Subsequently, EBITDA is expected to grow of 23% YoY. Resultant PAT is expected to
grow 21% to | 16 crore
Source: ICICI Direct Research
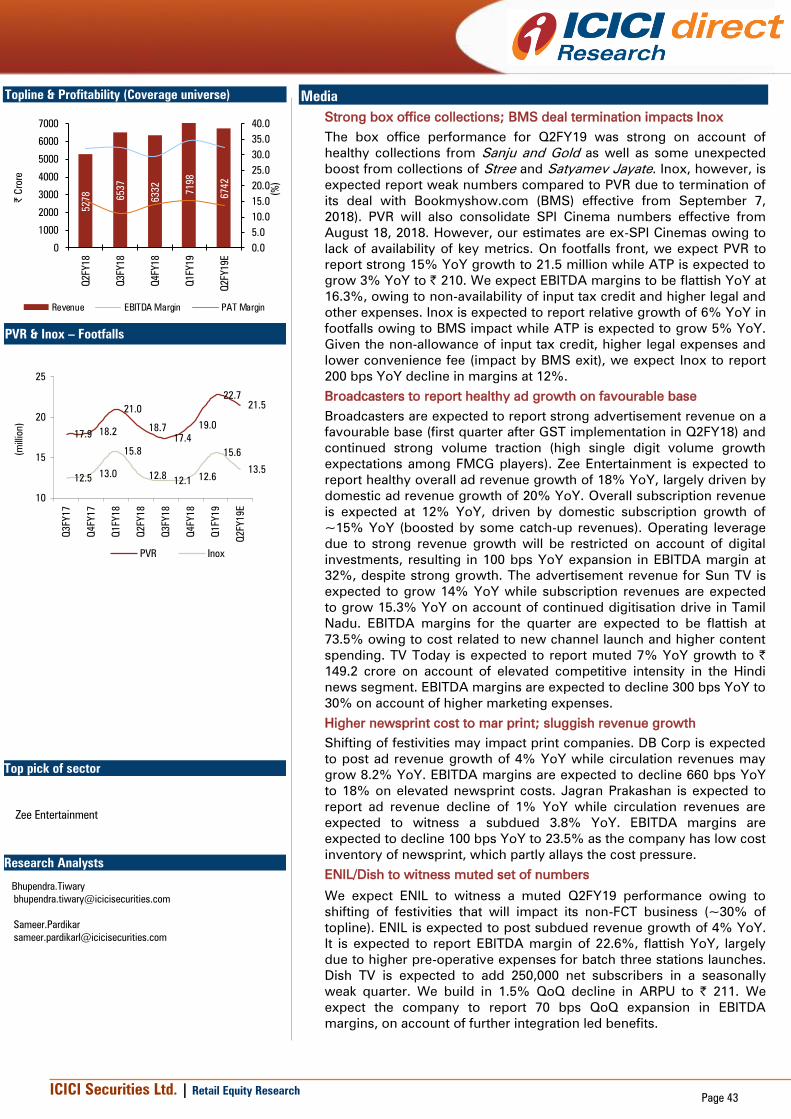
ICICI Securities Ltd. | Retail Equity ResearchPage 43
Media
Strong box office collections; BMS deal termination impacts Inox
The box office performance for Q2FY19 was strong on account of
healthy collections from Sanju and Gold as well as some unexpected
boost from collections of Stree and Satyamev Jayate. Inox, however, is
expected report weak numbers compared to PVR due to termination of
its deal with Bookmyshow.com (BMS) effective from September 7,
2018). PVR will also consolidate SPI Cinema numbers effective from
August 18, 2018. However, our estimates are ex-SPI Cinemas owing to
lack of availability of key metrics. On footfalls front, we expect PVR to
report strong 15% YoY growth to 21.5 million while ATP is expected to
grow 3% YoY to | 210. We expect EBITDA margins to be flattish YoY at
16.3%, owing to non-availability of input tax credit and higher legal and
other expenses. Inox is expected to report relative growth of 6% YoY in
footfalls owing to BMS impact while ATP is expected to grow 5% YoY.
Given the non-allowance of input tax credit, higher legal expenses and
lower convenience fee (impact by BMS exit), we expect Inox to report
200 bps YoY decline in margins at 12%.
Broadcasters to report healthy ad growth on favourable base
Broadcasters are expected to report strong advertisement revenue on a
favourable base (first quarter after GST implementation in Q2FY18) and
continued strong volume traction (high single digit volume growth
expectations among FMCG players). Zee Entertainment is expected to
report healthy overall ad revenue growth of 18% YoY, largely driven by
domestic ad revenue growth of 20% YoY. Overall subscription revenue
is expected at 12% YoY, driven by domestic subscription growth of
~15% YoY (boosted by some catch-up revenues). Operating leverage
due to strong revenue growth will be restricted on account of digital
investments, resulting in 100 bps YoY expansion in EBITDA margin at
32%, despite strong growth. The advertisement revenue for Sun TV is
expected to grow 14% YoY while subscription revenues are expected
to grow 15.3% YoY on account of continued digitisation drive in Tamil
Nadu. EBITDA margins for the quarter are expected to be flattish at
73.5% owing to cost related to new channel launch and higher content
spending. TV Today is expected to report muted 7% YoY growth to |
149.2 crore on account of elevated competitive intensity in the Hindi
news segment. EBITDA margins are expected to decline 300 bps YoY to
30% on account of higher marketing expenses.
Higher newsprint cost to mar print; sluggish revenue growth
Shifting of festivities may impact print companies. DB Corp is expected
to post ad revenue growth of 4% YoY while circulation revenues may
grow 8.2% YoY. EBITDA margins are expected to decline 660 bps YoY
to 18% on elevated newsprint costs. Jagran Prakashan is expected to
report ad revenue decline of 1% YoY while circulation revenues are
expected to witness a subdued 3.8% YoY. EBITDA margins are
expected to decline 100 bps YoY to 23.5% as the company has low cost
inventory of newsprint, which partly allays the cost pressure.
ENIL/Dish to witness muted set of numbers
We expect ENIL to witness a muted Q2FY19 performance owing to
shifting of festivities that will impact its non-FCT business (~30% of
topline). ENIL is expected to post subdued revenue growth of 4% YoY.
It is expected to report EBITDA margin of 22.6%, flattish YoY, largely
due to higher pre-operative expenses for batch three stations launches.
Dish TV is expected to add 250,000 net subscribers in a seasonally
weak quarter. We build in 1.5% QoQ decline in ARPU to | 211. We
expect the company to report 70 bps QoQ expansion in EBITDA
margins, on account of further integration led benefits.
Topline & Profitability (Coverage universe)
5278
6537
6332
7198
6742
0.0
5.0
10.0
15.0
20.0
25.0
30.0
35.0
40.0
0
1000
2000
3000
4000
5000
6000
7000
Q2FY18
Q3FY18
Q4FY18
Q1FY19
Q2FY19E
(%
)
| C
rore
Revenue EBITDA Margin PAT Margin
PVR & Inox – Footfalls
17.9 18.2
21.0
18.7
17.4
19.0
22.7
21.5
12.513.0
15.8
12.812.1
12.6
15.6
13.5
10
15
20
25
Q3FY17
Q4FY17
Q1FY18
Q2FY18
Q3FY18
Q4FY18
Q1FY19
Q2FY19E
(m
illion)
PVR Inox
Top pick of sector
Zee Entertainment
Research Analysts
Bhupendra.Tiwary
Sameer.Pardikar

ICICI Securities Ltd. | Retail Equity ResearchPage 44
Exhibit 23: Estimates for Q2FY19E (Media) (| Crore)
Revenue EBITDA PAT
Q2FY19E YoY QoQ Q2FY19E YoY QoQ Q2FY19E YoY QoQ
DB Corp 589.5 3.7 -6.8 106.2 -24.1 -36.8 58.5 -25.6 -40.0
Dish TV 1,650.9 NC -0.3 565.9 NC 1.6 30.3 NC 8.9
ENIL 130.7 4.0 7.5 29.5 4.1 4.2 9.6 56.9 2.5
Inox Leisure 346.5 11.3 -16.5 41.9 -4.2 -49.8 10.2 -12.7 NM
Jagran Prakashan 578.0 2.0 -4.1 135.8 -2.0 -17.0 64.3 -7.5 -24.7
PVR 653.1 17.6 -6.2 106.6 17.8 -22.3 31.5 25.3 -39.5
Sun TV 763.9 13.0 -31.8 561.4 13.2 -23.6 303.1 6.5 -25.9
TV Today 172.2 19.3 -5.3 51.7 8.1 -18.7 34.1 15.1 -16.8
Zee Ent. 1,856.8 17.4 4.8 594.2 21.0 5.0 390.0 19.0 14.9
Total* 5,090.8 12.4 -8.1 1,627.3 10.2 -16.3 901.3 8.2 -15.8
Change (%)Change (%) Change (%)
Company
Source: Company, ICICI Direct Research * excl. Dish TV
Exhibit 24: Company specific view
Company Remarks
DB Corp Shifting of festive season is likely to have an impact on DB Corp's print ad growth,
which is expected at 4% YoY. Circulation revenues are expected to grow 8.2% YoY to |
137.7 crore. Radio is again expected to be muted with growth at 2% YoY to | 35.6
crore. Margins are expected to decline 660 bps YoY to 18% owing to elevated
newsprint costs and negative operating leverage due to muted growth
Jagran
Prakashan
Jagran is also expected to be impacted by relatively muted ad scenario for print
company along with shifting of festivities. Print ad revenues are expected to decline 1%
YoY to | 335 crore. Circulation revenues will also be muted at ~3.8% YoY. The radio
segment is expected to witness ~7% YoY growth at | 81 crore. Given higher newsprint
cost (partly hedged by higher inventory), margins are expected to decline 100 bps YoY
to 23.5%
Dish TV In a seasonally weak quarter, we expect Dish TV to add 250,000 net subscribers for the
quarter. We build in 1.5% QoQ decline in ARPU to | 211. We expect the combined
entity (Dish TV Videocon) to post consolidated revenue of | 1651 crore, flattish QoQ.
We expect the company to report 70 bps QoQ expansion in EBITDA margins on account
of further integration led benefits. Key monitorable would guidance on net adds and
ARPU
ENIL We expect ENIL to witness a muted performance in Q2FY19 owing to shifting of
festivities, which will impact its non-FCT business (~30% of the topline). Consequently,
we expect ENIL to post subdued revenue growth of 4% YoY at | 130.7 crore. We expect
the company to report EBITDA margin of 22.6%, flattish YoY, largely due to higher pre-
operative expenses for batch 3 stations launches
Source: Company, ICICI Direct Research

ICICI Securities Ltd. | Retail Equity ResearchPage 45
Exhibit 25: Company specific view
Company Remarks
Inox Leisure Key movies from the quarter included Sanju, Stree, Gold, Satyamev Jayate, etc. Despite
strong industry box office collections growth for the quarter, Inox was impacted by
termination of ticketing contract with BookMyShow.com, which resulted in footfall loss
of ~1 mn. On a footfall basis, Inox is expected to report a 6% YoY growth on account of
strong content performance. ATP is expected to grow 5% YoY. Inox is expected to
report 12% YoY growth in ad revenues. Net box office collections are expected to
improve ~11% YoY to | 206 crore while F&B revenues are expected to witness 34%
YoY growth. Given the non-allowance of input tax credit, higher legal expenses, and
lower convenience fee (impact by BMS exit), we expect 200 bps YoY decline in
margins at 12%
PVR Q2FY19 was marked by a strong box office performance with expected hits like Sanju,
Gold and unexpected blockbusters such as Stree, Satyamev Jayate. On the footfalls
front, we expect the company to report strong 15% YoY growth to 21.5 million while
ATP is expected to grow 3% YoY to | 210. Net ticketing revenues are expected to post
healthy growth of 17.7% YoY to | 352.3 crore, driven by strong footfall growth. F&B
revenues to continue its healthy traction and expected to grow by ~25% YoY to | 177.6
crore. Advertising revenues are expected to grow ~7% YoY. We expect EBITDA
margins to be flattish YoY at 16.3%, owing to non-availability of input tax credit and
higher legal and other expenses. We highlight that our estimates are ex-SPI, which may
be consolidated from this quarter
Sun TV We expect Sun TV to continue healthy ad revenue growth momentum. Subscription
revenues are expected to continue to be robust on account of Tamil Nadu digitisation
drive. We expect ad revenues to grow 14% YoY to | 375.7 crore while subscription
revenues are expected to grow 15.3% YoY to | 320.2 crore. We expect EBITDA margins
to be flattish YoY at 73.5% owing to new channel launch costs and higher content
spending
TV Today
Network
We expect subdued broadcasting revenues growth of ~7% YoY to | 149.2 crore, as
stiff competition has impacted overall ad volumes. The radio business is expected to
continue its momentum and is expected to post revenue of | 5.8 crore, up 30% YoY.
Overall revenue growth on a YoY basis is not comparable owing to consolidation of the
digital business. We expect EBITDA margins at 30%, down ~300 bps YoY owing to
higher marketing expenses
Zee Ent. Zee is expected to post healthy overall ad revenue growth of 18% YoY to | 1165 crore,
to be largely driven by domestic ad revenue growth of 20% YoY. Overall subscription
revenue is expected at 12% YoY, driven by domestic subscription growth of ~15% YoY
(that would be boosted by some catch-up revenues). Incremental cost related to digital
investments will restrict operating leverage resulting in 100 bps YoY expansion in
EBITDA margin at 32% despite stupendous topline growth
Source: Company, ICICI Direct Research

ICICI Securities Ltd. | Retail Equity ResearchPage 46
Metals & Mining
Domestic steel prices flattish QoQ, likely to pick up post monsoon…
Domestic steel consumption grew 6.5% YoY in July-August 2018 after
increasing 8.9% YoY during the April-June 2018 quarter. In a seasonally
weak quarter, steel prices were broadly flattish QoQ. However, the
same is likely to pick up post monsoons on the back of a pick-up in
construction and infrastructure activities. For Q2FY19E, we expect the
EBITDA/tonne of domestic steel companies to decline sequentially on
the back of flattish realisations and up-tick in prices of both key raw
materials viz. coking coal and iron ore. However, post the completion of
monsoons, on the back of a healthy demand outlook and depreciating
rupee we expect steel prices to firm up during H2FY19E, boding well for
domestic steel players. Over the medium to longer term horizon,
domestic steel consumption is expected to track GDP growth. This is
likely to remain healthy. Hence, steel prices are expected to remain
buoyant given supportive macros and healthy demand. On the global
front, China is heading for winter cuts starting from October 1, 2018 to
March 31, 2019; while the quantum of capacity cuts this year remain a
key monitorable. During January-August 2018, Chinese steel exports
have declined ~13% YoY to 47.2 MT (vs. 54.5 MT in January-August
2017). The decline in Chinese steel exports is also supportive for global
steel prices.
Non-ferrous prices continue to remain volatile, decline QoQ...
Developments around the trade tussle between the US and China
continued to weigh on global trade flows, impacting global metal
prices. During Q2FY19, average zinc prices were at US$2535/tonne,
down 14.4% YoY, 18.5% QoQ. Lead prices were down 10% YoY, 12%
QoQ to US$2098/tonne. Copper prices were down 3.7% YoY, 11.1%
QoQ to US$6117/tonne while aluminium prices were up 2.2% YoY,
down 11.1% QoQ to US$2054/tonne.
EBITDA margins to increase YoY, decline QoQ...
We expect the aggregate topline of coverage companies to increase
10.9% YoY, a decline of 5.4% QoQ. Aggregate EBITDA margins are
likely to come in at 23.4% (vs. 19.1% in Q1FY18 and 24.9% in Q1FY19).
We expect domestic operations of Tata Steel to report an EBITDA/tonne
of | 16500/tonne with JSW Steel clocking an EBITDA/tonne of |
10250/tonne. The EBITDA/tonne of domestic miners like Coal India is
likely to come in at | 300/tonne with NMDC at ~| 2300/tonne. We
expect Novelis (Hindalco’s subsidiary) to clock EBITDA/tonne of
US$400/tonne.
Exhibit 26: Estimates for Q2FY19E: (Metals & Mining) (| Crore)
Revenue EBITDA PAT
Q2FY19E YoY QoQ Q2FY19E YoY QoQ Q2FY19E YoY QoQ
Coal India 21,247.1 17.1 -12.4 4,804.9 290.3 -16.2 3,470.9 840.9 -8.3
Graphite India 1,798.1 289.3 1.2 1,122.4 764.0 -13.7 771.0 757.6 -10.1
HEG 1,589.3 288.1 0.1 1,017.0 436.1 -14.4 665.7 485.5 -13.6
Hindalco 9,312.2 -9.7 -12.1 1,130.4 -18.7 -14.7 279.4 -28.9 -32.4
Hindustan Zinc 4,649.0 -12.4 -12.4 2,261.1 -25.2 -16.7 1,601.1 -37.1 -16.5
JSW Steel 20,346.6 21.0 -0.8 4,280.7 41.0 -16.1 1,782.3 113.2 -23.8
NMDC 2,669.8 10.3 10.2 1,608.5 33.7 13.0 1,112.4 31.8 14.1
Vedanta Ltd 18,805.1 -12.9 -15.3 5,695.9 0.5 -9.4 1,219.3 -41.7 -20.5
Tata Steel 39,243.7 20.9 3.7 6,808.6 44.2 5.3 2,021.7 93.9 4.5
Total 119,660.9 10.9 -5.4 28,729.4 39.5 -8.9 12,923.8 55.3 -11.0
Change (%) Change (%) Change (%)Company
Source: Company, ICICI Direct Research, Hindalco numbers are excluding Novelis & Utkal Alumina
Topline & profitability (Coverage universe)
107930
118502
135834
126508
119661
0.0
5.0
10.0
15.0
20.0
25.0
30.0
0
25000
50000
75000
100000
125000
Q2FY18
Q3FY18
Q4FY18
Q1FY19
Q2FY19E
(%
)
| C
rore
Revenue EBITDA Margin PAT Margin
Movement of base metal prices on LME
(US$/tonne) Q2FY19 Q2FY18 YoY % Q1FY19 QoQ %
Zinc 2,537 2,962 (14.3) 3,111 (18.4)
Lead 2,097 2,331 (10.1) 2,384 (12.1)
Aluminium 2,054 2,010 2.2 2,264 (9.3)
Copper 6,120 6,351 (3.6) 6,881 (11.1)
Source: Bloomberg, ICICI Direct Research
(|/tonne) Q2FY19 Q2FY18 YoY % Q1FY19 QoQ %
Zinc 177,642 190,373 (6.7) 208,479 (14.8)
Lead 146,986 149,841 (1.9) 159,760 (8.0)
Aluminium 143,934 129,202 11.4 151,718 (5.1)
Copper 428,600 408,244 5.0 461,119 (7.1)
Source: Bloomberg, ICICI Direct Research
Australia Premium coking coal futures (FoB) (US$/tonne)
100.0
130.0
160.0
190.0
220.0
250.0
280.0
310.0
Apr-17
May-17
Jun-17
Jul-17
Aug-17
Sep-1
7
Oct-17
Nov-17
Dec-17
Jan-18
Feb-18
Mar-18
Apr-18
May-18
Jun-18
Jul-18
Aug-18
Sep-1
8
Oct-18
Source: Bloomberg, ICICI Direct Research
Iron ore spot price (62% Import Fine Ore CFR Qingdao)
40
45
50
55
60
65
70
75
80
85
Apr-17
May-17
Jun-17
Jul-17
Aug-17
Sep-1
7
Oct-17
Nov-17
Dec-17
Jan-18
Feb-18
Mar-18
Apr-18
May-18
Jun-18
Jul-18
Aug-18
Sep-1
8
Source: Bloomberg, ICICI Direct Research, Prices in US$/tonne
Research Analyst
Dewang Sanghavi
Akshay Kadam

ICICI Securities Ltd. | Retail Equity ResearchPage 47
Exhibit 27: Company specific view
Company Remarks
Coal India
For the seasonally weak quarter of Q2FY19, the company reported coal offtake of
137.3 million tonne (MT), up 4.4% YoY, down 10.5% QoQ. We expect the
topline to increase 17.1% YoY decline 12.4% QoQ. The EBITDA is likely to
increase 234.6% YoY, down 28.2% QoQ. The EBITDA margin is likely to come
in at 19.4% (vs. 23.6% in Q1FY19 and 6.8% in Q2FY18). We expect the
company to clock an EBITDA/tonne of | 300/tonne (vs. | 373/tonne in Q1FY19
and | 94/tonne in Q2FY18)
Graphite India
On the back of healthy graphite electrode prices, the standalone performance is
likely to remain healthy. Capacity utilisation levels are expected to remain
elevated at ~95%. The topline is expected to increase 289.3% YoY and 1.2%
QoQ to |1798 crore. The impact of higher price needle coke is likely to come in
from the current quarter moderating the EBITDA margin to 62.4% (vs.73.2% in
Q1FY19 and 28.1% in Q2FY18). The EBITDA is likely to come in at | 1122
crore while PAT is expected to come in at | 771 crore. On a consolidated basis,
we expect the company to report a topline of | 1990 crore, EBITDA of | 1249
crore and PAT of | 857 crore
HEG
We expect the company to continue to report a healthy performance for
Q2FY19, on the back of healthy graphite electrode realisations. Capacity
utilisation levels are expected to remain flattish QoQ at ~82%. The topline is
expected to increase 288% YoY and remain flattish QoQ at | 1598 crore. We
expect the higher price needle coke to impact the raw material cost. Thus, the
EBITDA is likely to come in at | 1017 crore, implying an EBITDA margin of
64% (vs. 74.8% in Q1FY19 and 46.3% in Q2FY18). We expect the company to
report a PAT of | 665.7 crore
Hindustan Zinc
The decline in non-ferrous prices, both zinc and lead, is likely to have a negative
rub-off on the Q2FY19 performance. LME zinc prices during the quarter were
down 14.4% YoY, 18.5% QoQ, while lead prices declined 10% YoY, 12% QoQ.
We expect zinc sales of ~165000 tonne, lead sales of ~50000 tonne and silver
sales of ~154000 kg. The topline is likely to decline ~12.4% both YoY and
QoQ. EBITDA is likely to decline 25.2% YoY and 16.7% QoQ. We expect the
EBITDA margin to come in at 48.6% (vs. 57% in Q2FY18 and 51.1% in
Q1FY19)
JSW Steel
For Q2FY19, EBITDA/tonne is likely to moderate sequentially due to increased
raw material prices (iron ore and coking coal). We expect the standalone
operations to report an EBITDA/tonne of | 10250/tonne (vs. | 12590/tonne in
Q1FY19). The sales volume of domestic operations is likely to come in at 3.9
million tonne (MT). We expect the consolidated topline to increase 21% YoY,
0.8% QoQ while consolidated EBITDA is likely to increase 41% YoY, decline
16% QoQ. The consolidated EBITDA margin is likely to come in at 21% (vs.
18.1% in Q2FY18 and 24.9% in Q1FY19)
Hindalco
For Q2FY19, we expect Hindalco's EBITDA margin to remain flattish
sequentially. The decline in the aluminium and copper prices is likely to weigh
on the overall performance of the company during the quarter. We expect the
domestic operations to report aluminium sales of ~330000 tonne. Copper
sales are likely to come in at ~75000 tonne (lower due to smelter shutdown for
maintenance). We expect the topline to decline 9.7% YoY, 12.1 QoQ. The
EBITDA is likely to decline 18.7% YoY, 14.7% QoQ. The EBITDA margin is likely
to remain flattish at 12.1% (vs. 13.5 in Q2FY18 and 12.5% in Q1FY19).
Hindalco has a captive supply of alumina and, hence, is insulated from the
volatility in alumina prices. Novelis for Q2FY19 is expected to report FRP
shipments of ~844 KT and clock EBITDA/tonne of US$400/tonne. We expect
the EBITDA of Hindalco’s standalone +Utkal to come in at | 1630 crore
Source: ICICI Direct Research
Hindustan Zinc: Sales volume trend
FY19
Sales Unit Q2 Q3 Q4 Q1 Q2E
Zinc Tonne 193000 200000 210000 170000 165000
Lead Tonne 40000 46000 50000 42000 49950
Silver Kg 146000 135000 167000 141000 154101
FY18
JSW Steel: EBITDA/tonne & sales
FY19
Q2 Q3 Q4 Q1 Q2E
Sales Volume 3.9 4.0 4.2 3.8 3.9
EBITDA/tonne 7,467 9,000 11,950 12,590 10,250
FY18
Sales volume in Million tonnes and EBITDA/tonne in |/tonne
Tata Steel: EBITDA/tonne & sales
FY19
Sales Volume Q2 Q3 Q4 Q1 Q2E
Tata Steel India 3.1 3.3 3.0 3.0 3.2
Tata Steel Europe 2.6 2.4 2.6 2.5 2.6
Tata Steel Group 6.5 6.6 6.7 6.6 6.5
EBITDA/tonne
Tata Steel India 10,959 14,025 15,872 17,077 16,500
Tata Steel Europe 45 40 70 102 75
FY18
Sales volume in million tonne
Tata Steel India EBITDA/tonne denoted in |/tonne
Tata Steel Europe EBITDA/tonne denoted in US$/tonne

ICICI Securities Ltd. | Retail Equity ResearchPage 48
Exhibit 28: Company specific view
NMDC
On the back of sharp price hikes since July-2018, we expect the company to
report a healthy performance. Cumulatively, since July 2018, iron ore lump
prices have increased by | 800/tonne. Prices of iron ore fines have increased by
| 650/tonne, the benefit of which is likely to flow down positively to EBITDA.
We expect iron ore sales volume at 7 million tonne (MT). The topline is
expected to increase ~10% both YoY and QoQ. While EBITDA is likely to
increase 34% YoY and 13% QoQ, the corresponding EBITDA margin is likely to
come in at ~60.2% (vs. 49.7% in Q2FY18 and 58.8% in Q1FY19). The
subsequent EBITDA/tonne is expected to come in at ~| 2300/tonne
Vedanta
The decline in prices of major base metals is likely to weigh on the Q2FY19
performance. However, increased crude oil prices and a weaker rupee are likely
to aid the overall performance. We expect the topline to decline 12.9% YoY,
15.3% QoQ while EBITDA is expected to remain flattish YoY, down 9.4% QoQ.
The EBITDA margin is likely to come in at 30.3%
Tata Steel
For Q2FY19, on the back of flattish realisations, we expect domestic operations
to report a healthy EBITDA/tonne of | 16500/tonne (vs. | 17077/tonne in
Q1FY19). The EBITDA/tonne is likely to moderate QoQ due to increased raw
material prices (iron ore and coking coal). Indian operations are expected to
report steel sale of 3.2 million tonne (MT) while European operations steel sales
are likely to come in at 2.6 MT. We expect European operations to report
EBITDA/tonne of US$75/tonne. On a consolidated basis, the topline is expected
to increase 20.9% YoY, 3.7% QoQ. EBITDA is expected to increase 44.2% YoY.
Consolidated EBITDA margins are likely to come in at 17.3% (vs. 17.1% in
Q1FY19 and 14.5% in Q2FY18)
Source: ICICI Direct Research

ICICI Securities Ltd. | Retail Equity ResearchPage 49
Oil and gas
Stable volume growth for gas sector; margins to decline on high costs
Domestic gas demand and continued LNG imports from consuming
sectors has led to steady volume growth for gas utility companies on a
YoY basis. City gas distribution companies are expected to continue to
report good volume growth due to sustainable conversion to CNG
vehicles and rising concerns with respect to current pollution issues.
However, high spot LNG prices and rupee depreciation during the
quarter will have an impact on margins QoQ as well as YoY.
Crude oil prices rise QoQ mainly on the back of Iran supply uncertainty
This quarter witnessed various events supporting the upward trajectory
in crude oil prices. Developments like tough sanctions on Iran and
lower production from countries like Venezuela have led to fears of
further tightening of oil supply. Also, a limited increase in production
from other Opec countries led to an increase in crude oil prices. As a
result, Brent crude prices ended up 7.7% QoQ from US$77/bbl in
Q1FY19 to US$83/bbl in Q2FY19. Average Brent crude increased
marginally to US$75.3/bbl in Q2FY19. We expect upstream oil
companies to bear subsidy burden, which will lead to a decline in their
net realisations QoQ. We estimate gross crude oil under-recoveries at
| 12446 crore with respective shares of government and upstream
sector at | 10812.2 crore and | 1633.9 crore, respectively.
Weak spreads QoQ for important products to pull GRMs in Q2FY19
Benchmark Singapore GRMs remained flattish during the quarter at
US$6.1/bbl in Q2FY19. However, product spreads for important
petroleum products for Indian refiners weakened in Q2FY19. Crack
spreads for gasoline (petrol) declined by US$0.2/bbl QoQ to
US$13.2/bbl, spreads for gas oil (diesel major product for Indian
refiners) declined by US$0.3/bbl. Thus, this had an impact on
operational GRMs of OMCs. However, inventory gains would continue
to provide some support to GRMs of OMCs. Marketing margins of
OMCs were stable QoQ. We assume an average growth rate of ~5%
YoY for marketing volumes of major petroleum products.
Exhibit 29: Estimates for Q2FY19E: (Oil and Gas) (| Crore)
Revenue EBITDA PAT
Q2FY19E YoY QoQ Q2FY19E YoY QoQ Q2FY19E YoY QoQ
Bharat Petroleum 90,786.7 41.6 10.1 3,596.6 2.0 -7.2 2,106.8 -10.6 -8.1
Castrol India Ltd 932.7 8.3 -8.3 226.3 -10.8 -10.1 151.1 -15.2 -8.0
Gail India 18,803.4 51.5 8.7 2,215.6 7.1 -1.2 1,423.9 8.7 13.1
Gujarat Gas 1,898.3 36.4 7.5 230.2 13.6 -7.4 83.5 36.8 -31.2
GSPL 377.3 12.7 -3.6 325.3 13.9 -5.4 174.7 -1.3 20.9
Gulf Oil 382.2 18.4 -2.1 61.3 -1.0 -5.0 38.3 -5.3 -4.6
HPCL 82,179.2 51.2 12.2 2,875.0 -1.1 -9.9 1,557.6 -10.2 -9.4
Indraprastha Gas Ltd 1,399.5 24.3 8.7 281.1 -0.2 -4.7 170.0 0.7 -3.3
Mahanagar Gas Ltd 710.2 20.8 5.0 209.7 4.7 -0.6 128.0 2.6 -0.3
MRPL 18,393.7 48.1 10.9 835.1 -8.0 2.7 384.6 -19.5 6.3
ONGC 27,073.4 42.8 -0.5 14,799.6 41.4 0.5 6,562.8 27.9 6.8
Petronet LNG 9,945.9 28.0 8.5 847.6 -5.7 -9.3 524.6 -10.9 -10.6
Total 252,882.7 44.8 9.3 26,503.3 20.1 -2.6 13,305.9 7.7 1.3
Company Change (%) Change (%) Change (%)
Source: Company, ICICI Direct Research
Topline & profitability (Coverage universe)
174649
200928
214759
231442
252883
0
40000
80000
120000
160000
200000
240000
280000
320000
Q2FY18
Q3FY18
Q4FY18
Q1FY19
Q2FY19E
| C
rore
0.0
2.0
4.0
6.0
8.0
10.0
12.0
14.0
(%
)
Revenue EBITDA Margin PAT Margin
Singapore gross refining margins (GRMs)
6.1
8.3
7.2 7
6
2
4
6
8
10
Q2FY18 Q3FY18 Q4FY18 Q1FY19 Q2FY19
Refin
ing m
argin
s (U
S$ per bbl)
Average Brent crude oil prices
51.7
61.6
67.0
74.5 75.3
20
30
40
50
60
70
80
Q2FY18 Q3FY18 Q4FY18 Q1FY19 Q2FY19
US
$ per bbl
Top picks of sector
Petronet LNG
GAIL
Research Analyst
Mayur Matani
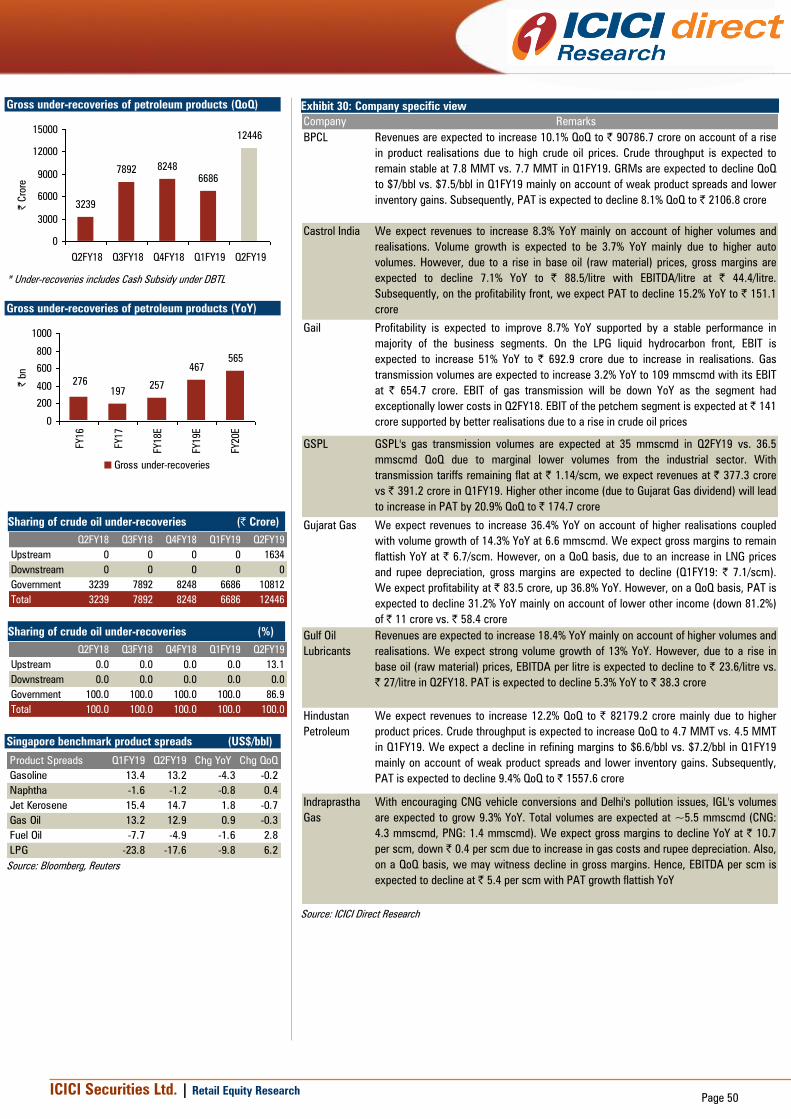
ICICI Securities Ltd. | Retail Equity ResearchPage 50
Exhibit 30: Company specific view
Company Remarks
BPCL Revenues are expected to increase 10.1% QoQ to | 90786.7 crore on account of a rise
in product realisations due to high crude oil prices. Crude throughput is expected to
remain stable at 7.8 MMT vs. 7.7 MMT in Q1FY19. GRMs are expected to decline QoQ
to $7/bbl vs. $7.5/bbl in Q1FY19 mainly on account of weak product spreads and lower
inventory gains. Subsequently, PAT is expected to decline 8.1% QoQ to | 2106.8 crore
Castrol India We expect revenues to increase 8.3% YoY mainly on account of higher volumes and
realisations. Volume growth is expected to be 3.7% YoY mainly due to higher auto
volumes. However, due to a rise in base oil (raw material) prices, gross margins are
expected to decline 7.1% YoY to | 88.5/litre with EBITDA/litre at | 44.4/litre.
Subsequently, on the profitability front, we expect PAT to decline 15.2% YoY to | 151.1
crore
Gail Profitability is expected to improve 8.7% YoY supported by a stable performance in
majority of the business segments. On the LPG liquid hydrocarbon front, EBIT is
expected to increase 51% YoY to | 692.9 crore due to increase in realisations. Gas
transmission volumes are expected to increase 3.2% YoY to 109 mmscmd with its EBIT
at | 654.7 crore. EBIT of gas transmission will be down YoY as the segment had
exceptionally lower costs in Q2FY18. EBIT of the petchem segment is expected at | 141
crore supported by better realisations due to a rise in crude oil prices
GSPL GSPL's gas transmission volumes are expected at 35 mmscmd in Q2FY19 vs. 36.5
mmscmd QoQ due to marginal lower volumes from the industrial sector. With
transmission tariffs remaining flat at | 1.14/scm, we expect revenues at | 377.3 crore
vs | 391.2 crore in Q1FY19. Higher other income (due to Gujarat Gas dividend) will lead
to increase in PAT by 20.9% QoQ to | 174.7 crore
Gujarat Gas We expect revenues to increase 36.4% YoY on account of higher realisations coupled
with volume growth of 14.3% YoY at 6.6 mmscmd. We expect gross margins to remain
flattish YoY at | 6.7/scm. However, on a QoQ basis, due to an increase in LNG prices
and rupee depreciation, gross margins are expected to decline (Q1FY19: | 7.1/scm).
We expect profitability at | 83.5 crore, up 36.8% YoY. However, on a QoQ basis, PAT is
expected to decline 31.2% YoY mainly on account of lower other income (down 81.2%)
of | 11 crore vs. | 58.4 crore
Gulf Oil
Lubricants
Revenues are expected to increase 18.4% YoY mainly on account of higher volumes and
realisations. We expect strong volume growth of 13% YoY. However, due to a rise in
base oil (raw material) prices, EBITDA per litre is expected to decline to | 23.6/litre vs.
| 27/litre in Q2FY18. PAT is expected to decline 5.3% YoY to | 38.3 crore
Hindustan
Petroleum
We expect revenues to increase 12.2% QoQ to | 82179.2 crore mainly due to higher
product prices. Crude throughput is expected to increase QoQ to 4.7 MMT vs. 4.5 MMT
in Q1FY19. We expect a decline in refining margins to $6.6/bbl vs. $7.2/bbl in Q1FY19
mainly on account of weak product spreads and lower inventory gains. Subsequently,
PAT is expected to decline 9.4% QoQ to | 1557.6 crore
Indraprastha
Gas
With encouraging CNG vehicle conversions and Delhi's pollution issues, IGL's volumes
are expected to grow 9.3% YoY. Total volumes are expected at ~5.5 mmscmd (CNG:
4.3 mmscmd, PNG: 1.4 mmscmd). We expect gross margins to decline YoY at | 10.7
per scm, down | 0.4 per scm due to increase in gas costs and rupee depreciation. Also,
on a QoQ basis, we may witness decline in gross margins. Hence, EBITDA per scm is
expected to decline at | 5.4 per scm with PAT growth flattish YoY
Source: ICICI Direct Research
Gross under-recoveries of petroleum products (QoQ)
3239
78928248
6686
12446
0
3000
6000
9000
12000
15000
Q2FY18 Q3FY18 Q4FY18 Q1FY19 Q2FY19
| C
rore
* Under-recoveries includes Cash Subsidy under DBTL
Gross under-recoveries of petroleum products (YoY)
197257
467
565
276
0
200
400
600
800
1000
FY16
FY17
FY18E
FY19E
FY20E
| bn
Gross under-recoveries
Sharing of crude oil under-recoveries (| Crore)
Q2FY18 Q3FY18 Q4FY18 Q1FY19 Q2FY19
Upstream 0 0 0 0 1634
Downstream 0 0 0 0 0
Government 3239 7892 8248 6686 10812
Total 3239 7892 8248 6686 12446
Sharing of crude oil under-recoveries (%)
Q2FY18 Q3FY18 Q4FY18 Q1FY19 Q2FY19
Upstream 0.0 0.0 0.0 0.0 13.1
Downstream 0.0 0.0 0.0 0.0 0.0
Government 100.0 100.0 100.0 100.0 86.9
Total 100.0 100.0 100.0 100.0 100.0
Singapore benchmark product spreads (US$/bbl)
Product Spreads Q1FY19 Q2FY19 Chg YoY Chg QoQ
Gasoline 13.4 13.2 -4.3 -0.2
Naphtha -1.6 -1.2 -0.8 0.4
Jet Kerosene 15.4 14.7 1.8 -0.7
Gas Oil 13.2 12.9 0.9 -0.3
Fuel Oil -7.7 -4.9 -1.6 2.8
LPG -23.8 -17.6 -9.8 6.2
Source: Bloomberg, Reuters

ICICI Securities Ltd. | Retail Equity ResearchPage 51
Exhibit 31: Company specific view
Mahanagar
Gas
We expect MGL's growth momentum to remain steady with volume growth of 6.3% YoY
supported by robust conversion rate of CNG vehicles. Volumes are expected at 2.9
mmscmd (CNG: 2.1 mmscmd, PNG: 0.8 mmscmd). Gross margins are expected to
decline QoQ to | 12.3 per scm in Q2FY19 (stable YoY) vs. | 12.5 per scm in Q1FY19.
Higher other expenses YoY will have an impact, which will lead to only marginal
increase of 2.6% YoY in PAT to | 128 crore
MRPL Reported GRMs are expected at $8.6/bbl vs. $8.3/bbl in Q4FY18. Although there was
QoQ improvement in reported GRMs, core operational GRMs are expected to remain
weak at $5.4/bbl in Q4FY18 mainly on account of weak product spreads. Inventory
gains for the quarter are expected at $3.2/bbl vs. $3.5/bbl in Q1FY19. Throughput in
Q2FY19 is expected at 3.7 MMT vs. 3.9 MMT in Q1FY19. PAT is expected to increase
6.3% QoQ to | 384.6 crore owing to a marginal lower tax rate
ONGC Oil & gas production is expected to witness QoQ growth of 0.5% and 4.5%, respectively.
While oil production is estimated at 6.3 MMT, gas output is expected at 6.5 MMT in
Q2FY19. We expect gross realisations to improve 0.8% QoQ at $74.8/bbl due to rise in
crude oil prices. However, net realisation is expected to decline 7% QoQ to $69/bbl due
to subsidy burden of $5.8/bbl (| 1430 crore). PAT is expected to increase 6.8% QoQ to |
6562.8 crore mainly on higher other income
Petronet LNG We expect the topline to increase 28% YoY to | 9945.9 crore on account of higher LNG
realisation. Total volumes are expected to remain flattish YoY as well as QoQ to 221.5
trillion British thermal units (tbtu) (~4.2 MMT). Blended margins are expected to
decline 1.6% YoY to | 46/mmbtu mainly due to lower margins on relatively costlier spot
LNG. PAT is expected to decline 10.9% YoY to | 524.6 crore also due to higher other
expenses
Source: ICICI Direct Research
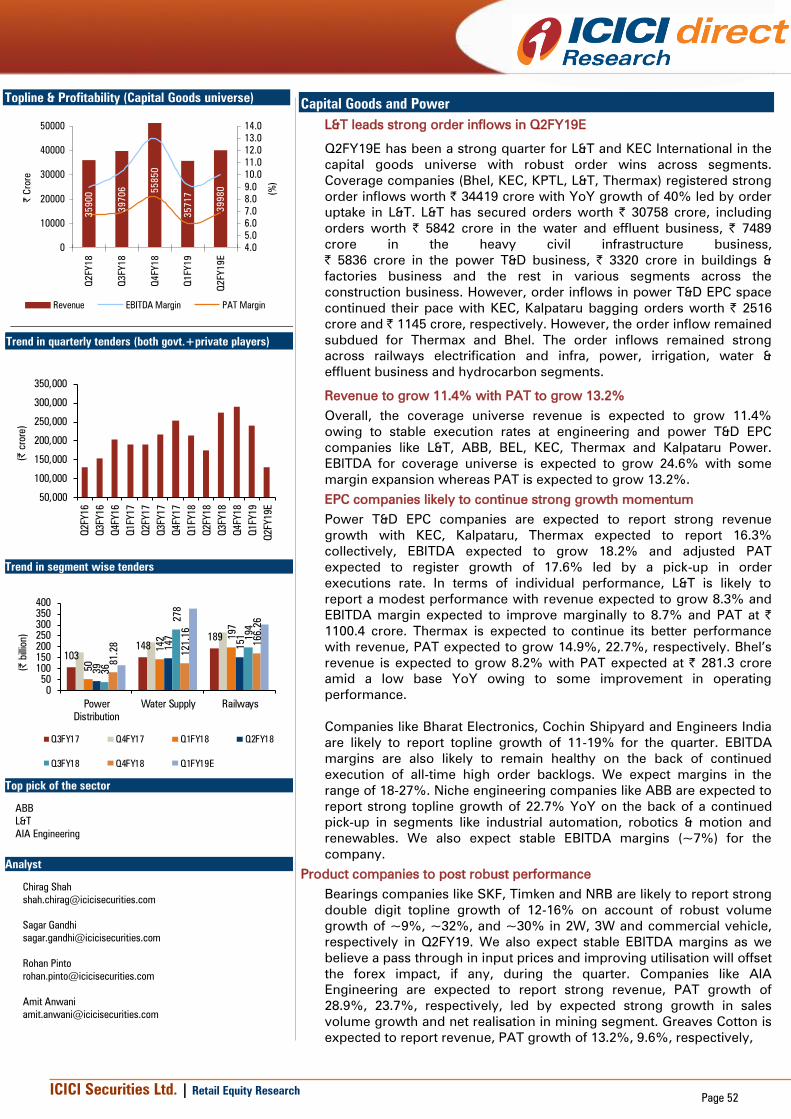
ICICI Securities Ltd. | Retail Equity ResearchPage 52
Capital Goods and Power
L&T leads strong order inflows in Q2FY19E
Q2FY19E has been a strong quarter for L&T and KEC International in the
capital goods universe with robust order wins across segments.
Coverage companies (Bhel, KEC, KPTL, L&T, Thermax) registered strong
order inflows worth | 34419 crore with YoY growth of 40% led by order
uptake in L&T. L&T has secured orders worth | 30758 crore, including
orders worth | 5842 crore in the water and effluent business, | 7489
crore in the heavy civil infrastructure business,
| 5836 crore in the power T&D business, | 3320 crore in buildings &
factories business and the rest in various segments across the
construction business. However, order inflows in power T&D EPC space
continued their pace with KEC, Kalpataru bagging orders worth | 2516
crore and | 1145 crore, respectively. However, the order inflow remained
subdued for Thermax and Bhel. The order inflows remained strong
across railways electrification and infra, power, irrigation, water &
effluent business and hydrocarbon segments.
Revenue to grow 11.4% with PAT to grow 13.2%
Overall, the coverage universe revenue is expected to grow 11.4%
owing to stable execution rates at engineering and power T&D EPC
companies like L&T, ABB, BEL, KEC, Thermax and Kalpataru Power.
EBITDA for coverage universe is expected to grow 24.6% with some
margin expansion whereas PAT is expected to grow 13.2%.
EPC companies likely to continue strong growth momentum
Power T&D EPC companies are expected to report strong revenue
growth with KEC, Kalpataru, Thermax expected to report 16.3%
collectively, EBITDA expected to grow 18.2% and adjusted PAT
expected to register growth of 17.6% led by a pick-up in order
executions rate. In terms of individual performance, L&T is likely to
report a modest performance with revenue expected to grow 8.3% and
EBITDA margin expected to improve marginally to 8.7% and PAT at |
1100.4 crore. Thermax is expected to continue its better performance
with revenue, PAT expected to grow 14.9%, 22.7%, respectively. Bhel’s
revenue is expected to grow 8.2% with PAT expected at | 281.3 crore
amid a low base YoY owing to some improvement in operating
performance.
Companies like Bharat Electronics, Cochin Shipyard and Engineers India
are likely to report topline growth of 11-19% for the quarter. EBITDA
margins are also likely to remain healthy on the back of continued
execution of all-time high order backlogs. We expect margins in the
range of 18-27%. Niche engineering companies like ABB are expected to
report strong topline growth of 22.7% YoY on the back of a continued
pick-up in segments like industrial automation, robotics & motion and
renewables. We also expect stable EBITDA margins (~7%) for the
company.
Product companies to post robust performance
Bearings companies like SKF, Timken and NRB are likely to report strong
double digit topline growth of 12-16% on account of robust volume
growth of ~9%, ~32%, and ~30% in 2W, 3W and commercial vehicle,
respectively in Q2FY19. We also expect stable EBITDA margins as we
believe a pass through in input prices and improving utilisation will offset
the forex impact, if any, during the quarter. Companies like AIA
Engineering are expected to report strong revenue, PAT growth of
28.9%, 23.7%, respectively, led by expected strong growth in sales
volume growth and net realisation in mining segment. Greaves Cotton is
expected to report revenue, PAT growth of 13.2%, 9.6%, respectively,
Topline & Profitability (Capital Goods universe)
35
90
0
39
70
6 55
85
0
35
71
7
39
98
0
0
10000
20000
30000
40000
50000
Q2
FY
18
Q3
FY
18
Q4
FY
18
Q1
FY
19
Q2
FY
19
E
| C
rore
4.0
5.0
6.0
7.0
8.0
9.0
10.0
11.0
12.0
13.0
14.0
(%
)
Revenue EBITDA Margin PAT Margin
Trend in quarterly tenders (both govt.+private players)
50,000
100,000
150,000
200,000
250,000
300,000
350,000
Q2FY16
Q3FY16
Q4FY16
Q1FY17
Q2FY17
Q3FY17
Q4FY17
Q1FY18
Q2FY18
Q3FY18
Q4FY18
Q1FY19
Q2FY19E
(| crore)
Trend in segment wise tenders
103
148
189
50
142 1
97
39
147
151
36
278
194
81.28
121.16
166.26
0
50
100
150
200
250
300
350
400
Power
Distribution
Water Supply Railways
(| billion)
Q3FY17 Q4FY17 Q1FY18 Q2FY18
Q3FY18 Q4FY18 Q1FY19E
Top pick of the sector
ABB
L&T
AIA Engineering
Analyst
Chirag Shah
Sagar Gandhi
Rohan Pinto
Amit Anwani

ICICI Securities Ltd. | Retail Equity ResearchPage 53
backed by volume growth amid a low base pickup in 3-W segment with OEM
customers and better growth in the non-auto segment.
The interest expense for the coverage universe is expected to decline 8.2%
in Q2FY19E. Interest rates are expected to harden in coming quarters as
rising input cost and focus on execution are likely to increase working capital
cycle.
The I-direct power sector universe is expected to report a mixed bag
performance. The revenue and EBITDA of the sector is expected to grow
9.4% and 5.6% YoY. From an individual company perspective, NTPC has
added capacity to the tune of 800 MW in Q2FY19E vs. yearly addition
guidance of 4500 MW of capacity commercialisation. Maintenance and lower
coal stock have adversely impacted gross generation growth of 1.9% YoY in
Q2FY19E. We expect revenues to grow 6.9%, YoY on back of rise in tariff,
whereas EBITDA is expected to remain muted. Power Grid, on the other
hand, is expected to report capitalisation in the range of | 6000-7000 crore
whereas overall revenues and PAT are expected to grow 14.9% and 13.1%
YoY. CESC is backed by strong generation growth in subsidiaries is likely to
report strong energy sold growth of ~12% YoY. Hence, we expect revenues
and PAT of CESC to grow 13.4% and 9.7% YoY.
Exhibit 32: Estimates for Q2FY19E (Capital Goods) (| Crore)
Revenue EBITDA PAT
Q2FY19E YoY QoQ Q2FY19E YoY QoQ Q2FY19E YoY QoQ
AIA Engineering 720.8 28.9 0.8 151.4 34.7 -2.3 107.1 23.6 0.6
Bharat Electronics 2,742.8 10.8 30.5 543.2 -8.7 74.9 355.4 -13.8 97.7
ABB India 2,350.0 22.7 -13.4 164.0 22.2 -16.3 98.7 18.4 -3.3
BHEL 6,929.7 8.2 16.8 342.8 LP 19.3 281.3 114.0 80.8
Cochin Shipyard Ltd 693.4 18.9 5.3 124.8 32.2 8.2 115.0 14.8 8.0
Engineers India Ltd 497.3 15.9 -13.3 144.2 3.8 67.0 123.8 3.9 42.9
Greaves Cotton 512.2 13.2 11.8 72.7 7.2 19.4 49.3 9.8 23.7
Elgi Equipments 440.0 18.0 6.4 48.8 9.1 24.0 26.0 -1.7 40.8
Grindwell Norton 395.5 14.9 3.8 67.0 15.7 -3.3 41.4 15.9 -5.0
Kalpataru Power 1,493.9 22.2 12.8 162.8 22.5 3.7 81.2 13.6 0.2
KEC Internnational 2,420.3 13.5 15.0 251.7 16.6 16.4 105.1 17.7 21.1
KSB Pumps 235.6 17.5 -7.1 27.1 28.3 -5.2 14.0 20.5 -34.6
L&T 17,180.9 8.3 13.2 1,494.7 14.2 20.7 1,100.4 11.5 20.7
NRB Bearings 240.4 15.5 2.8 44.3 15.8 -0.2 24.0 13.6 -30.9
SKF India 769.1 13.1 1.9 121.5 9.4 4.7 81.6 10.3 0.8
Thermax Ltd 993.0 15.0 16.9 99.3 15.3 69.3 69.7 22.6 55.2
Timken India 354.6 14.3 -7.5 59.2 10.1 -0.1 33.5 -10.0 6.0
Va Tech Wabag 1,010.3 14.0 46.9 82.8 6.9 101.3 40.5 9.7 221.4
Total 39,979.9 11.4 11.9 4,002.5 24.6 22.0 2,748.2 13.3 28.1
Change (%)
Company
Change (%) Change (%)
Source: Company, ICICI Direct Research
Exhibit 33: Estimates for Q2FY19E (Power) (| Crore)
Revenue EBITDA PAT
Q2FY19E YoY QoQ Q2FY19E YoY QoQ Q2FY19E YoY QoQ
CESC 2,367.8 13.4 9.7 542.2 7.4 9.5 270.8 9.7 48.8
NTPC 21,385.9 6.9 -6.1 5,870.2 -0.6 -2.8 2,409.7 -16.7 -6.2
Power Grid Corp 8,447.3 14.9 3.9 7,306.9 11.1 5.5 2,433.8 13.1 8.6
Total 32,201.0 9.4 -2.6 13,719.4 5.6 1.9 5,114.3 -3.4 2.5
Change (%) Change (%) Change (%)
Company
Source: Company, ICICI Direct Research
Topline & Profitability (Power universe)
29
43
8
29
98
7
32
70
7
33
05
4
32
20
1
0
5000
10000
15000
20000
25000
30000
Q2
FY1
8
Q3
FY1
8
Q4
FY1
8
Q1
FY1
9
Q2
FY1
9E
| C
rore
0.0
5.0
10.0
15.0
20.0
25.0
30.0
35.0
40.0
45.0
50.0
(%
)
Revenue EBITDA Margin
PAT Margin

ICICI Securities Ltd. | Retail Equity ResearchPage 54
Exhibit 34: Company specific view: Capital Goods
Company Remarks
AIA Engineering In Q2FY19E, we expect AIA Engineering to report volume growth of 19% to 64938
tonnes on a YoY basis, mainly led by a ramp up in the mining segment. We expect
realisation per tonne to improve 8.2% YoY to | 107605 per tonne during the quarter
on account of a change in product mix and favourable exchange rate gains. As a
result, revenues are expected to grow 28.9% to | 720.8 crore. EBITDA margin is
expected to improve marginally YoY at 21%. Consequently, PAT is expected to
grow 23.7% to | 107.1 crore. EBITDA per tonne is expected at | 23308.4
Bharat
Electronics
We expect BEL to report topline growth of 10.8% YoY to | 2742.8 crore on the back
of continued execution of orders like electronic voting machines, voter verifiable
paper audit trail, integrated air command and control system, L70 gun upgrade, etc.
However, absolute EBITDA is likely to decline 8.7% YoY, as Q2FY18 witnessed
strong execution during the quarter. We expect EBITDA margins of 19.8% vs. 24%
YoY. PAT is also likely to decline 13.8% YoY to | 355.4 crore due to declining other
income (~40% YoY) of the company
ABB We expect ABB to report strong topline growth of 22.7% YoY to | 2350 crore, on
the back of a continued pick-up in industrial automation, robotics & motion and
renewables segment. EBITDA margins are also expected to remain strong at 7%
YoY. Absolute PAT is expected at | 98.7 crore, up 18.4% YoY
Bhel In Q2FY19E, Bhel’s order inflow remained muted. However, Bhel was able to sign
technology collaboration agreement with Babcock Power, US for competitive air
pollution control systems for De-NOx application. Revenues are expected to grow
8.2% to | 6929.7 crore amid low base. EBITDA margin is expected at 4.9%.
However, structural changes in the power segment will continue to pose
challenges for Bhel. PAT is expected at | 281.3 crore with PAT margin of 4.1%
Cochin Shipyard We expect CSL to report revenue of | 693.4 crore, up 18.9% YoY on the back of
continued execution of orders like IAC (Phase II), passenger cum cargo vessels,
technology demonstrator vessel, etc. We also expect healthy EBITDA margins of
18% vs. 16.2% YoY on account of higher proportion of ship repair revenues during
the quarter. Thus, EBITDA is likely to grow strong at 32.2% YoY. Other income is
likely to decline 16.3% YoY. Thus, PAT is expected to grow 14.8% YoY to | 115
crore
Engineers India We expect EIL to report topline growth of 15.9% YoY to | 497.3 crore on the back
of continued execution in the both consultancy and turnkey segment. EBITDA
margins are also expected to remain strong at 29% for the quarter. However,
EBITDA is likely to grow only 3.8% YoY to high base effect (EBITDA margins of 32%
in Q2FY18E). PAT is expected to grow 3.9% YoY to | 123.8 crore
Greaves Cotton For Q2FY19E, we expect Greaves Cotton to report reasonable volumes 77443 in 3W
(passenger, goods) while 4W volumes are expected to be in the range of 9960 unit
owning to the expected improved performance by its OEM customers in 3W
(passenger and goods segment) while non-auto segment is likely to post strong
growth. Revenues are expected to grow 13.2% YoY to | 512.2 crore. EBITDA
margins are expected at 14.2%. Adjusted PAT is expected to grow 9.6% YoY to |
49.3 crore with PAT margin of 9.8%
Elgi Equipments Elgi Equipments is expected to report topline growth of 18.0% YoY to | 440 crore
on the back of expected growth of 13% in domestic air compressor segment and a
26% growth in the international air compressor segment. EBITDA margins are
expected at 11.1% vs. 12.0% YoY due to higher employee expenses and raw
material cost impacting margins. Accordingly, EBITDA is expected to grow at 9.1%
YoY while PAT growth is expected to remain broadly flat. We expect absolute PAT
of | 26.0 crore for the quarter.
Source: Company, ICICI Direct Research
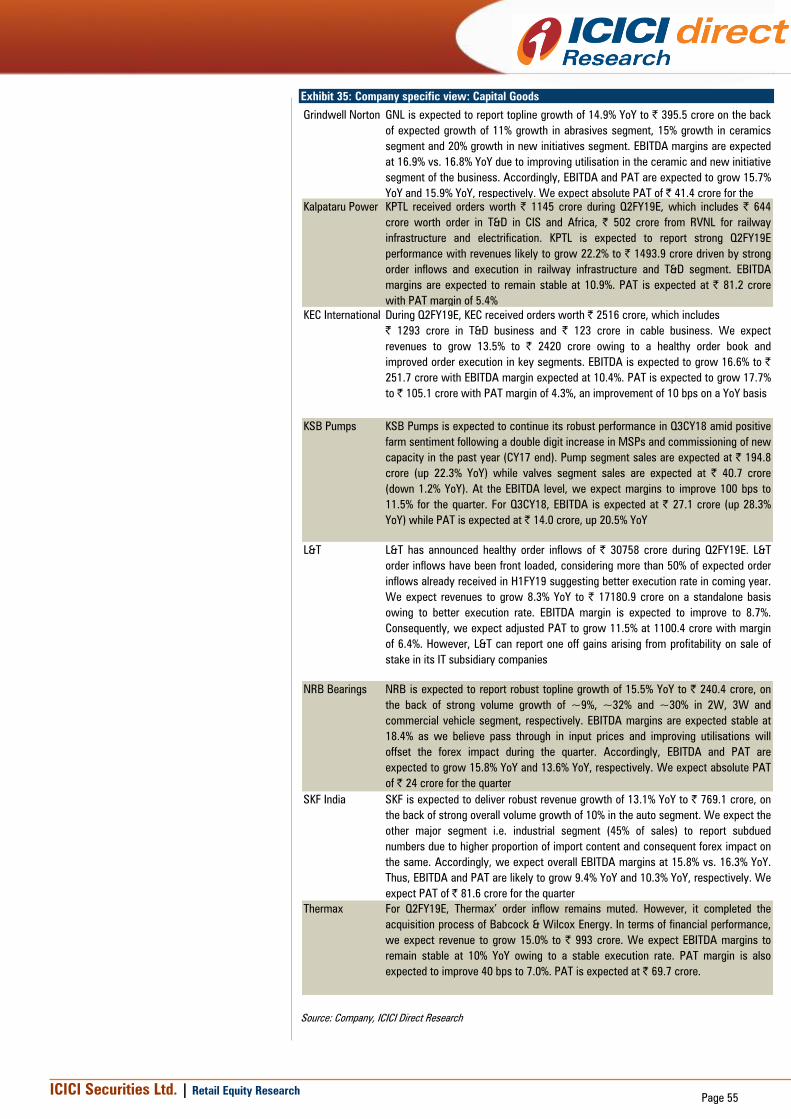
ICICI Securities Ltd. | Retail Equity ResearchPage 55
Exhibit 35: Company specific view: Capital Goods
Grindwell Norton GNL is expected to report topline growth of 14.9% YoY to | 395.5 crore on the back
of expected growth of 11% growth in abrasives segment, 15% growth in ceramics
segment and 20% growth in new initiatives segment. EBITDA margins are expected
at 16.9% vs. 16.8% YoY due to improving utilisation in the ceramic and new initiative
segment of the business. Accordingly, EBITDA and PAT are expected to grow 15.7%
YoY and 15.9% YoY, respectively. We expect absolute PAT of | 41.4 crore for the
Kalpataru Power KPTL received orders worth | 1145 crore during Q2FY19E, which includes | 644
crore worth order in T&D in CIS and Africa, | 502 crore from RVNL for railway
infrastructure and electrification. KPTL is expected to report strong Q2FY19E
performance with revenues likely to grow 22.2% to | 1493.9 crore driven by strong
order inflows and execution in railway infrastructure and T&D segment. EBITDA
margins are expected to remain stable at 10.9%. PAT is expected at | 81.2 crore
with PAT margin of 5.4%
KEC International During Q2FY19E, KEC received orders worth | 2516 crore, which includes
| 1293 crore in T&D business and | 123 crore in cable business. We expect
revenues to grow 13.5% to | 2420 crore owing to a healthy order book and
improved order execution in key segments. EBITDA is expected to grow 16.6% to |
251.7 crore with EBITDA margin expected at 10.4%. PAT is expected to grow 17.7%
to | 105.1 crore with PAT margin of 4.3%, an improvement of 10 bps on a YoY basis
KSB Pumps KSB Pumps is expected to continue its robust performance in Q3CY18 amid positive
farm sentiment following a double digit increase in MSPs and commissioning of new
capacity in the past year (CY17 end). Pump segment sales are expected at | 194.8
crore (up 22.3% YoY) while valves segment sales are expected at | 40.7 crore
(down 1.2% YoY). At the EBITDA level, we expect margins to improve 100 bps to
11.5% for the quarter. For Q3CY18, EBITDA is expected at | 27.1 crore (up 28.3%
YoY) while PAT is expected at | 14.0 crore, up 20.5% YoY
L&T L&T has announced healthy order inflows of | 30758 crore during Q2FY19E. L&T
order inflows have been front loaded, considering more than 50% of expected order
inflows already received in H1FY19 suggesting better execution rate in coming year.
We expect revenues to grow 8.3% YoY to | 17180.9 crore on a standalone basis
owing to better execution rate. EBITDA margin is expected to improve to 8.7%.
Consequently, we expect adjusted PAT to grow 11.5% at 1100.4 crore with margin
of 6.4%. However, L&T can report one off gains arising from profitability on sale of
stake in its IT subsidiary companies
NRB Bearings NRB is expected to report robust topline growth of 15.5% YoY to | 240.4 crore, on
the back of strong volume growth of ~9%, ~32% and ~30% in 2W, 3W and
commercial vehicle segment, respectively. EBITDA margins are expected stable at
18.4% as we believe pass through in input prices and improving utilisations will
offset the forex impact during the quarter. Accordingly, EBITDA and PAT are
expected to grow 15.8% YoY and 13.6% YoY, respectively. We expect absolute PAT
of | 24 crore for the quarter
SKF India SKF is expected to deliver robust revenue growth of 13.1% YoY to | 769.1 crore, on
the back of strong overall volume growth of 10% in the auto segment. We expect the
other major segment i.e. industrial segment (45% of sales) to report subdued
numbers due to higher proportion of import content and consequent forex impact on
the same. Accordingly, we expect overall EBITDA margins at 15.8% vs. 16.3% YoY.
Thus, EBITDA and PAT are likely to grow 9.4% YoY and 10.3% YoY, respectively. We
expect PAT of | 81.6 crore for the quarter
Thermax For Q2FY19E, Thermax’ order inflow remains muted. However, it completed the
acquisition process of Babcock & Wilcox Energy. In terms of financial performance,
we expect revenue to grow 15.0% to | 993 crore. We expect EBITDA margins to
remain stable at 10% YoY owing to a stable execution rate. PAT margin is also
expected to improve 40 bps to 7.0%. PAT is expected at | 69.7 crore.
Source: Company, ICICI Direct Research
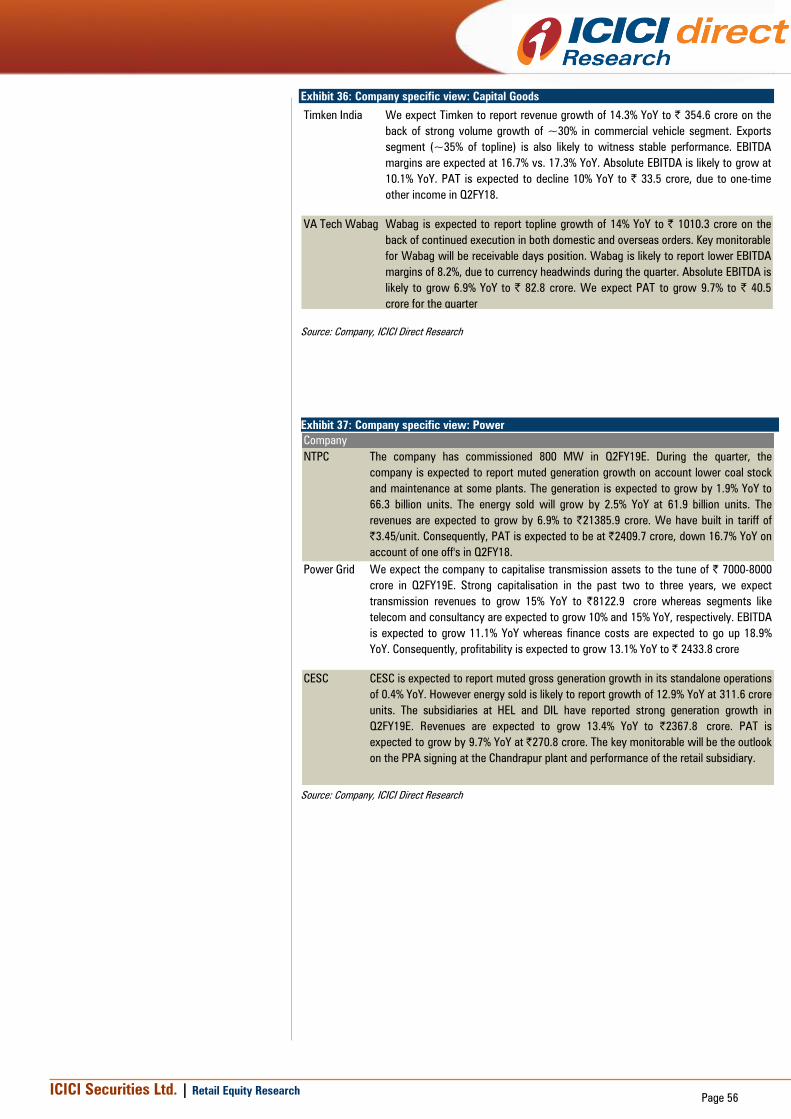
ICICI Securities Ltd. | Retail Equity ResearchPage 56
Exhibit 36: Company specific view: Capital Goods
Timken India We expect Timken to report revenue growth of 14.3% YoY to | 354.6 crore on the
back of strong volume growth of ~30% in commercial vehicle segment. Exports
segment (~35% of topline) is also likely to witness stable performance. EBITDA
margins are expected at 16.7% vs. 17.3% YoY. Absolute EBITDA is likely to grow at
10.1% YoY. PAT is expected to decline 10% YoY to | 33.5 crore, due to one-time
other income in Q2FY18.
VA Tech Wabag Wabag is expected to report topline growth of 14% YoY to | 1010.3 crore on the
back of continued execution in both domestic and overseas orders. Key monitorable
for Wabag will be receivable days position. Wabag is likely to report lower EBITDA
margins of 8.2%, due to currency headwinds during the quarter. Absolute EBITDA is
likely to grow 6.9% YoY to | 82.8 crore. We expect PAT to grow 9.7% to | 40.5
crore for the quarter
Source: Company, ICICI Direct Research
Exhibit 37: Company specific view: Power
Company
NTPC The company has commissioned 800 MW in Q2FY19E. During the quarter, the
company is expected to report muted generation growth on account lower coal stock
and maintenance at some plants. The generation is expected to grow by 1.9% YoY to
66.3 billion units. The energy sold will grow by 2.5% YoY at 61.9 billion units. The
revenues are expected to grow by 6.9% to |21385.9 crore. We have built in tariff of
|3.45/unit. Consequently, PAT is expected to be at |2409.7 crore, down 16.7% YoY on
account of one off's in Q2FY18.
Power Grid We expect the company to capitalise transmission assets to the tune of | 7000-8000
crore in Q2FY19E. Strong capitalisation in the past two to three years, we expect
transmission revenues to grow 15% YoY to |8122.9 crore whereas segments like
telecom and consultancy are expected to grow 10% and 15% YoY, respectively. EBITDA
is expected to grow 11.1% YoY whereas finance costs are expected to go up 18.9%
YoY. Consequently, profitability is expected to grow 13.1% YoY to | 2433.8 crore
CESC CESC is expected to report muted gross generation growth in its standalone operations
of 0.4% YoY. However energy sold is likely to report growth of 12.9% YoY at 311.6 crore
units. The subsidiaries at HEL and DIL have reported strong generation growth in
Q2FY19E. Revenues are expected to grow 13.4% YoY to |2367.8 crore. PAT is
expected to grow by 9.7% YoY at |270.8 crore. The key monitorable will be the outlook
on the PPA signing at the Chandrapur plant and performance of the retail subsidiary.
Source: Company, ICICI Direct Research

ICICI Securities Ltd. | Retail Equity ResearchPage 57
Real Estate
Rise in sales volumes & launches hint at improving RE sentiment…
Home buyer sentiment seems to have improved with residential real
estate sales volumes rising 3.0% YoY in H1 2018 (as per Knight
Frank report) after slumping consequently for the past two years.
The recent sharp depreciation (~13% YTD) in the rupee could act as
a strong tailwind for NRI demand. Even on the project launches
front, there was an improvement in H1 2018. As per the report,
residential launches in top eight cities in H1 2018 grew 46% YoY to
126000 units, led by Mumbai market, which accounted for 40% of
these launches. In terms of commercial real estate market, it
recorded 24 million sq ft (msf) space absorption in H1 2018. All
these data are indicating early signs of a recovery in demand
environment in the overall Indian real estate market.
Sunteck shines in Naigaon; sales volumes of RE universe to
improve…
We expect sales volumes of our universe to post robust growth of
86.7% to 25.5 lakh sq ft (lsf) in Q2FY19E led by 857.8% growth in
sales volumes of Sunteck Realty to 10.44 lakh sq ft on account of
robust sales at its Naigaon project. Sobha reported strong sales
volume of 10.31 lsf in Q2FY19. Furthermore, we expect Mahindra
Lifespace to report stable sales volume growth of 27.3% YoY to 2.8
lsf. Overall, with a gradual improvement in consumer sentiments, we
expect stable sales volumes in the real estate sector largely led by
the affordable housing segment, going forward.
Bottomline of real estate coverage universe to grow 23.1% YoY...
Real estate universe revenues are expected to grow 1.8% YoY to
| 1394.8 crore. However, EBITDA margins of the universe are
expected to grow 490 bps to 32.7%. Consequently, we expect our
universe PAT to grow robustly by 23.1% YoY to | 285.1 crore.
Exhibit 38: Estimates for Q2FY19E (Real Estate) (| crore)
Revenue EBITDA PAT
Q2FY19E YoY QoQ Q2FY19E YoY QoQ Q2FY19E YoY QoQ
Oberoi Realty 403.7 33.9 -54.3 208.9 27.6 -54.3 136.9 31.2 -55.1
Mahindra Lifespace 107.3 41.7 -19.3 -6.1 NA PL 14.1 10.4 -7.2
Sobha Dev. 681.4 5.4 14.0 146.7 17.6 12.3 63.1 25.4 19.9
Sunteck Realty 202.4 -41.6 -4.1 107.0 7.8 -4.1 71.0 10.5 -4.0
Total 1,394.8 1.8 -23.6 456.6 19.9 -35.9 285.1 23.1 -36.2
Change (%) Change (%)Change (%)
Company
Source: Company, ICICI Direct Research
Topline & Profitability (Coverage universe)
1371
1393
1464
1826
1395
0.0
7.0
14.0
21.0
28.0
35.0
42.0
900
1200
1500
Q2FY18
Q3FY18
Q4FY18
Q1FY19
Q2FY19E
(%
)
| C
rore
Revenue EBITDA Margin PAT Margin
Sales Volume Trend (Coverage Universe)
8.6 9.3 10.2
9.6
9.7
1.7
1.5
1.3
2.9
1.9
2.2
2.5 3
.6
3.0
2.8
1.1
0.4
0.8
0.9
10.4
0.0
3.0
6.0
9.0
12.0
Q2FY18 Q3FY18 Q4FY18 Q1FY19 Q2FY19E
Sobha Oberoi Realty
Mahindra Lifespace Sunteck Realty
Top pick of sector
Sunteck Realty, Oberoi Realty
Research Analyst
Deepak Purswani, CFA
Harsh Pathak

ICICI Securities Ltd. | Retail Equity ResearchPage 58
Exhibit 39: Company specific view (Real Estate coverage universe)
Company Remarks
Oberoi Realty With a gradual improvement in the demand environment, we expect Oberoi to post
sales volumes of 1.75 lakh sq ft. Further, on the financial front, we expect the
topline to grow at a robust 33.9% YoY to | 403.7 crore with incremental revenues
from SkyCity project & higher sales from completed project. Furthermore, EBITDA
margins are expected to contract 250 bps YoY to 51.7%. With strong topline
growth, we expect bottomline to grow 31.2% YoY to | 136.9 crore
Sobha Ltd Sobha reported strong sales volume growth of 19.7% YoY to 10.31 lakh sq ft led by
strong performance in the Bengaluru market (7.02 lakh sq ft). On the financial front,
we expect the topline to grow moderately by 5.4% YoY to | 681.4 crore. Further,
we expect EBITDA margins to grow 220 bps YoY at 21.5%. Consequently, we
expect the bottomline to grow robustly by 25.4% YoY to | 63.9 crore led by EBITDA
margin expansion
Mahindra
Lifespace
We expect MLD to post stable sales volumes of 2.8 lakh sq ft in Q2FY19E. On the
financial front, we expect MLDL's topline to grow robustly by 41.7% YoY to | 107.3
crore on account of 43.5% YoY growth in residential revenue recognition to ~|
101.6 crore. Furthermore, we expect the bottomline to grow 10.4% YoY to | 10.4
crore due to lower interest costs
Sunteck Realty Sunteck launched Phase-I of Naigaon affordable housing project in Q2FY19
comprising ~2500 units with an average ticket size of ~| 50 lakhs/unit. Out of
these, the company has been able to sell ~800-1000 units, which will lead to
stellar sales volume growth of 857.8% YoY to 10.44 lakh sq mt in Q2FY19E. On the
financial front, we expect topline to de-grow 41.6% YoY to | 202.4.4 crore on
account of high base effect. However, we expect the company's bottomline to
grow 10.5% YoY to | 71.0 crore
Source: Company, ICICI Direct Research
Major News during Q2FY19
Real Estate
Sector
Media reports indicate the government has set a target for
constructing one crore houses under the Pradhan Mantri
Awas Yojana-Gramin (PMAY-G) by 2019
As per media reports, cost of construction for a residential
apartment in a mid-rise building in Mumbai is the highest
among top urban centres in India with an average
construction cost at | 3125 per sq. ft. (psf). This is
followed by Delhi & Pune at | 2750 psf, Chennai &
Bengaluru at | 2500 psf and Hyderabad at | 2375 psf
As per media sources, the Supreme Court had imposed a
ban on all construction activities in Maharashtra, Madhya
Pradesh, Uttarakhand & Chandigarh. However, after a few
days, the apex court lifted the ban in Maharshtra &
Uttarakhand states till the next hearing on October 10,
2018.
Mahindra
Lifespace
Mahindra World City, Chennai (MWCC)-a subsidiary of
Mahindra Lifespace Developers, has launched its premium
residential project Lakewoods. This is the fifth residential
project in MWCC. Lakewoods comprises nine 14-storied
towers with 747 apartments in 2 BHK and 3 BHK
configuration spread across 9.33 acres. Tamil Nadu RERA
approval has been obtained for the first phase of the
project, consisting of 249 units across three towers
Mahindra Lifespace Developers is looking to acquire
distrssed real estate assets across key property markets,
especially in the Delhi-NCR region. As a part of its next
phase of growth, the company wants to strengthen its
footprint in key geographies in India, with primary focus on
Mumbai, Pune & Bengaluru markets and secondary focus
on Hyderabad & Gurgaon markets
Oberoi
Realty
Media reports indicate that Inox has leased out 1 lakh sq ft
in Oberoi's upcoming Borivali mall.
Sobha Ltd
Media reports indicate that Sobha Limited has sought
shareholder's approval to raise ~| 700 crore via non
convertible debentures to fund execution of its real estate
projects.

ICICI Securities Ltd. | Retail Equity ResearchPage 59
Retail
End of season sale to support revenue growth for quarter
We expect our retail coverage universe (excluding Titan) to report steady
revenue growth of 10% in Q2FY19. End of season sale (EOSS) in July-
August and favourable base effect (Q2FY18 was a challenging quarter
owing to GST transition) are expected to provide growth impetus in
Q2FY19. However, due to a delay in festive season by 17-18 days
(Dussehra was in September last year), we expect certain spillover of
revenues to Q3FY19.
Titan, Trent expected to be outperformers this quarter
For Shoppers Stop, Q2FY18 had turned out to be a tough quarter (12%
revenue de-growth) on account of supply side issues as vendors faced
challenges related to GST transition. Hence, on a favourable base, we
expect SSL to report steady SSSG of 4% YoY in Q2FY19. We expect
Aditya Birla Fashion and Retail (ABFRL) to report topline growth of 9%
YoY, led by growth in lifestyle and Pantaloons segment to the tune of
9% and 6%, respectively. We expect Trent to sustain its healthy
trajectory and expect revenues to grow 17% YoY to | 612.4 crore. Also,
inclusion of Zudio (value fashion business) is expected to enhance
revenue growth for Trent. Among speciality retail, we expect Titan’s
jewellery division to report 20% revenue growth driven by new
collection launches and extended diamond studded activation. For Bata,
we expect revenues to increase 10% YoY to | 645.9 crore on the back of
new launches.
Positive operating leverage to assist margin expansion
Due to stock clearance sale in July and August, higher discounting days
are expected to impact gross margins, to a certain extent. However, with
cost rationalisation measures coupled with operating leverage, we
expect EBITDA margins of our coverage universe to increase marginally
by ~50 bps YoY. We expect EBITDA margins of Bata and Trent to
improve 100 bps and 30 bps, respectively. ABFRL had incurred a one-
time expense due to GST impact (| 26 crore) in Q2FY18. Hence, on a
favourable base, we expect margins of ABFRL to expand 140 bps YoY.
For Titan, the company had reported one of its highest ever EBITDA
margins in Q2FY18 (11.5%). Hence, we expect limited scope of margin
expansion in Q2FY19.
Exhibit 40: Estimates for Q2FY19E: (Retail) (| Crore)
Revenue EBITDA PAT
Q2FY19E YoY QoQ Q2FY19E YoY QoQ Q2FY19E YoY QoQ
Aditya Birla Fashion & Retail1961.1 8.7 2.5 129.4 39.2 13.7 14.6 LP 161.34
Bata India 645.9 10.1 -19.0 77.5 20.1 -41.2 50.3 17.2 -39.0
Shopper Stop 903.5 7.9 9.3 51.5 1.7 24.2 13.3 LP 35.8
Titan Company 4,160.2 19.8 -6.5 472.2 18.6 -2.2 328.1 18.2 -0.2
Trent Ltd 612.4 17.3 3.7 60.3 22.1 -15.0 35.9 23.8 -6.4
Total 8,283.1 14.7 -3.4 790.9 20.6 -6.0 442.3 39.2 -4.9
Change (%)Company
Change (%) Change (%)
Source: ICICI Direct Research
Topline & Profitability (Coverage Universe)
7224
8288
7871
8579
8283
0.0
2.0
4.0
6.0
8.0
10.0
12.0
0
1000
2000
3000
4000
5000
6000
7000
Q2FY18
Q3FY18
Q4FY18
Q1FY19
Q2FY19E
(%
)
| C
rore
Revenue EBITDA Margin PAT Margin
Space addition – million square feet ( QoQ)
0.020.03
0.050.06
0.01
-0.13-0.18
0.05
-0.2
-0.1
0
0.1
Q2FY17
Q3FY17
Q4FY17
Q1FY18
Q2FY18
Q3FY18
Q4FY18
Q1FY19
Q2FY19E
Shoppers Stop
Revenue per sq. ft.
2596
1927
23702510
2362 2418 2332
2238
2336
2247
0
500
1000
1500
2000
2500
3000
Q1FY17
Q2FY17
Q3FY17
Q4FY17
Q1FY18
Q2FY18
Q3FY18
Q4FY18
Q1FY19
Q2FY19E
Shoppers Stop
Top picks of the sector
Aditya Birla Fashion & Retail
Trent
Research Analyst
Bharat Chhoda
Cheragh Sidhwa

ICICI Securities Ltd. | Retail Equity ResearchPage 60
Exhibit 41: Company specific view (Retail)
Company Remarks
Bata India We expect Bata to register steady topline growth of 10.1% YoY to | 645.9 crore.
Bata's latest collection 'Red Label', has gained healthy traction and is expected to
provide additional growth impetus this quarter. Controlled operational cost structure
and efforts towards premiumisation of products are expected to enhance EBITDA
margins by 100 bps YoY to 12.0%. Consequently, we expect PAT to increase 17%
YoY to | 50.3 crore
Shoppers
Stop
Q2FY18 had turned out to be a tough quarter for SSL (12% revenue de-growth) on
account of supply side issues as vendors faced challenges related to GST transition.
Hence, on a favourable base, we expect SSL to report steady SSSG of 4% YoY in
Q2FY19. On account of implementation of Ind-As 115, revenues are not exactly
comparable to the previous year. We expect EBITDA margins to decline marginally
by 30 bps YoY to 5.7% on the back of higher discounting days owing to EOSS and
higher employee expense. A decline in interest expense is expected to aid PAT. We
expect SSL to report PAT of | 13.3 crore vs. net loss of | 21.8 crore in Q2FY18 (SSL
had reported exceptional expense worth | 34 crore in Q2FY18)
Titan
Company
We expect Titan's jewellery division to report 20% revenue growth YoY, driven by a
favourable base in July (as per the management, the company reported 41% revenue
growth) and reasonably good August driven by activation of studded jewellery. We
expect the watches division to report revenue growth by 10% YoY. Overall revenues
are expected to increase 20% YoY to | 4160.2 crore. In Q2FY18, Titan had reported
one of its highest ever EBITDA margins. Hence, we expect limited scope of margin
expansion in Q2FY19. EBITDA margins are expected to remain flattish at 11.4% YoY.
PAT is expected to improve 18% YoY to | 328.1 crore
Trent Ltd We expect Trent to sustain its healthy revenue trajectory with revenues expected to
grow 17% YoY to | 612.4 crore on the back of healthy store additions and inclusion
of Zudio (value fashion format) with effect from Q3FY18. Q2 generally witnesses
lower EBITDA margins mainly on account of high discount offering impacting gross
margins negatively. On a YoY basis, we expect EBITDA margins to improve 30 bps
YoY to 9.8% (Q1FY19: 12.0%). PAT is expected to increase 24% YoY to | 35.9 crore
ABFRL We expect ABFRL to report steady topline growth of 9% YoY to | 1961 crore albeit
on a favourable base of Q2FY18 (July and August were impacted due to GST
implementation in Q2FY8). However, a delay in festive season by 17-18 days may
witness a spillover effect in Q3FY18. On the segmental front, we expect lifestyle
brands and Pantaloons to report revenue growth of 9% and 6%, respectively.
Rationalisation of unprofitable stores (F21 Stores) is expected to improve EBITDA
margins by 140 bps YoY to 6.6%. Also, ABFRL had incurred one time GST impact of
| 26 crore in Q2FY18, which had deflated EBITDA, to a certain extent. Consequently
we expect ABFRL to report PAT of | 14.6 crore vs. loss of | 10.0 crore in Q2FY18
Source: Company, ICICI Direct Research
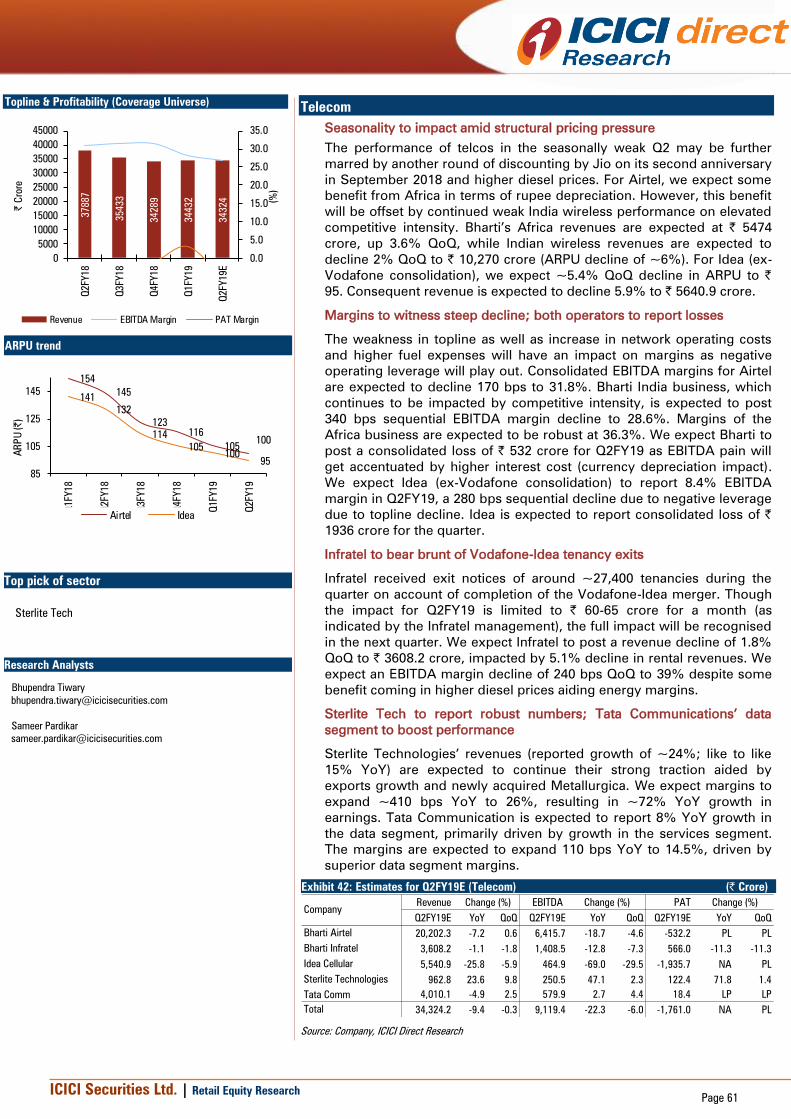
ICICI Securities Ltd. | Retail Equity ResearchPage 61
Telecom
Seasonality to impact amid structural pricing pressure
The performance of telcos in the seasonally weak Q2 may be further
marred by another round of discounting by Jio on its second anniversary
in September 2018 and higher diesel prices. For Airtel, we expect some
benefit from Africa in terms of rupee depreciation. However, this benefit
will be offset by continued weak India wireless performance on elevated
competitive intensity. Bharti’s Africa revenues are expected at | 5474
crore, up 3.6% QoQ, while Indian wireless revenues are expected to
decline 2% QoQ to | 10,270 crore (ARPU decline of ~6%). For Idea (ex-
Vodafone consolidation), we expect ~5.4% QoQ decline in ARPU to |
95. Consequent revenue is expected to decline 5.9% to | 5640.9 crore.
Margins to witness steep decline; both operators to report losses
The weakness in topline as well as increase in network operating costs
and higher fuel expenses will have an impact on margins as negative
operating leverage will play out. Consolidated EBITDA margins for Airtel
are expected to decline 170 bps to 31.8%. Bharti India business, which
continues to be impacted by competitive intensity, is expected to post
340 bps sequential EBITDA margin decline to 28.6%. Margins of the
Africa business are expected to be robust at 36.3%. We expect Bharti to
post a consolidated loss of | 532 crore for Q2FY19 as EBITDA pain will
get accentuated by higher interest cost (currency depreciation impact).
We expect Idea (ex-Vodafone consolidation) to report 8.4% EBITDA
margin in Q2FY19, a 280 bps sequential decline due to negative leverage
due to topline decline. Idea is expected to report consolidated loss of |
1936 crore for the quarter.
Infratel to bear brunt of Vodafone-Idea tenancy exits
Infratel received exit notices of around ~27,400 tenancies during the
quarter on account of completion of the Vodafone-Idea merger. Though
the impact for Q2FY19 is limited to | 60-65 crore for a month (as
indicated by the Infratel management), the full impact will be recognised
in the next quarter. We expect Infratel to post a revenue decline of 1.8%
QoQ to | 3608.2 crore, impacted by 5.1% decline in rental revenues. We
expect an EBITDA margin decline of 240 bps QoQ to 39% despite some
benefit coming in higher diesel prices aiding energy margins.
Sterlite Tech to report robust numbers; Tata Communications’ data
segment to boost performance
Sterlite Technologies’ revenues (reported growth of ~24%; like to like
15% YoY) are expected to continue their strong traction aided by
exports growth and newly acquired Metallurgica. We expect margins to
expand ~410 bps YoY to 26%, resulting in ~72% YoY growth in
earnings. Tata Communication is expected to report 8% YoY growth in
the data segment, primarily driven by growth in the services segment.
The margins are expected to expand 110 bps YoY to 14.5%, driven by
superior data segment margins.
Exhibit 42: Estimates for Q2FY19E (Telecom) (| Crore)
Revenue EBITDA PAT
Q2FY19E YoY QoQ Q2FY19E YoY QoQ Q2FY19E YoY QoQ
Bharti Airtel 20,202.3 -7.2 0.6 6,415.7 -18.7 -4.6 -532.2 PL PL
Bharti Infratel 3,608.2 -1.1 -1.8 1,408.5 -12.8 -7.3 566.0 -11.3 -11.3
Idea Cellular 5,540.9 -25.8 -5.9 464.9 -69.0 -29.5 -1,935.7 NA PL
Sterlite Technologies 962.8 23.6 9.8 250.5 47.1 2.3 122.4 71.8 1.4
Tata Comm 4,010.1 -4.9 2.5 579.9 2.7 4.4 18.4 LP LP
Total 34,324.2 -9.4 -0.3 9,119.4 -22.3 -6.0 -1,761.0 NA PL
Change (%)Change (%) Change (%)
Company
Source: Company, ICICI Direct Research
Topline & Profitability (Coverage Universe)
37887
35433
34289
34432
34324
0.0
5.0
10.0
15.0
20.0
25.0
30.0
35.0
0
5000
10000
15000
20000
25000
30000
35000
40000
45000
Q2FY18
Q3FY18
Q4FY18
Q1FY19
Q2FY19E
(%
)
| C
rore
Revenue EBITDA Margin PAT Margin
ARPU trend
154
145
123
116
105100
141
132
114
105100
95
85
105
125
145
Q1FY18
Q2FY18
Q3FY18
Q4FY18
Q1FY19
Q2FY19
AR
PU
(|)
Airtel Idea
Top pick of sector
Sterlite Tech
Research Analysts
Bhupendra Tiwary
Sameer Pardikar

ICICI Securities Ltd. | Retail Equity ResearchPage 62
Exhibit 43: Company specific view (Telecom)
Company Remarks
Bharti Airtel Bharti's India wireless business is expected to feel the pressure from another round of
discounting by Jio in September 2018 coupled with seasonality effect. In contrast,
revenue pressure may be mitigated, to some extent, by strong revenue growth from
the Africa business, aided by rupee depreciation. India wireless revenues are
expected to decline 2% QoQ at | 10,270 crore. Given the higher network operating
costs (further accentuated by higher fuel costs) and weak topline, we expect ~340
bps sequential decline in India EBITDA margins at 28.6%. Africa revenues are
expected grow 5.9% QoQ to | 5593 crore aided by a depreciating rupee. Africa
margins are expected to be robust at 36.3%. The consequent consolidated margins
are seen at 31.8%, down 170 bps QoQ, mainly impacted by weak India margins
Bharti Infratel Bharti Infratel's performance for the quarter was marred by exit notices received for
~27,000 tenancies (one-month impact) of Vodafone-Idea combine. We expect gross
additions of ~1000 tenancies for the quarter. Due to exit notices received in the
quarter, we factor in net tenancy exits of ~26,000. We expect 5.1% QoQ fall in rental
revenues at | 2085.9 crore. Energy revenues may also grow 3.2% QoQ (largely on
higher diesel prices) at | 1522 crore. Overall margins are expected at 39% (down 230
bps QoQ) owing to tenancy exits
Idea Cellular With another round of discounting by Jio in September 2018 and weakness due to
seasonality, we expect the performance of Idea (ex-Vodafone) to deteriorate further.
We expect ARPU erosion of ~5.4% QoQ to | 95 resulting in revenue (ex-Vodafone)
decline of 5.9% QoQ to | 5540.9 crore (also owing to full impact of divestment of
owned towers). On account of negative operating leverage due to topline decline, we
expect Idea to report EBITDA margin of 8.4% (down 280 bps QoQ). The company is
expected to post a net loss of | 1935 crore. We note that we have not incorporated
Vodafone consolidation (for a month) in our estimates owing to lack of metric at the
point of merger effective date
Sterlite
Technologies
Sterlite Tech would consolidate recently acquired Metallurgica numbers for the
quarter (two months). Hence, the reported topline growth is expected to be 24% YoY
to | 962.5 crore. The like-to-like growth in topline is expected at 15% YoY in Q2FY19,
driven by continued strong momentum from the product segment, especially on the
exports front. Consolidated EBITDA is expected to witness strong growth of 47% YoY
to | 250.5 crore on operating leverage benefit. EBITDA margins for the quarter are
expected to improve 410 bps YoY to 26%. However, margins on a QoQ basis are
expected to decline 190 bps due to consolidation of lower margin (compared to
Sterlite) business of Metallurgica. PAT is expected to grow ~72% YoY to | 122.4
crore
Tata Comm Tata Communication is expected to report relatively better numbers for the quarter
due to rupee depreciation and strong traction from data services. Overall revenue is
expected to fall 4.9% YoY to | 4010 crore, impacted by continued pressure in the
voice business. Revenue for the voice business is expected to decline ~30% YoY to |
1003 crore. On the other hand, the data business is expected to post 8% YoY growth
in topline to | 3007 crore. The growth in data is expected to be driven by stronger
traction in growth services. Overall margins are expected at 14.5% (up 110 bps YoY)
aided by superior data margins
Source: Company, ICICI Direct Research

ICICI Securities Ltd. | Retail Equity ResearchPage 63
Others
Exhibit 44: Estimates for Q2FY19E (| Crore)
Revenue EBITDA PAT
Q2FY19E YoY QoQ Q2FY19E YoY QoQ Q2FY19E YoY QoQ
Cox & Kings 774.9 16.0 -5.2 340.8 -2.0 14.4 70.8 -38.6 -26.6
DRECOR 143.0 -5.0 2.2 31.5 -22.7 -3.5 1.0 -94.8 -66.3
HIMCHE 598.5 27.9 -1.0 135.3 31.9 -0.4 77.8 52.1 1.5
Mah. Seamless 654.9 35.3 7.8 138.9 131.4 -3.3 100.0 194.0 -0.4
Navneet Publications 231.1 26.0 -65.5 39.1 39.0 -80.2 23.9 43.9 -81.0
Rallis India 645.3 9.8 12.6 124.3 1.4 49.6 82.1 6.2 50.4
Ratnamani Metals &
Tubes
655.6 106.4 7.6 97.0 89.5 7.2 62.5 133.1 8.3
Solar Industries 496.3 21.5 -19.3 92.3 5.8 -28.0 47.5 3.8 -31.7
Swaraj Engines 193.3 -7.4 -17.6 29.0 -17.4 -20.8 18.6 -20.8 -19.5
TTK Prestige 538.2 4.6 28.5 71.3 8.3 28.6 45.2 8.0 26.0
TeamLease Services 1,030.2 17.7 0.9 20.3 34.2 0.7 22.2 27.7 2.0
United Spirits 2,156.8 10.5 7.2 269.6 -15.1 40.2 133.5 -12.3 64.2
United Breweries 1,348.9 5.7 -27.7 197.8 -10.9 -50.6 82.0 -12.7 -63.1
VST Tillers & Tractors
(VSTTIL)
171.2 -2.5 17.6 22.3 -8.5 20.5 12.8 -31.6 -11.1
Wonderla Holidays
(WONHOL)
51.1 3.4 -50.8 11.2 1.3 -80.5 1.9 -17.0 -94.1
Total 9,689.3 13.8 -7.8 1,620.6 1.4 -16.2 781.9 -0.3 -26.0
Company
Change (%) Change (%)Change (%)
Source: Company, ICICI Direct Research
Exhibit 45: Company specific view (Others)
Cox & Kings Q2 is a seasonally strong quarter for Cox and Kings vs Q3 & Q4. The company’s
revenue growth (up 9.3% YoY) to mainly come from Meininger (up 25.0% YoY led by
bed additions) and leisure India revenues (up 15.0% YoY). However, on the margin
front, we expect EBITDA margin to decline from 52% to 44% in Q2FY19E mainly led
by adverse movement of currencies in European region. As a result, we expect PAT
to decline by 38.6% YoY to |70.8 crore.
Dredging
Corporation of
India
Revenues for the quarter are expected to de-grow 5% YoY on the back of lower fleet
utilisation amidst Government stake sale in the company to major ports. Higher
crude would further impact the operational performance (EBITDA), which is
expected to de-grow 23%. PAT is expected to decline by 95% YoY to | 1 crore
(exceptional income of | 10 crore in Q2FY18)
Himadri
Speciality
Chemicals
Himadri Speciality Chemicals is expected to maintain its positive momentum amidst
robust product demand and higher realisations (also supported by rupee
depreciation). Total carbon sales volume is expected at 100,767 tonne, up 7% YoY.
Total Net sales is expected at | 598.5 crore, up 28% YoY. Topline growth is also
supported by ~20% increase in blended realisations at ~| 60,000/tonne. EBITDA
for the quarter is expected at | 135.3 crore with corresponding EBITDA margins at
22.6% and EBITDA/tonne at | 13424/ tonne. PAT in Q2FY19 is expected at | 77.8
crore vs. | 51.2 crore in Q2FY18
Source: Company, ICICI Direct Research

ICICI Securities Ltd. | Retail Equity ResearchPage 64
Exhibit 46: Company specific view (Others)
Maharashtra
Seamless
For Q2FY19, we expect Maharashtra Seamless to report a decent performance on
the back of stable realisations. Total pipes sales are likely to come in at ~86500
tonne. Sales of seamless pipes are expected to come in at ~70000 tonne (up 1.2%
YoY, 7.5% QoQ), while ERW pipes volume is likely to be ~16500 tonne (up 10.5%
YoY, 2.8% QoQ). On the back of increased realisations, we expect the topline to
increase 35.3% YoY, 7.8% QoQ. The EBITDA is likely to increase 131.4% YoY and
decline 3.4% sequentially primarily due to increased steel prices. The company is
expected to report an EBITDA margin of 21.2% (vs. Q2FY18: 12.4% and Q1FY19:
23.7%)
Navneet
Education
For Navneet’s publication segment, the revenue season has traditionally been the
first quarter of every financial year, in which it derives ~55% of its total publication
revenues. However revenues from the publication segment in Q1FY19 witnessed
marginal decline owing to delay in release of Navneet's supplementary books.
Hence we expect the spillover of revenues to aid revenue growth in Q2FY19. We
expect Navneet to register a revenue growth of 26% YoY to | 231 crore, driven by
robust growth in publication segment to the tune of 27% and 18% revenue growth in
the stationery segment. EBITDA margins are expected to expand by 158 bps YoY to
17% on account of positive operating leverage. Consequently we expect PAT to
grow 44% YoY to | 23.9 crore.
Rallis India We expect, Rallis India to report steady performance in Q2FY19 amidst positive
farm sentiment following double digit increase in MSP's, uneven distribution of
rainfall (monsoon at -9% of LPA) and higher sales in the preceding quarter. In
Q2FY19, in the agro-chemical segment, we expect sales to grow by 9.7% YoY to |
601.8 crore. While on the Metahelix front, we expect a 10.4% YoY growth in sales
to | 43.4 crore. On the consolidated level, we expect sales to grow 9.8% YoY to |
645.3 crore. EBITDA margins are expected at 19.3% down 150 bps YoY primarily
factoring in pressure on raw material prices. Consequent EBITDA & PAT is expected
nearly flat at | 124.3 crore & | 82.1 crore respectively.
Swaraj Engines Swaraj Engines is expected to report muted performance in Q2FY19 on the back of
higher base of tractor sales in base quarter and market share loss by Swaraj Brand
of Tractors domestically. Engine sales volume in Q2FY19 are expected at 22,236
down 11% YoY vs. tractor sales de-growth of 4.5% at its Parent. Consequent net
sales is expected at | 193.3 crore, down 7.4% YoY. EBITDA margins are expected
at 15.0%, down 180 bps. EBITDA & PAT for the quarter is expected at | 29.0 crore
and | 18.6 crore (down 21% YoY) respectively
Solar Industries Solar Industries is expected to post revenue growth of 21.5% YoY to | 496.3 crore
driven by continued strong performance in the overseas segment (~40% of topline).
We expect this segment to grow 30% YoY. We expect the bulk and cartidge
segment to grow at 8% and 14% respectively. Lira (turkey), Naira (Nigeria), Kwacha
(Zambia) and Rand (South Africa) have witnessed depreciation of 5-20% over the
last few months. Accordingly, we expect muted EBITDA margins of 18.6% vs. 21.4%
due to forex losses during the quarter. PAT is also likely to show muted growth of
3.8% YoY to | 31.7 crore.
Source: Company, ICICI Direct Research

ICICI Securities Ltd. | Retail Equity ResearchPage 65
Exhibit 47: Company specific view (Others)
TTK Prestige We expect TTK Prestige (standalone) to report subdued topline growth of 5% YoY to
| 538.2 crore on account of weak onam sales and shift in certain festive season in
Q3FY19. On the segmental front, we expect Cookers and appliances segment to
report revenue growth of 5% and 4% respectively. TTK had to incur one time
expense of | 10.5 crore towards GST impact which deflated the margins in Q2FY18.
Hence, we expect margins to improve by 50 bps YoY to 13.3% in absence of such
exceptional expense. We expect PAT to increase by 8% YoY to | 45.2 crore.
United Spirits Overall volumes are expected to grow by 4% YoY to 19.2 million cases, on the back
of 11% growth in the Prestige and Above segment. Premiumisation and price hikes
in FY18 would drive the revenue per case resulting in net revenue growth of 11%
YoY. Although, the changes in the operating model would cushion gross margins,
however, higher promotional expenses may result in 380 bps contraction in EBITDA
margins with an absolute EBITDA de-growth of 15%. Subsequently, lower
operational performance YoY is expected to result in 13% de-growth in PAT
United
Breweries
Volumes are expected to grow 5% to 38.6 million cases and similarly, net revenues
are expected to grow 6% YoY. EBITDA margins are expected to contract ~270 bps
to 14.7% (due to rising barley prices) with an absolute EBITDA de-growth of 11%.
Subsequently, PAT is expected to de-grow 13% YoY
VST Tillers &
Tractors
We expect the difficult times for VST Tillers and Tractors to persist in Q2FY19
primarily tracking muted sales volume numbers amidst delay in subsidy schemes in
key states. In Q2FY19, power tillers sales volume came in at 5396 units (down 8.4%
YoY) while tractor sales volume were at 2087 units (down 33.3% YoY). Consequent
sales is expected at | 171.2 crore, down 2% YoY and partly compensated due to
increase in steel price and hence realisations. EBITDA margins are expected to taper
down by 90 bps to 13.0% with consequent EBITDA at | 22.3 (down 8.6% YoY)
crore. PAT for the quarter is expected at | 12.8 crore, down 31.8% YoY. PAT drop is
substantial in Q2FY19 as we expect VST to witness MTM losses on its equity
investment book
Wonderla
Holidays
We expect Wonderla to register muted growth of 3.4% YoY mainly led by decline in
footfalls whcih we expect to fall by 2.1% YoY (due to monsoon & floods in Kerala).
However, in terms of margins, we expect EBITDA margins to decline 50bps YoY to
22% mainly due to better pricing. At PAT level, we expect net profit to decline by
17% YoY.
TeamLease
Financials
TeamLease is expected to report rupee revenue growth of 17.7% YoY to | 1030.2
crore owing to revenue growth in general staffing (12.6% YoY) and increasing
contribution from IT staffing. EBITDA margins could remain flat QoQ to 2.0% owing
to expectation of hike of minimum wage hike while PAT is expected to increase by
27.7% to | 22.2 crore on account of operating performance and 80 JJAA tax
benefits
Ratnamani
Metals & Tubes
We expect Ratnamani Metals to report a steady state performance for Q2FY19 on a
QoQ basis. The capacity utilisation levels of both the segment are likely to track the
orderbook execution. We expect the capacity utilisation of stainless steel segment
to come in at ~60%, and that of carbon steel segment at ~85%. Subsequently, the
stainless steel segment is expected to report volumes of ~4200 tonne and carbon
steel segment of ~74375 tonne. Ratnamani's topline is likely to increase 106.4%
YoY and 7.6% QoQ. While the EBITDA is likely to increase 90% QoQ and 7.2% YoY,
we expect the EBITDA margin to remain flattish QoQ at ~14.8% (14.9% in Q1FY19).
PAT is likely to increase by 133.4% YoY and 8.3% QoQ.
Source: Company, ICICI Direct Research
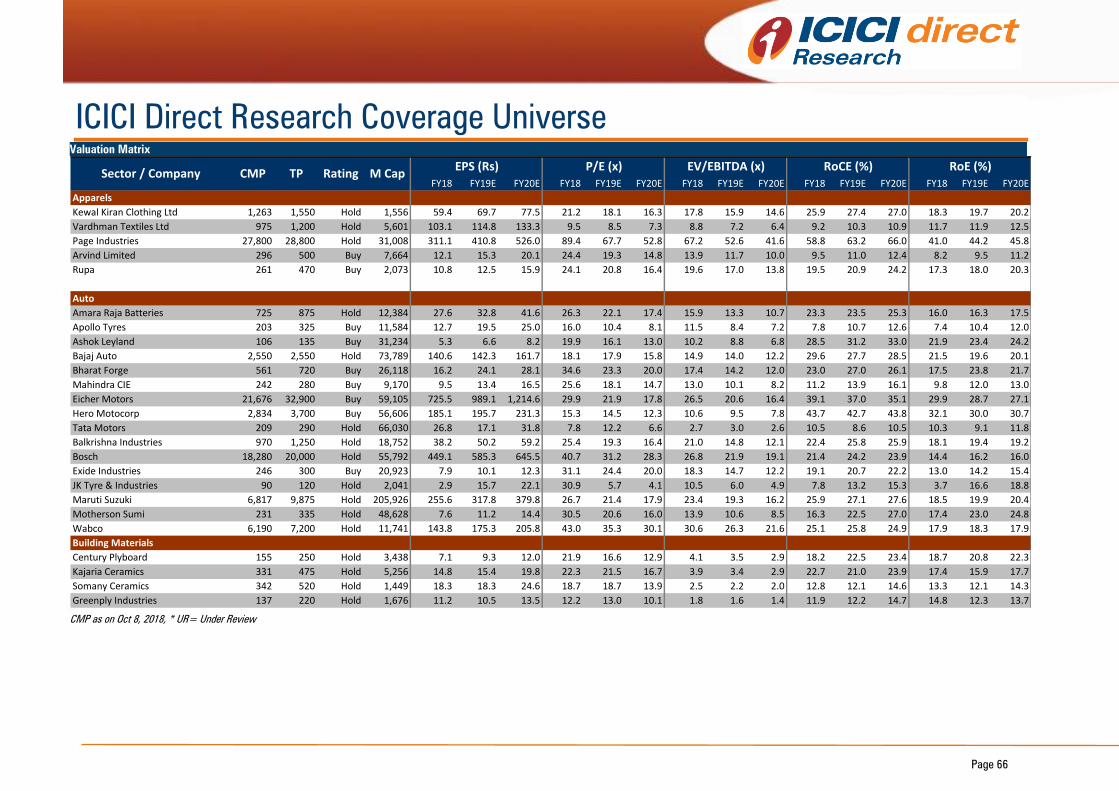
Page 66
ICICI Direct Research Coverage Universe
Valuation Matrix
FY18 FY19E FY20E FY18 FY19E FY20E FY18 FY19E FY20E FY18 FY19E FY20E FY18 FY19E FY20E
Apparels
Kewal Kiran Clothing Ltd 1,263 1,550 Hold 1,556 59.4 69.7 77.5 21.2 18.1 16.3 17.8 15.9 14.6 25.9 27.4 27.0 18.3 19.7 20.2
Vardhman Textiles Ltd 975 1,200 Hold 5,601 103.1 114.8 133.3 9.5 8.5 7.3 8.8 7.2 6.4 9.2 10.3 10.9 11.7 11.9 12.5
Page Industries 27,800 28,800 Hold 31,008 311.1 410.8 526.0 89.4 67.7 52.8 67.2 52.6 41.6 58.8 63.2 66.0 41.0 44.2 45.8
Arvind Limited 296 500 Buy 7,664 12.1 15.3 20.1 24.4 19.3 14.8 13.9 11.7 10.0 9.5 11.0 12.4 8.2 9.5 11.2
Rupa 261 470 Buy 2,073 10.8 12.5 15.9 24.1 20.8 16.4 19.6 17.0 13.8 19.5 20.9 24.2 17.3 18.0 20.3
RoA (%)
Auto
Amara Raja Batteries 725 875 Hold 12,384 27.6 32.8 41.6 26.3 22.1 17.4 15.9 13.3 10.7 23.3 23.5 25.3 16.0 16.3 17.5
Apollo Tyres 203 325 Buy 11,584 12.7 19.5 25.0 16.0 10.4 8.1 11.5 8.4 7.2 7.8 10.7 12.6 7.4 10.4 12.0
Ashok Leyland 106 135 Buy 31,234 5.3 6.6 8.2 19.9 16.1 13.0 10.2 8.8 6.8 28.5 31.2 33.0 21.9 23.4 24.2
Bajaj Auto 2,550 2,550 Hold 73,789 140.6 142.3 161.7 18.1 17.9 15.8 14.9 14.0 12.2 29.6 27.7 28.5 21.5 19.6 20.1
Bharat Forge 561 720 Buy 26,118 16.2 24.1 28.1 34.6 23.3 20.0 17.4 14.2 12.0 23.0 27.0 26.1 17.5 23.8 21.7
Mahindra CIE 242 280 Buy 9,170 9.5 13.4 16.5 25.6 18.1 14.7 13.0 10.1 8.2 11.2 13.9 16.1 9.8 12.0 13.0
Eicher Motors 21,676 32,900 Buy 59,105 725.5 989.1 1,214.6 29.9 21.9 17.8 26.5 20.6 16.4 39.1 37.0 35.1 29.9 28.7 27.1
Hero Motocorp 2,834 3,700 Buy 56,606 185.1 195.7 231.3 15.3 14.5 12.3 10.6 9.5 7.8 43.7 42.7 43.8 32.1 30.0 30.7
Tata Motors 209 290 Hold 66,030 26.8 17.1 31.8 7.8 12.2 6.6 2.7 3.0 2.6 10.5 8.6 10.5 10.3 9.1 11.8
Balkrishna Industries 970 1,250 Hold 18,752 38.2 50.2 59.2 25.4 19.3 16.4 21.0 14.8 12.1 22.4 25.8 25.9 18.1 19.4 19.2
Bosch 18,280 20,000 Hold 55,792 449.1 585.3 645.5 40.7 31.2 28.3 26.8 21.9 19.1 21.4 24.2 23.9 14.4 16.2 16.0
Exide Industries 246 300 Buy 20,923 7.9 10.1 12.3 31.1 24.4 20.0 18.3 14.7 12.2 19.1 20.7 22.2 13.0 14.2 15.4
JK Tyre & Industries 90 120 Hold 2,041 2.9 15.7 22.1 30.9 5.7 4.1 10.5 6.0 4.9 7.8 13.2 15.3 3.7 16.6 18.8
Maruti Suzuki 6,817 9,875 Hold 205,926 255.6 317.8 379.8 26.7 21.4 17.9 23.4 19.3 16.2 25.9 27.1 27.6 18.5 19.9 20.4
Motherson Sumi 231 335 Hold 48,628 7.6 11.2 14.4 30.5 20.6 16.0 13.9 10.6 8.5 16.3 22.5 27.0 17.4 23.0 24.8
Wabco 6,190 7,200 Hold 11,741 143.8 175.3 205.8 43.0 35.3 30.1 30.6 26.3 21.6 25.1 25.8 24.9 17.9 18.3 17.9
Building Materials
Century Plyboard 155 250 Hold 3,438 7.1 9.3 12.0 21.9 16.6 12.9 4.1 3.5 2.9 18.2 22.5 23.4 18.7 20.8 22.3
Kajaria Ceramics 331 475 Hold 5,256 14.8 15.4 19.8 22.3 21.5 16.7 3.9 3.4 2.9 22.7 21.0 23.9 17.4 15.9 17.7
Somany Ceramics 342 520 Hold 1,449 18.3 18.3 24.6 18.7 18.7 13.9 2.5 2.2 2.0 12.8 12.1 14.6 13.3 12.1 14.3
Greenply Industries 137 220 Hold 1,676 11.2 10.5 13.5 12.2 13.0 10.1 1.8 1.6 1.4 11.9 12.2 14.7 14.8 12.3 13.7
EPS (Rs)M CapSector / Company CMP TP Rating
EV/EBITDA (x)P/E (x) RoCE (%) RoE (%)
x
CMP as on Oct 8, 2018, * UR= Under Review

Page 67
Valuation Matrix
FY18 FY19E FY20E FY18 FY19E FY20E FY18 FY19E FY20E FY18 FY19E FY20E FY18 FY19E FY20E
Capital Goods
VA Tech Wabag 252 385 Hold 1,378 26.4 33.8 44.3 9.5 7.5 5.7 1.2 1.0 0.9 21.4 21.9 25.2 11.5 12.5 14.5
SKF Bearing 1,651 2,070 Buy 8,476 57.6 62.9 68.6 28.6 26.3 24.1 4.6 4.1 3.6 23.7 23.1 22.6 16.1 15.5 15.0
Timken India 550 835 Hold 4,137 13.5 16.1 18.8 40.6 34.2 29.3 29.7 23.4 20.2 18.9 19.8 20.4 13.1 13.7 14.0
NRB Bearing 160 215 Buy 1,551 9.4 10.2 11.5 17.1 15.7 13.9 11.1 10.3 9.1 26.7 24.5 24.2 24.0 21.7 20.6
Grindwell Norton 485 580 Buy 5,370 13.5 15.4 17.5 35.9 31.5 27.7 22.0 19.4 16.9 22.2 23.0 23.4 15.1 15.6 15.9
Thermax 890 1,317 Buy 10,606 19.4 29.4 39.2 45.8 30.2 22.7 32.3 23.7 17.2 14.2 17.1 19.3 9.0 11.7 13.5
KEC International 256 400 Buy 6,593 18.5 16.9 22.6 13.9 15.2 11.4 8.9 8.4 6.8 17.1 15.6 17.9 23.3 16.8 18.7
Kalpataru Power 301 520 Buy 4,623 20.6 24.2 29.0 14.6 12.5 10.4 9.8 8.7 7.4 16.3 16.6 17.3 11.2 11.8 12.5
Greaves Cotton 120 180 Buy 2,918 8.5 8.6 8.8 14.1 14.0 13.5 12.9 11.0 10.7 28.2 32.5 32.0 19.8 22.9 22.7
Larsen & Toubro 1,210 1,530 Buy 169,601 39.2 47.6 53.5 30.9 25.4 22.6 25.2 21.8 19.2 15.7 17.2 18.0 12.5 14.2 14.8
Bharat Heavy Electrical Limited 69 75 Hold 25,186 2.0 3.9 4.7 33.7 17.7 14.6 4.8 4.8 5.5 5.2 6.3 7.2 2.2 4.1 4.8
AIA Engineering 1,591 1,910 Buy 15,004 46.7 50.2 63.7 34.1 31.7 25.0 29.4 24.8 19.3 24.2 25.9 28.0 20.2 19.2 20.8
Bharat Electronics Ltd 77 105 Buy 18,689 5.9 6.3 7.8 13.0 12.2 9.8 11.4 10.1 9.3 23.5 23.4 28.6 17.0 16.4 19.1
Engineers India Ltd 106 135 Buy 6,667 6.0 6.4 - 17.6 16.6 13.4 12.4 11.7 22.7 23.4 22.1 16.7 17.2 -
Cochin Shipyard 369 580 Buy 5,021 29.2 34.5 36.5 12.7 10.7 10.1 5.6 5.4 5.5 13.4 14.0 13.2 12.2 13.4 13.3
Elgi Equipments 247 350 Buy 3,914 6.0 7.5 10.0 41.1 33.0 24.8 22.2 18.8 14.5 14.3 16.8 19.7 14.1 15.5 17.5
ABB India Ltd 1,369 1,400 Buy 29,002 19.8 22.8 29.2 69.1 60.1 46.8 34.3 30.0 23.4 23.2 23.9 25.6 11.6 12.2 14.0
RoA (%)
cement
India cements 89 140 Buy 2,766 3.3 4.3 7.5 27.4 20.9 12.0 8.7 8.6 6.8 5.1 5.1 6.7 1.9 2.5 4.2
Ambuja 204 245 Hold 40,418 6.3 6.6 8.3 32.3 30.6 24.4 19.5 18.5 14.5 11.3 12.9 16.6 6.3 6.5 7.9
Ultratech 3,743 4800 Buy 102,792 81.3 93.8 160.2 46.0 39.9 23.4 21.7 19.5 13.7 10.0 10.5 15.0 9.5 9.2 13.7
Heidelberg cement 138 180 Buy 3,118 5.9 7.2 9.3 23.3 19.1 14.8 11.1 9.7 8.5 14.8 17.9 21.3 12.8 14.5 16.8
JK Lakshmi 273 375 Buy 3,217 7.1 8.3 15.2 38.3 33.1 18.0 13.0 12.0 9.2 8.8 9.4 12.8 5.8 6.3 10.5
Jk cement 693 830 Hold 4,844 48.9 45.1 56.3 14.2 15.3 12.3 8.9 10.0 9.0 14.6 11.9 12.8 16.7 13.3 14.6
Mangalam cement 205 250 Hold 547 4.3 -6.9 1.3 48.1 NM 160.7 11.1 19.9 13.5 7.2 3.3 6.0 2.2 -3.7 0.7
Shree cement 16,001 18,500 Hold 55,743 397.8 354.3 530.9 40.2 45.2 30.1 24.7 23.4 18.2 15.3 13.1 17.2 15.6 12.5 16.2
ACC 1,447 1,800 Buy 27,177 49.2 49.8 69.4 29.4 29.1 20.9 16.5 15.5 11.7 14.0 14.3 18.5 9.9 9.7 12.9
Star Cement 102 125 Hold 4,264 7.9 5.5 6.2 12.9 18.4 16.5 9.8 11.7 10.1 21.6 16.1 18.0 22.4 14.0 13.9
The Ramco Cement 612 844 Buy 14,427 23.5 24.8 33.5 26.1 24.7 18.3 14.6 14.3 10.6 10.4 9.7 12.0 13.7 13.3 15.8
Sagar Cements 654 900 Buy 1,333 12.9 19.5 28.1 50.8 33.5 23.3 13.5 11.7 9.9 8.1 9.3 10.8 3.4 4.9 6.6
RoA (%)
FY18 FY19E FY20E FY18 FY19E FY20E FY18 FY19E FY20E FY18 FY19E FY20E FY18 FY19E FY20E
Construction
NBCC 53 95 Buy 9,504 1.9 2.2 3.2 28.5 24.0 16.4 26.4 21.7 13.4 26.5 28.6 36.7 18.3 19.6 25.1
P/E (x) EV/EBITDA (x) RoCE (%) RoE (%)
EV/EBITDA (x) RoCE (%) RoE (%)
Sector / Company CMP TP Rating M CapEPS (Rs)
Rating M CapEPS (Rs) P/E (x)
Sector / Company CMP TP
x
CMP as on Oct 8, 2018, * UR= Under Review

Page 68
Valuation Matrix
FY18 FY19E FY20E FY18 FY19E FY20E FY18 FY19E FY20E FY18 FY19E FY20E FY18 FY19E FY20E
Construction
NBCC 53 95 Buy 9,504 1.9 2.2 3.2 28.5 24.0 16.4 26.4 21.7 13.4 26.5 28.6 36.7 18.3 19.6 25.1
NCC Limited 69 140 Buy 4,138 4.8 6.5 8.2 14.4 10.6 8.4 8.0 7.2 6.2 15.9 15.3 16.8 6.8 8.4 9.8
Simplex Infrastructure 225 480 Hold 1,269 19.9 21.0 35.5 11.3 10.7 6.3 8.7 7.5 6.4 11.6 11.5 13.1 7.2 5.6 8.3
RoA (%)
Consumer Discretionery
Havells India 569 690 Buy 35,564 11.4 14.0 17.1 49.8 40.6 33.2 39.8 31.1 25.0 25.2 29.0 29.4 18.8 21.7 21.8
Voltas Ltd 480 650 Hold 15,873 17.5 19.8 22.9 27.5 24.3 20.9 30.0 24.5 20.2 19.8 23.5 24.0 14.8 17.9 18.1
Asian Paints Ltd 1,235 1,575 Hold 118,490 21.9 24.7 31.5 56.5 50.1 39.2 42.7 36.8 29.8 31.6 30.0 31.0 24.9 24.1 25.5
Kansai Nerolac 391 515 Hold 21,093 9.6 10.5 12.6 40.8 37.3 31.1 36.8 33.0 27.2 24.5 25.0 26.1 16.5 17.1 18.0
Bajaj Electricals Ltd 476 650 Hold 4,869 8.2 20.3 22.3 58.1 23.4 21.3 22.1 16.5 14.2 18.1 17.9 18.1 13.7 19.8 18.4
Symphony Ltd 840 1,350 Buy 5,875 27.5 23.1 33.1 30.5 36.3 25.4 34.4 38.1 25.2 41.3 29.9 39.1 31.5 26.4 33.8
Essel Propack Ltd 96 115 Hold 3,021 5.5 5.9 7.7 17.3 16.4 12.5 8.4 8.1 6.8 18.0 19.0 21.2 15.2 14.8 17.5
V-Guard Ltd 162 220 Hold 6,916 3.1 4.2 5.5 51.8 38.9 29.5 48.0 36.6 27.6 23.7 28.8 30.9 17.7 21.8 23.5
Pidilite Industries 956 1,200 Hold 48,560 18.8 19.5 24.4 50.7 49.0 39.2 42.4 36.9 30.5 33.6 30.9 33.6 27.0 22.6 24.4
Supreme Industries 956 1,320 Hold 12,143 33.9 40.8 44.8 28.2 23.4 21.4 19.2 17.3 14.7 27.9 28.5 29.7 22.7 22.9 23.0
Astral Poly Technik Ltd 820 1,180 Hold 9,823 14.7 20.1 26.6 55.9 40.8 30.9 41.6 30.3 24.1 22.9 25.0 26.6 17.2 18.2 19.6
Time Technoplast 122 175 Buy 2,749 8.0 10.0 12.5 15.2 12.1 9.7 8.5 7.2 6.1 14.9 16.5 18.0 12.2 13.7 14.7
RoA (%)
FMCG
Hindustan Unilever 1,554 1,800 Hold 336,354 24.2 30.3 36.0 64.1 51.2 43.2 49.5 40.0 33.7 79.9 102.5 119.4 74.7 86.9 99.5
Colgate Palmolive 1,050 1,150 Hold 28,557 24.8 26.8 30.3 42.4 39.2 34.7 25.9 24.7 21.4 62.9 58.5 59.0 44.7 41.4 41.6
Dabur India 406 475 Buy 71,666 7.7 8.7 10.4 52.6 46.7 39.0 47.0 41.9 35.2 26.2 26.9 29.5 23.8 24.1 26.0
GSK Consumer Healthcare 6,510 7,700 Buy 27,376 166.5 197.2 217.5 39.1 33.0 29.9 27.8 23.9 21.3 29.8 31.4 31.6 20.1 21.6 21.6
ITC 270 365 Buy 330,800 9.2 10.3 11.5 29.3 26.2 23.5 23.3 20.2 18.2 30.9 34.0 36.2 21.3 23.6 25.0
Jyothy Laboratories 190 250 Buy 6,905 8.8 4.9 6.2 21.5 38.4 30.5 28.0 25.6 22.8 35.1 33.8 37.3 23.5 25.3 29.6
Marico 306 400 Buy 39,500 6.4 8.0 9.6 47.7 38.5 31.8 39.6 32.2 26.3 38.9 44.2 45.9 32.5 36.3 37.3
Nestle India 9,359 12,000 Buy 90,237 127.1 158.2 194.4 73.6 59.2 48.2 46.1 41.0 34.0 34.9 45.3 47.7 37.6 42.2 42.7
VST Industries 2,641 4,000 Buy 4,079 117.8 158.4 175.4 22.4 16.7 15.1 14.7 11.4 10.4 46.9 54.4 51.5 31.3 36.3 34.7
Prabhat dairy 117 185 Buy 1,143 4.8 6.3 9.2 24.2 18.6 12.7 11.7 11.8 9.5 9.6 11.3 14.1 7.0 8.2 11.2
Varun Beverage 740 860 Buy 13,516 11.7 15.7 22.5 63.1 47.3 32.9 18.9 15.1 12.5 12.7 15.6 19.0 12.1 14.7 19.1
RoA (%)
Hospital
Apollo Hospital 1,071 1,190 Buy 14,896 10.8 24.2 38.3 99.6 44.3 28.0 22.9 17.9 13.8 6.3 8.5 11.2 4.0 8.4 12.0
Narayana Hrudalaya 230 280 Buy 4,700 2.5 1.7 5.5 91.6 135.5 42.1 27.9 24.8 17.0 6.3 5.9 10.6 4.9 3.2 9.4
RoA (%)
Hotels
EIH 142 205 Buy 8,125 3.1 4.0 4.5 45.3 35.3 31.8 33.7 23.5 21.0 8.7 11.2 11.6 6.6 8.0 8.4
Indian Hotels 121 155 Buy 14,390 0.8 1.4 1.6 142.7 89.2 74.7 25.8 23.2 21.7 5.5 6.3 6.7 2.2 3.8 4.4
Taj GVK 158 270 Buy 990 3.3 5.2 7.4 48.6 30.2 21.4 21.6 20.1 16.5 9.0 9.6 11.9 5.5 8.4 10.8
RoA (%)
Insurance
SBI Life Insurance Company Ltd 543 870 Buy 54,300 9.5 11.5 14.2 56.9 47.2 38.4 - - - 23.0 17.9 18.9 18.6 19.1 20.2
P/E (x) EV/EBITDA (x) RoCE (%) RoE (%)Sector / Company CMP TP Rating M Cap
EPS (Rs)
x
CMP as on Oct 8, 2018, * UR= Under Review

Page 69
Valuation Matrix
FY18 FY19E FY20E FY18 FY19E FY20E FY18 FY19E FY20E FY18 FY19E FY20E FY18 FY19E FY20E
IT
Cyient 718 760 Hold 8,114 36.0 39.3 47.6 19.9 18.3 15.1 14.9 11.6 10.6 21.4 20.2 21.5 17.3 17.0 18.1
eClerx Services 1,031 1,120 Hold 3,989 72.9 71.1 80.2 14.1 14.5 12.9 10.0 9.5 7.8 23.2 23.3 24.5 19.3 16.8 17.6
Firstsource Solutions 54 87 Buy 3,750 4.8 5.1 6.1 11.4 10.6 8.9 12.9 11.1 9.2 13.0 16.4 17.5 13.9 13.7 14.9
HCL Technologies 1,069 1,050 Hold 148,812 62.6 68.1 75.1 17.1 15.7 14.2 13.1 10.4 8.9 27.4 27.9 27.6 23.8 22.6 22.0
Infosys 710 705 Hold 310,046 32.3 35.6 39.2 22.0 19.9 18.1 15.6 13.9 12.5 30.9 30.4 30.9 22.5 21.8 22.1
KPIT Technologies 190 300 Hold 3,752 12.9 17.9 21.3 14.8 10.6 8.9 15.8 11.5 9.5 15.9 19.8 20.6 14.2 17.0 17.2
MindTree 981 1,245 Hold 16,103 34.3 43.8 56.5 28.6 22.4 17.3 25.3 17.0 13.1 24.9 29.7 33.3 20.8 23.4 26.0
NIIT Technologies 1,107 1,250 Buy 6,816 45.6 57.9 68.7 24.3 19.1 16.1 15.1 12.4 10.1 19.4 21.5 21.9 15.8 17.3 17.6
Persistent Systems 714 925 Buy 5,712 40.5 47.0 54.6 17.6 15.2 13.1 14.0 11.1 9.2 19.9 20.7 21.3 15.2 15.7 16.2
Tata Consultancy Services 2,068 2,060 Hold 791,654 135.4 80.8 89.6 15.3 25.6 23.1 22.8 18.8 16.5 37.6 43.9 39.8 29.6 34.2 30.9
Tech Mahindra 693 770 Buy 67,989 42.7 44.7 51.3 16.2 15.5 13.5 14.9 11.2 9.3 21.5 20.3 20.1 20.2 18.3 17.7
Wipro Technologies 315 325 Buy 142,462 16.9 18.8 21.6 18.7 16.7 14.6 12.5 11.3 9.7 16.9 15.9 16.2 16.6 15.3 15.4
InfoEdge 1,395 1,520 Buy 17,007 15.0 25.0 31.5 93.2 55.8 44.3 56.0 46.6 37.9 17.7 20.0 21.4 8.7 13.3 15.0
TeamLease Services 2,255 2,900 Hold 3,855 42.8 60.4 79.6 52.7 37.3 28.3 64.9 46.3 35.2 15.4 17.7 19.1 16.3 18.5 20.0
RoA (%)
Logistics
Blue Dart Express 2,900 3,850 Buy 6,881 60.9 68.5 83.7 47.6 42.3 34.7 25.1 22.8 19.2 29.3 30.4 33.6 27.2 27.4 29.6
Container Corporation of India 597 780 Buy 29,095 20.7 23.2 29.2 28.8 25.7 20.5 19.8 17.6 14.3 13.9 14.6 16.6 10.8 11.1 12.6
Gati Ltd 71 115 Buy 770 3.2 2.2 3.8 22.4 31.6 18.8 19.3 14.2 10.3 10.5 6.5 9.3 9.5 3.8 6.0
Gujarat Pipavav Port 102 120 Hold 4,934 4.1 5.1 5.7 24.9 19.9 17.8 13.7 12.4 10.6 12.1 12.2 13.9 9.2 10.8 11.5
Transport Corporation of India 266 400 Buy 2,041 13.2 20.4 24.3 20.1 13.1 11.0 12.6 9.0 7.8 13.4 15.9 16.0 16.3 19.4 18.8
Dredging Corporation of India 302 450 Sell 845 6.1 13.5 22.6 49.3 22.3 13.4 14.0 12.7 10.8 1.5 2.1 2.8 1.1 2.3 3.8
TCI Express 574 660 Buy 2,200 15.3 19.4 24.3 37.5 29.5 23.6 27.6 21.1 16.8 35.5 35.4 34.9 28.3 26.5 24.9
RoA (%)
Media
Sun TV Limited 607 920 Buy 23,911 28.8 35.6 41.8 21.1 17.1 14.5 14.5 11.6 9.3 35.5 36.6 36.0 24.2 24.9 24.2
DB Corp Ltd 196 235 Hold 3,602 17.1 16.0 19.6 11.4 12.2 10.0 6.7 7.5 5.9 23.1 23.8 26.8 16.3 17.0 18.9
Dish TV Limited 52 80 Hold 9,501 -0.4 1.1 2.5 NM 45.9 21.0 12.0 7.2 6.2 3.1 9.1 11.1 0.1 3.1 6.4
Entertainment Network Limited 626 780 Hold 2,986 7.5 14.3 24.2 83.8 43.8 25.9 29.7 20.9 14.8 6.2 10.6 16.1 3.5 7.2 10.9
Inox Leisure Ltd 198 275 Buy 1,910 11.9 8.8 12.1 16.6 22.4 16.3 12.2 11.1 8.8 13.2 13.3 15.4 10.6 11.3 13.4
Jagran Prakashan Limited 109 185 Hold 3,223 10.3 11.9 13.5 10.6 9.1 8.1 8.9 7.4 6.3 19.1 21.5 23.1 15.9 16.9 17.3
PVR Limited 1,171 1,390 Hold 5,474 26.4 37.2 47.3 44.4 31.4 24.7 17.3 14.0 11.9 14.7 16.8 18.9 11.5 14.0 15.2
Zee Entertainment Enterprises Ltd 413 600 Buy 39,634 15.4 16.4 20.0 26.8 25.1 20.6 22.4 18.7 15.4 25.6 24.5 25.5 15.3 15.3 15.9
TV Today Network Limited 388 450 Hold 2,315 19.9 27.1 30.0 19.5 14.3 12.9 11.7 8.8 7.3 30.4 31.6 29.6 19.3 20.3 18.9
EV/EBITDA (x) RoCE (%) RoE (%)Rating M Cap
EPS (Rs) P/E (x)Sector / Company CMP TP
x
CMP as on Oct 8, 2018, * UR= Under Review

Page 70
Valuation Matrix
FY18 FY19E FY20E FY18 FY19E FY20E FY18 FY19E FY20E FY18 FY19E FY20E FY18 FY19E FY20E
Metals, Mining & Pipes
Tata Steel 549 675 Buy 62,593 71.3 83.3 85.5 7.7 6.6 6.4 6.0 6.1 5.4 10.0 9.8 10.2 13.4 13.3 12.1
JSW Steel 366 375 Buy 88,410 25.3 29.0 31.8 14.5 12.6 11.5 3.0 2.6 2.7 16.7 18.3 17.1 21.8 23.2 20.7
NMDC 105 140 Buy 33,363 12.0 13.7 13.8 8.8 7.7 7.6 5.7 5.3 5.6 23.8 23.7 22.6 15.6 16.2 15.5
Hindalco 216 245 Buy 48,589 19.9 23.4 26.6 10.9 9.3 8.1 6.4 6.3 5.7 9.4 9.9 10.3 8.1 9.1 9.3
Vedanta Ltd 201 235 Hold 74,790 20.0 25.8 31.9 10.0 7.8 6.3 4.3 4.8 4.1 17.6 14.3 16.9 11.7 13.7 15.3
Hindustan Zinc 265 285 Hold 112,034 22.0 19.4 24.2 12.1 13.7 11.0 7.3 7.9 5.9 34.0 26.4 28.7 25.8 19.8 21.2
Graphite India 766 1,400 Buy 14,957 52.8 138.0 140.0 14.5 5.5 5.5 12.2 4.4 4.0 47.8 99.6 75.9 37.8 70.4 51.8
HEG 3,134 5,000 Buy 12,524 270.6 485.1 500.0 11.6 6.5 6.3 9.4 5.3 5.0 74.7 90.9 66.8 59.8 63.2 45.8
Maharashtra Seamless 412 570 Buy 2,761 29.9 46.7 53.1 13.8 8.8 7.8 12.0 8.2 7.0 7.8 11.8 12.5 6.8 9.8 10.1
Coal India 264 300 Hold 163,751 11.1 23.0 23.5 23.7 11.5 11.2 21.4 9.6 10.2 51.3 78.8 91.3 35.4 52.6 61.2
Ratnamani Metals and Tubes 811 1,050 Buy 3,790 32.5 42.1 49.7 25.0 19.2 16.3 15.7 12.6 10.6 17.1 19.1 19.0 11.6 13.4 13.9
RoA (%)
MidCap
Rallis India 173 225 Buy 3,371 8.6 9.4 11.2 20.2 18.5 15.5 13.7 12.3 10.2 19.1 19.2 20.8 14.0 14.0 15.2
Swaraj Engines 1,370 1,900 Hold 1,661 66.1 74.0 82.8 20.7 18.5 16.5 16.1 13.9 12.2 45.9 50.2 52.1 35.1 36.6 37.8
VST Tillers & Tractors 1,590 2,000 Hold 1,374 129.6 103.0 125.0 12.3 15.4 12.7 13.8 13.8 11.2 24.0 19.5 20.4 18.8 14.2 15.1
KSB Pumps 677 1,000 Buy 2,358 20.4 23.8 28.5 33.3 28.5 23.7 24.2 19.8 16.1 10.6 11.7 13.4 10.0 10.8 11.8
Himadri Speciality 112 170 Buy 4,669 1.9 5.8 7.4 57.5 19.2 15.1 12.8 11.1 8.7 18.2 19.5 21.6 16.7 17.6 18.6
RoA (%)
Oil & Gas
GAIL 341 450 Buy 76,932 20.5 23.9 26.4 16.7 14.3 12.9 11.3 10.0 9.2 15.4 16.0 16.1 11.5 12.4 12.7
Gulf Oil 723 910 Hold 3,599 31.9 34.7 41.6 22.7 20.8 17.4 18.3 15.4 13.0 35.1 39.1 39.0 33.9 30.3 29.7
HPCL 177 205 Hold 27,040 41.7 34.2 22.0 4.3 5.2 8.1 5.0 5.5 8.3 19.0 15.6 9.8 26.5 21.2 14.4
IGL 216 295 Hold 15,145 9.6 10.1 11.1 22.6 21.5 19.5 17.7 16.8 14.9 24.1 22.2 21.5 16.2 15.1 14.7
MRPL 64 95 Buy 11,208 12.8 9.9 11.0 5.0 6.5 5.8 4.2 5.4 4.9 23.1 16.9 17.6 20.4 14.8 15.0
ONGC 147 180 Hold 188,969 15.5 19.2 18.3 9.5 7.7 8.1 5.4 4.2 4.4 12.4 15.7 13.7 10.3 12.0 10.8
Petronet LNG 212 285 Buy 31,800 13.9 14.9 17.9 15.3 14.2 11.9 10.6 9.3 7.5 26.2 27.7 28.4 18.1 17.0 18.3
Castrol 138 155 Hold 13,630 7.0 6.8 7.4 19.7 20.2 18.6 15.2 15.8 14.7 111.0 348.2 684.9 67.8 189.4 331.2
GSPL 170 200 Hold 9,578 11.9 11.6 12.9 14.3 14.7 13.2 12.1 9.7 9.1 11.8 13.6 13.8 11.7 10.8 10.6
Gujarat Gas 608 940 Buy 8,372 21.2 32.1 37.6 28.7 18.9 16.2 14.5 12.1 10.3 12.9 16.5 17.7 13.8 16.4 18.8
BPCL 267 285 Hold 57,864 40.3 37.5 29.5 6.6 7.1 9.0 7.8 7.0 6.6 19.3 17.8 16.5 23.2 20.6 15.7
Mahanagar Gas Ltd 777 995 Hold 7,674 48.4 50.7 54.9 16.1 15.3 14.2 12.1 11.1 10.0 32.0 30.3 29.4 20.1 18.7 18.0
RoA (%)
Others
Cox and Kings 168 225 Hold 2,957 20.8 12.3 17.0 8.1 13.6 9.8 5.8 6.5 5.3 11.5 10.2 12.1 11.6 6.3 8.0
Solar Industries India Ltd 1,011 1,150 Hold 9,149 24.4 27.4 34.2 41.5 36.8 29.5 28.0 25.0 19.5 22.5 23.4 26.9 20.3 21.0 23.3
United Spirits 465 680 Buy 33,789 9.0 8.7 12.9 51.8 53.8 36.1 37.4 35.9 26.2 22.3 27.2 33.2 26.2 20.7 23.6
United Breweries 1,108 1,410 Buy 29,287 14.9 19.1 24.3 74.2 58.0 45.6 41.5 35.5 28.8 22.5 24.2 26.2 14.7 16.3 17.5
Wonderla Holidays 271 415 Buy 1,532 6.8 9.7 11.7 39.8 27.9 23.1 21.0 16.9 14.8 7.2 8.7 9.7 5.0 6.8 7.7
Navneet Education Ltd. 110 160 Buy 2,573 5.5 7.4 8.9 20.2 14.8 12.3 14.6 11.7 9.8 22.4 26.0 28.4 16.9 20.3 21.2
EV/EBITDA (x) RoCE (%) RoE (%)Rating M Cap
EPS (Rs) P/E (x)Sector / Company CMP TP
x
CMP as on Oct 8, 2018, * UR= Under Review
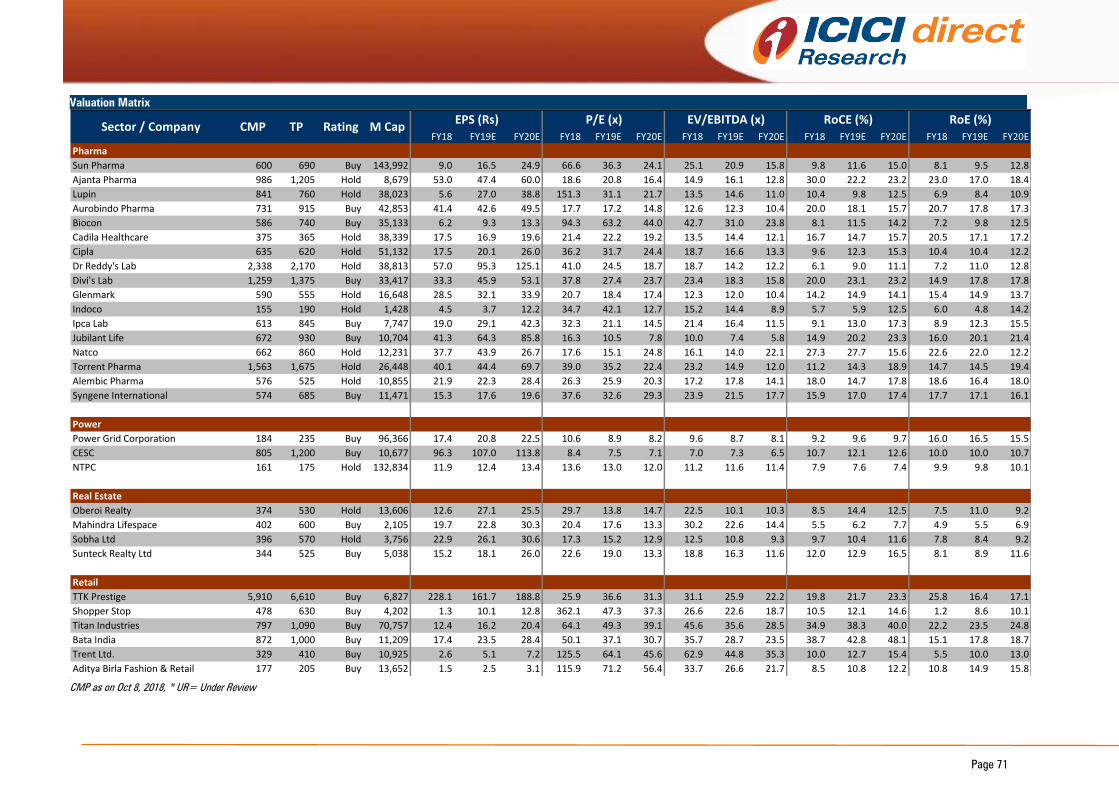
Page 71
Valuation Matrix
FY18 FY19E FY20E FY18 FY19E FY20E FY18 FY19E FY20E FY18 FY19E FY20E FY18 FY19E FY20E
Pharma
Sun Pharma 600 690 Buy 143,992 9.0 16.5 24.9 66.6 36.3 24.1 25.1 20.9 15.8 9.8 11.6 15.0 8.1 9.5 12.8
Ajanta Pharma 986 1,205 Hold 8,679 53.0 47.4 60.0 18.6 20.8 16.4 14.9 16.1 12.8 30.0 22.2 23.2 23.0 17.0 18.4
Lupin 841 760 Hold 38,023 5.6 27.0 38.8 151.3 31.1 21.7 13.5 14.6 11.0 10.4 9.8 12.5 6.9 8.4 10.9
Aurobindo Pharma 731 915 Buy 42,853 41.4 42.6 49.5 17.7 17.2 14.8 12.6 12.3 10.4 20.0 18.1 15.7 20.7 17.8 17.3
Biocon 586 740 Buy 35,133 6.2 9.3 13.3 94.3 63.2 44.0 42.7 31.0 23.8 8.1 11.5 14.2 7.2 9.8 12.5
Cadila Healthcare 375 365 Hold 38,339 17.5 16.9 19.6 21.4 22.2 19.2 13.5 14.4 12.1 16.7 14.7 15.7 20.5 17.1 17.2
Cipla 635 620 Hold 51,132 17.5 20.1 26.0 36.2 31.7 24.4 18.7 16.6 13.3 9.6 12.3 15.3 10.4 10.4 12.2
Dr Reddy's Lab 2,338 2,170 Hold 38,813 57.0 95.3 125.1 41.0 24.5 18.7 18.7 14.2 12.2 6.1 9.0 11.1 7.2 11.0 12.8
Divi's Lab 1,259 1,375 Buy 33,417 33.3 45.9 53.1 37.8 27.4 23.7 23.4 18.3 15.8 20.0 23.1 23.2 14.9 17.8 17.8
Glenmark 590 555 Hold 16,648 28.5 32.1 33.9 20.7 18.4 17.4 12.3 12.0 10.4 14.2 14.9 14.1 15.4 14.9 13.7
Indoco 155 190 Hold 1,428 4.5 3.7 12.2 34.7 42.1 12.7 15.2 14.4 8.9 5.7 5.9 12.5 6.0 4.8 14.2
Ipca Lab 613 845 Buy 7,747 19.0 29.1 42.3 32.3 21.1 14.5 21.4 16.4 11.5 9.1 13.0 17.3 8.9 12.3 15.5
Jubilant Life 672 930 Buy 10,704 41.3 64.3 85.8 16.3 10.5 7.8 10.0 7.4 5.8 14.9 20.2 23.3 16.0 20.1 21.4
Natco 662 860 Hold 12,231 37.7 43.9 26.7 17.6 15.1 24.8 16.1 14.0 22.1 27.3 27.7 15.6 22.6 22.0 12.2
Torrent Pharma 1,563 1,675 Hold 26,448 40.1 44.4 69.7 39.0 35.2 22.4 23.2 14.9 12.0 11.2 14.3 18.9 14.7 14.5 19.4
Alembic Pharma 576 525 Hold 10,855 21.9 22.3 28.4 26.3 25.9 20.3 17.2 17.8 14.1 18.0 14.7 17.8 18.6 16.4 18.0
Syngene International 574 685 Buy 11,471 15.3 17.6 19.6 37.6 32.6 29.3 23.9 21.5 17.7 15.9 17.0 17.4 17.7 17.1 16.1
RoA (%)
Power
Power Grid Corporation 184 235 Buy 96,366 17.4 20.8 22.5 10.6 8.9 8.2 9.6 8.7 8.1 9.2 9.6 9.7 16.0 16.5 15.5
CESC 805 1,200 Buy 10,677 96.3 107.0 113.8 8.4 7.5 7.1 7.0 7.3 6.5 10.7 12.1 12.6 10.0 10.0 10.7
NTPC 161 175 Hold 132,834 11.9 12.4 13.4 13.6 13.0 12.0 11.2 11.6 11.4 7.9 7.6 7.4 9.9 9.8 10.1
RoA (%)
Real Estate
Oberoi Realty 374 530 Hold 13,606 12.6 27.1 25.5 29.7 13.8 14.7 22.5 10.1 10.3 8.5 14.4 12.5 7.5 11.0 9.2
Mahindra Lifespace 402 600 Buy 2,105 19.7 22.8 30.3 20.4 17.6 13.3 30.2 22.6 14.4 5.5 6.2 7.7 4.9 5.5 6.9
Sobha Ltd 396 570 Hold 3,756 22.9 26.1 30.6 17.3 15.2 12.9 12.5 10.8 9.3 9.7 10.4 11.6 7.8 8.4 9.2
Sunteck Realty Ltd 344 525 Buy 5,038 15.2 18.1 26.0 22.6 19.0 13.3 18.8 16.3 11.6 12.0 12.9 16.5 8.1 8.9 11.6
RoA (%)
Retail
TTK Prestige 5,910 6,610 Buy 6,827 228.1 161.7 188.8 25.9 36.6 31.3 31.1 25.9 22.2 19.8 21.7 23.3 25.8 16.4 17.1
Shopper Stop 478 630 Buy 4,202 1.3 10.1 12.8 362.1 47.3 37.3 26.6 22.6 18.7 10.5 12.1 14.6 1.2 8.6 10.1
Titan Industries 797 1,090 Buy 70,757 12.4 16.2 20.4 64.1 49.3 39.1 45.6 35.6 28.5 34.9 38.3 40.0 22.2 23.5 24.8
Bata India 872 1,000 Buy 11,209 17.4 23.5 28.4 50.1 37.1 30.7 35.7 28.7 23.5 38.7 42.8 48.1 15.1 17.8 18.7
Trent Ltd. 329 410 Buy 10,925 2.6 5.1 7.2 125.5 64.1 45.6 62.9 44.8 35.3 10.0 12.7 15.4 5.5 10.0 13.0
Aditya Birla Fashion & Retail 177 205 Buy 13,652 1.5 2.5 3.1 115.9 71.2 56.4 33.7 26.6 21.7 8.5 10.8 12.2 10.8 14.9 15.8
P/E (x) EV/EBITDA (x) RoCE (%) RoE (%)Sector / Company CMP TP Rating M Cap
EPS (Rs)
x
CMP as on Oct 8, 2018, * UR= Under Review
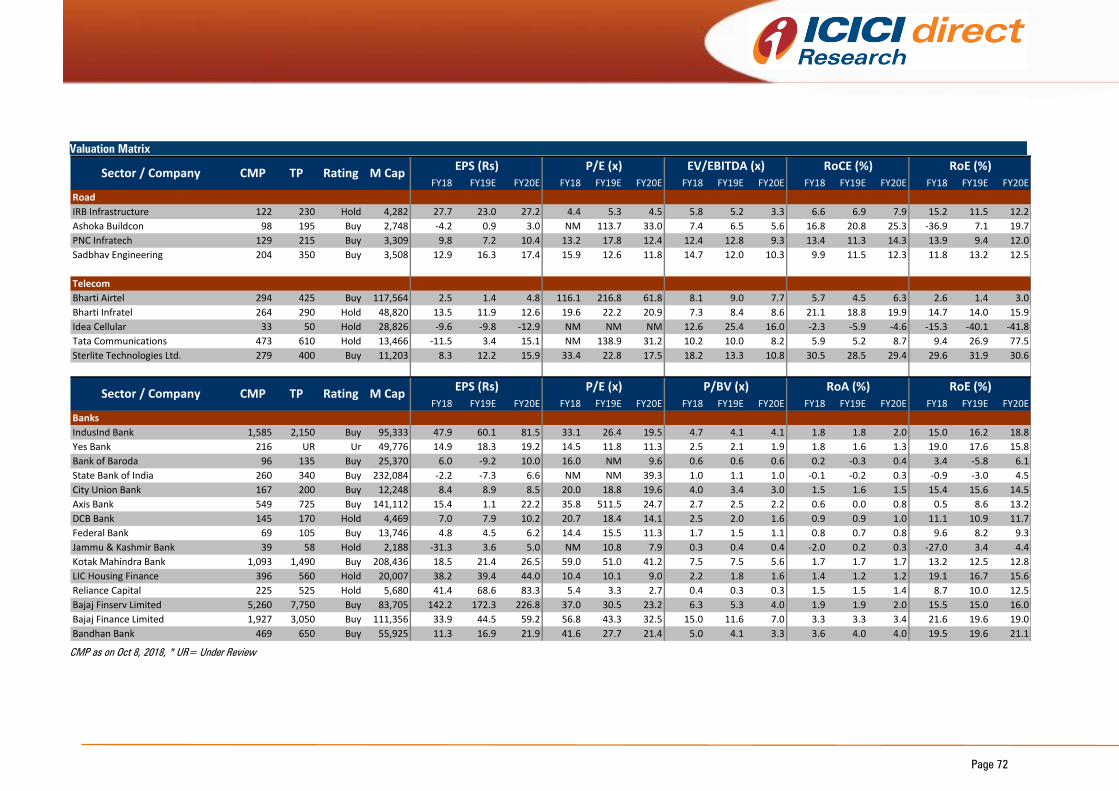
Page 72
Valuation Matrix
FY18 FY19E FY20E FY18 FY19E FY20E FY18 FY19E FY20E FY18 FY19E FY20E FY18 FY19E FY20E
Road
IRB Infrastructure 122 230 Hold 4,282 27.7 23.0 27.2 4.4 5.3 4.5 5.8 5.2 3.3 6.6 6.9 7.9 15.2 11.5 12.2
Ashoka Buildcon 98 195 Buy 2,748 -4.2 0.9 3.0 NM 113.7 33.0 7.4 6.5 5.6 16.8 20.8 25.3 -36.9 7.1 19.7
PNC Infratech 129 215 Buy 3,309 9.8 7.2 10.4 13.2 17.8 12.4 12.4 12.8 9.3 13.4 11.3 14.3 13.9 9.4 12.0
Sadbhav Engineering 204 350 Buy 3,508 12.9 16.3 17.4 15.9 12.6 11.8 14.7 12.0 10.3 9.9 11.5 12.3 11.8 13.2 12.5
RoA (%)
Telecom
Bharti Airtel 294 425 Buy 117,564 2.5 1.4 4.8 116.1 216.8 61.8 8.1 9.0 7.7 5.7 4.5 6.3 2.6 1.4 3.0
Bharti Infratel 264 290 Hold 48,820 13.5 11.9 12.6 19.6 22.2 20.9 7.3 8.4 8.6 21.1 18.8 19.9 14.7 14.0 15.9
Idea Cellular 33 50 Hold 28,826 -9.6 -9.8 -12.9 NM NM NM 12.6 25.4 16.0 -2.3 -5.9 -4.6 -15.3 -40.1 -41.8
Tata Communications 473 610 Hold 13,466 -11.5 3.4 15.1 NM 138.9 31.2 10.2 10.0 8.2 5.9 5.2 8.7 9.4 26.9 77.5
Sterlite Technologies Ltd. 279 400 Buy 11,203 8.3 12.2 15.9 33.4 22.8 17.5 18.2 13.3 10.8 30.5 28.5 29.4 29.6 31.9 30.6
RoA (%)
FY18 FY19E FY20E FY18 FY19E FY20E FY18 FY19E FY20E FY18 FY19E FY20E FY18 FY19E FY20E
Banks
IndusInd Bank 1,585 2,150 Buy 95,333 47.9 60.1 81.5 33.1 26.4 19.5 4.7 4.1 4.1 1.8 1.8 2.0 15.0 16.2 18.8
Yes Bank 216 UR Ur 49,776 14.9 18.3 19.2 14.5 11.8 11.3 2.5 2.1 1.9 1.8 1.6 1.3 19.0 17.6 15.8
Bank of Baroda 96 135 Buy 25,370 6.0 -9.2 10.0 16.0 NM 9.6 0.6 0.6 0.6 0.2 -0.3 0.4 3.4 -5.8 6.1
State Bank of India 260 340 Buy 232,084 -2.2 -7.3 6.6 NM NM 39.3 1.0 1.1 1.0 -0.1 -0.2 0.3 -0.9 -3.0 4.5
City Union Bank 167 200 Buy 12,248 8.4 8.9 8.5 20.0 18.8 19.6 4.0 3.4 3.0 1.5 1.6 1.5 15.4 15.6 14.5
Axis Bank 549 725 Buy 141,112 15.4 1.1 22.2 35.8 511.5 24.7 2.7 2.5 2.2 0.6 0.0 0.8 0.5 8.6 13.2
DCB Bank 145 170 Hold 4,469 7.0 7.9 10.2 20.7 18.4 14.1 2.5 2.0 1.6 0.9 0.9 1.0 11.1 10.9 11.7
Federal Bank 69 105 Buy 13,746 4.8 4.5 6.2 14.4 15.5 11.3 1.7 1.5 1.1 0.8 0.7 0.8 9.6 8.2 9.3
Jammu & Kashmir Bank 39 58 Hold 2,188 -31.3 3.6 5.0 NM 10.8 7.9 0.3 0.4 0.4 -2.0 0.2 0.3 -27.0 3.4 4.4
Kotak Mahindra Bank 1,093 1,490 Buy 208,436 18.5 21.4 26.5 59.0 51.0 41.2 7.5 7.5 5.6 1.7 1.7 1.7 13.2 12.5 12.8
LIC Housing Finance 396 560 Hold 20,007 38.2 39.4 44.0 10.4 10.1 9.0 2.2 1.8 1.6 1.4 1.2 1.2 19.1 16.7 15.6
Reliance Capital 225 525 Hold 5,680 41.4 68.6 83.3 5.4 3.3 2.7 0.4 0.3 0.3 1.5 1.5 1.4 8.7 10.0 12.5
Bajaj Finserv Limited 5,260 7,750 Buy 83,705 142.2 172.3 226.8 37.0 30.5 23.2 6.3 5.3 4.0 1.9 1.9 2.0 15.5 15.0 16.0
Bajaj Finance Limited 1,927 3,050 Buy 111,356 33.9 44.5 59.2 56.8 43.3 32.5 15.0 11.6 7.0 3.3 3.3 3.4 21.6 19.6 19.0
Bandhan Bank 469 650 Buy 55,925 11.3 16.9 21.9 41.6 27.7 21.4 5.0 4.1 3.3 3.6 4.0 4.0 19.5 19.6 21.1
Sector / Company CMP TP Rating M CapEPS (Rs) P/E (x) EV/EBITDA (x) RoCE (%) RoE (%)
Sector / Company CMP TP Rating M CapEPS (Rs) P/E (x) P/BV (x) RoA (%) RoE (%)
x
CMP as on Oct 8, 2018, * UR= Under Review

Pankaj Pandey Head – Research [email protected]
ICICI Direct Research Desk,
ICICI Securities Limited,
1st Floor, Akruti Trade Centre,
Road No 7, MIDC,
Andheri (East)
Mumbai – 400 093

Disclaimer
ANALYST CERTIFICATION
We /I, Pankaj Pandey, Research Analysts, authors and the names subscribed to this report, hereby certify that all of the views expressed in this research report accurately reflect our views about the
subject issuer(s) or securities. We also certify that no part of our compensation was, is, or will be directly or indirectly related to the specific recommendation(s) or view(s) in this report.
Terms & conditions and other disclosures:
ICICI Securities Limited (ICICI Securities) is a full-service, integrated investment banking and is, inter alia, engaged in the business of stock brokering and distribution of financial products. ICICI Securities
Limited is a Sebi registered Research Analyst with Sebi Registration Number – INH000000990. ICICI Securities Limited Sebi Registration is INZ000183631 for stock broker. ICICI Securities is a wholly-
owned subsidiary of ICICI Bank which is India’s largest private sector bank and has its various subsidiaries engaged in businesses of housing finance, asset management, life insurance, general
insurance, venture capital fund management, etc. (“associates”), the details in respect of which are available on www.icicibank.com.
ICICI Securities is one of the leading merchant bankers/ underwriters of securities and participate in virtually all securities trading markets in India. We and our associates might have investment banking
and other business relationship with a significant percentage of companies covered by our Investment Research Department. ICICI Securities generally prohibits its analysts, persons reporting to analysts
and their relatives from maintaining a financial interest in the securities or derivatives of any companies that the analysts cover.
The information and opinions in this report have been prepared by ICICI Securities and are subject to change without any notice. The report and information contained herein is strictly confidential and
meant solely for the selected recipient and may not be altered in any way, transmitted to, copied or distributed, in part or in whole, to any other person or to the media or reproduced in any form,
without prior written consent of ICICI Securities. While we would endeavour to update the information herein on a reasonable basis, ICICI Securities is under no obligation to update or keep the
information current. Also, there may be regulatory, compliance or other reasons that may prevent ICICI Securities from doing so. Non-rated securities indicate that rating on a particular security has been
suspended temporarily and such suspension is in compliance with applicable regulations and/or ICICI Securities policies, in circumstances where ICICI Securities might be acting in an advisory capacity
to this company, or in certain other circumstances.
This report is based on information obtained from public sources and sources believed to be reliable, but no independent verification has been made nor is its accuracy or completeness guaranteed.
This report and information herein is solely for informational purpose and shall not be used or considered as an offer document or solicitation of offer to buy or sell or subscribe for securities or other
financial
instruments. Though disseminated to all the customers simultaneously, not all customers may receive this report at the same time. ICICI Securities will not treat recipients as customers by virtue of their
receiving this report. Nothing in this report constitutes investment, legal, accounting and tax advice or a representation that any investment or strategy is suitable or appropriate to your specific
circumstances. The securities discussed and opinions expressed in this report may not be suitable for all investors, who must make their own investment decisions, based on their own investment
objectives, financial positions and needs of specific recipient. This may not be taken in substitution for the exercise of independent judgment by any recipient. The recipient should independently
evaluate the investment risks. The value and return on investment may vary because of changes in interest rates, foreign exchange rates or any other reason. ICICI Securities accepts no liabilities
whatsoever for any loss or damage of any kind arising out of the use of this report. Past performance is not necessarily a guide to future performance. Investors are advised to see Risk Disclosure
Document to understand the risks associated before investing in the securities markets. Actual results may differ materially from those set forth in projections. Forward-looking statements are not
predictions and may be subject to change without notice.
ICICI Securities or its associates might have managed or co-managed public offering of securities for the subject company or might have been mandated by the subject company for any other
assignment in the past twelve months.
ICICI Securities or its associates might have received any compensation from the companies mentioned in the report during the period preceding twelve months from the date of this report for services
in respect of managing or co-managing public offerings, corporate finance, investment banking or merchant banking, brokerage services or other advisory service in a merger or specific transaction.
ICICI Securities or its associates might have received any compensation for products or services other than investment banking or merchant banking or brokerage services from the companies
mentioned in the report in the past twelve months.
ICICI Securities encourages independence in research report preparation and strives to minimize conflict in preparation of research report. ICICI Securities or its associates or its analysts did not receive
any compensation or other benefits from the companies mentioned in the report or third party in connection with preparation of the research report. Accordingly, neither ICICI Securities nor Research
Analysts and their relatives have any material conflict of interest at the time of publication of this report.
It is confirmed that Pankaj Pandey Research Analysts of this report have not received any compensation from the companies mentioned in the report in the preceding twelve months.
Compensation of our Research Analysts is not based on any specific merchant banking, investment banking or brokerage service transactions.
ICICI Securities or its subsidiaries collectively or Research Analysts or their relatives do not own 1% or more of the equity securities of the Company mentioned in the report as of the last day of the
month preceding the publication of the research report.
Since associates of ICICI Securities are engaged in various financial service businesses, they might have financial interests or beneficial ownership in various companies including the subject
company/companies mentioned in this report.
It is confirmed that Pankaj Pandey Research Analysts do not serve as an officer, director or employee of the companies mentioned in the report.
ICICI Securities may have issued other reports that are inconsistent with and reach different conclusion from the information presented in this report.
Neither the Research Analysts nor ICICI Securities have been engaged in market making activity for the companies mentioned in the report.
We submit that no material disciplinary action has been taken on ICICI Securities by any Regulatory Authority impacting Equity Research Analysis activities.
This report is not directed or intended for distribution to, or use by, any person or entity who is a citizen or resident of or located in any locality, state, country or other jurisdiction, where such
distribution, publication, availability or use would be contrary to law, regulation or which would subject ICICI Securities and affiliates to any registration or licensing requirement within such jurisdiction.
The securities
described herein may or may not be eligible for sale in all jurisdictions or to certain category of investors. Persons in whose possession this document may come are required to inform themselves of
and to observe such restriction.
ICICI Securities has received an investment banking mandate from Government of India for disinvestment in ONGC. This report is prepared based on publicly available information.
ICICI Securities has received an investment banking mandate from Government of India for disinvestment in Bharat Heavy Electricals Limited. This report is prepared based on publicly available
information.
ICICI Securities has received an investment banking mandate for disinvestment in NMDC Ltd. The report is prepared on the basis of publicly available information.