ici conservation potential- final-format***
TRANSCRIPT
Water Conservation Potential
in the Institutional and Commercial Sector
in TexasAllison Pasch
Directed Research
Presented to the Department of Geography and Department of Agriculture at Texas State University in Partial fulfillment of the
Requirements for the Degree of
MASTER OF SUSTAINABILITY
Committee Members Approval:
_____________________________
Dr. Denise Blanchard-Boehm
_____________________________
Dr. James Petersen
_____________________________
Dr. Tina Cade
_____________________________

Contents
Abbreviations........................................................................................5Chapter 1 ............................................................................................. 6Introduction ...........................................................................................6Chapter 2 .............................................................................................10Background............................................................................................10 Current Water Use in Texas .............................................................8 Future Water User Trends in Texas ................................................12 Water Use in the Institutional and Commercial Sector in Texas ....10 Indoor Water Use in the IC sector...................................................16 Outdoor Water Use in the IC Sector.................................................17Chapter 3..............................................................................................19Literature Review..................................................................................19 Brief History of Water Conservation in Texas...................................19 Water Conservation Policy .................................................................19 Conservation by the Municipality.......................................................20 Water Saving Technologies ...............................................................25 Indoor Water Saving Technologies................................................26 Outdoor Water Saving Technologies..............................................29Chapter 4 .............................................................................................34Methods ................................................................................................34 Indoor Methods ..................................................................................35 Outdoor Methods ...............................................................................37Chapter 5..............................................................................................41Discussion of Results ............................................................................41 Indoor Result.....................................................................................41 Outdoor Results..................................................................................43Recommendations for Moving Water Conservation Forward......51Conclusion...........................................................................................54

Bibliography................................................................................55
Tables and Figures
Table 1. 2010 Water Use by Sector Estimates in Texas......................11Table 2. 2060 Water Use by Sector Estimate in Texas.......................12Table 3. Water Demand Projections for Municipalities...................... 13Figure 1. 2015 Estimates Percentage of Water use in the Institutional and Commercial Sector in Texas........................................................ 15Figure 2. EPA WaterSense End Uses of Water in Various Types of Commercial and Institutional Facilities...............................................16Table 4. Existing Landscape Plant Cover (Outdoor).......................... 38Table 5. ET and Precipitation Rates of five Texas Cities (Outdoor Scenario).......................38 Table 6. Smartscape Landscape Plant Cover and Type.......................40Table 7. Existing Water Budget for Bathroom Use in the Office Building Indoor Case Scenario.............................................................................................................41Table 8. Scenario 1: Indoor Bathroom Water Use With High Efficiency Technologies........................................................................................41Table 9. Scenario 2: Indoor Bathroom Water Use with Higher Efficiency Technologies .............................................................................................................42Table 10. Outdoor Existing Landscape Water Budget........................43Table 11. Landscape Water Budget Considering Soil Moisture Sensors (SMS....................................................................................................44Table 12. Landscape Water Budget Considering ET Controllers........45Table 13. Landscape Water Budget Considering Rainwater Harvesting.......46Table 14. Landscape Water Budget Considering Smarscape design. .47Table 15. Overall Outdoor Results ....................................................48

Acknowledgements
I would like to give my utmost gratitude to my advisor, Dr. Blanchard in the Geography department, whose positivity was always reaffirming, and who has supported me in my research, even through directional changes. I would like to sincerely thank my committee member Dr. Petersen, in the Geography department, who supported me in my research and my entry into graduate school, and who I have respected throughout my undergraduate and graduate college career. I would also like to extend my appreciation to my final committee member, Dr. Cade, in the Agriculture department, who I very fortunately got to work with during my graduate career, and whose passion and knowledge is inspiring. All these professors have guided me, impacted me, and helped me to grow as a student, as a professional, and as an individual.
I would like to acknowledge and thank the founders of AIQUEOUS, Daniel Merchant and Jonathan Kleinman. I had the amazing opportunity of working with AIQUEOUS, a water conservation company, and without them, this research would not have been possible. I specifically would like to thank Jonathan Kleinman for his mentorship and excellent leadership in this research.
I would also like to thank my mother, Carol Elskes, and my father Carl Pasch, for their continued support in all my endeavors. It is because of them I had the courage to peruse graduate school. I am forever grateful for their love and support.
In addition, I would like to thank my friends for supporting and encouraging me through out graduate school.

I would also like the thank Texas State University, the Geography department, and the Sustainability Program, for providing me with an outstanding educational experience. The knowledge I gained has given me the confidence I need to go out into the world and make an impact.
Lastly, I would like to thank God, for all of the blessings, guidance, and love.
Abbreviations
TWDB Texas Water Development Board
TCEQ Texas Commission on Environmental Quality
SWIFT State Water Implementation Fund for Texas
AWE Alliance for Water Efficiency
SAWS San Antonio Water System
HET High Efficiency Toilet
GPC Gallons per Capita
GPF Gallons per Flush
GPM Gallons per Minute
SMS Soil Moisture Sensor
BMP Best Management Practices

TRM Technical Reference Manual
EPA Environmental Protection Agency
ET Evapotranspiration
AF Acre Feet
Chapter 1
INTRODUCTION
Communities in Texas are becoming more aware that water is a
finite resource, particularly in times of drought, and this concept is
heighted as population in Texas grows with every year. This new
understanding of water resources has become more apparent and is
demonstrated not only within personal perceptions, but in city and
state initiatives and policies that aim to curb water use in order to meet
future water demands. Considering that Texas is expected to have a
significant increase in population, and also bearing in mind, Texas has
a history of consistent periods of prolonged droughts, Texas needs to
be proactive in aggressively using varied and creative mechanisms to

increase water efficiency in all sectors, and in particular, in the
commercial and institutional sectors where there is still a great
potential to significantly reduce water consumption. In times of rain, it
is easy for complacency to set in, and divest in water conservation
projects. However, one does not have to look too far back in history to
remember a time when Texas dealt with water scarcity, and was
significantly impacted from the drought of 2011.
In 2011, Texas experienced what is now known as, “the worst
single-year drought on record.” Sixty-seven percent of Texas was
categorized as in “extreme” or “exceptional” drought conditions, nearly
1,000 water utilities had imposed outdoor watering restrictions, and 23
municipalities believed they were within 180 days of running out of
water completely (Combs 2012). Economic losses from the drought,
resulted in an estimated $7.62 billion in the agricultural sector alone
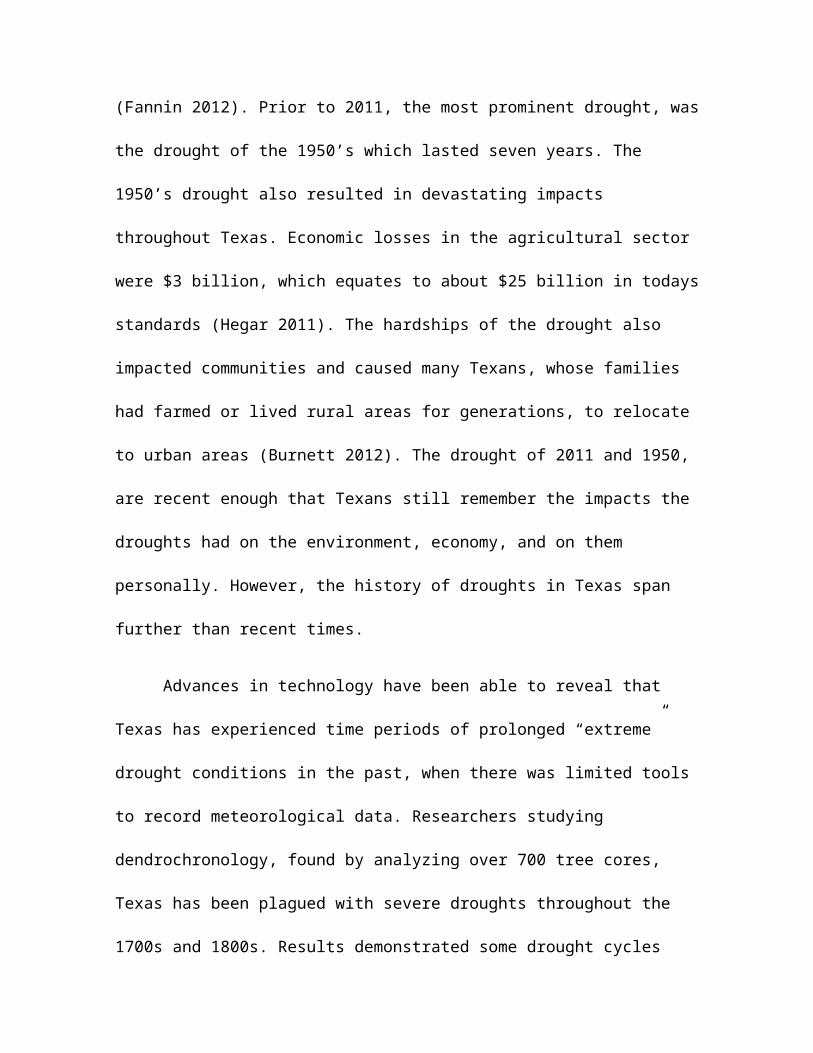
(Fannin 2012). Prior to 2011, the most prominent drought, was the
drought of the 1950’s which lasted seven years. The 1950’s drought
also resulted in devastating impacts throughout Texas. Economic losses
in the agricultural sector were $3 billion, which equates to about $25
billion in todays standards (Hegar 2011). The hardships of the drought
also impacted communities and caused many Texans, whose families
had farmed or lived rural areas for generations, to relocate to urban
areas (Burnett 2012). The drought of 2011 and 1950, are recent
enough that Texans still remember the impacts the droughts had on

the environment, economy, and on them personally. However, the
history of droughts in Texas span further than recent times.
Advances in technology have been able to reveal that Texas has
experienced time periods of prolonged “extreme” drought conditions in
the past, when there was limited tools to record meteorological data.
Researchers studying dendrochronology, found by analyzing over 700
tree cores, Texas has been plagued with severe droughts throughout
the 1700s and 1800s. Results demonstrated some drought cycles lasted
around twenty years, and the research also showed some drought
periods proved to be more severe than the devastating drought of the
1950s (Cleaveland et. al. 2011). Therefore, because droughts appear
to be a natural part of Texas’ climate cycles, it is not a matter of if, but
when, Texas will experience another destructive drought.
Considering it is highly likely Texas will experience another
situation when more than half of the state is in an “extreme drought”
conditions, Texas will need to be prepared for water scarce conditions
in the future. Therefore, Texas will need to plan to ensure there is
enough water, not only for the current population, but also for the new,
forty-five million transplants that are predicted to arrive to Texas
within the next 50 years (TWDB 2012). Bearing in mind the hardships
Texas faced in the past with a smaller population, how will Texas be
able to provide enough water for the new, and current residents of
Texas during times of drought? According to Texas Water Development
Board (TWDB), the overarching water management agency in Texas,
52 percent of municipal water groups in Texas would have unmet water
needs in 2060, under record drought conditions, if no conservation
efforts are made (TWDB 2012). This explains why I believe, that one of
the largest obstacles Texas will have to face in the twenty first century,
is ensuring there will be enough water for future residents, and the
ecosystems.
Texas has acknowledged this challenge, and is taking steps
towards securing water for the future demand. Texas planners have
budgeted more state money to support new water infrastructure
projects, and have also created new policies that support agencies,
such as Texas Water Development Board (TWDB), to increase
conservation efforts. The majority of conservation efforts are being
focused and implemented in cities because this is where the bulk of
population growth is expected to occur, and where water demand is
expected significantly increase. Texas Water Development Board is
relying on municipal conservation strategies to provide around 650,000
acre-feet (1 acre feet= 325,852 gallons) of new water supplies by 2060
(TWDB 2012).
Though TWDB’s involvement is imperative in ensuring Texas is
successful in water conservation, water conservation efforts are

primarily being implemented by the municipalities, and each city is
taking a similar, yet unique approached to water conservation based on
local water supplies and water trends. Municipalities have been
tackling the water conservation issue predominantly by targeting the
residential sector, where they have been successful. However, efforts
have not been as strong or successful in the institutional and
commercial (IC) sector, leaving room for significant water savings
across Texas to contribute to the overall conservation efforts, and thus,
future water security in Texas.
The overall low success rate of water conservation projects in the
institutional and commercial (IC) sector are attributed to various
barriers. Some of the most prevalent causes are firstly, the data
deficiencies of water use by facility types in the IC sector. Unlike the
residential sector where homes are similar in design and size, and thus
easier to target and apply conservation strategies, facilities within the
IC sector are diverse and range from hospitals to carwashes. This
discrepancy complicates benchmarking efforts, and results in limited
data that is only applicable for particular facilities. Additionally, there
is not a best management practices guide, or a technical reference
manual that would otherwise provide facility owners and contractors
guidance for water conservation projects. Similarly, there are low
numbers of water conservation demonstration projects in the IC sector
for IC facility owners to understand potential water and cost savings.

Furthermore, and in addition to the shortage of available information,
because water is still disproportionately inexpensive, the short-term,
return on investment for some of the water conservation projects are
not seemingly worth the owner’s time.
Therefore, the lack of available information, best management
practices, technical reference manuals, and demonstration projects has
left a question unresolved, which is “what are the best water saving
technologies to use that yield the greatest water savings, at the lowest
cost in the IC sector?” And furthermore, another question that is
unresolved and important in understanding water conservation
potential in the IC sector, which is “what is the overall conservation
potential in the IC sector?” It is important to understand which water
saving technologies and practices are most effective so the IC sector so
municipalities, policymakers, and facility owners can be more
informed, and more likely to take action. And similarly, it is equally
essential to answer the the question of conservation potential in the IC
sector to understand what percentage of the IC can reduce water use,
and thus, contribute to the amount of water Texas needs to conserve
for future population growth.
In response to the unanswered questions, and the need to
aggressively conserve water now in the municipal sector, I plan to start
solving some of the uncertainties by identifying, examining, and
comparing water conservation technologies and practices, for indoor

and outdoor applications, so I can identify the most cost-effective
solutions. In addition, I also plan to address the water conservation
potential in the IC sector in Texas by using estimations to begin to
understand the extent in which the IC sector will need to participate to
help ensure that future water demands are met in Texas. This paper
will only examine selected technologies, and therefore this study is not
comprehensive of all important water conservation technologies and
practices that are relevant to the IC sector. Furthermore, because of
limited data, the estimations for water conservation potential will be
based off comparisons and educated guesses, and thus are limited in
nature. The overall purpose of this paper is to provide greater
awareness into the issue of water conservation in the IC sector, to
increase transparency on the effectiveness of some water conservation
technologies and practices, and to provide recommendations that will
help increase the completions of projects and water savings in the IC
sector.
In order to get a full understanding of water conservation in Texas I
will begin with a background of current water use, future water trends,
and water use in the institutional and commercial sector in Texas.
Second, in the literature review, I will review a brief history of water
conservation in Texas, then discuss policies that are relevant to
conservation, and then illustrate the current conservation efforts of
some local municipalities in Texas. Third, I will introduce and discuss

the technologies selected for the comparative analysis of this study.
Then, in the methods section, I will illustrate the methodology behind
the comparative analysis and explain the results. Finally, I express
recommendations for Texas in moving forward, and conclude the
paper.
Chapter 2
BACKGROUND
Current Water Use in Texas
In order to understand water use in the intuitional and
commercial (IC) sector, it is important to uindentify all the water
sectors in Texas to grasp how much water the IC uses in comparison.
Currently, the biggest water user in Texas is the irrigation (for
agriculture) sector, and it accounts for about 57 percent of the total
water use. The municipal sector is the second largest water user in
Texas and uses about half the amount of the irrigation sector. The IC
sector is categorized within the municipal group, and the municipal
group also includes single-family residential, multi-family residential,
and industrial sectors.
Table 1. 2010 Water Use by Sector Estimates in Texas
Sector by Type Acre feet (AF)
(1 AF= 325,851 gals)

Irrigation (Agriculture)
10,079,215
Municipal 4,851,201
Manufacturing 1,727,808
Steam Electric 733,179
Livestock 322,966
Mining 296,230
Total 18,010,599
Source: (TWDB, 2012)
Future Water Use Trends in Texas
TWDB has predicted a significant shift in water use by sector in
the next fifty years. The municipal water sector is forecasted to be the
biggest water user in Texas by 2060. Water used in the municipal
sector is predicted to account for 38.8 percent of total water use in
Texas, and following close behind, the irrigation sector is predicted to
be the second largest user, and expected to use about 38.1 percent.
The decrease in water use in the irrigation sector can primarily be
attributed to advancements in technologies that increase water
efficiency, while the increase in water in the municipal sector is related
to the increase in population.
Table 2. 2060 Water Use by Sector Estimates in Texas
Sector by Type Acre feet (AF)
(1 AF= 325,851 gals)

Irrigation (Agriculture)
8,370,554
Municipal 8,414,492
Manufacturing 2,882,524
Steam Electric 1,620,411
Livestock 371,923
Mining 292,294
Total 21,952,198
Source: (TWDB, 2012)
From 2010 to 2060, the state population is expected to grow 82
percent (TWDB 2012). TWDB has anticipated, in order to meet the
water demands of the new residents, Texas will need to increase the
water supply by 22% (TWDB 2012). The overall increase in water
supply, however, will primarily occur in the municipal sector.
According to the TWDB projections, the municipal sector will
experience a 58% increase in water demand by 2060.
The population increase is expected to occur in the largely in the
urban areas. By 2060, the City of Fort Worth is expecting a 97 percent
increase in water demand, and the City of Austin is expecting a 75
percent increase, while El Paso, San Antonio, and Dallas will all be
experience nearly a fifty percent increase in water demand.
Table 3. Water Demand Projections for Municipalities

Source: (TWDB, 2012)
“People are moving to Texas, and they aren’t bringing water with
them,” said Kathleen Jackson board member of the TWDB.
Municipalities are going to have to account for this discrepancy, but
where will this water come from? Many municipalities are currently
using all of their local water resources available and are looking to new
technologies, such as desalination (process that converts salt water to
fresh water), to provide new water supplies. However, municipal
conservation efforts will be a critical component in securing water for
the future, and because water demand will be increasing in the cities,
water reduction will need to occur not only in the residential sector,
but the institutional and commercial sector as well.
Cities 2020(acre-feet)
2070(acre-feet)
Percent Increase
Houston 455, 481 609, 210 34%
San Antonio 235, 329 347, 873 48%
Dallas 275, 299 402, 811 46%
Austin 165, 155 289, 368 75%
Fort Worth 187, 763 370,751 97%
El Paso 110, 573 160, 792 45%
Arlington 66, 936 70, 148 5%
Corpus Christi 64, 816 75, 058 16%
Plano 69, 020 73, 059 6%
Laredo 41, 867 80, 785 93%

Water Use in the Institutional and Commercial Sector
Historically, water utilities have reported residential, multi-
residential, institutional, commercial, and industrial, as one unit
(municipal use), to TWDB, making it difficult to determine how much
water each sector uses. The Texas Water Development Board, which is
the agency in charge of compiling water use data, now requires sector
specific reporting but, because they are still composing the data, it is
currently not available. However, a recent survey among water utilities
with over 3,300 connections, provided the most accurate estimations of
IC water use in Texas. Currently, the institutional and commercial (IC)
sector accounts for roughly 25 percent of municipal water use, or
approximately 1,212,800 acre-feet (1 acre foot= 325851 gallons) in
Texas (TWDB 2015). The IC sector is therefore estimated to use about
8 percent of total water use in Texas. Though this is a relatively low
percentage now, it will increase in the next fifty years correlating to
the population rise.
The industrial sector accounts for approximately 15 percent of
total municipal use and is usually categorized alongside the
institutional and commercial sector (TWDB 2015). There is also a
significant potential for water reductions in this sector. However,
because the end uses of water in the industrial group are dissimilar
and diverse in function from the IC sector, this examination will not
include industrial sector in the analysis.

Figure 1. 2015 Estimates Percentage of Water use in the Institutional and Commercial Sector in Texas
Source: Data from (TWDB, 2015) graphs produced by (Pasch, 2015)
IC Water Use by Facility Type
The institutional and commercial sector include many different types of
facilities.
Institutional: schools k-12, universities, libraries, government
buildings, some hospitals, correctional facilities, and courthouses.
Commercial: office buildings, restaurants, fast food restaurants,
grocers, hospitals, laundries, golf courses, churches, auto repair shops,
car washes, retail stores, and lodging.

The diversity in facility type, and thus end uses of water, make
benchmarking conservation efforts difficult in the IC sector, and often a
water conservation case study only applicable to a particular facility
type. The figure 2 below illustrates the variance in water use of IC
facilities on a national level.
Figure 2. EPA WaterSense End Uses of Water in Various Types of Commercial and Institutional Facilities
(EPA 2009)
Indoor water Use in the IC Sector
It is difficult to determine exactly how much water is used
indoors in Texas, in the IC sector, because reporting methods have
historically combined IC water use into the municipal sector as a

whole. Therefore, indoor and outdoor water use, in the IC sector, are
based on estimates. However, using deductive calculations, indoor
water use in the IC sector for Texas likely accounts for about 65
percent of IC water use, or about 788,320 acre-feet (TWDB 2015 &
Cabrera et. al. 2013).
Outdoor Water Use in the IC Sector in Texas
The volume of water used for outdoor application varies across the
state and the nation depending on variables such as climate, soil type,
precipitation, geographic locations, economic profile of a location, time
of the year, and type of facility. The variation of use by location is
illustrated by a study that showed Dallas single-family residents used
40 percent of water for the outdoors, while Houston residents only
used 18 percent (Sierra Club 2015). Most water used for outdoor
irrigation, is used to irrigate turf grasses.
The study, Urban Landscape Water Use in Texas, conducted by
Texas A&M AgriLife Research Extension, looked at acreage of
landscaped areas across Texas. The study identified the acreage of
irrigated landscapes that applied to commercial and institutional areas.
It resulted in the following data:

Municipal landscapes (parks, etc.): 209,811 acres, with
approximately 104,906 of those acres being irrigated
Business and commercial landscapes: 228,776 acres
Educational and institutional: 26,511 acres
All together municipal, commercial, and institutional landscapes
total around 360,193 acres which use irrigation. By applying a
conservative number of 14.2 inches that averages water needs across
the state, these three sectors together use approximately 426,230 acre
feet of water. This amount of acre feet would imply outdoor water use
accounts for approximately 35 percent in the IC sector.
Other outdoor irrigated landscapes to take into consideration
include:
Green industry (nursery, green houses, and sod industries):
114,247 acres using 0.414 million acre-feet
Golf courses: 115,000 acres 0.364 million acre-feet
When the estimated total of acre-feet of water for the green industry
and golf courses is combined with municipal, commercial, and
institutional landscapes, a total of 1.2 million acre-feet of water is used
for outdoor irrigation, or approximately 25 percent of municipal water

use as a whole. This figure does not include outdoor water use
associated with single and multi-family homes. In other words, outdoor
water use accounts for a large part of the water budget in Texas and is
forecasted to grow.
Chapter 3
LITERATURE REVIEW
Brief History of Water Conservation in Texas
Water resource oversight started back in the 1800’s in Texas,
however, implementation of policy regarding water conservation was

not established until after Texas was powerfully confronted with water
scarcity in the 1950’s. The historical drought of the 1950’s lasted seven
years and resulted in agriculture losses that were greater than those
experienced in the dust-bowl years (Burnett 2012).
In response to the drought, the Texas Water Development Board
was created by a legislative act and constitutional amendment in 1957.
The TWDB is arguably the most important agency regarding water
management in Texas. They have been charged with “addressing the
state’s water needs to ensure the availability of sufficient water at a
reasonable cost while protecting the state’s agricultural and natural
resources” (Miller 2007). The TWDB created the first State Water Plan
in 1961, and have since created a plan every five years to report on
water supplies, water needs, water management strategies, impacts of
plans, financing needs, and challenges and uncertainties.
Recent Policy Affecting Conservation
It is clear that policy regarding water management in Texas
coincides with drought and flood events (TWDB 2012). In 1990,
another shorter, but destructive 10-month drought hit Texas. The 75th
Texas Legislature considered their primary issue to be water planning,
and Senate Bill 1 was passed in 1997, which established the sixteen
Regional Water Planning groups of TWDB. The purpose was to create a
ground up, and more localized approach for water management in

Texas, and this approach has been used in the Texas State Water Plans
since.
In 2011, the 82nd Texas Legislature enacted Senate Bill 181,
which directed TWDB and Texas Commission on Environmental Quality
(TCEQ) develop a uniform reporting program for water utilities so
TWDB can accurately calculate water use. The bill also requires the
sixteen regional planning groups in Texas to include conservation plans
and implementation methods. TWDB now also requires all
municipalities (with over 3,300 water connections) to have both a
conservation and a drought contingency plan. These plans require the
municipalities to make their own conservation plans, set conservation
targets, and create strategies for times of drought. TWDB, however,
does not mandate a conservation goal for municipalities, which results
in many municipalities setting low conservation targets. Secondly,
TWDB does not enforce the municipalities to achieve the conservation
targets.
In addition to Senate Bill 181, Proposition 6 passed in 2013,
which annually transfers $2 billion from the Economic Stabilization
Fund into the TWDB’s State Water Implementation Fund for Texas
(SWIFT). SIWFT is essentially a loan program that provides
municipalities with large loans, at a low interest rate, so the cities can
undertake necessary water projects. Most of these funds are allocated

for water infrastructure repairs or for the construction of new
reservoirs, however, a minimum of 20 percent of SWIFT funds are set
aside for re-use and conservation projects. The eligible applicants are
various districts affiliated with water, non-profit water supply
corporations, and municipalities.
Conservation by the Municipality
Policy has increased state wide oversight and financial support of
the Texas Water Development Board to more efficiently address water
conservation in Texas. However, the implementation of the
conservation projects, and the execution of water conservation plans
are ultimately the responsibility of the local groups, districts and/or
municipalities. Therefore, this local response to water conservation has
produced varied results across Texas, in which some cities, such as San
Antonio, are enthusiastically applying conservation technologies and
practices, while other cities, such as Houston, are undertaking minimal
efforts towards reducing water consumption. In order to understand
how water conservation is being implemented across Texas, this
section will identify municipalities that are actively perusing water
conservation in Texas, and include a brief history about when
conservation efforts began in each city, what these cities are doing,
and how the conservation efforts apply to the IC sector.
The City of Austin,

The City of Austin started requiring water conservation back in
the early 1980’s when it became a necessity. During that time, the City
of Austin was experiencing rapid growth that resulted in a drastic
increase of water use. The city had outdated water infrastructure
pipes, and was not able to handle the new demand, and by the summer
of 1982, the infrastructure system was at risk of failing (Gregg 2007).
Therefore, in 1983 the Austin Water utility created the Emergency
Water Conservation Ordinance (EWCO) to impose mandatory
restrictions on outdoor water use to ensure adequate water for
firefighting needs, to ensure water availability during peak water use,
and to minimize potential for stress-related equipment failures (Gregg
2007). Since then, the city of Austin has shifted from emergency crisis
related conservation, to seeing conservation as a long term solution to
meeting future demands.
Currently, the City of Austin water utility is taking a multi-faceted
approach to water conservation and is campaigning for water
conservation through visual and radio advertisement, providing
comprehensive education and outreach, and offering an extensive list
of incentives and rebates for utility customers to engage in
conservation. Because of these efforts, the city is witnessing a
significant decline in residential gallons per capita per day (GPCD),
which is the amount of water one person uses a day. In Austin, the
average residential GPCD went down from 103 GPCD in 2006, to 67

GPCD in 2015. Furthermore, the total average GPCD in Austin, which
includes water from all sectors (residential, institutional, commercial,
industrial) has decreased from 190 GPCD in 2006 to 122 GPCD in 2015
(Gross 2015).
The Austin water utility is one of the few cities targeting the
institutional and commercial (IC) sector and offers numerous rebates to
involve the IC customers including incentives for cooling towers, A/C
condensate recovery, irrigation system improvement, rainwater
harvesting, audits, and commercial kitchens. An example of the Austin
water utility reducing water use in the IC sector is illustrated by audits
the city did for General Services Administration, in response to
President Obama’s sustainability goals for federal buildings. The Austin
water utility audited five federal buildings and recommended changes
that would save a total of 10.5 million gallons of water annually. In
addition, the audit cost $31,500, but the city of Austin’s rebate covered
more than half the cost and the Austin water utility paid the General
Service Administration $22,000 on the agreement the water reduction
recommendations would be implemented (City of Austin). In 2015, the
City of Austin budgeted $500,000 for commercial incentives alone, but
only spent $31,848, or around six percent of the budget (City of Austin
2015). In comparison, residential rebates were utilized in a greater
capacity, thus illustrating, even in a city perusing the IC sector, IC
participation is relatively low.

The City of San Antonio
The City of San Antonio and more specifically, San Antonio Water
System (SAWS), is a utility that has a reputation for exemplary
leadership in water conservation. San Antonio actively perused water
conservation after the Edwards Aquifer, which was the primarily water
source for San Antonio, became federally protected, in 1993, under the
Endangered Species Act. After the aquifer became federally protected,
there was a limit cap on pumping volumes, and out of this mandatory
regulation, San Antonio had to start conserving aggressively.
San Antonio now has the largest recycled water delivery system
in the nation and uses recycled water for the river walk, which is a
major tourist attraction. San Antonio also uses recycled water to
irrigate parks, golf courses, cemeteries, and some commercial and
industrial landscapes. The system can provide up to 29-million gallons
per day, saving roughly 30,000 acre-feet (an acre-foot of water is
equivalent to 325,851 gallons) of drinking water every year just in that
one program (SAWS 2015).
Like Austin, the City of San Antonio is also targeting IC
customers and providing incentives that often cover 100 percent of the
cost for upgrades such as water cooler equipment, A/C condensate re-
use, industrial laundry equipment, irrigation design, and power

washers. In addition, in 2006, San Antonio was the first city in the
United States to require all new commercial buildings (that produced a
certain amount of condensate) to incorporate design that capture
condensate from A/C systems for reuse (SAWS 2013). This water can
help offset or replace water used for landscape or water used in non-
potable sources, such as toilets.
City of Dallas and Surrounding Areas
While Austin and San Antonio started water conservation efforts
decades ago out of necessity, Dallas has started its’ efforts more
recently in 2000 (Neena 2013). As one of the fastest growing cities, and
with the population expected to nearly double in fifty years (TWDB
2012). Dallas has realized the need to conserve, and primarily is
attempting to reduce consumption by targeting outdoor irrigation. The
Dallas, Fort-Worth area, is known for the excessive amounts of St.
Augustine turf grass, which is a common water guzzler. Dallas has
saved approximately 200 billion gallons of water since 2001. Dallas
attributes its’ success to rebate programs, such as one that distributed
65,400 new high efficiency toilets, and an ordinance adopted by the
city that permanently limits outdoor irrigation to a maximum of twice a
week (WCAC 2014).

The North Texas Water District, the utility serving water to the
surrounding areas of Dallas (City of Allen, Frisco, and Plano to name a
few), has spent $12.3 million from 2006 to 2014 in water conservation
campaigns which has resulted in a decline in gallons per capita. In
2000 GPCD was 224, and by 2012, the GPCD decreased to 173, which
diverted 91,000 acre-feet (1 acre foot= 325,851 gallons) of water from
being withdrawn from the local supply (Hickey, 2014). TWDB has
recommended a GPCD target of 140, which puts the surrounding areas
of Dallas behind.
The City of Dallas is currently offering wide range of rebates for
IC sector to engage in water conservation such as incentives for
cooling towers, monitoring and measuring meters, landscape irrigation,
food service operations, laundry operations, and more. The city of
Dallas offers up to $100,000 sit specific rebates for Dallas IC
customers. While the City of Dallas has had success of communicating
the conservation message to residential users through campaigns, the
City of Dallas has had low participation, and a low number of rebates
applied to the IC customers.
The City’s of Austin, San Antonio, and Dallas are working toward
securing water for the future, however, their efforts are not
representative of Texas as a whole. While some mid-sized utilities, such
as San Marcos and New Braunfels, are offering extensive rebates for

their customers, it is much more common for the water utilities of
Texas to offer a few, one, or no rebates to water customers. While
most, utilities have conservation tips and educational information on
the utilities’ website, the utilities often lack the financial capabilities to
offer rebates, and lack the staffing resources to promote education
outreach on water conservation to residential customers or IC
customers. Therefore, because there has been low participation
towards water conservation in the IC sector thus far, significant water
savings in the IC sector are still obtainable in Texas.
Water Saving Technologies
In order to address the low engagement of conservation efforts in
the IC sector, I will now introduce the technologies that will be used in
this paper to compare water and cost savings, to increase the
transparency of the effectiveness of these technologies, and to also
demonstrate their cost-benefit capabilities for the IC sector. As
mentioned before, this study is not inclusive of all the important water
saving technologies for the IC sector. It is important to note, such
technologies not included, like the A/C condensate re-use, which is a
technology that captures the condensate from Heating Ventilating and
Cooling (HVAC) systems in large facilities, have the ability to capture
significant savings. While the savings for the HVAC condensate re-use
system vary between the times of year, with summer producing more

condensate recovery, a 10,000 square foot building has the ability to
produce more then 15,000 gallons of condensate water per year (AWE
2010).
This study notes the importance of other technologies, however,
this analysis will examine technologies that are easier for IC customers
to retro-fit existing buildings, and therefore, making water
conservation more accessible to IC customers. The next section will
identify the indoor and outdoor technologies that will be used in the
comparative analysis.
Indoor Water Efficient Technologies
Though IC facilities are diverse in functionality, across the
variation, there is a similarity in water use for lavatories, as bathrooms
consistently demonstrate a high percentage of indoor water use.
Domestic, non-kitchen water use, including toilets, urinals, faucets, and
showerheads, accounts for 30 to 45 percent of water use in
Institutional and Commercial facilities according to the U.S.
Environmental Protection Agency, depending upon the type of facility
(2009).
Utilities have often target bathrooms in conservation efforts
because they use a significant amount of water, and in addition
bathroom retrofits are often the easiest, and most cost effective choice
for indoor water conservation. Therefore, in response to bathrooms

using a significant amount of indoor water use across the range in
facility type, and because these retrofits are one of the more accessible
and affordable technologies, I have chosen to focus on technologies
associated with bathroom use for this study. Therefore, this next
section will examine high efficiency toilets, high efficient urinals, and
water-efficient faucet/aerators, to understand the associated water and
cost savings they can achieve.
High Efficiency Toilets (HETs)
According to EPA WaterSense, toilets account for approximately
30 percent of indoor use (EPA 2015). Standard toilets use 7 to 3
gallons per flush (GPF), resulting in a massive waste of water. Most
commonly, you will find the 3.5 GPF toilets installed in commercial
buildings.
Federal plumbing standards, enacted in the EPAct of 1992, set a
toilet standard maximum of 1.6 GPF, and since then, all new toilets
made, sold, and installed must meet the flush requirements. Some
states, California, Georgia, and Texas, have a lower standard than
federal requirements. Texas mandates a maximum of 1.28 GPF for
toilets. The installation of even just one low flow toilet can yield
significant water savings. A 1.6 GPF toilet installed in an average

household (2.5 persons), can save on average 9,000 gallons per year
(Vickers 2001).
Other types of water efficient toilets demonstrated to save water
include, toilets that operate at a higher efficiency, using only 0.8 GPF,
compostable toilets which use minimal to no water, and vacuum toilets
which uses suction technique to remove waste. In contrast, toilets that
operate with sensor technology were found to use 54% more water
(Gauley and Koeller 2010). As technology improves, water saving
capabilities will become greater, and the product will become more
affordiable, making these technologies more readily available for the
public to retrofit outdated technologies.
The cost of HETs range from about $100-$1000, however, EPA
WaterSense labeled toilets are approximately in the $200 range (EPA
2015). In addition, many municipalities offer rebated for HETs making
them more affordable.
High Efficient Urinals
Maximum flow standards for urinals are a federal law through
the EPAct of 1992. The maximum volume established for urinals is 1.0
gallons per flush (GPF). Therefore, similar to toilets all new urinal
made, sold, and installed must meet this requirement. Typically, most

urinals in the United States use 3.0 GPF, or three times the amount of
water for every flush compared to the high-efficient urinals.
According to a Massachusetts study, roughly 19,500 gallons can
be saved annually in a small office setting that has 25 male employees
and two urinals when 3.0 GPF urinals are replaced by 1.0 GPF high
efficiency urinals. If the two urinals in the scenario are waterless,
water usage can be reduced even further to 58,500 gallons. Depending
on the type of technology installed, the return on investment for this
retrofit would be a half of year to three years (IEc 2008).
Other water efficient technologies for urinals include, urinals
with a 0.5 GPF, waterless urinals, and composting urinals. According to
EPA WaterSense, the cost of a high efficiency urinal is about $350, and
a flushometer (a device used on existing urinals to save water without
replacing the entire system) is about $200.
High Efficiency Faucets
Faucets, particularly aerators, are the most cost-effective and
easiest indoor water efficient upgrade. Faucet aerators, which are
devices that go onto existing faucets to reduce the flow, are often given
away by water utilities at no cost. A sink faucet or an aerator that uses
a maximum 1.5 gallons per minute (gpm), instead of the traditional 2.2
gpm, can reduce sink water use by 30 percent (EPA WaterSense 2013).
According to the EPA, if every home replaced their faucet with EPA’s

WaterSense faucets and/or aerators, the United States could save
nearly $1.2 billion in water and energy costs, and also save 64 billion
gallons of water across the country, which is enough water to meet the
needs of 680,000 average-sized homes (EPA WaterSense 2013).
Higher savings are achievable with the lower standard of 0.5gpf
set by the American Society of Mechanical Engineers (ASME)
(A112.18.1) in the plumbing codes. This standard is for all for all non-
residential buildings. This maximum flow rate, uses a third of the
amount of water compared to the EPA WaterSense standard, and
results in more water, energy and cost savings. According to Alliance
for Water Efficiency (AWE), however, this standard is either unknown
or ignored, resulting in many new buildings still using 2.2 gpm faucets
(AWE 2010).
The type of faucet (manual or sensor) installed can also have an
impact on water use. A study found sensor- faucets used 30 percent
more water than manual faucets (Gauley and Koeller 2010). This can
partially be explained by a study that found that manual faucets rarely
operate at full capacity, but sensor faucets always operate at the
maximum capacity (Hill et al 2002).
Faucet aerators range from $.50 to $3.00, making this technology
extremely affordable, while faucets start at about $40 and range into
$200.

Outdoor Water Saving Technologies
Volumes of outdoor water use varies not only by facility type, but
also by the time of year. During summer months, outdoor water use
may account for 40 to 60 percent of total water use in Texas (White et
al 2004) while during winter months, outdoor water use is usually
minimal. It is clear, particularly in the summer months, Texans are
using a significant amount of water to irrigate lawns, however, studies
are showing people are irrigating inefficiently. A three-year study that
monitored 800 residential outdoor irrigation practices in Waco, Texas
found that approximately 50 percent of the subjects were watering in
excess (White et al 2004). Similarly, Guy Fipps, founder of the “Water
my Yard,” program which uses evapotranspiration (ET) rates and
weather data to inform efficient irrigation practices, claims most
automatic irrigation systems are improperly programmed and over-
irrigate 20 to 50 percent (Texas Water Resource Institute 2015).
Because large volumes of water are being used on landscapes,
and a high percentage of those landscapes are over watering, there is a
large potential to reduce water use by applying various outdoor water
efficient technologies. This section will therefore compare
evapotranspiration controllers, soil-moisture controllers, rain
harvesting, and smartscapes (drought-tolerant landscape designs), to

understand the potential water savings and associated implementation
cost.
Soil Moisture Sensor Systems (SMS)
Soil moisture sensors (SMS) are known as a type of “smart
controller” and use soil moisture data as the primary variable to decide
if the landscape needs irrigation. Soil moisture sensors are placed at
the root zone, and the sensors transmit the moisture content data to
the irrigation control system. The SMS will bypass a scheduled
irrigation event if moisture content is above the specific threshold.
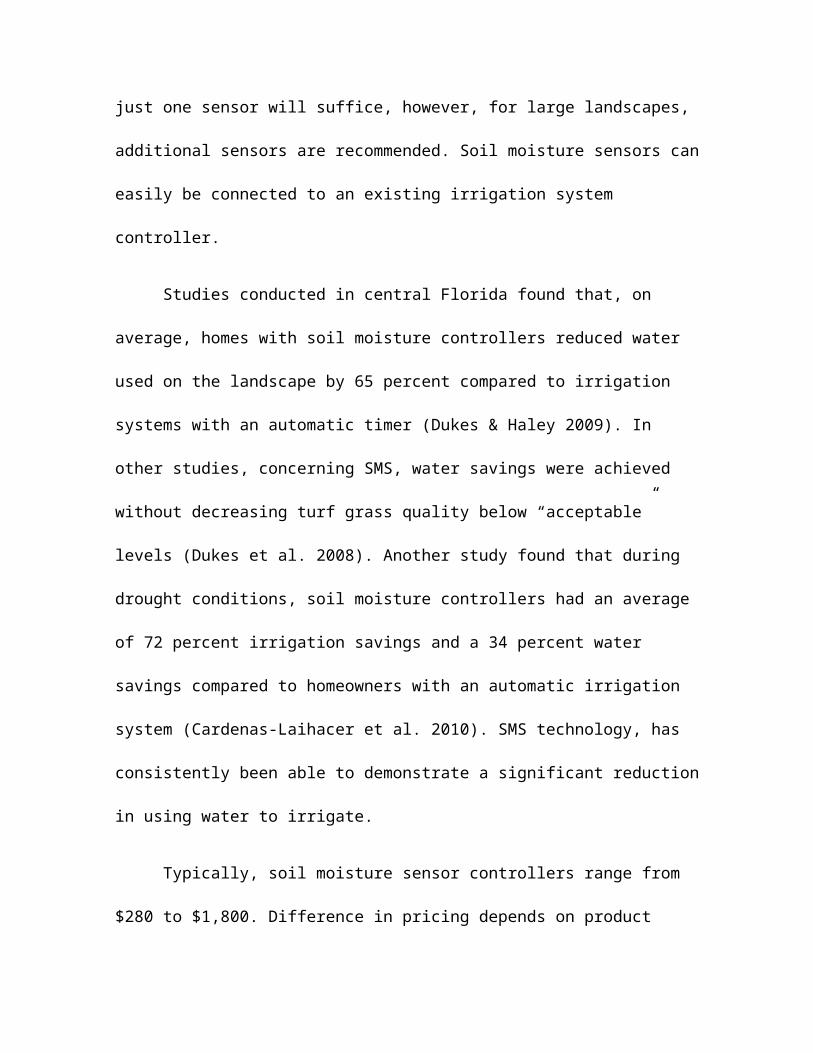
Usually just one sensor will suffice, however, for large landscapes,
additional sensors are recommended. Soil moisture sensors can easily
be connected to an existing irrigation system controller.
Studies conducted in central Florida found that, on average,
homes with soil moisture controllers reduced water used on the
landscape by 65 percent compared to irrigation systems with an
automatic timer (Dukes & Haley 2009). In other studies, concerning
SMS, water savings were achieved without decreasing turf grass
quality below “acceptable” levels (Dukes et al. 2008). Another study
found that during drought conditions, soil moisture controllers had an
average of 72 percent irrigation savings and a 34 percent water
savings compared to homeowners with an automatic irrigation system
(Cardenas-Laihacer et al. 2010). SMS technology, has consistently

been able to demonstrate a significant reduction in using water to
irrigate.
Typically, soil moisture sensor controllers range from $280 to
$1,800. Difference in pricing depends on product manufacturers and
end users, either residential or commercial customers (Gotcher OSU).
Evapotranspiration (ET) Controllers
Evapotranspiration (ET) controllers, also referred to as, climate-
based controllers, or “smart controllers” use local weather data and
evapotranspiration rates to adjust irrigation schedules.
Evapotranspiration rates account for the amount of water a plant will
lose. Based off ET rates and weather data, ET controllers will irrigate
accordingly.
White et al. found that by using potential evapotranspiration data
to water lawns, the 800 homes in the study, could save on average 24
to 34 million gallons of water per year. Similarly, the city of Frisco,
Texas uses ET rates and weather station data to inform residents when
they need to water their lawns. In 2010, they found that during 25 out
of the 52 weeks in a year, supplemental irrigation was not necessary
(Tarrant Regional Water District 2014).
Some studies on ET controllers, however, have resulted in
conflicting data, and concluded ET controllers can increase outdoor

water use. A study conducted in two locations in Florida, Wimauma and
Gainesville, found that both of the ET controllers selected for the study
overestimated irrigation by up to 30 percent in summer months (Dukes
& Rutland 2014). Other studies have found similar over watering
results (DeOreo, et. al. 2008), (Sovocool et. al. 2006). Alliance for
Water Efficiency (AWE) however, found ET controllers on average save
23-34 percent based on a study with 21 sites (Davis and Dukes 2014).
Most ET controllers cost between $250 and $900, while
professional grade ET controllers range between $900 and $2,500
(Gotcher OSU).
Rain Water Collection Systems
Rain watering harvesting is a practice to capture the rain water
runoff from a roof. Most commonly a rain barrel is simply placed below
the rain gutter and nature takes care of the rest. Rain water harvesting
helps off-set the outdoor water use associated with landscapes,
gardens, ponds, fountains, and outdoor equipment washing. The Texas
Commission on Environmental Quality also allows rainwater harvesting
for potable use (TAC ch. 290, Sub ch. D) if you follow the appropriate
procedures.
“Potential for Rainwater Harvesting in Texas,” a study
conducted by TWDB, found that an estimated two billion gallons of
water could be generated in a Dallas-sized metropolitan area if 10

percent of the roof area was used to harvest rain water. Furthermore,
they found 38 billion gallons of water could be conserved if 10 percent
of all the roofs areas in Texas were used for rain water harvesting.
Many cities in Texas are offering rebates and other economic
incentives for the use of rain barrels or providing classes in how to
assemble a low cost rain barrel at home. For the larger landscapes that
are often associated with the IC sector, it is more common practice to
use rain cisterns, which are essentially large barrels and are able to
capture more water because the roof size is typically larger in the IC
sector.
Rain cisterns can be above or below the ground. Rain cisterns
cost start at about $1,500 and can range up to $10,000 (University of
Florida 2008).
Landscape Design and Materials Selection
A number of terms describe a water-conserving landscape. Among
them are xeriscaping, low water use, drought tolerant, waterwise,
smartscape, and desert landscaping. The principal objectives in a low
water use landscape design include:
o Plant selection: the use of native, drought-tolerant plants can
reduce the water use by 50%-100%

o Reduce turf: minimization of plants such as turf (particularly in
areas it is not suited) that require large volumes of water
o Plant placement: grouping of plants with similar water needs
together
o Design: design efficiently, using the natural slopes of the
landscape to capture rain water or water run-off from roofs
o Soil amendments: amending soils with organic matter/compost
to ensure longevity of plants while reducing water needs
o Mulch: adding mulch around plants and flower beds to retain
more soil moisture
Public perceptions towards drought tolerant landscapes are
sometimes negative an conjure imagery of rocks and cactus. However,
a water-conserving landscape can meet the needs of water
conservation while also satisfying the aesthetic aspect that includes
colors and green plants.
Research conducted in Las Vegas produced models that
predicted outdoor water use will decrease an average of 55.8 gallons
per year for every square foot of turf landscape converted to drought
tolerant landscape. The study also found turf took more time and cost
to maintain than a smartscape. It was concluded turf took 8.2 hr/month
and $680/year to maintain, while smartscape took 6hr/month and $474
per year to maintain (Sovocool 2005).

Landscape conversion costs are dependent upon the area, the
contractor, and the scale of the project. However, on average, the cost
ranged from approximately $.50 to $2.04 per square foot conversion
(Rymer Arizona Municipal Water Users Association).
Chapter 4
METHODS

Considering all of the indoor and outdoor technologies presented,
my supervisor Jonathan Kleinman of AIQUEOUS, and I have developed,
scenario models to compare these technologies, and their associated
water use, to a hypothetical, existing water budget in order to
understand the water and cost savings. In response to the limited and
disjointed data in literature regarding the topic, we concluded building
case scenario models would be the best way to address the original
questions, which are “what the best water saving technologies to use
that yield the greatest water savings, considering the cost, in the IC
sector?” and the follow up question is “what percentage IC facilities
can tap into these water conservation technologies and practices (that
have not already), and how much can they save?” Therefore, I have
built case scenario models to calculate an indoor and outdoor water
budget to compare the technologies against, thus, using a quasi
experimental- comparative –analysis, research design. The overall
purpose of this design is to be able to provide IC facility owners with
more transparent data to support them in taking action towards water
conservation projects, and to begin to understand total water
conservation potential in the IC sector in Texas. The calculations of this
analysis will be separated into the technologies associated with indoor
and outdoor use.
Indoor Methods

The dependent variables used to estimate potential water savings
in an, indoor IC facility, are high efficiency toilets, high efficient
urinals, and high efficient faucets, and more specifically the water use
associate with each flush or water use per minute for the faucets of
these technologies. In order to understand potential savings, I
developed a scenario environment to calculate and compare an existing
water budget.
The model scenario assumes the following:
50,000 square foot office building
Building operates 300 days/year
250 sq. ft./ person 100 males and 100 females City of Austin commercial
customer water rates 12 toilets; 6 urinals; 10
sinks Female flushes toilet 3
times/day
Female uses sink 45 seconds/day
Male flushes toilet .5 times/day
Male flushes urinal 2 times/day
Male uses 30 seconds sink/day
No rebates Existing toilet uses 3.5 GPF Existing sink uses 2.2 GPM Existing urinal uses 3.0
GPF
I first built out the existing water budget, for the lavatory use in
the office building, using the parameters above, in an excel
spreadsheet. I then used the same parameters but substituted the
water associated with high efficient toilet, urinal, and sink. I compared
two different scenarios for the indoor. Scenario one considers replacing

toilets with high efficiency toilets that used 1.6 GPF; replacing urinals
with 1.0 GPF high efficient urinals; and adding faucet aerators to the
existing faucets to yield a 1.5 GPM flow rate. Scenario 2 is a higher
water saving scenario and considers retrofitting with composting
toilets which use zero water; waterless urinals which also use zero
water, and sink aerators which use 0.5 GPM flow rate. The associated
costs of the technologies were derived from using the average cost
either from literature sources, or web searches. By using the cost, and
comparing the high efficient technologies to the existing water budget,
I was able to understand water saving, cost savings, and how long a
return on investment would take.
Outdoor Methods
The outdoor methods used the same quasi experimental-
comparative analysis research design, as the indoor methods. And
therefore, I calculated the water budget of an “existing” landscape, and
compared it to the savings and cost associated to these technologies:
soil moisture controllers, evapotranspiration controllers, rainwater
harvesting systems, and the practice of landscape conversion to more
drought tolerant and native plants, referred to as a smartscpae in this
analysis.

To calculate the existing landscape budget, I used the Simplified
Landscape Irrigation Demand Estimation (SLIDE) formula (Pettinger
2014).
ETo is the historic average monthly evapotranspiration in inches (I used the annual ETo to get an annual estimation)
PF is the plant factor average for the plant categories, 1 to x, for each month, January through December
P is the historic average precipitation in inches for each month January through December.
LA1-x is the landscape area devoted to a respective plant category, 1 through x (Sq. ft)
0.623 is the factor to convert units to gallons. DU is the distribution uniformity of irrigation application, assumed 0.7 (70%
efficient) LREST is the leaching requirement needed only for water taken from the Trinity
portions of the aquifer or those with similar salinity levels.-( Not applicable and Not included*)
For the outdoor case scenario modeled I assigned a size parameter of a large-scale IC landscape size of 2 acres. I then assigned a hypothetical landscape plant cover.
Table 4. Existing Landscape Plant Cover (Outdoor)
Plant Type Percent Cover Sq. ft. of cover(2 acres)
Plant Factor
Trees 5% 4356 0.6Turf (warm species) 60% 52272 0.6Hardscape 5% 4356 0Shrubs/Bushes 20% 17424 0.6

Flower Beds 10% 8712 0.8 (Pasch
2015)
Due to the scale of this analysis, other factors, such soil type and
depth, were not taken into consideration. The cost associated with
water is from Texas League Survey Residential and Commercial Water
Cost (2015).
To represent different climatic zones of Texas, the different
scenarios were applied to Houston, Austin, San Antonio, Dallas, and El
Paso. Even though cities like El Paso on average do not have this type
of landscape design in a desert environment, the same design was
assumed for comparative analysis purposes.
Table 5. ET and Precipitation Rates of five Texas Cities (Outdoor Scenario)
City Evapo-transpiration
(Average)
Precipitation Conversion Factor
(Unit to Gallons)
DU
Houston 54.9 47.7 0.623 0.7Austin 57.5 33.2 0.623 0.7San Antonio 58.2 30.1 0.623 0.7Dallas 55.9 34.8 0.623 0.7El Paso 79.3 8.6 0.623 0.7
(Pasch
2015)
Lastly, in calculating the case-scenario outdoor landscape
budget, I assumed an overwatering factor of 30 percent, because
literature consistently demonstrated lawns were being over watered.
Irrigation Controllers
Because I did not have the time to run an actual pilot test of all of
these technologies, I used an average water-savings percent and costs
of the technologies, for the soil moisture irrigation controllers and the
evapotranspiration irrigation controllers, from credible literature
sources (Mayer, Lander, & Glenn 2015).
Rainwater Harvesting
In order to calculate the potential water savings from a rain
water harvest system, my supervisor, Jonathan Kleimann helped me
configure the necessary size and cost of the system by assuming
roof/catchment area is 10,000 square feet, and by using the
precipitation data in the five cities under examination, the size of the
barrel necessary to capture average monthly rain fall was determined.
It was assumed that the cistern would be made of fiberglass and a
standard price of $0.75 per sq. ft. for the material was used. Additional
costs assumed included the cost of the gutters, the box washer,
pumping system for reuse, and disinfection system
Smartscape Design
The Smartscape design was calculated by using the same
Simplified Landscape Irrigation Demand Estimation (SLIDE) formula.
The smartscpae landscape represented a more drought-tolerant design

landscape by decreasing turf coverage, changing overall plant cover,
and changing plant coefficient factors that associated with more
drought tolerant plants.
Table 6. Smartscape Landscape Plant Cover and Type
Plant Type Percent coverSq. ft of cover
(2 acres) Plant Factor
Trees 5% 4356 0.6Turf (warm species) 20% 17424 0.6Hardscape/gravel 25% 21780 0Natives 50% 43560 0.3
(Pasch
2015)
After the existing landscape budget was calculated I was able to
compare how much water how much it cost, and how long the return
on invest would take for each technology and practice.

Chapter 5
DISCUSSION OF RESULTS
Indoor Results
Table 7. Existing Water Budget for Bathroom Use in the Office Building Indoor Case Scenario
Technologies Used Total water use/ year
(Bathrooms)
Annual water cost
Sink: 2.2 gpmToilet: 3.5 gpfUrinal: 3.0 gpf
630, 000 gallons $4, 736
(Pasch 2015)
Table 8. Scenario 1: I Indoor Bathroom Water Use with High Efficiency Technologies
Technologies
Used
Total Water Use/ year
Percent Water reducti
on
Annual Water
Savings
Approximate cost
of project:
Return on
Investment
Toilet: 1.6 gpf
Urinal: 1.0 gpf
Sink: 1.5 GPM
284, 250 gallons
55% $2, 082 $5,500 2.5 years
(Pasch 2015)

Table 9. Scenario 2: Indoor Bathroom Water Use with Higher Efficiency Technologies
TechnologiesUsed
Total Water Use/ year
Percent Water reducti
on
Annual Water Saving
s
Approximate cost
of project:
Return on
Investment
Composting toilet: 0
Waterless urinal: 0
Sink: 0.5gpm
18,750 gallons
97% $3,023 $35,000 11 years
(Pasch 2015)
In scenario 1 replacing old plumbing devices with high-efficiency
fixtures and technologies resulted in significant water and cost savings.
By using the technologies in the “high water savings” scenario, 55
percent of water is reduced in bathrooms. The return on investment is
also relatively high and after 2.5 years, after that, this facility will be
saving approximately $3,023 dollars annually.
In scenario 2, using a 0.5 GPM faucet, waterless urinal, and
composting toilet resulted higher water savings, and illustrated 97
percent reduction in bathroom water use. The cost of this project is
likely too high for a facility owner to take this option, but as technology
progresses, the prices of these technologies will likely decrease,
making this scenario more probable.
Outdoor Results
Table 10. Outdoor Existing Landscape Water Budget Cities Total
GallonsTotal Gallons(considering
30% over watering/Lea
ks)
Inches of water
(per year)
Cost ($250 per
50,000 gals)
Houston 1,211,404 1,574,824 29 $7,874
Austin 2,260,254 2,938,329 54 $14,691
San Antonio 2,496,125 3,244,962 60 $16,224
Dallas 2,043,773 2,656,904 49 $13,284
El Paso 5,311,632 6,905,121 127 $34,525
(Pasch 2015)

The existing landscape water budget, uses a significant amount
of water for ornamental use. The “total gallons” represents the amount
of supplemental water needed to satisfy the landscape according the
associated crop coefficients, ET rates, and precipitation values.
However, literature shows that overwatering normally occurs, so a 30
percent overwatering factor was applied, and the total annual water.
The comparative analysis uses the volume considering the 30 percent
over watering factor. Each of the results below are demonstrative of
the water savings at one facilities’ two-acre IC landscape, as described
in the methods above.
Table 11. Landscape Water Budget Considering Soil Moisture Sensors (SMS)
Cities Existing Landscape Water Use(gals/year)
Landscape Water Use with SMS(gals/year)
Water Savings
(gals/year)
PercentWater
Savings
Cost Savings
Houston 1,574,824 551,188 1,023,636 65% $4,942
Austin 2,938,329 1,028,415 1,909,914 65% $9,769
San Antonio 3,244,962 1,135,736 2,109,225 65% $9,795
Dallas 2,656,904 929,916 1,726,988 65% $7,572

El Paso 6,905,121 2,416,792 4,488,328 65% $19,679
(Pasch 2015)
Studies have shown soil moisture controllers demonstrate
consistent ability to save water. AWE determined that, on average,
SMS reduces water use by 65 percent. However, this technology is not
as well suited for arid climates and has demonstrated its ability to
overwater in dry climates and soil conditions. But consistently, this
technology has demonstrated great water saving capabilities and is a
great option for facility owners that are not willing to convert turf, to
drought tolerant plants.
The water savings were significant and the return on investment
was under one year for this technology, allowing the IC facility owners
to profit thousands of dollars annually from this water reduction
technology. Nine SMS sensors were used, each covering 11% percent
of the overall area. The investment cost for this project is around
$3,250.
Table 12. Landscape Water Budget Considering ET Controllers

Cities Existing Landscape Water Use(gals/year)
Landscape Water Use
with ET Controllers(gals/year)
Water Savings
(gals/year)
PercentWater
Savings
Cost Savings
Houston 1,574,824 1,118,125 456,699 29% $2,283
Austin 2,938,329 2,086,214 852,115 29% $4,260
San Antonio 3,244,962 2,303,923 941,039 29% $4,705
Dallas 2,656,904 1,886,402 770,502 29% $3,852
El Paso 6,905,121 4,902,636 2,002,485 29% $10,012
(Pasch 2015)
The inconsistent water savings data associated with ET
controllers make this technology less reliable than the consistent
savings associated with soil moisture sensors. However, when used
correctly, this technology can reduce water use significantly. The
average percent reduction used for the ET controllers, is the average
between 24-34 percent savings, the average savings identified by
Alliance for Water Efficiency (AWE 2015).
The investment cost for this project is only around $850. The
return on investment for this project would be less than a year
resulting in significant annual water and cost savings.

Table 13. Landscape Water Budget Considering Rainwater Harvesting
Cities Project Cost Existing Landscape Water Use(gals/year)
Landscape Water Use
with Rainwater Harvesting(gals/year)
Water Savings(gals/ye
ar)
PercentWater
Savings
Cost Saving
s(After ROI)
Houston $21,070 1,574,824 1,277,474 297,351 19% $1,487
Austin $17,320 2,938,329 2,731,368 206,961 7% $1,035
San Antonio
$14,320 3,244,962 3,057,326 187,636 6% $938
Dallas $17,320 2,656,904 2,439,969 216,935 8% $1,085
El Paso $6,070 6,905,121 6,851,510 53,610 1% $268
(Pasch 2015)
Rain water catchment systems yielded the lowest savings at the
highest cost. Rain water catchment technologies appear to be more
appropriate for smaller scale IC or residential landscapes. In addition,
the rainwater harvesting systems were only relevant for some cities,
while other cities, such as El Paso, demonstrated a very low ability to
harness this technology due to low precipitation events.
Rainwater catchment systems usually have operational and
maintenance associated with the system, particularly the larger rain
cistern, adding to the reasons that make this technology less effective.
The time and cost it takes to repair a system sometimes results in

people negating the system all together. Therefore, the smaller systems
used by homeowners appear to be a more viable alternative until
technology increases and maintenance personnel are accurately
educated on the sustaining the systems.
Table 14. Landscape Water Budget Considering Smarscape design
Cities Existing Landscape Water Use(gals/year)
Landscape Water Use
with Smartscape Design(gals/year)
Water Savings
(gals/year)
PercentWater
Savings
Cost Savings
(After ROI)
Houston 1,574,824 247,475 1,327,349 84% $6,636
Austin 2,938,329 597,767 2,340,562 80% $11,702
San Antonio 3,244,962 769,705 2,475,257 76% $12,376
Dallas 2,656,904 501,251 2,155,653 81% $10,778
El Paso 6,905,121 2,557,967 4,347,153 63% $21,735
(Pasch 2015)
The smartscape design resulted in the greatest reduction in
water use and, on average, saved 78 percent, assuming no over
watering occured. The primary barrier to this approach is the higher
up-front cost of around $1.50/sq. ft. (Rymer 2010) or around $100,000
applying it to the two-acre case scenario. However, annual
maintenance and maintenance cost are reduced with a more native
landscape by about 1/3 of the “existing” landscape scenario (Sovocool,

2005). In the modeled scenario, the average return on investment is 8
years; however, taking into account annual O&M savings, the
landscape redesign can provide an additional $9,000 during the 8-year
payback period.
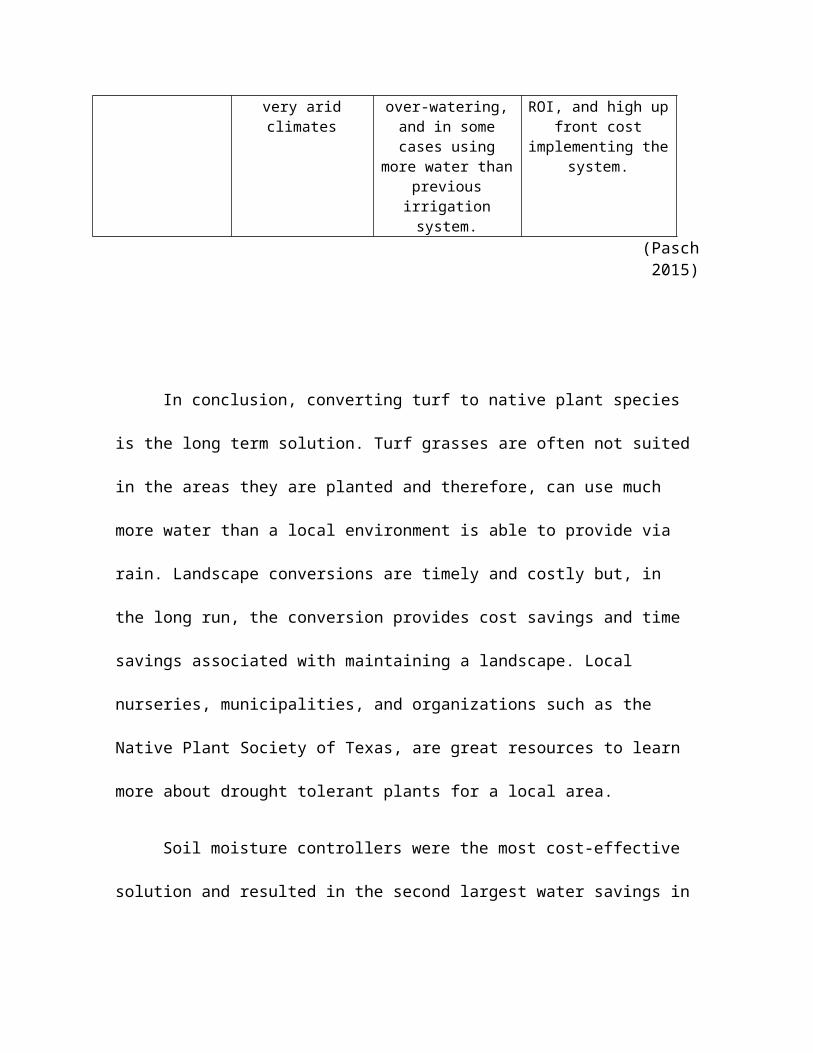
Table 16. Overall Outdoor Results
Highest Savings
Native/Drought tolerant
landscape design
Best Cost/water savings
Soil Moisture controllers
Potentially water efficient
ET Controllers
Lowest Cost and Water Savings
Rain Water Harvesting
Estimated project cost:
$100,000
Estimated project cost:
$3,245
Estimated project cost:
$850
Estimated project cost:
$15,000
Water savings:2,697,431
gallons
78%
Water savings:2,070,390
gallons
57%
Water savings:1,053,357 gallons
29%
Water savings:192,500 gallons
8%
Water cost savings:
$13,487
Water cost savings:
$10,352
Water cost savings:
$5,267
Water cost savings:
$962Advantages:
Large water savings, low
maintenance, low annual O&M
Advantages:
Cheaper, effective,
accurate, fast ROI
Advantages:
Cheaper, can reduce water
usage on landscapes
Advantages:
Rain water harvesting can still
offset outdoor water use up to

cost, low dependence on municipal water
20% in areas with higher rain events
in Texas. Disadvantage
s:
Time-intensive project, slow
ROI, expensive up front cost
Disadvantages:
Soil moisture sensors may not be accurate in
very arid climates
Disadvantages:
Studies have demonstrated
these technologies can
result in over-watering, and in
some cases using more water than
previous irrigation system.
Disadvantages:
Associated operational and
maintenance time and cost of the
system; Long ROI, and high up front
cost implementing the system.
(Pasch 2015)
In conclusion, converting turf to native plant species is the long
term solution. Turf grasses are often not suited in the areas they are
planted and therefore, can use much more water than a local
environment is able to provide via rain. Landscape conversions are
timely and costly but, in the long run, the conversion provides cost
savings and time savings associated with maintaining a landscape.
Local nurseries, municipalities, and organizations such as the Native
Plant Society of Texas, are great resources to learn more about
drought tolerant plants for a local area.
Soil moisture controllers were the most cost-effective solution
and resulted in the second largest water savings in the study. The short

term payback makes this the first option for landscapes who do not
plan to reduce turf.
ET controllers had a short payback and significant water and
cost savings. However, compared to other smart technologies like the
SMS, the ET controllers saved less water overall. Therefore this
technology was the third option for facility owners with large amounts
of turf.
Lastly, the rain harvesting systems had the longest pay back,
expensive up-front cost, and smaller water saving capacities. There is
still large potential to offset dependency on local water sources with
rain water. Rain water harvesting is highly recommended for areas
who get regular rain events, and less applicable in drier climates such
as El Paso.
Conservation Potential in Texas
By examining the savings associated with indoor, outdoor, and
alternative technologies, it is easy to get a picture of the large water
savings that can occur on a facility level. But how does this expand on a
state level? How much water can Texas save and secure for the future
in the IC sector as a whole?
Currently Texas does not know, however, Texas will have a better
idea of how effective conservation efforts have been once the new
reporting data is released by TWDB in 2016. By understanding the

extent of conservation in different sectors, Texas will have a good idea
of what percentage of conservation potential remains. In addition, task
forces, such as the Austin Water Resource Planning Task force, are
also working on an answer to the question, “How much potential
remains?” on a city level.
California is one of the only states who has approximated
remaining conservation potential in different sectors. The study Waste
Not Want Not, by Pacific Institute, estimated that, on average, 39
percent of water used in the institutional, commercial, and industrial
sector could be saved in California. By applying a similar conservative
estimate of 30 percent potential water savings in the IC sector, Texas
could save 363, 840 acre feet or 167,000,000,000 gallons a year. This
amount of water savings could fill the Highland Lakes (Lake Travis and
Lake Buchanan) by around 35 percent. By reducing water use by 30
percent in the IC sector, Texas would be halfway to meeting the target
goal of 650,000 acre-feet.
In addition to water savings, there is also energy savings
embedded in the reduction of water use. Primarily, energy is embedded
in hot water use and in water distribution. Applying the average
kilowatt per hour (KWH) associated with water distribution only,
reducing water use by 30 percent in the Texas’ IC sector, could also
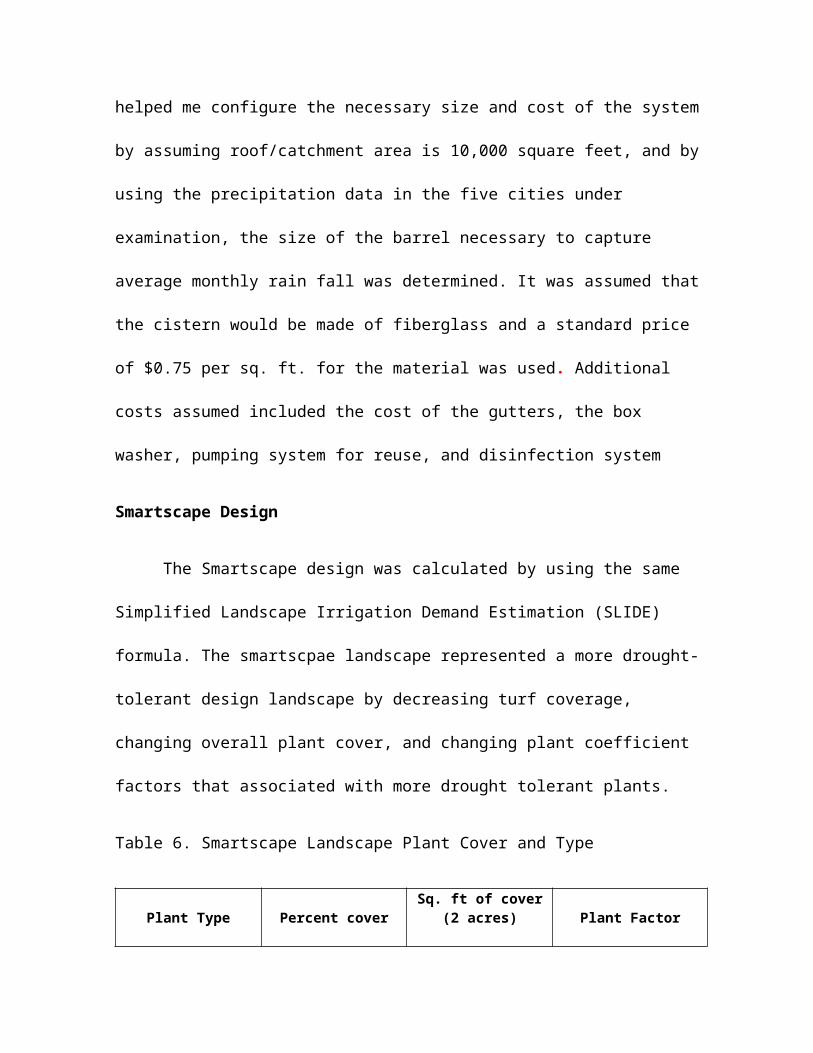
eliminate 384,100,00 KWH of energy, or enough energy to power
University of Texas in Austin 3.5 times (Green 2015).
Texas cannot afford to wait to target the IC sector until a study
on conservation potential is finished. By using case studies and
building scenario models, water conservation coordinators across
Texas, the state can begin to recommended projects that will reduce
water consumption now.
There are many important steps Texas can take to make water
conservation in the IC sector more available and successful in the
future.
Recommendations for Moving Water Conservation Forward
Best Management Practices and Technical Reference
Manual
The first step is providing the IC sector with the necessary
resources they need to act. The current lack of information and
inconsistent data regarding water conservation projects is hindering
action. It therefore is crucial that water leaders in Texas produce a
Best Management Practices (BMP) book to provide direction in best
practices in this sector. TWBD is currently collaborating with other
organizations in Texas, such as the Texas Council Water Advisory, to
create a BMP book for the IC sector however, it is unknown when it

will be released. In addition, the IC sector also needs a Technical
Reference Manual (TRM) to serve as a mechanical and procedural
handbook to implement projects. A book of demonstration projects
could also serve the similar function of providing guidance, and report
on savings and cost associated, however there are little demonstration
projects available to use as examples.
Mandatory Reductions
A second solution to propelling conservation forward is creating a
policy that gives TWDB the regulatory power to impose mandatory
conservation requirements for municipalities. Right now, Californians
are abruptly and aggressively cutting back on water use to comply with
the mandatory 25 percent water reduction requirements mandated by
the governor. With all of the rain Texas has recently received, Texas is
in a position to be proactive now instead of reactive in the future, since
more periods of drought are inevitable. Mandatory water reduction
requirements can keep Texas on tract for ensuring adequate water
supply for the future.
Education and Outreach
A third solution is to increase the education and outreach efforts
of the water utilities into the IC sector. Cities such as Austin and Dallas
have extensive budgets for commercial rebates, but in reality, a low
number of incentives are actually utilized by customers. A barrier in

the IC sector that prevents facility owners from moving forward with a
project is simply the time and cost it will take for them to implement a
project. By increasing outreach into the IC community and educating
persons on available incentives, the IC sector is more likely to respond
and take action on implementing a project that will save them money.
Revise the Water Rate Structure
The final recommendation to increase the success of water
conservation in the IC sector is to change the water rate structure to
reflect the actual cost of water. Currently, water is extremely
underpriced. Not only does the (relatively) inexpensive cost of water
support greater use of the resource, but it has also caused water
utilities to go into debt. This is because of fixed costs, which include
things such as debt payments for project upgrades (ex. smart meters or
new waste water facilities), salaries, and chemicals for water
treatment, account for 80 percent of the utilities operating expense,
while variable costs like operating expenses account for approximately
20 percent of the operating expense. However, the revenue structure is
reversed, which results in 80 percent of the utility’s income being
based on how much water you use, while 20 percent of the resident’s
water bill is based on fixed cost (percentages are approximations). So
every year the city is more successful with conservation, or it is a wet
year, the utility loses money and falls into deeper debt.

Residents don’t just pay for water, they pay for water that is
cleaned, treated, and delivered directly to their faucets, as well as for
new infrastructure and upgrades to existing infrastructure. Therefore,
prices that reflect the true cost of water would likely encourage more
people to conserve it, as well as allowing the utilities to have the
financial support to promote conservation instead of going further into
debt when they lose out on water sales.

Chapter 5
CONCLUSION
There is not a “one size fits all” solution when it comes to water
conservation in Texas. Rather, success will be a result of multiple
solutions working together. Texas is working on different strategies
such as fixing leaks in the underground water infrastructure,
implementing agricultural technologies to increase water efficiency,
creating new policies to better support water management, and using
new inventions, like desalination, to add new water supplies to the
existing water supplies. All of these play an important role and are
necessary to ensure there are adequate water supplies for the future,
but the easiest, most cost-effective solution, is simply conservation.
Water conservation efforts will have to expand in the municipal
sector to meet the future demand. Conservation efforts have been
successful in the residential sector where most of the efforts have been
focused. There is still plenty of room for the residential sector to
become more efficient, and possibly even more untapped potential in
the IC sector. The IC sector plays an equally important role in reducing
reliance on municipal water supply, and though conservation so far has

been low, there is great potential for the IC sector to save water, and
by doing so, save money and energy associated with water use. This
paper has identified different technologies and practices the IC sector
can use to undertake water conservation projects now.
The results have determined, that by replacing old plumbing
devices with high-efficiency fixtures: a toilet that uses 1.6 gallons per
flush, faucets that use 1.5 gallons per minute, and urinals that use 1.0
gallons per flush, indoor water use in bathrooms can be reduced by
fifty-five percent, and have short return on investment. For the office
building scenario used in this analysis, the return on investment is 2.5
years. In addition, this study showed that a significant amount of water
can be saved in the outdoor setting for IC landscapes using smartscape
practices and water efficient technologies. Using the climatological
data for five selected cities in Texas, Houston, Austin, San Antonio,
Dallas, and El Paso, on average, it was found in the case scenario used
in this study, converting an existing landscape to a smartscape
landscape could help reduce water use by seventy-eight percent in IC
landscapes. While the water savings are significant, the project is
costlier and this study found it would take roughly eight years for the
return on investment, however less money and time would be spent on
landscape maintenance overall. In addition, this study found that soil
moisture controllers were an excellent choice for facility owners who
wanted to keep the existing landscape, and not convert to more

drought tolerate plants. Soil moisture controllers demonstrated the
ability to save up to fifty-seven percent of water used on the landscape,
and have a one year return on investment.
The technologies listed in this paper are a great way to start
engaging in water conservation projects now, but Texas will have to be
more creative and aggressive in applying cutting edge technologies like
AC condensate reuse in IC buildings, and using on-site decentralized
treatment systems, to clean and reuse grey water for toilets and
landscapes. Hopefully, in the near future, Texas will use drinking
water, and possibly rain water for potable consumption only, and use
grey water and recycled water for non-potable sources, like toilets and
landscape irrigation. Texas has the ability to use water in a truly
efficient way, while still maintaining a high quality of life.
Texas has historically been known as the oil and coal state, but
now, in response to the need for clean energy, Texas is also known as
the state producing the largest amount of wind energy. Texans are
inventive and resilient, and pride themselves in stepping up to a
challenge. The challenge of the 21st century has presented itself:
ensuring there is enough water supply for the environment,
agriculture, and future populations. By employing the solutions
presented in this paper, by educating Texans on the true value of
water, and by implementing new water efficient technologies, Texas

will be positioned for a secure future, even in drought conditions.
Water conservation for Texas, simply will, and must, become a way of
life.
Bibliography
Alliance for Water Efficiency. Condensate Water Introduction. 2010. http://www.allianceforwaterefficiency.org/Condensate_Water_Introduction.aspx (last accessed September 2, 2015).
Alliance for Water Efficiency. 2010. Faucet Fixtures Introduction. http://www.allianceforwaterefficiency.org/Faucet_Fixtures_Introduction.aspx (Last Accessed sept. 9, 2015).
Burnett, John. "How One Drought Changed Texas Agriculture Forever." NPR. 07 July 2012. Web. <http://www.npr.org/2012/07/07/155995881/how-one-drought-changed-texas-agriculture-forever>.
Cabrera, Ryan., Wagner, K., Wherley, B., Lesley, L. 2013. An Evaluation of Urban Landscape Water Use in Texas. Texas Water Journal, 4(2):14‐27.
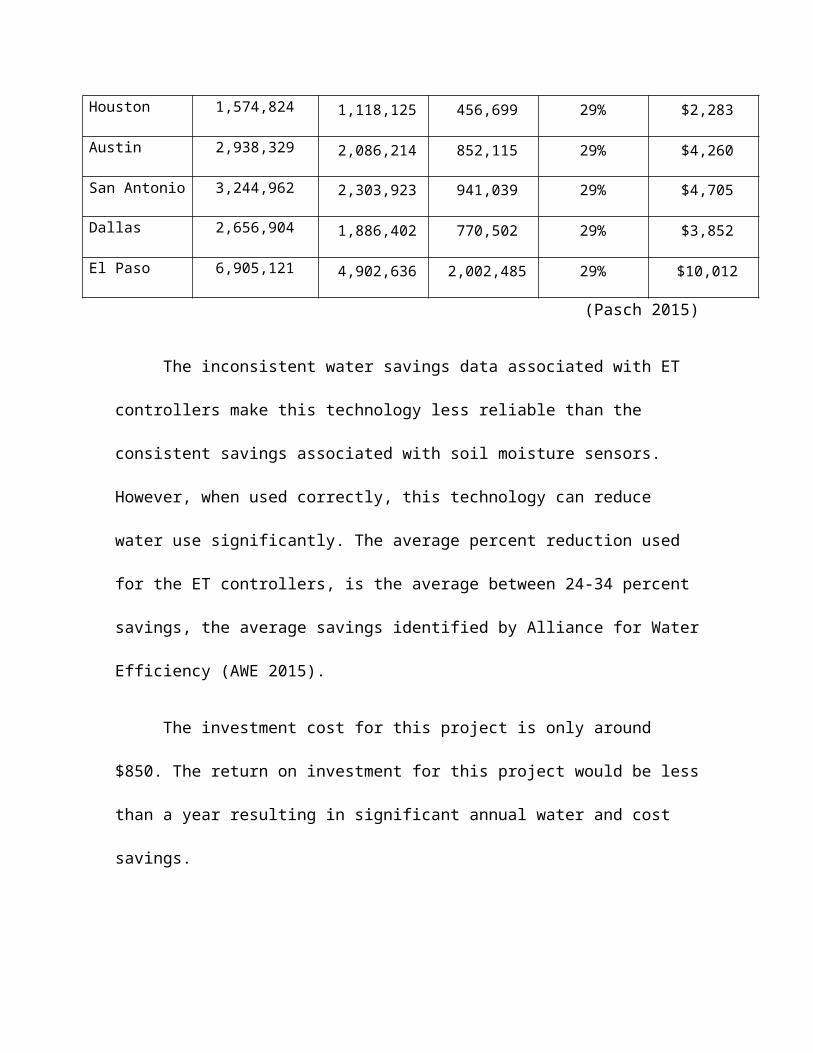
City of Austin. ICI Water Audit Pilot Rebate Program. Water Efficiency Audit. http://www.austintexas.gov/sites/default/files/files/Water/Conservation/GSA.pdf (last accessed December 1, 2015).
City of Austin. 2015. Water Conservation Expense Categories. Austin Finance Online. https://www.austintexas.gov/financeonline/finance/budget/object.cfm?dept=2200&fund=5020&div=NVAC&grp=NCON (last accessed on Nov 29 2015).
Cleaveland, Malcolm K., Todd H. Votteler, Daniel K. Stahle, Richard C. Casteel, Jay L. Banner, “Extended Chronology of Drought in South Central, Southeastern and West Texas,” Texas Water Journal, Vol. 2, Iss. 1 (2011): 54 – 96.
Combs, Susan. 2012. The Impact of the 2011 drought and Beyond. Texas Comptroller of Public Accounts. Austin, TX.
Crook, James. 2004. Innovative Applications in Water Reuse: Ten Case Studies. Water Reuse Association. Alexandria, VA. 2-38.
Davis, S.L. and M.D. Dukes. 2014. Irrigation of Residential Landscapes Using the Toro Intelli‐Sense Controller in Southwest Florida. ASCE Journal of Irrigation and Drainage Engineering. 2014.140.
DeOreo, W.B. et. al. 2008. California Residential Baseline Water Use Study. Aquacraft, Inc., Boulder, CO.
Dukes, Michael D.; Shedd, Mary; Cardenas-Lailhacar, Bernard. 2015. “Smart Irrigation Controllers: How Do Soil Moisture Sensor (SMS) Irrigation Controllers Work?”. University of Florida IFAS Extension.
Ender-Wada, J., Kurtzman, J., Keenen, S., Kjelgren, R., Neale, C. 2008. Situational Waste in Landscape Watering: Residential and Business Water Use in an Urban Utah Community. Journal of the American Water Resource Association. 44: 902-920.
EPA WaterSense. 2012. Saving Water in Restaurants.http://www3.epa.gov/watersense/commercial/docs/factsheets/restaurants_fact_sheet_508.pdf (last accessed on Aug. 5 2015).
EPA WaterSense. 2015. Types of Facilities.

http://www3.epa.gov/watersense/commercial/types.html (last accessed August 23, 2015).
EPA WaterSense. 2015. Bathroom Sink and Faucets & Accessorieshttp://www3.epa.gov/watersense/products/bathroom_sink_faucets.html (last accessed July 22, 2015).
EPA WaterSense. Indoor Water Use in the United States.http://www3.epa.gov/watersense/pubs/indoor.html (Last accessed July15, 2015).
EPA WaterSense.2009. Water Efficiency in the Commercial and Institutional Sector: Consideration for a WaterSense Program.
Gualey, Bill & Koeller, John. 2010. Sensor-Operating Plumbing Fixtures: Do they Work? Veritec Consulting Inc. / Koeller & Co. 1-11.
Gleick, P., Haasz, D., Henges-Jeck, C., Srinivasan, V., Wolff, G., Cushing, K., Mann, A. 2003. Waste Not, Want Not: The Potential for Urban Water Conservation in California. Pacific Institute. Oakland, CA.
Glenn, D., Lander, P., Mayer, P. 2015. Outdoor Water Savings Research Initiative Phase 1 – Analysis of Published Research. Alliance for Water Efficiency.
Hegar, Gleen. 2011. The Economic Consequences of Drought. The Texas Economy. http://www.thetexaseconomy.org/natural-resources/articles/article.php?name=drought (Last accessed Nov. 1. 2015).
Gotcher, Malarie; Quetone Moss, Justin; Taghvaeian, Saleh. “Smart Irrigation Technology: Controllers and Sensors”. Oklahoma Cooperative Extensions Fact Sheet HLA-6445, Oklahoma State University.
Gregg, T., Strub, d., Gross, D. 2007. Water efficiency in Austin, Texas, 1983-2005. Journal American Water Works Association. 98:2.
Green Building Council. 2009. Water Use Reduction Additional Guidance. http://www.usgbc.org/Docs/Archive/General/Docs6493.pdf (last accessed July 7, 2015).

Greene, David. Climate Program Coordinator. City of Austin. Provided information about embedded energy figures- Austin averages. (Email Nov. 7, 2015).
Gross, Drema. 2015. Planning for Revenue Loss due to Conservation or Drought Presentation. 9th Annual North Texas Water Conservation Symposium. Arlington, TX.
Fannin, Blair. 2012. Updated 2011 Texas Agriculture drought losses total $7.62 billion. Texas A&M Agrilife Extension.
Hickey, Denise. 2014. Water Conservation Success: NTMWD’s Water Awareness Campaign Presentation. Water IQ. Dallas, TX.
Hill, S., Birks, R., McKenzie, B.2002. The Millienum Dome Watercycle Experiment: to evaluate water efficiency and customer perception at a recycling scheme for 6 million visitors. Water Science and Technology. 46: 233- 240.
Hendrickson, Kenneth. 1985. The Texas River Authorities and the Water Question: A Case Study in Conservation. The History of Soil and Water Conservation: A Symposium. 59: 269-279.
Hoffman, Bill. ICI Programs in Texas Presentation. Water Management Inc.
Hermittee, S.M., Mace, R. E. 2012. The Grass is Always Greener….Outdoor Residential Water Use in Texas. Texas Water Development Board. 1-43.
IEc. 2008. Waterless Urinal Report and Evaluation. Industrial Economics Incorporated. Cambridge, MA.
Inman, J. and P. Jeffrey. 2006. A review of residential water conservation tool performance and influences on implementation effectiveness. Urban Water Journal, 3(3):127‐143.
Kleinman, Jonathan. Founder of AIQUEOUS. Conversation. Helped calculate rain harvesting scenario. (July, 3, 2015).
Mansur, E.T. and S.M. Olmstead. 2012. The value of scarce water: Measuring the inefficiency of municipal regulations. Journal of Urban Economics, 71:332‐346.

Mayer, P., Wm. DeOreo, M. Hayden, and R. Davis. 2009. Evaluation of California Weather‐based "Smart" Irrigation Controller Programs. Sacramento, CA: Department of Water Resources.
Miller, Kari. 2007. Celebrating 50 Years. Texas Water Resource Institute. 3; 24-28.
Pittenger, Dennis. 2013. Simplified Landscape Irrigation Demand Estimation: A New Paradigm Presentation. University of California. Los Angles, CA.
Pittinger, D. 2010. How Much Water Does a Landscape Need? Proceedings of Water Smart Innovations 2010. Las Vegas, NV.Texas Municipal League Surveys. Residential and Commercial Water Cost Details. 2015.
Rymer, Cathy. Save Money and Water with Xeriscaping Landscaping. http://www.amwua.org/pdfs/save_money_and_water.pdf (Last accessed Oct 5, 2015).
San Antonio Water Systems (SAWS). 2015. Recycling Centers. http://www.saws.org/Your_Water/Recycling/Centers/ (Last accessed Oct 5, 2015).
Satija, Neena. 2013. In DFW, Struggle to Save Water and Prepare for growth. The Texas Tribune. Sierra Club. 2015. Water Conservation by the Yard. http://texaslivingwaters.org/wp-content/uploads/2015/03/SC_WaterConservByYard_report_031115_R.pdf (last accessed September 25, 2015).
Sovocol, K.A. 2005. Xeriscape Conversion Study, Las Vegas, NV: Southern Nevada Water Authority
Sovocool, K.A., M. Morgan, and D. Bennett. 2006. An in-depth investigation of xeriscape as a water conservation measure, Journal AWWA, 98: 82-93.
Tarrant Regional Water District. 2014. Water Conservation and Drought Contingency Plan. Fort Worth, TX. 206.
Texas A&M Agrilife Extension. Irrigation Technology Program: ET Network. Average Rainfallhttp://texaset.tamu.edu/rainfall.php (last accessed August 1, 2015).
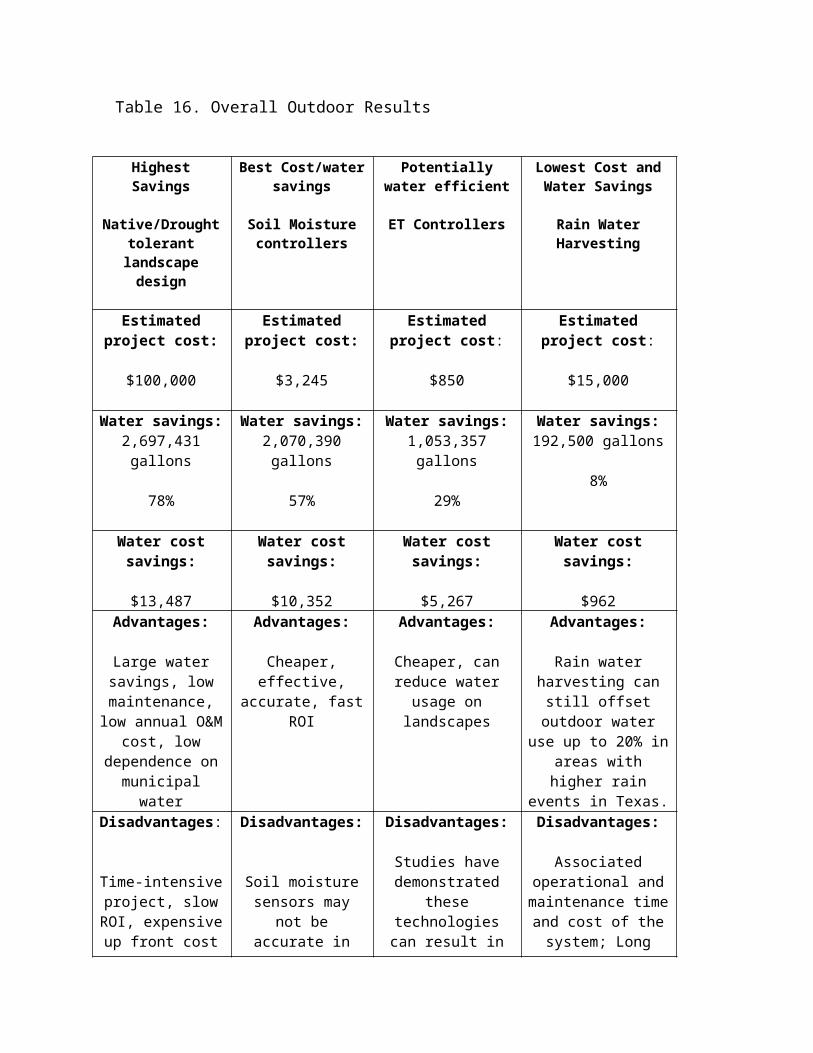
Texas A&M Agrilife Extension. Irrigation Technology Program: ET Network. Average Et Rateshttp://texaset.tamu.edu/pet.php (Last accessed October 20 2015).
Texas Water Development Board. 2012 State Water Plan: Population and Water Demands Projections. Texas Water Development Board.
Texas Water Development Board. 2006. Rainwater Harvesting Potential Guidelines for Texas. Report to the 80th Legislature, Texas Water Development Board. 1-41.
Texas Water Development Board. 2015. Water Use of Texas Water Utilities. Report to the 84th Legislature, Texas Water Development Board, 1- 27.
Texas Water Resource Institute. 2015. North Texas Municipal Water District, Water My Yard Program win Blue Legacy Award. http://twri.tamu.edu/publications/conservation-matters/2015/april/north-texas-municipal-water-district-water-my-yard-program-win-blue-legacy-award/ (Last accessed Novemebr 1, 2015).
University of Florida IFAS Extension. Cisterns/ Rain Barrels. http://buildgreen.ufl.edu/Fact_%20sheet_Cisterns_Rain_Barrels.pdf ( Last accessed November 1, 2015)
Water Conservation Advisory Council (WCAC). 2014. A Report on Progress of Water Conservation in Texas. Report to the 84th Legislator. 1-77.
Vikers, A. 2001. Handbook of Water Use and Conservation: Water plow Press, Amherst, Massachusetts.