icct_hdv_fc_lit-review_20150209.pdf - theicct.org while in china, “specialty” trucks, tractor...
TRANSCRIPT
www.theicct.org
JANUARY 2015WHITE PAPER
B E R L I N | B R U SS E L S | SA N F R A N C I S CO | WAS H I N GTO N
LITERATURE REVIEW: REAL-WORLD FUEL CONSUMPTION OF HEAVY-DUTY VEHICLES IN THE UNITED STATES, CHINA, AND THE EUROPEAN UNIONBEN SHARPE AND RACHEL MUNCRIEF
ACKNOWLEDGEMENTS
This work was generously funded by the ClimateWorks Foundation. The authors are grateful for this and other funding sources, which allow us to fulfill our mission of improving the environmental performance of vehicles in the transport sector. The contributions of Fanta Kamakaté of the ICCT were incredibly valuable.
For additional information:International Council on Clean Transportation1225 I Street NW, Suite 900Washington DC 20005 USA
www.theicct.org | [email protected]
© 2015 International Council on Clean Transportation
i
TABLE OF CONTENTS
1. Introduction .............................................................................................................................1
2. Overview of HDV markets and policy in the U.S., China, and the EU ........................... 3
2.1. Market overview ................................................................................................................................ 3
2.2. Regulatory overview ....................................................................................................................... 8
2.2.1 Tractor efficiency standards in the U.S. ......................................................................... 8
2.2.2 Tractor efficiency standards in China .......................................................................... 10
2.2.3 Test procedure and policy developments in the EU ..............................................11
3. Data sources ........................................................................................................................ 14
4. Tractor fuel consumption data for the three regions .....................................................18
4.1. Overview .............................................................................................................................................18
4.2. United States ....................................................................................................................................19
4.3. European Union ............................................................................................................................ 20
4.4. China ..................................................................................................................................................22
5. Summary and future research ...........................................................................................24
References ................................................................................................................................26
1
ICCT WHITE PAPER
1. INTRODUCTION
While efficiency standards for light-duty vehicles have been in place for many years in various countries and regions around the world, regulations to reduce heavy-duty vehicle (HDV) fuel consumption and greenhouse gas (GHG) emissions are in the early stages of development and implementation. To date, four countries—Japan, the United States, Canada, and China—have adopted standards to regulate the fuel efficiency of new HDVs. In addition, other major markets around the world are in various stages of developing their own regulatory programs to improve the fuel efficiency of HDVs.
As governments begin to implement regulatory programs to reduce HDV fuel use and GHG emissions, it is increasingly important for regulators to verify that the fuel savings anticipated from efficiency standards are realized in actuality. Moreover, HDV fleets and other industry stakeholders are deeply interested in better understanding whether the additional capital invested in more efficient vehicles is translating into the fuel savings purported in the rulemaking processes. Also of interest is the extent to which progress on HDV fuel efficiency in one region might impact technological improvements in other regions. Many of the top-selling HDVs in many regions around the world are sold by multi-national manufacturers that have a strong presence across many regions. As such, these global HDV producers and suppliers often look to spread the cost of investment in technology across as many regions as possible.
Unlike the case of passenger cars, data on HDV fuel efficiency are not currently readily available, which is the primary motivation for this literature review and subsequent research. This paper provides a summary of recent data for real-world fuel consumption of HDVs—specifically, tractor-trailers—in three regions: the United States, China, and the European Union. The primary objectives of this study are:
1. to provide a brief overview of the market and fleet characteristics of tractor-trailers in the U.S., China, and the EU and discuss the policy measures enacted in each region to promote increased HDV fuel efficiency
2. to describe the various types of fuel consumption data and their respective usefulness in assessing the impacts of fuel efficiency and GHG regulations
3. to synthesize all of the publically available real-world fuel consumption data in each region and illustrate the widespread lack of data across jurisdictions and underscore the need for further data collection and research in this area
4. to lay the foundation for future research that can more thoroughly analyze how the rates of fuel-saving technology deployment differ from region to region and how this translates into differing rates of efficiency improvement over time
This paper begins by presenting some summary data to describe the composition of the HDV fleets in the U.S., China, and the EU in terms of vehicle population breakdowns and contributions to overall fuel use within the HDV sector. This snapshot of the three markets is followed by a description of HDV fuel efficiency regulatory developments in the U.S., China, and the EU. The subsequent section discusses the different categories of fuel consumption data, what was available for this study, and the value of various types of data for illuminating the fuel savings impacts of HDV regulation.
It should be noted that due to regional differences in vehicle specifications, duty cycles, topography, and other country-specific conditions, fuel consumption data are difficult

2
LITERATURE REVIEW: REAL-WORLD FUEL CONSUMPTION OF HEAVY-DUTY VEHICLES
to compare quantitatively across various regions. As such, we do not emphasize comparison of the data across the three regions of interest in this study. Finally, in the conclusion we recommend future research that can build on this analysis, including assessing the market penetration of existing HDV fuel efficiency technologies and potential adoption rates of emerging technologies in the U.S., China, the EU, and other markets around the world.
3
ICCT WHITE PAPER
2. OVERVIEW OF HDV MARKETS AND POLICY IN THE U.S., CHINA, AND THE EU
Worldwide, freight vehicles are a major and growing contributor to fuel consumption and GHG emissions in the transportation sector. Despite their relatively small numbers, on-road commercial vehicles are responsible for a disproportionately large percentage of transport sector fuel consumption and GHG emissions due to their heavier weight and greater number of miles traveled. A number of studies suggest that in the 2020 to 2030 time frame, heavy-duty vehicles are estimated to overtake passenger cars as the largest global contributor to fuel consumption and GHG emissions within the transport sector (Fulton, Cazzola et al. 2009; Facanha, Blumberg et al. 2012; ExxonMobil 2013; U.S. Energy Information Administration 2014).
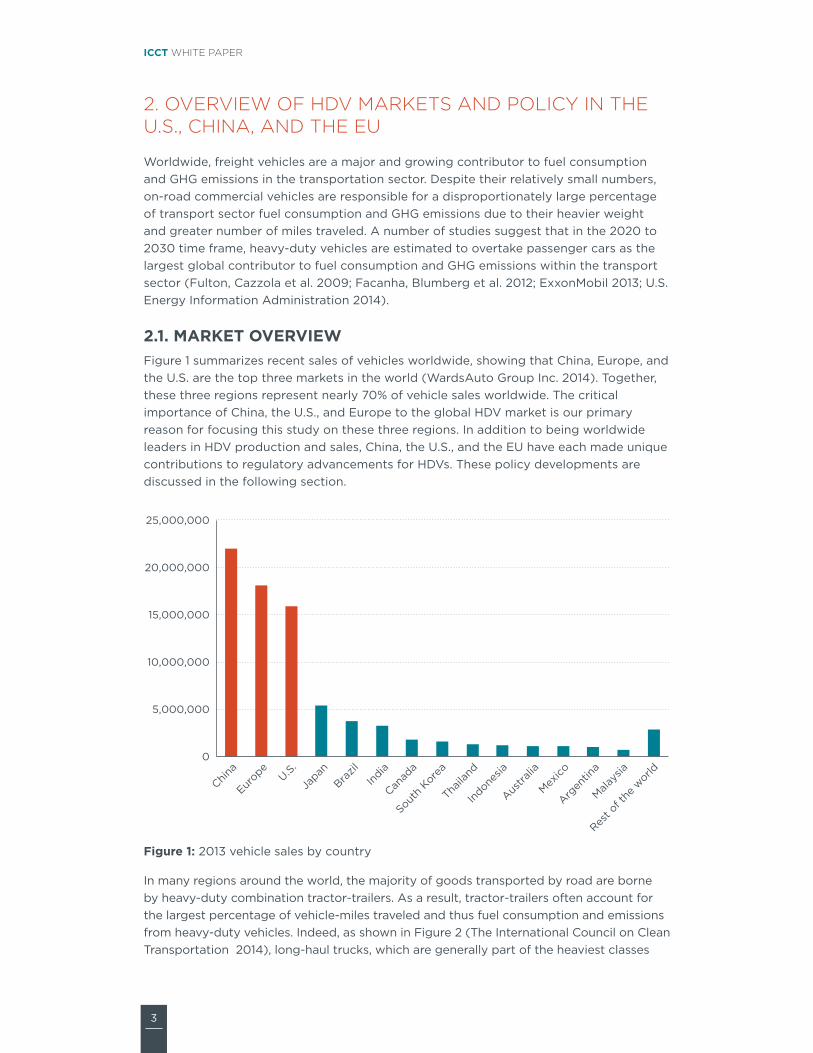
2.1. MARKET OVERVIEWFigure 1 summarizes recent sales of vehicles worldwide, showing that China, Europe, and the U.S. are the top three markets in the world (WardsAuto Group Inc. 2014). Together, these three regions represent nearly 70% of vehicle sales worldwide. The critical importance of China, the U.S., and Europe to the global HDV market is our primary reason for focusing this study on these three regions. In addition to being worldwide leaders in HDV production and sales, China, the U.S., and the EU have each made unique contributions to regulatory advancements for HDVs. These policy developments are discussed in the following section.
0
5,000,000
10,000,000
15,000,000
20,000,000
25,000,000
China
Europe
U.S.
Japan
Brazil
India
Canad
a
South
Korea
Thaila
nd
Indone
sia
Austra
lia
Mexico
Argen
tina
Malays
ia
Rest o
f the
world
Figure 1: 2013 vehicle sales by country
In many regions around the world, the majority of goods transported by road are borne by heavy-duty combination tractor-trailers. As a result, tractor-trailers often account for the largest percentage of vehicle-miles traveled and thus fuel consumption and emissions from heavy-duty vehicles. Indeed, as shown in Figure 2 (The International Council on Clean Transportation 2014), long-haul trucks, which are generally part of the heaviest classes

4
LITERATURE REVIEW: REAL-WORLD FUEL CONSUMPTION OF HEAVY-DUTY VEHICLES
of commercial vehicles (i.e., heavy heavy-duty vehicles, HHDV,), account for the bulk of emissions and fuel consumption for seven out of the nine nations currently considering fuel economy standards. The two important exceptions are Japan and South Korea, where medium-duty trucks and buses eclipse heavy-duty vehicle fuel use.
As discussed in the following section, the HDV market is so complex and varied that the U.S., Canada, and China have taken a “divide and conquer” approach, focusing the bulk of their regulatory attention on the most energy intensive vehicle types and, in particular, tractor trucks. Each of the countries and regions in Figure 2 has developed or is in the process of working toward regulatory programs to improve HDV fleet fuel consumption. The policy developments in the U.S., China, and the EU are discussed in Section 2.2.
Regulated
Regulations under
consideration
Heavy-duty freight vehicle fuel use (million BOE/day)
U.S. P P
China P P
EU-27 P
India P
Japan P P
Brazil P
Russia
Canada P P
Mexico P
S Korea P
Figure 2: Nations with active or emerging regulatory programs for heavy-duty vehicles (BOE = barrels of oil equivalent energy; HHDV = heavy heavy-duty vehicle; MHDV = medium heavy-duty vehicle; LHDV = light heavy-duty vehicle)
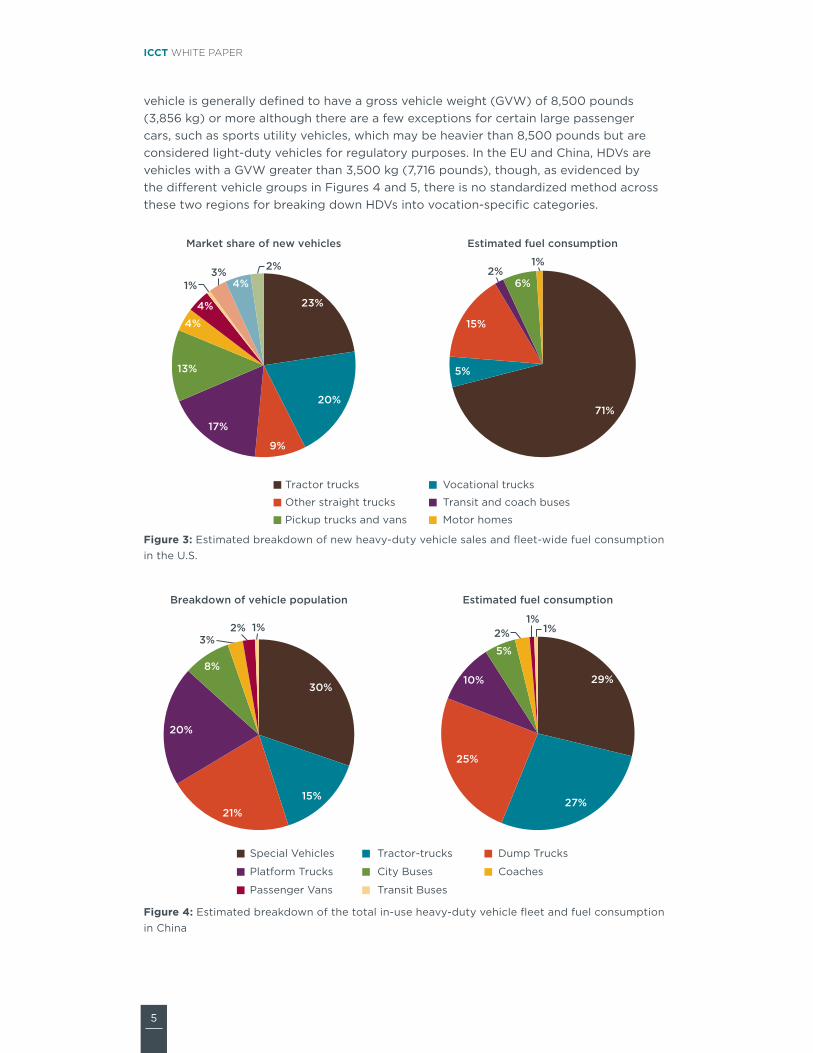
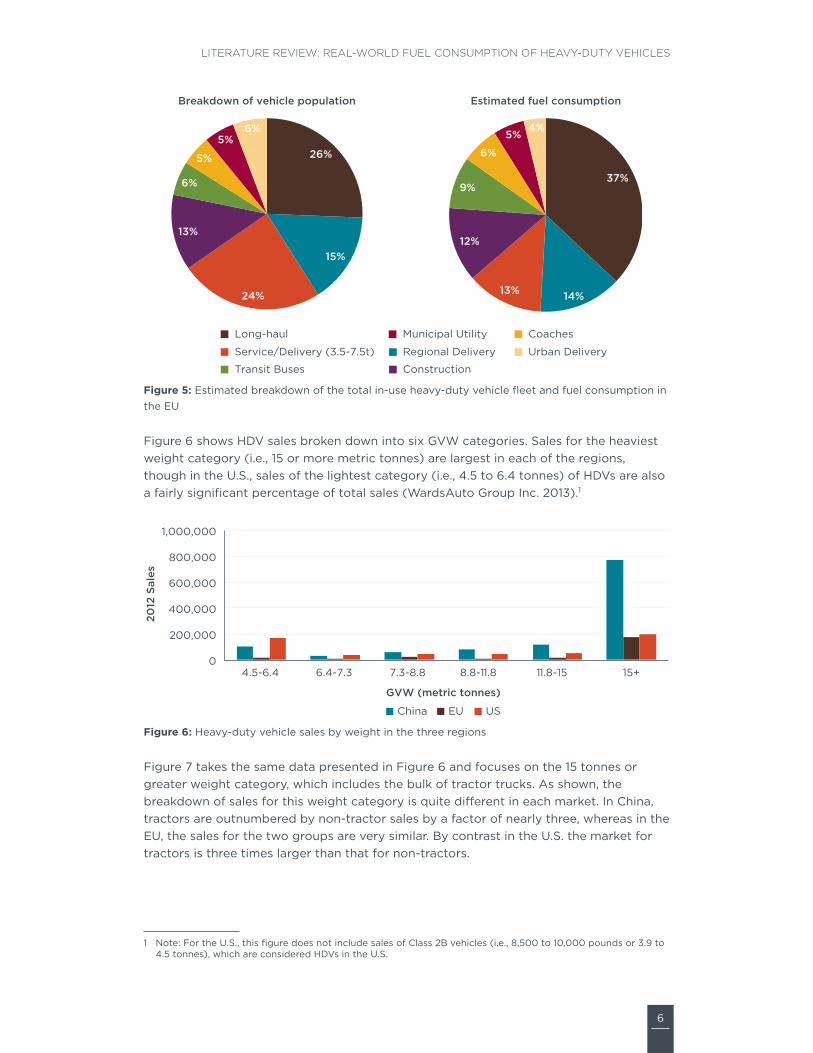
Figures 3, 4, and 5 summarize the breakdown of HDV population and fuel consumption by vehicle type and show that in the U.S., China, and the EU, tractor trucks account for a disproportionately high amount of fuel use within the HDV sector. For the U.S., the left side of Figure 3 shows that tractors account for about a quarter of HDV sales but are responsible for roughly two-thirds of HDV fuel consumption (Lowell and Balon 2009). For China, vehicle stock data suggests that tractors make up roughly 15% of new vehicle sales but account for nearly 30% of overall HDV fuel use (ICCT 2014). As part of the Lot-1 study for the European Commission, AEA-Ricardo estimated that long-haul tractor-trailers and regional delivery trucks (many of which are tractor-trailers) represent about 40% of the HDV population in the EU, but roughly 50% of fuel consumption. In the U.S. and Europe, long-haul tractor-trailers are the largest HDV fuel consumer by a comfortable margin, while in China, “specialty” trucks, tractor trucks, and dump trucks are the biggest consumers, with each contributing to approximately one quarter of fuel use.
As evidenced in these three figures, HDVs are categorized in different ways across the regions, and even the meaning of “heavy-duty vehicle” is somewhat nebulous, its precise definition being determined at the country or regional level. In the U.S., a heavy-duty
0.0 1.0 2.0 3.0
HHDV (14k+ kg)MHDV (6.4-14k kg)LHDV (3.5-6.4k kg)
5
ICCT WHITE PAPER
vehicle is generally defined to have a gross vehicle weight (GVW) of 8,500 pounds (3,856 kg) or more although there are a few exceptions for certain large passenger cars, such as sports utility vehicles, which may be heavier than 8,500 pounds but are considered light-duty vehicles for regulatory purposes. In the EU and China, HDVs are vehicles with a GVW greater than 3,500 kg (7,716 pounds), though, as evidenced by the different vehicle groups in Figures 4 and 5, there is no standardized method across these two regions for breaking down HDVs into vocation-specific categories.
23%
20%
9%
17%
13%
4%
4%
1%3%
4%
2%
Market share of new vehicles Estimated fuel consumption
71%
5%
15%
2%6%
1%
Tractor trucks Vocational trucks
Other straight trucks Transit and coach buses
Pickup trucks and vans Motor homes
Figure 3: Estimated breakdown of new heavy-duty vehicle sales and fleet-wide fuel consumption in the U.S.
30%
15%21%
20%
8%
3%2% 1%
29%
27%
25%
10%
5%
2%1%
1%
Special Vehicles Tractor-trucks Dump Trucks
Platform Trucks City Buses Coaches
Passenger Vans Transit Buses
Breakdown of vehicle population Estimated fuel consumption
Figure 4: Estimated breakdown of the total in-use heavy-duty vehicle fleet and fuel consumption in China
6
LITERATURE REVIEW: REAL-WORLD FUEL CONSUMPTION OF HEAVY-DUTY VEHICLES
26%
15%
24%
13%
6%
5%
5%6%
37%
14%13%
12%
9%
6%
5%4%
Long-haul
Regional DeliveryService/Delivery (3.5-7.5t)
ConstructionTransit Buses
CoachesMunicipal Utility
Urban Delivery
Breakdown of vehicle population Estimated fuel consumption
Figure 5: Estimated breakdown of the total in-use heavy-duty vehicle fleet and fuel consumption in the EU
Figure 6 shows HDV sales broken down into six GVW categories. Sales for the heaviest weight category (i.e., 15 or more metric tonnes) are largest in each of the regions, though in the U.S., sales of the lightest category (i.e., 4.5 to 6.4 tonnes) of HDVs are also a fairly significant percentage of total sales (WardsAuto Group Inc. 2013).1
0
200,000
400,000
600,000
800,000
1,000,000
4.5-6.4 6.4-7.3 7.3-8.8 8.8-11.8 11.8-15 15+
2012
Sal
es
GVW (metric tonnes)
China EU US
Figure 6: Heavy-duty vehicle sales by weight in the three regions
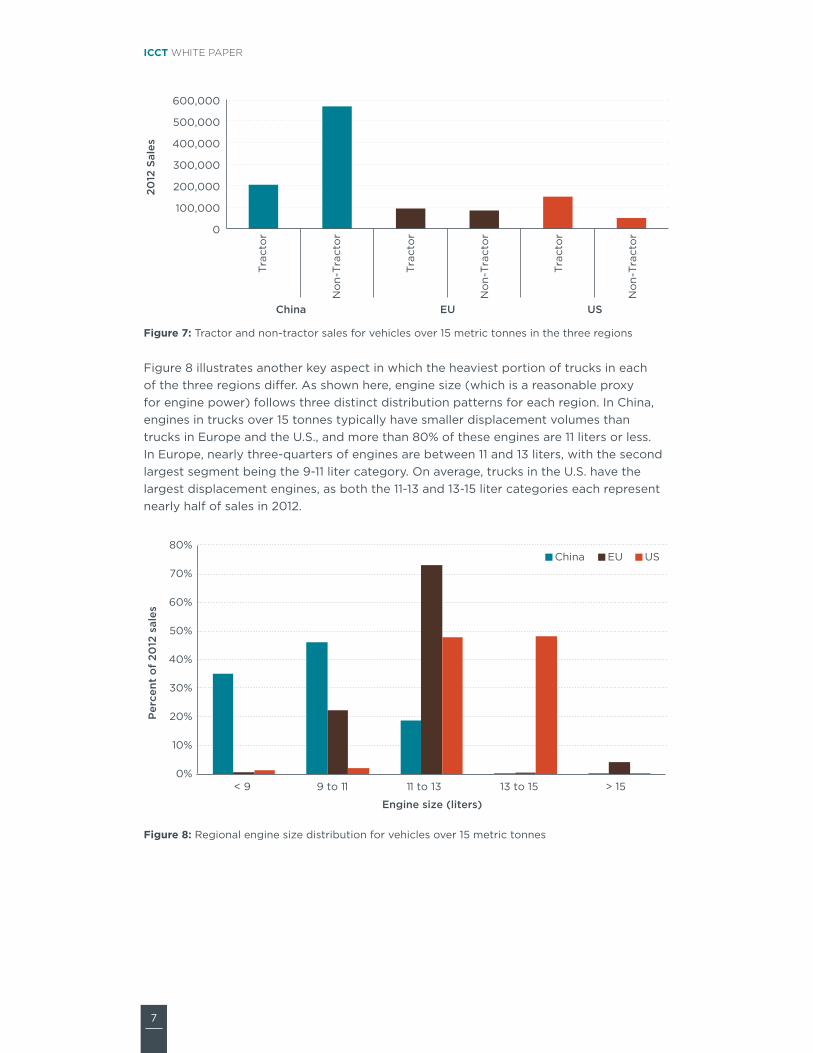
Figure 7 takes the same data presented in Figure 6 and focuses on the 15 tonnes or greater weight category, which includes the bulk of tractor trucks. As shown, the breakdown of sales for this weight category is quite different in each market. In China, tractors are outnumbered by non-tractor sales by a factor of nearly three, whereas in the EU, the sales for the two groups are very similar. By contrast in the U.S. the market for tractors is three times larger than that for non-tractors.
1 Note: For the U.S., this figure does not include sales of Class 2B vehicles (i.e., 8,500 to 10,000 pounds or 3.9 to 4.5 tonnes), which are considered HDVs in the U.S.
7
ICCT WHITE PAPER
0
100,000
200,000
300,000
400,000
500,000
600,000
No
n-Tr
acto
r
Trac
tor
Trac
tor
No
n-Tr
acto
r
Trac
tor
No
n-Tr
acto
r
China EU US
2012
Sal
es
Figure 7: Tractor and non-tractor sales for vehicles over 15 metric tonnes in the three regions
Figure 8 illustrates another key aspect in which the heaviest portion of trucks in each of the three regions differ. As shown here, engine size (which is a reasonable proxy for engine power) follows three distinct distribution patterns for each region. In China, engines in trucks over 15 tonnes typically have smaller displacement volumes than trucks in Europe and the U.S., and more than 80% of these engines are 11 liters or less. In Europe, nearly three-quarters of engines are between 11 and 13 liters, with the second largest segment being the 9-11 liter category. On average, trucks in the U.S. have the largest displacement engines, as both the 11-13 and 13-15 liter categories each represent nearly half of sales in 2012.
0%
10%
20%
30%
40%
50%
60%
70%
80%
< 9 9 to 11 11 to 13 13 to 15 > 15
Per
cent
of
2012
sal
es
Engine size (liters)
China EU US
Figure 8: Regional engine size distribution for vehicles over 15 metric tonnes
8
LITERATURE REVIEW: REAL-WORLD FUEL CONSUMPTION OF HEAVY-DUTY VEHICLES
2.2. REGULATORY OVERVIEWIn recent years, many governments around the world have begun to take targeted steps to promote greater efficiency within their heavy-duty vehicle fleets. As a result of the complexities of the HDV sector, designing a regulatory program for HDVs presents unique challenges. For example, measuring the fuel efficiency of a heavy-duty vehicle can be quite complicated because a single engine model can be paired with a large number of chassis types and transmissions, with each combination having different fuel consumption characteristics. Furthermore, the fuel efficiency of a given vehicle in-use may vary dramatically based upon duty cycle. For example, fuel consumption for an urban delivery truck, with low average speed and stop-and-go operation, would differ greatly from a truck used in long-haul applications at steady highway speeds.
Another attribute of the heavy-duty industry that presents challenges from a regulatory perspective is the fact that vehicle manufacturing is often a fragmented and highly customized process, particularly in North America. Unlike passenger the assembly of cars and light trucks, assembling HDVs can involve multiple manufacturers, suppliers, and upfitters. For example, for a particular city delivery truck, one component manufacturer may make the engine, another company supplies the transmission, a separate manufacturer is responsible for incorporating the engine and transmission and building the rolling chassis, and, finally, an upfitter is responsible for assembling the body that encapsulates the chassis and carries the cargo. However, manufacturing conditions in Europe and China are much different, as there is typically much less end-user customization, and the degree of vertical integration is more prominent than in North America. Given the situation that vehicle design and manufacturing often is shared among multiple entities whose individual contributions can all have unique impacts on the ultimate fuel efficiency performance of a vehicle, this can potentially present challenges in terms of identifying a single point of regulation.
Focusing on the U.S., China, and the EU, the unique aspects in market and fleet characteristics in each region are perhaps the most significant factor making the regulatory approaches so divergent. The following sections provide a general overview of the HDV regulatory activity in the U.S., China, and the EU (with a particular focus on tractor trucks) and illustrate the major differences in regulatory structure and certification procedures across the three regions. These sections provide context for the magnitude of fuel efficiency improvements in new vehicles that we expect to see diffusing into each HDV fleet as a result of regulatory measures.
2.2.1 Tractor efficiency standards in the U.S.In August 2011, the U.S. Environmental Protection Agency (EPA) and the U.S. Department of Transportation’s National Highway Traffic Safety Administration (NHTSA) finalized the world’s first program to reduce greenhouse gas emissions and improve fuel efficiency of medium- and heavy-duty vehicles. While Japan deserves full credit for establishing, in 2005, the world’s first fuel economy program for medium- and heavy-duty vehicles, which will go into effect in 2015, the U.S. rule adds several important elements: (1) it drives efficiency improvements in all aspects of the heavy-duty vehicle for the two highest fuel consumption classes, specifically tractor trucks and pickup trucks; (2) it sets separate standards for engines and vehicles; and (3) it establishes standards for four major greenhouse gases in addition to fuel consumption limits. Canada followed roughly a year and a half later with its own rule, which was published in the spring of 2013 and is largely consistent with the U.S. regulation.
9
ICCT WHITE PAPER
The U.S. rule can be thought of as four rules combined into one regulation. Below we provide a brief summary of the provisions for tractor trucks. For more information about each of the standards for the four primary regulatory subcategories—tractor trucks, pickup trucks and vans, vocational vehicles, and engines of trucks and vocational vehicles—see the September 2011 ICCT policy update in the list of references..
Tractor trucks account for the largest percentage of fuel consumption and GHG emissions from the HDV sector and thus attract the greatest amount of regulatory attention in the rule. There are nine separate standards for tractor trucks based on combinations of three categories of vehicles (Class 7, Class 8 day cab, and Class 8 sleeper cab) and three roof height categories (low, medium, and high). Regulatory stringency ranges from 9 to 23% for model year (MY) 2017 vehicles compared to the MY 2010 baseline. Compliance with the tractor standard is based on sales-weighted averaging, which is true of the other vehicle categories and engines as well. So, each manufacturer’s product mix must meet the targets, on average, based on sales-weighting of vehicles that generate credits (i.e., vehicles that perform better than the target) and debits (i.e., vehicles that consume more fuel/emit more CO2 than the target).
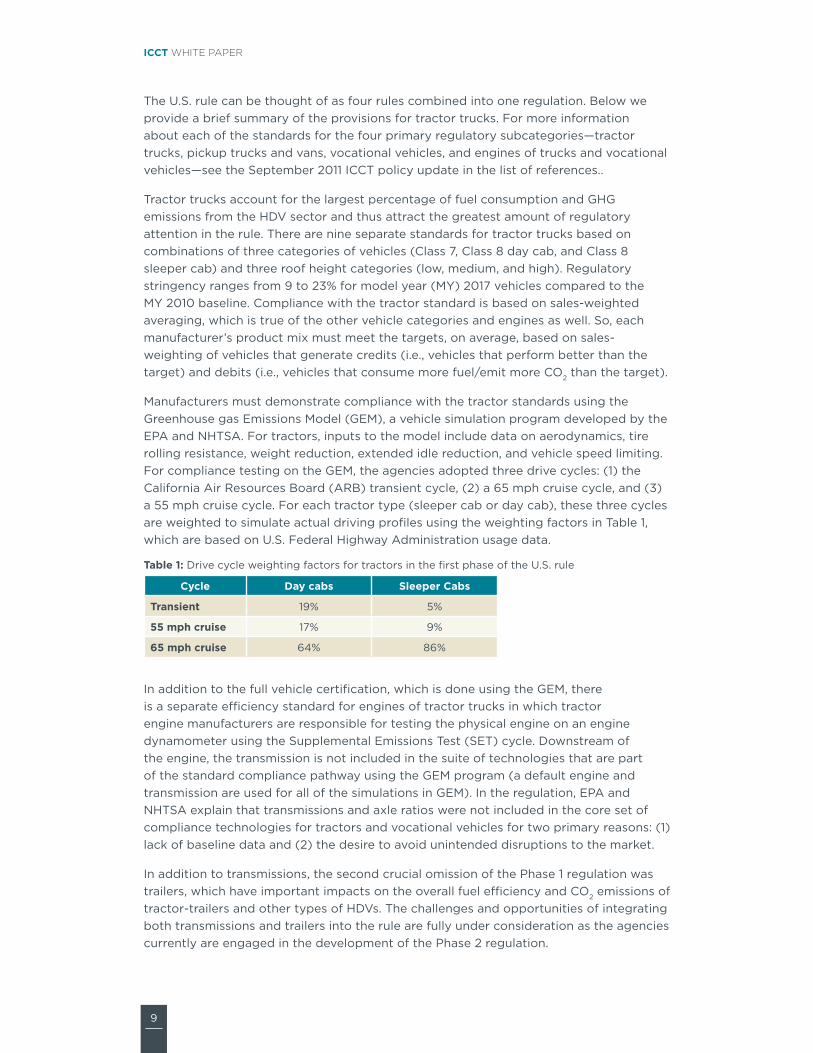
Manufacturers must demonstrate compliance with the tractor standards using the Greenhouse gas Emissions Model (GEM), a vehicle simulation program developed by the EPA and NHTSA. For tractors, inputs to the model include data on aerodynamics, tire rolling resistance, weight reduction, extended idle reduction, and vehicle speed limiting. For compliance testing on the GEM, the agencies adopted three drive cycles: (1) the California Air Resources Board (ARB) transient cycle, (2) a 65 mph cruise cycle, and (3) a 55 mph cruise cycle. For each tractor type (sleeper cab or day cab), these three cycles are weighted to simulate actual driving profiles using the weighting factors in Table 1, which are based on U.S. Federal Highway Administration usage data.
Table 1: Drive cycle weighting factors for tractors in the first phase of the U.S. rule
Cycle Day cabs Sleeper Cabs
Transient 19% 5%
55 mph cruise 17% 9%
65 mph cruise 64% 86%
In addition to the full vehicle certification, which is done using the GEM, there is a separate efficiency standard for engines of tractor trucks in which tractor engine manufacturers are responsible for testing the physical engine on an engine dynamometer using the Supplemental Emissions Test (SET) cycle. Downstream of the engine, the transmission is not included in the suite of technologies that are part of the standard compliance pathway using the GEM program (a default engine and transmission are used for all of the simulations in GEM). In the regulation, EPA and NHTSA explain that transmissions and axle ratios were not included in the core set of compliance technologies for tractors and vocational vehicles for two primary reasons: (1) lack of baseline data and (2) the desire to avoid unintended disruptions to the market.
In addition to transmissions, the second crucial omission of the Phase 1 regulation was trailers, which have important impacts on the overall fuel efficiency and CO2 emissions of tractor-trailers and other types of HDVs. The challenges and opportunities of integrating both transmissions and trailers into the rule are fully under consideration as the agencies currently are engaged in the development of the Phase 2 regulation.
10
LITERATURE REVIEW: REAL-WORLD FUEL CONSUMPTION OF HEAVY-DUTY VEHICLES
2.2.2 Tractor efficiency standards in ChinaIn 2008 the Chinese government began research into establishing a multifaceted program to improve fuel consumption for HDVs. As a first step, the China Automotive Technology and Research Center (CATARC) was commissioned by the Ministry of Industry and Information Technology (MIIT) to develop a fuel consumption test procedure that combined chassis dynamometer testing and simulation modeling. In brief, the test procedure requires that fuel consumption of base models be measured using chassis dynamometer testing, whereas fuel consumption of variants may be calculated using a computer simulation model developed by CATARC (ICCT 2013).2 The final test procedure was formally adopted in December 2011.
The first phase “Industry Standard” was issued in 2011 for implementation in mid-2012 for new models, and in mid-2014 for all vehicles. Under the Industry Standard, three HDV categories are regulated: straight trucks (not including dump trucks), coach buses (not including city buses), and tractor trucks. Due to a relatively limited understanding of the HDV market and fuel consumption level at the time, the Industry Standard was intentionally set at a level that manufacturers could meet relatively easily, and it focused on the three vehicle types with the highest sales and highest expected overall fuel consumption (Jin 2014). Unlike U.S. standards, which are based on corporate averaging, China’s HDV regulation is a binary pass-fail system in which each vehicle model (base types and variants) must meet the threshold fuel consumption value for its vehicle and weight category. Therefore, any vehicle model that does not achieve the fuel consumption limit cannot be type-approved for sale in the Chinese market.
Over the course of 2012, MIIT collected more fuel consumption data through additional testing and simulation performed on the latest models of the five regulated vehicle categories, but with a special focus on city buses and dump trucks. The agency also obtained additional fuel consumption data regarding new models through the new fuel consumption type-approval process for the Industry Standard. Based on a broader set of fuel consumption data, MIIT proposed the next stage of HDV fuel consumption standard in September 2012. The second phase “National Standard” was formally released in February 2014 and went into effect for new vehicle models in mid-2014, subsequently going into effect for all models in mid-2015. This National Standard tightens the strigency of standards for the aforementioned three types of HDVs and adds two new categories of vehicles: city buses and dump trucks. At present, officials in China are developing the third phase of fuel consumption standards for HDVs, which likely will go into effect in the 2020 timeframe.
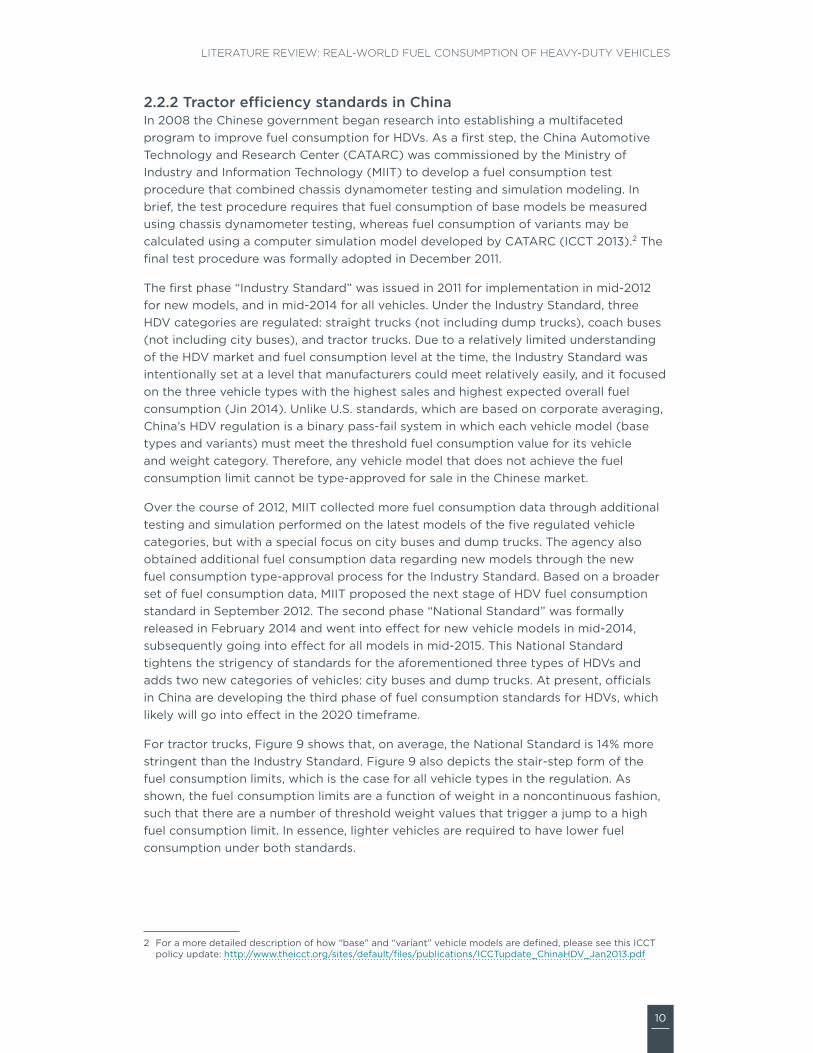
For tractor trucks, Figure 9 shows that, on average, the National Standard is 14% more stringent than the Industry Standard. Figure 9 also depicts the stair-step form of the fuel consumption limits, which is the case for all vehicle types in the regulation. As shown, the fuel consumption limits are a function of weight in a noncontinuous fashion, such that there are a number of threshold weight values that trigger a jump to a high fuel consumption limit. In essence, lighter vehicles are required to have lower fuel consumption under both standards.
2 For a more detailed description of how “base” and “variant” vehicle models are defined, please see this ICCT policy update: http://www.theicct.org/sites/default/files/publications/ICCTupdate_ChinaHDV_Jan2013.pdf
11
ICCT WHITE PAPER
14%
30
35
40
45
50
55
60
0 10 20 30 40 50
Fue
l co
nsum
pti
on
limit
(lit
er/1
00
km
)
Gross Vehicle Weight (ton)
Industry standard National standard
Figure 9: Phase I (Industry Standard) and Phase II (National Standard) fuel consumption limits for tractor trucks in China
The applicable driving cycle for both the Industry and National Standards consists of an adjusted World Harmonized Vehicle Cycle (WHVC) driving profile. The original WHVC acceleration and deceleration values are reduced in order to reflect the Chinese heavy-duty vehicles, which, on average, have lower engine power-to-vehicle weight ratios than the HDVs from other major markets (i.e., Europe, North America, and Japan) that were used to develop the WHVC. Some of the acceleration and deceleration rates in the original WHVC are decreased in the adjusted cycle, which is called the China-WTVC (C-WTVC).
Three mini-cycles make up the WHVC and C-WTVC: urban, rural, and highway. As stipulated in the finalized test procedure, the final fuel consumption test value for each vehicle model is determined by weighting each of the three C-WTVC mini-cycles according to the vehicle class and weight category. For tractors, Table 2 summarizes the weighting percentages for the two weight classes of tractors, but using the Gross Combination Weight, which includes both tractor and trailer.
Table 2: Drive cycle weighting factors for tractors in China
Mini-cycle portion of the C-WTVC 9,000 kg < GCW < 27,000 kg GCW > 27,000 kg
Urban 0% 0%
Rural 40% 10%
Highway 60% 90%
2.2.3 Test procedure and policy developments in the EU By 2050, the EU aims to cut GHG emissions by 80-95% below 1990 levels. Transportation will play a critical role in meeting this overall goal, with a targeted 60% reduction in transport carbon emissions by 2050, according to a 2011 report from the European Commission.

12
LITERATURE REVIEW: REAL-WORLD FUEL CONSUMPTION OF HEAVY-DUTY VEHICLES
The European Commission has been working closely with its domestic HDV industry since the summer of 2007 to develop a new program focused on controlling fuel consumption and CO2 emissions from HDVs. The collaboration has focused primarily on assessing the technical potential of mitigation options for HDVs and developing a simulation modeling tool and a set of mission-based test cycles and procedures for each major category of HDV.
The currently foreseen test procedure for fuel consumption and CO2 emissions from HDV in the EU is based on component testing and simulation. A vehicle simulation program (Vehicle Energy consumption Calculation Tool, or VECTO) is under development, in which total fuel consumption is simulated based on vehicle longitudinal dynamics from the input data on the vehicle and engine characteristics (Hausberger, Kies et al., 2012). To depict a realistic driving style for all possible combinations of mission profiles and HDV configurations, a simulation approach based on target speed cycles is used in the HDV CO2 certification process.
Compared to the U.S. GEM model and certification process, the first key distinguishing feature of VECTO is its modeling inputs and interface for the engine and transmission. Unlike the Phase 1 version of GEM, which uses default engines and transmissions (i.e., manufacturers need not input any specific data or information about the actual drivetrain in the vehicle), VECTO requires that manufacturers enter detailed engine map and transmission data that correspond to the vehicle model being certified. The second primary way in which the HDV certification process for GHGs differs in the U.S. and EU is the fact that the U.S. has implemented a separate standard for engines based on engine dynamometer testing, whereas there is no such separate engine certification requirement as part of the VECTO test procedure.
The vehicle categorization framework for the certification process in the EU is based on classifying HDVs by the number of axles, the axle configuration, the chassis configuration (i.e., rigid body or combination tractor), and gross vehicle weight rating. Altogether, there are eighteen truck classes and six transit bus and coach classes (Hausberger, Kies et al., 2012). Within the eighteen truck classes, there are eight possible tractor classes, as shown in Table 3. From the rightmost column, we see that of the tractor categories, five are identified as long-haul, regional delivery, or urban delivery trucks, with the remaining three identified as construction vehicles.
Table 3: Tractor truck classes in the proposed EU certification process
Chassis configuration
Number of axles
Axle configuration
Maximum GVW
(tonnes)
Segmentation (vehicle configuration,
cycle allocation)
Rigid or tractor 2 4x2 7.5 – 10 Regional or urban delivery
Rigid or tractor 2 4x2 10 – 12 Long-haul, regional, or urban delivery
Rigid or tractor 2 4x2 12 – 16 Regional or urban delivery
Tractor 2 4x2 > 16 Long-haul
Tractor 2 4x4 > 16 Long-haul
Tractor 3 6x2 All weights Construction
Tractor 3 6x4 All weights Construction
Tractor 3 6x6 All weights Construction
13
ICCT WHITE PAPER
The policy outcome for mitigating HDV CO2 emissions in the EU is not yet decided. Two primary options are currently under consideration. A labeling and information program would provide consumers and HDV purchasers with accurate, detailed information about the fuel efficiency across multiple configurations and manufacturers. Alternatively, the commission could develop mandatory performance targets for CO2/ ton-km, similar to the recently implemented regulations in the U.S., Canada, China, and Japan. A labeling approach and mandatory performance standards are not mutually exclusive and may be done in a staged fashion.
In each of the three regions, the on-road freight industry is highly competitive, and the majority of end users are continually looking to minimize fuel use, which is often one of largest—if not the largest—expense for trucking fleets. Even with this natural pull toward high fuel efficiency, many governments around the world—including the U.S. and China—have enacted mandatory performance standards for HDVs to accelerate the adoption of fuel-saving technologies. The previous discussion of regulatory and certification procedure development activities in each of the three regions provides a measuring stick by which we can assess how the actual improvements in-use compare to the gains expected from regulation.

14
LITERATURE REVIEW: REAL-WORLD FUEL CONSUMPTION OF HEAVY-DUTY VEHICLES
3. DATA SOURCES
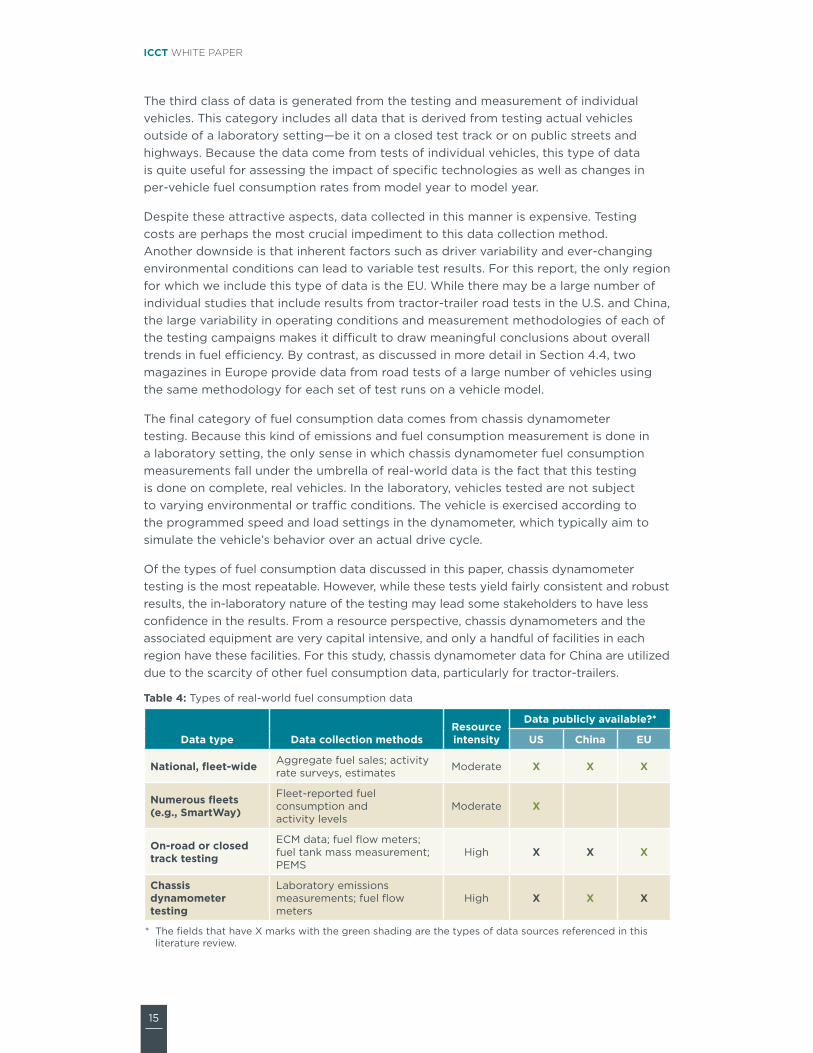
Table 4 summarizes the four broad types of data sets available for assessing the real-world fuel consumption of HDVs. The first category of fuel consumption data is fleet-wide data, which in this context is aggregated at the national level (or regional level in the case of the EU). For this type of data, fuel consumption rates (e.g., miles per gallon or liters per 100 kilometers) can typically be derived by dividing total fuel use by total miles or kilometers. Though the resource burden for developing these types of data sets is comparatively low, the primary challenge in calculating per-vehicle fuel consumption rates using this methodology is estimating how the entire fleet’s fuel use and activity rates breakdown among the various types of HDVs.
Invariably, estimating how total fuel consumption is distributed between HDV categories involves making assumptions about the fuel consumption rates of each type of HDV. As shown in the table, fleet-wide estimates for tractor-trailer fuel consumption for all three regions of interest are publicly available (as denoted by the Xs) and used in this study (as denoted by the green shading). Of the four data groups in Table 4, national fleet-wide fuel consumption data is the only type for which data is available in all three regions.
As summarized in Table 5, perhaps the most attractive aspect of having data aggregated for an entire national fleet of tractor-trailers (or any other HDV type) is the ability to assess fuel efficiency changes and impacts at the highest level. However, in addition to relying heavily on assumptions, another key drawback of using fleet-wide data is that analyzing changes in per-vehicle fuel consumption rates from model year to model year is not possible, given that each year typically only a small percentage of the total fleet turns over.
The second category of fuel consumption data comes from aggregating the data from numerous individual trucking fleets. The best example of this type of data repository is the EPA’s SmartWay Program, which takes the self-reported total fuel consumption and mileage information from its member fleets and provides information free to the public about the comparative emissions and fuel efficiency performance of the fleets. Because these data sets are developed using voluntary submissions from trucking companies, the resource demand of creating and maintaining such repositories is relatively small. In addition, another attractive aspect of this type of data is that shippers and firms that use trucking fleets and logistics providers are able to use these data to make better informed decisions about the efficiency performance of the carriers they hire.
In terms of disadvantages, these data sets are premised on the self-reporting of partner companies, and it may be difficult to ensure the accuracy of the submissions without a robust auditing process. Moreover, another drawback of analyzing this type of data is the fact that a great diversity of variables such as driver behavior, environmental conditions, and payloads all can have a significant impact on fuel consumption, and it is difficult to identify the extent to which a certain policy measure or introduction of technology contributed to an improvement in fuel efficiency. A final downside of these “green freight program” types of data sets is that there may be a selection bias toward more fuel efficient fleets. Because they are completely voluntary, programs like SmartWay may have higher participation of trucking companies who are more acutely interested in efficiency measures than non-participating fleets. For this study, there is only this type of data for the U.S., which comes from the SmartWay Program.
15
ICCT WHITE PAPER
The third class of data is generated from the testing and measurement of individual vehicles. This category includes all data that is derived from testing actual vehicles outside of a laboratory setting—be it on a closed test track or on public streets and highways. Because the data come from tests of individual vehicles, this type of data is quite useful for assessing the impact of specific technologies as well as changes in per-vehicle fuel consumption rates from model year to model year.
Despite these attractive aspects, data collected in this manner is expensive. Testing costs are perhaps the most crucial impediment to this data collection method. Another downside is that inherent factors such as driver variability and ever-changing environmental conditions can lead to variable test results. For this report, the only region for which we include this type of data is the EU. While there may be a large number of individual studies that include results from tractor-trailer road tests in the U.S. and China, the large variability in operating conditions and measurement methodologies of each of the testing campaigns makes it difficult to draw meaningful conclusions about overall trends in fuel efficiency. By contrast, as discussed in more detail in Section 4.4, two magazines in Europe provide data from road tests of a large number of vehicles using the same methodology for each set of test runs on a vehicle model.
The final category of fuel consumption data comes from chassis dynamometer testing. Because this kind of emissions and fuel consumption measurement is done in a laboratory setting, the only sense in which chassis dynamometer fuel consumption measurements fall under the umbrella of real-world data is the fact that this testing is done on complete, real vehicles. In the laboratory, vehicles tested are not subject to varying environmental or traffic conditions. The vehicle is exercised according to the programmed speed and load settings in the dynamometer, which typically aim to simulate the vehicle’s behavior over an actual drive cycle.
Of the types of fuel consumption data discussed in this paper, chassis dynamometer testing is the most repeatable. However, while these tests yield fairly consistent and robust results, the in-laboratory nature of the testing may lead some stakeholders to have less confidence in the results. From a resource perspective, chassis dynamometers and the associated equipment are very capital intensive, and only a handful of facilities in each region have these facilities. For this study, chassis dynamometer data for China are utilized due to the scarcity of other fuel consumption data, particularly for tractor-trailers.
Table 4: Types of real-world fuel consumption data
Data type Data collection methodsResource intensity
Data publicly available?*
US China EU
National, fleet-wide Aggregate fuel sales; activity rate surveys, estimates Moderate X X X
Numerous fleets (e.g., SmartWay)
Fleet-reported fuel consumption and activity levels
Moderate X
On-road or closed track testing
ECM data; fuel flow meters; fuel tank mass measurement; PEMS
High X X X
Chassis dynamometer testing
Laboratory emissions measurements; fuel flow meters
High X X X
* The fields that have X marks with the green shading are the types of data sources referenced in this literature review.
16
LITERATURE REVIEW: REAL-WORLD FUEL CONSUMPTION OF HEAVY-DUTY VEHICLES
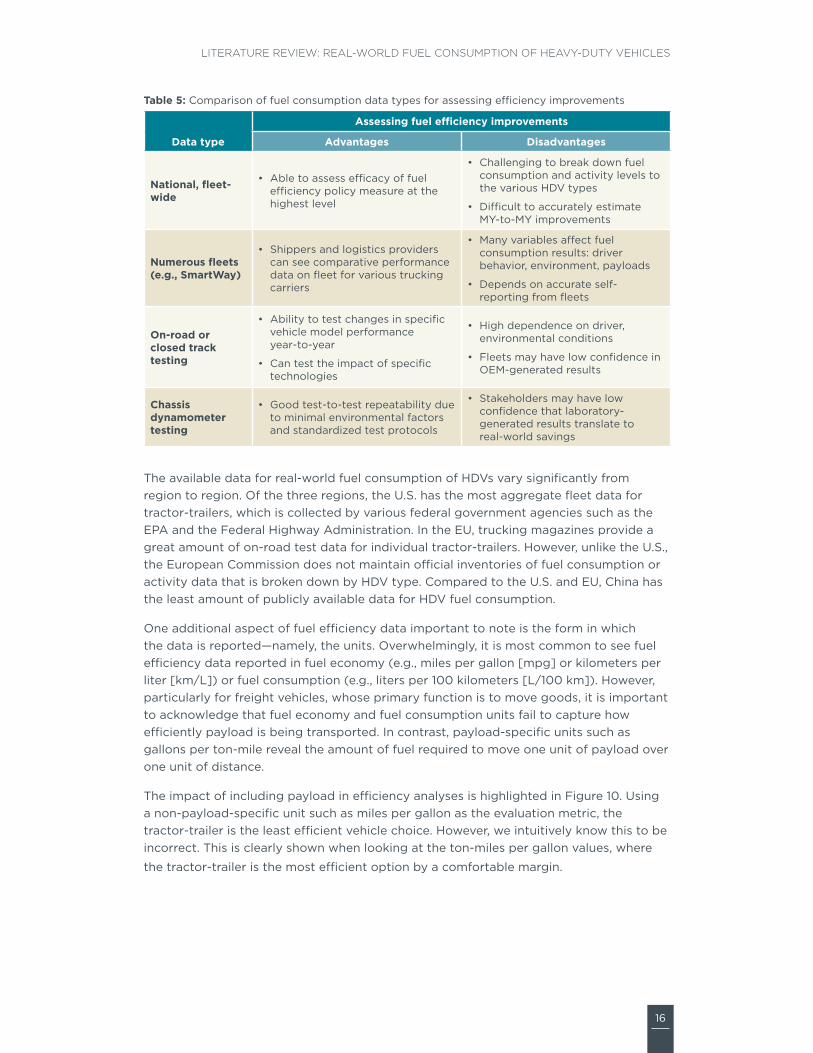
Table 5: Comparison of fuel consumption data types for assessing efficiency improvements
Data type
Assessing fuel efficiency improvements
Advantages Disadvantages
National, fleet-wide
• Able to assess efficacy of fuel efficiency policy measure at the highest level
• Challenging to break down fuel consumption and activity levels to the various HDV types
• Difficult to accurately estimate MY-to-MY improvements
Numerous fleets (e.g., SmartWay)
• Shippers and logistics providers can see comparative performance data on fleet for various trucking carriers
• Many variables affect fuel consumption results: driver behavior, environment, payloads
• Depends on accurate self-reporting from fleets
On-road or closed track testing
• Ability to test changes in specific vehicle model performance year-to-year
• Can test the impact of specific technologies
• High dependence on driver, environmental conditions
• Fleets may have low confidence in OEM-generated results
Chassis dynamometer testing
• Good test-to-test repeatability due to minimal environmental factors and standardized test protocols
• Stakeholders may have low confidence that laboratory-generated results translate to real-world savings
The available data for real-world fuel consumption of HDVs vary significantly from region to region. Of the three regions, the U.S. has the most aggregate fleet data for tractor-trailers, which is collected by various federal government agencies such as the EPA and the Federal Highway Administration. In the EU, trucking magazines provide a great amount of on-road test data for individual tractor-trailers. However, unlike the U.S., the European Commission does not maintain official inventories of fuel consumption or activity data that is broken down by HDV type. Compared to the U.S. and EU, China has the least amount of publicly available data for HDV fuel consumption.
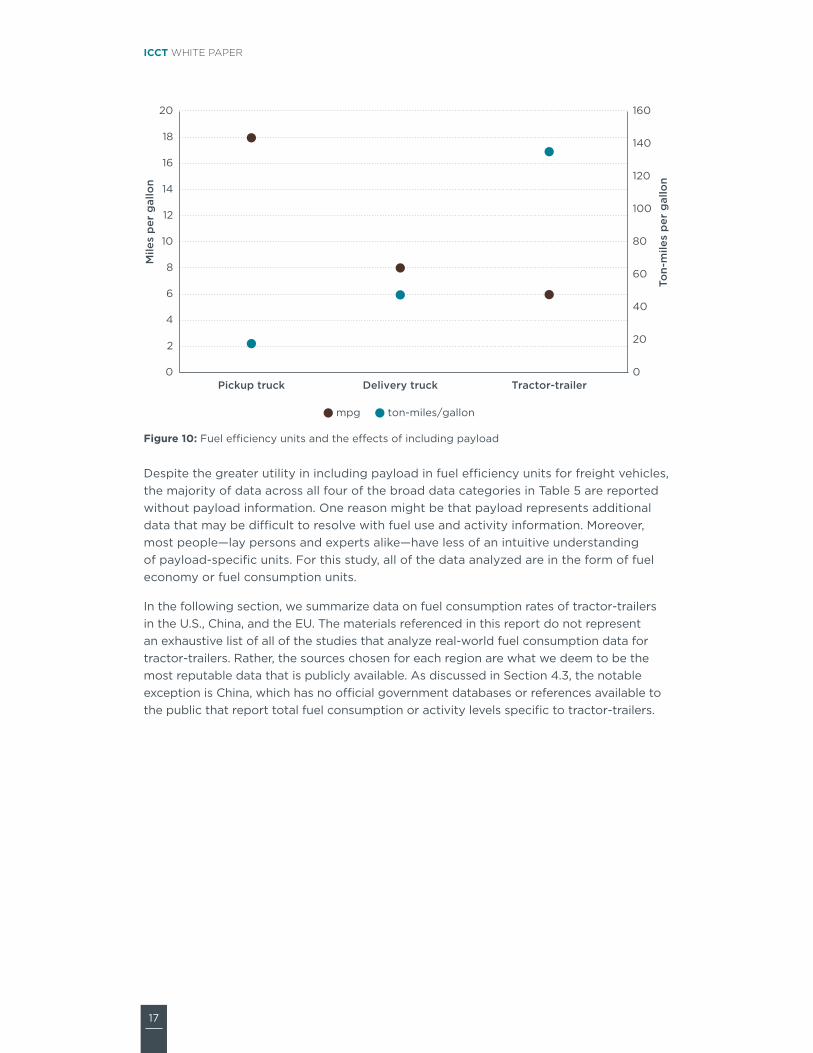
One additional aspect of fuel efficiency data important to note is the form in which the data is reported—namely, the units. Overwhelmingly, it is most common to see fuel efficiency data reported in fuel economy (e.g., miles per gallon [mpg] or kilometers per liter [km/L]) or fuel consumption (e.g., liters per 100 kilometers [L/100 km]). However, particularly for freight vehicles, whose primary function is to move goods, it is important to acknowledge that fuel economy and fuel consumption units fail to capture how efficiently payload is being transported. In contrast, payload-specific units such as gallons per ton-mile reveal the amount of fuel required to move one unit of payload over one unit of distance.
The impact of including payload in efficiency analyses is highlighted in Figure 10. Using a non-payload-specific unit such as miles per gallon as the evaluation metric, the tractor-trailer is the least efficient vehicle choice. However, we intuitively know this to be incorrect. This is clearly shown when looking at the ton-miles per gallon values, where
the tractor-trailer is the most efficient option by a comfortable margin.
17
ICCT WHITE PAPER
0
20
40
60
80
100
120
140
160
0
2
4
6
8
10
12
14
16
18
20
Ton-
mile
s p
er g
allo
n
Mile
s p
er g
allo
n
mpg ton-miles/gallon
Delivery truckPickup truck Tractor-trailer
Figure 10: Fuel efficiency units and the effects of including payload
Despite the greater utility in including payload in fuel efficiency units for freight vehicles, the majority of data across all four of the broad data categories in Table 5 are reported without payload information. One reason might be that payload represents additional data that may be difficult to resolve with fuel use and activity information. Moreover, most people—lay persons and experts alike—have less of an intuitive understanding of payload-specific units. For this study, all of the data analyzed are in the form of fuel economy or fuel consumption units.
In the following section, we summarize data on fuel consumption rates of tractor-trailers in the U.S., China, and the EU. The materials referenced in this report do not represent an exhaustive list of all of the studies that analyze real-world fuel consumption data for tractor-trailers. Rather, the sources chosen for each region are what we deem to be the most reputable data that is publicly available. As discussed in Section 4.3, the notable exception is China, which has no official government databases or references available to the public that report total fuel consumption or activity levels specific to tractor-trailers.

18
LITERATURE REVIEW: REAL-WORLD FUEL CONSUMPTION OF HEAVY-DUTY VEHICLES
4. TRACTOR FUEL CONSUMPTION DATA FOR THE THREE REGIONS
4.1. OVERVIEWBefore presenting data on tractor-trailers in the U.S., China, and the EU, it is useful to note that both tractors and trailers have very different designs and specifications across the three regions. Some examples of varying characteristics include weight, dimensions, number of axles, configuration, engine size, and maximum payload. This diversity of attributes results in inherent variations in the real-world fuel efficiency of these vehicles. Further, other region-specific characteristics such as topography, traffic conditions, vehicle speed, road conditions, and operating patterns also cause real-world fuel consumption to differ.
Table 6 illustrates main differences between vehicle characteristics and operational conditions in China, U.S. and EU for tractor-trailers. The information in Table 6 is drawn from a study conducted by Daimler (Schuckert, 2013) and shows how typical tractor-trailers are configured in the three regions. In the EU and China, the cab-over-engine configuration is commonly used for tractors, while the U.S. (or North American) tractor commonly has a long nose. Table 6 also shows that tractor-trailers in China typically have the highest payloads among the three regions. The axle layout of the tractor-trailer is different in each region. The most common axle layouts are two-axle tractors and three-axle trailers in the EU, three-axle tractors and two-axle trailers in the U.S., and three-axle tractors and three-axle trailers in China (ibid.)
Table 6: Typical characteristics of tractor-trailers in three regions
China US EU
Combined length (m) 18 22 18.75
Maximum height (m) 4.2 4.1 4
Maximum single axle load (t)a 10 9 11.5
Maximum axle load double/triple (t) 18/22 17/19 20/24
Typical axle layout 3-axle (tractor)3-axle (trailer)
3-axle (tractor)2-axle (trailer)
2-axle (tractor)3-axle (trailer)
Typical payload allowed (t) 34 21 26
GVW (t) 49 36 40
Vehicle empty weight (t) 15 15 13.5
Maximum speedb (km/h) 100 105 90
Emission standard China III/IV (Euro III/IV) EPA 2010 Euro V/VI
Source: Schuckert, Manfred. Freight efficiency in main HDV markets. Daimler presentation on the International Forum on CO2 from Heavy Duty Vehicles. May 30, 2013.a “t” refers to metric tonnesb The actual maximum speed is higher than these numbers for China and the U.S. China maximum speed is estimated at 100 km/h for trucks, (http://www.gov.cn/banshi/2005-08/23/content_25579_2.htm), and the U.S. is estimated at 104.6-120.7 km/h depending on state regulations (http://freight.about.com/od/Resources/f/Commercial-Vehicle-Speed-Limits-By-State.htm)
The following sections discuss available real-world fuel consumption data for tractor-trailers in the U.S., EU and China.
19
ICCT WHITE PAPER
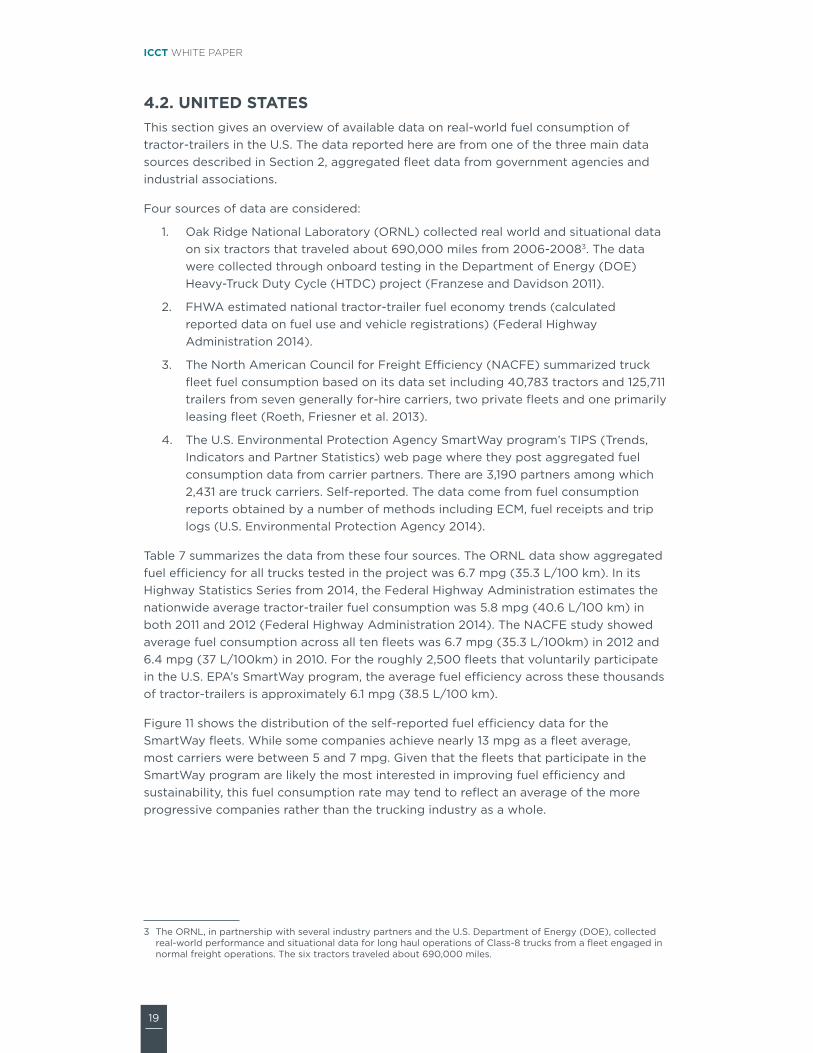
4.2. UNITED STATESThis section gives an overview of available data on real-world fuel consumption of tractor-trailers in the U.S. The data reported here are from one of the three main data sources described in Section 2, aggregated fleet data from government agencies and industrial associations.
Four sources of data are considered:
1. Oak Ridge National Laboratory (ORNL) collected real world and situational data on six tractors that traveled about 690,000 miles from 2006-20083. The data were collected through onboard testing in the Department of Energy (DOE) Heavy-Truck Duty Cycle (HTDC) project (Franzese and Davidson 2011).
2. FHWA estimated national tractor-trailer fuel economy trends (calculated reported data on fuel use and vehicle registrations) (Federal Highway Administration 2014).
3. The North American Council for Freight Efficiency (NACFE) summarized truck fleet fuel consumption based on its data set including 40,783 tractors and 125,711 trailers from seven generally for-hire carriers, two private fleets and one primarily leasing fleet (Roeth, Friesner et al. 2013).
4. The U.S. Environmental Protection Agency SmartWay program’s TIPS (Trends, Indicators and Partner Statistics) web page where they post aggregated fuel consumption data from carrier partners. There are 3,190 partners among which 2,431 are truck carriers. Self-reported. The data come from fuel consumption reports obtained by a number of methods including ECM, fuel receipts and trip logs (U.S. Environmental Protection Agency 2014).
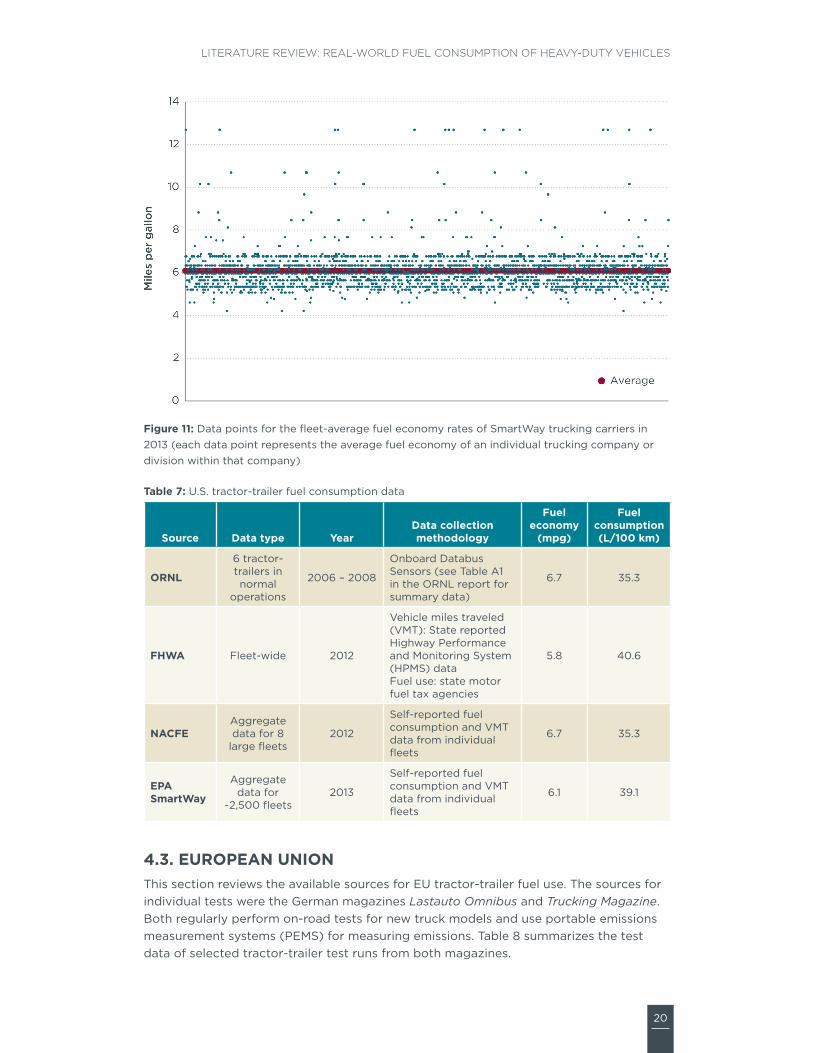
Table 7 summarizes the data from these four sources. The ORNL data show aggregated fuel efficiency for all trucks tested in the project was 6.7 mpg (35.3 L/100 km). In its Highway Statistics Series from 2014, the Federal Highway Administration estimates the nationwide average tractor-trailer fuel consumption was 5.8 mpg (40.6 L/100 km) in both 2011 and 2012 (Federal Highway Administration 2014). The NACFE study showed average fuel consumption across all ten fleets was 6.7 mpg (35.3 L/100km) in 2012 and 6.4 mpg (37 L/100km) in 2010. For the roughly 2,500 fleets that voluntarily participate in the U.S. EPA’s SmartWay program, the average fuel efficiency across these thousands of tractor-trailers is approximately 6.1 mpg (38.5 L/100 km).
Figure 11 shows the distribution of the self-reported fuel efficiency data for the SmartWay fleets. While some companies achieve nearly 13 mpg as a fleet average, most carriers were between 5 and 7 mpg. Given that the fleets that participate in the SmartWay program are likely the most interested in improving fuel efficiency and sustainability, this fuel consumption rate may tend to reflect an average of the more progressive companies rather than the trucking industry as a whole.
3 The ORNL, in partnership with several industry partners and the U.S. Department of Energy (DOE), collected real-world performance and situational data for long haul operations of Class-8 trucks from a fleet engaged in normal freight operations. The six tractors traveled about 690,000 miles.
20
LITERATURE REVIEW: REAL-WORLD FUEL CONSUMPTION OF HEAVY-DUTY VEHICLES
Figure 11: Data points for the fleet-average fuel economy rates of SmartWay trucking carriers in 2013 (each data point represents the average fuel economy of an individual trucking company or division within that company)
Table 7: U.S. tractor-trailer fuel consumption data
Source Data type YearData collection methodology
Fuel economy
(mpg)
Fuel consumption (L/100 km)
ORNL
6 tractor-trailers in normal
operations
2006 – 2008
Onboard Databus Sensors (see Table A1 in the ORNL report for summary data)
6.7 35.3
FHWA Fleet-wide 2012
Vehicle miles traveled (VMT): State reported Highway Performance and Monitoring System (HPMS) data Fuel use: state motor fuel tax agencies
5.8 40.6
NACFEAggregate data for 8
large fleets2012
Self-reported fuel consumption and VMT data from individual fleets
6.7 35.3
EPA SmartWay
Aggregate data for
~2,500 fleets2013
Self-reported fuel consumption and VMT data from individual fleets
6.1 39.1
4.3. EUROPEAN UNIONThis section reviews the available sources for EU tractor-trailer fuel use. The sources for individual tests were the German magazines Lastauto Omnibus and Trucking Magazine. Both regularly perform on-road tests for new truck models and use portable emissions measurement systems (PEMS) for measuring emissions. Table 8 summarizes the test data of selected tractor-trailer test runs from both magazines.
21
ICCT WHITE PAPER
On average, the testing from both sources showed fuel consumption rates between 36 and 38 L/100 km. All trucks tested are Euro V, VI, or Enhanced Environmental Vehicles (EEVs). The EEV emission levels refer to a non-binding standard for heavy-duty vehicles lying between the levels of Euro V and Euro VI. EEV levels of hydrocarbon and carbon monoxide emissions are between the Euro V and VI levels, while particulate matter and nitrogen oxide levels are unchanged from Euro V.
When analyzing the average fuel efficiency values over test runs at various speeds, some Euro VI trucks show higher fuel consumption values when compared to their Euro V counterparts at a similar average speed, which might be attributable to the trade-off between emission control and fuel efficiency technologies. Euro VI trucks are equipped with diesel particulate filters (DPFs), which are very effective at eliminating particulate—typical particulate mass reduction rates are greater than 90%—and black carbon, which is the component of particulate matter that is light-absorbing and a fairly powerful short-lived climate forcing agent. DPFs typically increase the back-pressure in the exhaust and result in higher fuel burn rates. Periodic regeneration (i.e., self-cleaning or purging of the built-up particulate matter) also results in higher fuel consumption. However, the data from both Lastauto Omnibus and Trucking Magazine are inconclusive about the difference in efficiency between Euro V and VI trucks. With no clear directionality of the data of Euro V versus VI efficiency levels, it is clear that truck manufacturers in Europe have introduced other vehicle-level technologies (e.g., aerodynamic improvements) to counterbalance the fuel consumption effects of the DPFs.
In addition to the test data from the two periodicals, a study sponsored by the European Commission provides another data point on the average efficiency of tractor-trailers in the EU. As part of a multiyear effort to better understand the commercial vehicle industry and develop a suite of policy measures for reducing fuel consumption and GHG emissions from the fleet, the European Commission over the past four years has sponsored a number of research efforts. The first such project, the “Lot 1” study, was completed in early 2011 and looks in detail at the HDV market, available fuel-saving technologies and strategies, and potential impacts of the accelerated deployment of these technologies.
AEA-Ricardo, which authored the report, broke the HDV sector into eight vocation-specific groups and developed fuel consumption rate estimates for each category. For long-haul tractor-trailers, 30.9 L/100 km was assumed to be the average value for the fleet. This value is roughly 15-20% lower than the test results reported in Lastauto Omnibus and Trucking Magazine. As aforementioned, there are a plethora of reasons why there can be wide variability when looking at various fuel consumption data sources. Moreover, the potential disconnect is widened when looking at completely different types of data—in this case, individual road test results compared to an estimate for the overall fleet average for the entire region.
22
LITERATURE REVIEW: REAL-WORLD FUEL CONSUMPTION OF HEAVY-DUTY VEHICLES
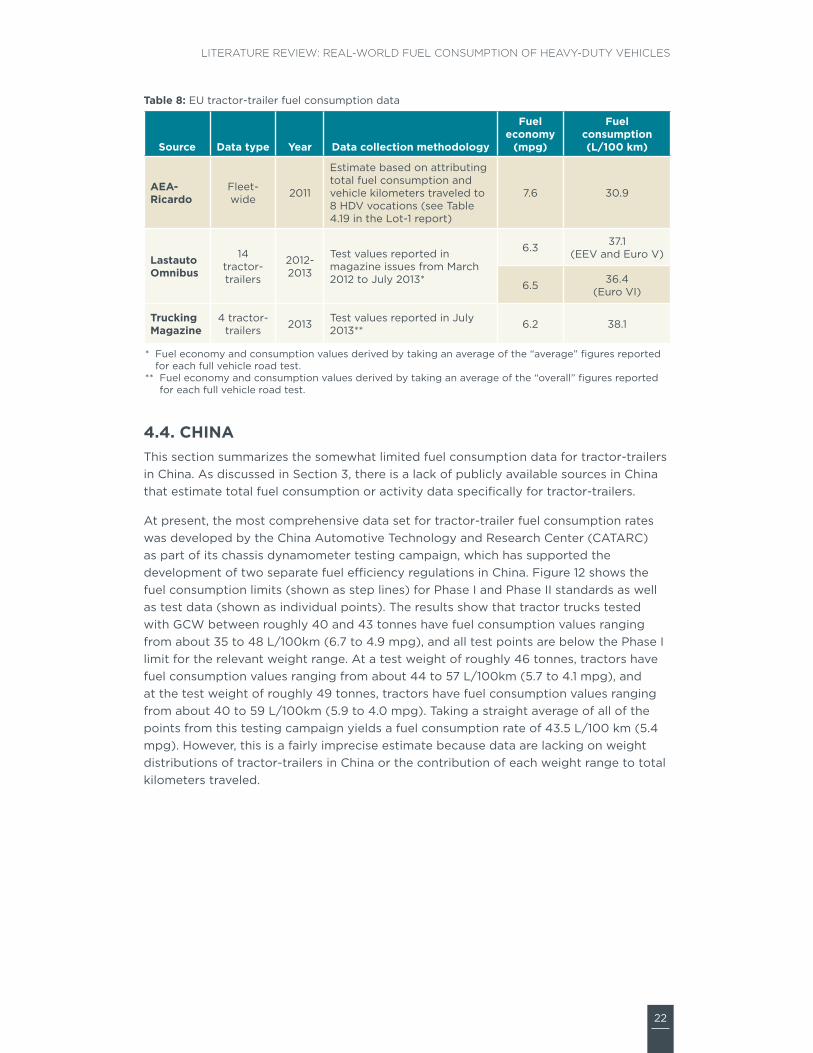
Table 8: EU tractor-trailer fuel consumption data
Source Data type Year Data collection methodology
Fuel economy
(mpg)
Fuel consumption (L/100 km)
AEA-Ricardo
Fleet-wide 2011
Estimate based on attributing total fuel consumption and vehicle kilometers traveled to 8 HDV vocations (see Table 4.19 in the Lot-1 report)
7.6 30.9
Lastauto Omnibus
14 tractor-trailers
2012-2013
Test values reported in magazine issues from March 2012 to July 2013*
6.3 37.1 (EEV and Euro V)
6.5 36.4 (Euro VI)
Trucking Magazine
4 tractor-trailers 2013 Test values reported in July
2013** 6.2 38.1
* Fuel economy and consumption values derived by taking an average of the “average” figures reported for each full vehicle road test.
** Fuel economy and consumption values derived by taking an average of the “overall” figures reported for each full vehicle road test.
4.4. CHINAThis section summarizes the somewhat limited fuel consumption data for tractor-trailers in China. As discussed in Section 3, there is a lack of publicly available sources in China that estimate total fuel consumption or activity data specifically for tractor-trailers.
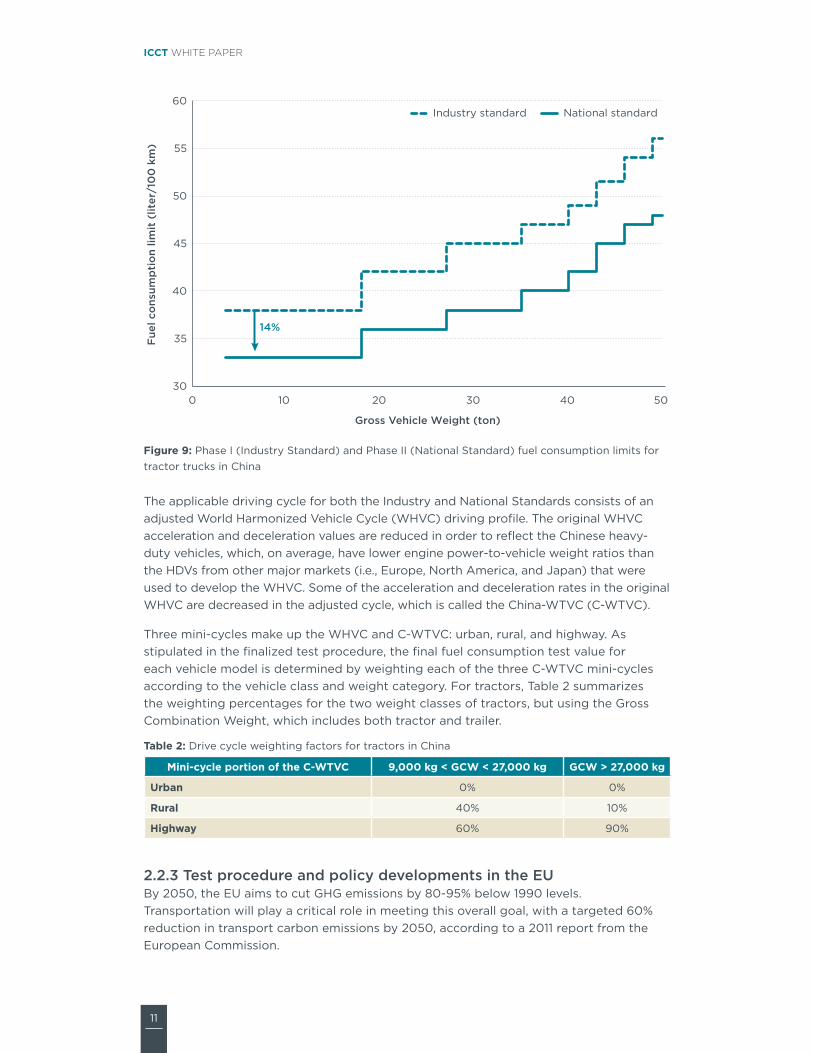
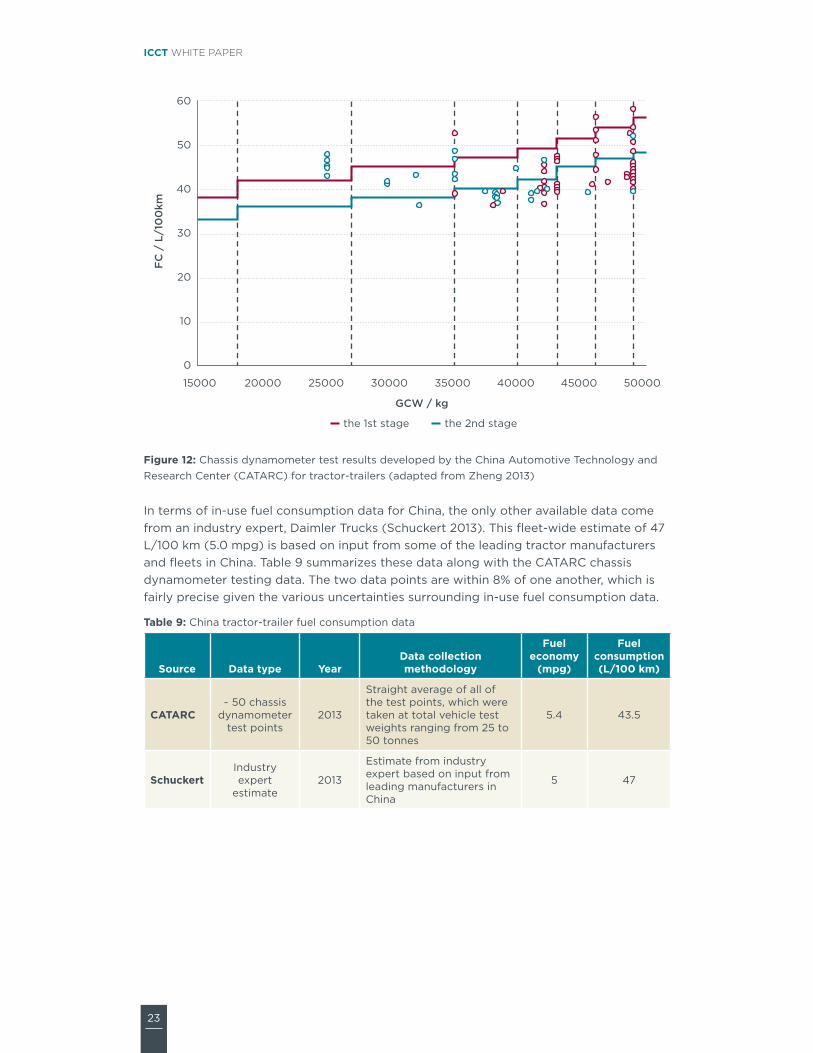
At present, the most comprehensive data set for tractor-trailer fuel consumption rates was developed by the China Automotive Technology and Research Center (CATARC) as part of its chassis dynamometer testing campaign, which has supported the development of two separate fuel efficiency regulations in China. Figure 12 shows the fuel consumption limits (shown as step lines) for Phase I and Phase II standards as well as test data (shown as individual points). The results show that tractor trucks tested with GCW between roughly 40 and 43 tonnes have fuel consumption values ranging from about 35 to 48 L/100km (6.7 to 4.9 mpg), and all test points are below the Phase I limit for the relevant weight range. At a test weight of roughly 46 tonnes, tractors have fuel consumption values ranging from about 44 to 57 L/100km (5.7 to 4.1 mpg), and at the test weight of roughly 49 tonnes, tractors have fuel consumption values ranging from about 40 to 59 L/100km (5.9 to 4.0 mpg). Taking a straight average of all of the points from this testing campaign yields a fuel consumption rate of 43.5 L/100 km (5.4 mpg). However, this is a fairly imprecise estimate because data are lacking on weight distributions of tractor-trailers in China or the contribution of each weight range to total kilometers traveled.
23
ICCT WHITE PAPER
50
40
30
20
10
0
60
FC
/ L
/10
0km
15000 20000 25000 30000
GCW / kg
35000 40000 45000 50000
the 1st stage the 2nd stage
Figure 12: Chassis dynamometer test results developed by the China Automotive Technology and Research Center (CATARC) for tractor-trailers (adapted from Zheng 2013)
In terms of in-use fuel consumption data for China, the only other available data come from an industry expert, Daimler Trucks (Schuckert 2013). This fleet-wide estimate of 47 L/100 km (5.0 mpg) is based on input from some of the leading tractor manufacturers and fleets in China. Table 9 summarizes these data along with the CATARC chassis dynamometer testing data. The two data points are within 8% of one another, which is fairly precise given the various uncertainties surrounding in-use fuel consumption data.
Table 9: China tractor-trailer fuel consumption data
Source Data type YearData collection methodology
Fuel economy
(mpg)
Fuel consumption (L/100 km)
CATARC~ 50 chassis
dynamometer test points
2013
Straight average of all of the test points, which were taken at total vehicle test weights ranging from 25 to 50 tonnes
5.4 43.5
SchuckertIndustry expert
estimate2013
Estimate from industry expert based on input from leading manufacturers in China
5 47
24
LITERATURE REVIEW: REAL-WORLD FUEL CONSUMPTION OF HEAVY-DUTY VEHICLES
5. SUMMARY AND FUTURE RESEARCH
This study reviewed and summarized available data for commercial vehicle sales as well as real-world fuel consumption values for tractor-trailers in the U.S., EU and China. Together, these key markets constitute more than 70% of HDV sales worldwide. Looking at the breakdown of HDV fuel consumption in each of the three regions, tractor-trailers represent the largest (or nearly the largest in the case of China) share of fuel use and GHG emissions. As such, we chose this segment of HDVs as the initial focus of our ongoing effort to better understand how blossoming fuel efficiency regulations for heavy-duty trucks and buses in various markets around the world are impacting technology penetration and real-world fuel efficiency performance.
Fuel consumption data for full vehicles generally fall into one of the following four categories: national or regional data, aggregate data across a number of fleets, road test data for individual vehicles, and chassis dynamometer data. For this study, we had access to all four types of data, although the types of data available for each region varied widely. Overall, despite there being a general scarcity of data for real-world fuel consumption of tractor-trailers, we found the largest number of publicly available sources for the U.S., followed by the EU, with China having very few sources to reference other than chassis dynamometer results.
In the U.S., average tractor-trailer fuel consumption rates for the entire fleet are approximately 39 L/100 km (6 mpg). For the newest U.S. models, fuel consumption is typically between 33 and 36 L/100 km (6.5–7 mpg). A fleet-wide analysis done for the European Commission estimates tractor-trailer fuel consumption at roughly 31 L/100 km, while tests of individual vehicles done by trucking magazines suggest somewhat higher average rates of consumption at approximately 36 to 38 L/100 km. At present, there is not sufficient information to say definitely if the U.S. or EU has more efficient trucks. However, because the U.S. has mandatory HDV efficiency standards in place, the rate of technology development and deployment will likely be faster than for trucks in the EU, which does not currently have performance standards in place.
Chassis dynamometer testing performed as part of the regulatory development process in China reveals that tractor-trailers seem to have much higher fuel consumption rates, on average, than in the U.S. and the EU. These laboratory results yield an average of 44 L/100 km.
Due to limited data availability as well as the myriad of region-specific variables that influence real-world fuel efficiency, such as driver behavior, average speeds, payloads, and environmental conditions, there is limited opportunity to perform an apples-to-apples comparison of fuel consumption rates across the three regions. Hence, the focus of this study is not to compare or rank the real-world fuel consumption performance of tractor-trailers in the three regions. Rather, the primary objective is to call attention to the significant need for additional data collection and sustained inventory campaigns for vehicle fuel use and activity that can allow government, industry, and other stakeholders to better understand the real-world impacts of fuel efficiency and GHG regulations for HDVs.
One avenue by which each of the three regions can augment the amount of in-use fuel efficiency data available is by making further investments in existing green freight programs. As evidenced in the discussion of SmartWay data, a diverse set of
25
ICCT WHITE PAPER
stakeholders—fleets, shippers, policymakers, and the general public—all can benefit from the wealth of data that green freight programs can collect and disseminate. Data such as total distance traveled and the amount of fuel consumed can be sensitive information for many trucking companies, but steps taken to preserve anonymity (as is done in the five-tier ranking system of the SmartWay program) help ensure that stakeholders are able to derive benefits from the data without subjecting any individual fleet to unwanted disclosures.
In many cases, fleets are already responsible for reporting data such as total activity and fuel consumed to other government agencies, so this information can be given to green freight program administrators without requiring a great deal of additional resources. China and the EU, whose respective green freight programs are in their early stages, can learn from the experiences in the U.S. and craft programs and data repositories that are most useful for their local context.
At a minimum, activity and fuel consumption data are needed to create fuel efficiency metrics and understand macro fuel consumption trends for all of the fleets participating in the program. In addition, other data such as information about operational practices and technology adoption can help complement and validate fuel efficiency data derived from aggregate activity and fuel use totals. Also, as seen in the U.S., green freight programs can be extended to include air pollution criteria, such as emissions of particulate matter and nitrogen oxides.
Future work for the ICCT will include more technology-specific studies for HDVs in each of the three regions. For example, subsequent research will evaluate the vehicle technology adoption across each market and compare representative vehicles from each region over a range of duty cycles using simulation. Representative vehicle models will be selected based on market shares for each region (e.g., the best-selling tractor model). Then, simulations over a range of applicable duty cycles will be conducted. This more technical next phase of research will help to show in increasing detail how accelerated technology adoption due to regulation and increased demand for fuel efficient vehicles are resulting in improved efficiency and reduced GHG emissions for HDVs worldwide.
26
LITERATURE REVIEW: REAL-WORLD FUEL CONSUMPTION OF HEAVY-DUTY VEHICLES
REFERENCES
ExxonMobil. “The Outlook for Energy: A View to 2040.” Irving, TX: ExxonMobil. 2013.
Facanha, C., K. Blumberg, et al. “Global Transportation Energy and Climate Roadmap: The Impact of Transportation Policies and Their Potential to Reduce Oil Consumption and Greenhouse Gas Emissions.” Washington, DC: The International Council on Clean Transportation. 2012.
Federal Highway Administration, U.S. Department of Transportation. “Annual Vehicle Distance Traveled in Miles and Related Data—2012 by Highway Category and Vehicle Type (Table VM-1).” http://www.fhwa.dot.gov/policyinformation/statistics/2012/vm1.cfm, retrieved August 26, 2014.
Franzese, O., and D. Davidson. “Effect of weight and roadway grade on the fuel economy of class-8 freight trucks.” Oak Ridge, TN: Oak Ridge National Laboratory (ORNL). 2011.
Fulton, L., P. Cazzola, et al. “Transport, Energy, and CO2: Moving Toward Sustainability.” Paris, France: International Energy Agency. 2009.
General Administration of Quality Supervision and the Standard Administration of the People’s Republic of China. “Fuel consumption test methods for medium and heavy-duty commercial vehicles.” GB/T 27840-2011. Beijing, China. 2011.
Hausberger, S., A. Kies, et al. “Reduction and testing of GHG emissions from heavy-duty vehicles—Lot 2: Development and testing of a certification procedure for CO2 emissions and fuel consumption of HDV.” Graz, Austria: Graz University of Technology. 2012.
The International Council on Clean Transportation (ICCT). September 26, 2011. “U.S. heavy-duty vehicle standards.” http://www.theicct.org/us-heavy-duty-vehicle-standards, retrieved August 21, 2014.
The International Council on Clean Transportation (ICCT). January 2013. “Proposed nation fuel consumption standard for commercial heavy-duty vehicles in China.” http://www.theicct.org/sites/default/files/publications/ICCTupdate_ChinaHDV_Jan2013.pdf, retrieved January 15, 2015.
The International Council on Clean Transportation (ICCT). June 30, 2014. “Global Transportation Roadmap Model.” http://www.theicct.org/global-transportation-roadmap-model, retrieved August 20, 2014.
Jin, Y. “Development of Fuel Consumption Standards of Heavy-duty Vehicles in China.” Presentation at the International Workshop of Heavy-duty Vehicle Fuel Efficiency Technology, Standards, and Policies. Tianjin, China, China Automotive Technology and Research Center (CATARC). 2014.
Lowell, D. and T. Balon, “Setting the Stage for Regulation of Heavy-Duty Vehicle Fuel Economy & GHG Emissions: Issues and Opportunities.” Concord, MA: M.J. Bradley & Associates LLC. 2009.
Roeth, M., J. Friesner, et al. 2013 Fleet Fuel Efficiency Benchmark Study. Fort Wayne, IN: North American Council for Freight Efficiency (NACFE). 2013.
Schuckert, M., “Freight efficiency in main HDV markets.” Ispra, Italy: Daimler. 2013.
U.S. Energy Information Administration. Annual Energy Outlook 2014. Washington, DC: U.S. Energy Information Administration. 2014.
27
ICCT WHITE PAPER
U.S. Environmental Protection Agency. Greenhouse Gas Emissions Standards and Fuel Efficiency Standards for Medium- and Heavy-Duty Engines and Vehicles. Federal Register, Vol. 76, Number 179 (15 September 2011). U.S. Government Printing Office.
U.S. Environmental Protection Agency. July 10, 2014. “SmartWay Carrier Performance Rankings.” http://www.epa.gov/smartway/forpartners/performance.htm, retrieved August 26, 2014.
WardsAuto Group Inc. 2012 World Vehicle Sales by Company Group and Country. New York, NY: Penton. 2013.
WardsAuto Group Inc. 2013 World Vehicle Sales by Company Group and Country. New York, NY: Penton. 2014.
Zheng, T., “Development of Heavy-duty Vehicle Fuel Consumption Standards in China.” Presentation to the International Council on Clean Transportation, San Francisco, CA, 2013.