icao long-term traffic forecasts presentations/icao-long-term-traffic-forecasts...july 2016 icao...
TRANSCRIPT
INTERNATIONAL CIVIL AVIATION ORGANIZATION
July 2016
ICAO Long-Term Traffic Forecasts
Passenger and Cargo


INTERNATIONAL CIVIL AVIATION ORGANIZATION
July 2016
ICAO Long-Term Traffic Forecasts
Passenger and Cargo


ICAO LONG-TERM TRAFFIC FORECASTSINTERNATIONAL CIVIL AVIATION ORGANIZATION 5
. . . . . . . . . . . . . . . . . . . . . . . . . . . . . . . . . . . . . . . . . . . . . . . . . . . . . . . . . . . . . . . . . . . . . . . . . . . . . . . . . . . . . . . . . . . . . . . . . . . . . . . . . . . . . . . . . . . . . . . . . . . . . . . . . . . . . . . . . . . . . . . . . . . . . . . . . . . . . . . . . . . . .
. . . . . . . . . . . . . . . . . . . . . . . . . . . . . . . . . . . . . . . . . . . . . . . . . . . . . . . . . . . . . . . . . . . . . . . . . . . . . . . . . . . . . . . . . . . . . . . . . . . . . . . . . . . . . . . . . . . . . . . . . . . . . . . . . . . . . . . . . . . . . . . . . . . . . . . . . . . . . . . . . . . . . . . . . . . . .
T a b l e o f C o n t e n t s
Methodology . . . . . . . . . . . . . . . . . . . . . . . . . . . . . . . . . . . . . . . . 7
World . . . . . . . . . . . . . . . . . . . . . . . . . . . . . . . . . . . . . . . . . . . . . 10
Africa . . . . . . . . . . . . . . . . . . . . . . . . . . . . . . . . . . . . . . . . . . . . . 12
Asia And Pacific . . . . . . . . . . . . . . . . . . . . . . . . . . . . . . . . . . . . . 13
Europe . . . . . . . . . . . . . . . . . . . . . . . . . . . . . . . . . . . . . . . . . . . . 14
Latin America And The Caribbean . . . . . . . . . . . . . . . . . . . . . . . 15
Middle East . . . . . . . . . . . . . . . . . . . . . . . . . . . . . . . . . . . . . . . . 16
North America . . . . . . . . . . . . . . . . . . . . . . . . . . . . . . . . . . . . . . 17
Definition Of Regions . . . . . . . . . . . . . . . . . . . . . . . . . . . . . . . . . 18
World map of Long Term Forecasts Regions . . . . . . . . . . . . . . . 20
Summary of Passenger Traffic Forecasts by Route Group . . . . . 21
Summary of Total Cargo Traffic Forecasts by Region of Airline Registration . . . . . . . . . . . . . . . . . . . . . . . 22
Total traffic: history and forecasts . . . . . . . . . . . . . . . . . . . . . . . 23

ICAO LONG-TERM TRAFFIC FORECASTSINTERNATIONAL CIVIL AVIATION ORGANIZATION 7
. . . . . . . . . . . . . . . . . . . . . . . . . . . . . . . . . . . . . . . . . . . . . . . . . . . . . . . . . . . . . . . . . . . . . . . . . . . . . . . . . . . . . . . . . . . . . . . . . . . . . . . . . . . . . . . . . . . . . . . . . . . . . . . . . . . . . . . . . . . . . . . . . . . . . . . . . . . . . . . . . . . . .
. . . . . . . . . . . . . . . . . . . . . . . . . . . . . . . . . . . . . . . . . . . . . . . . . . . . . . . . . . . . . . . . . . . . . . . . . . . . . . . . . . . . . . . . . . . . . . . . . . . . . . . . . . . . . . . . . . . . . . . . . . . . . . . . . . . . . . . . . . . . . . . . . . . . . . . . . . . . . . . . . . . . . . . . . . . . .
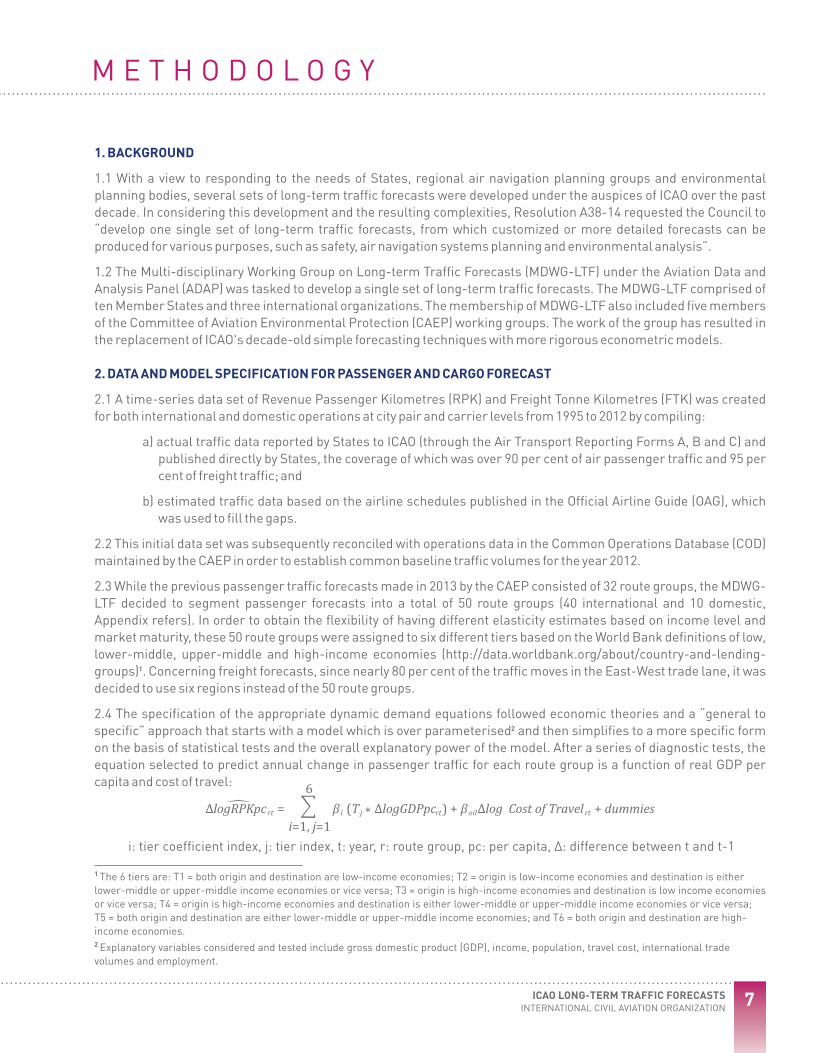
M E T H O D O L O G Y
1. BACKGROUND
1.1 With a view to responding to the needs of States, regional air navigation planning groups and environmental planning bodies, several sets of long-term traffic forecasts were developed under the auspices of ICAO over the past decade. In considering this development and the resulting complexities, Resolution A38-14 requested the Council to “develop one single set of long-term traffic forecasts, from which customized or more detailed forecasts can be produced for various purposes, such as safety, air navigation systems planning and environmental analysis”.
1.2 The Multi-disciplinary Working Group on Long-term Traffic Forecasts (MDWG-LTF) under the Aviation Data and Analysis Panel (ADAP) was tasked to develop a single set of long-term traffic forecasts. The MDWG-LTF comprised of ten Member States and three international organizations. The membership of MDWG-LTF also included five members of the Committee of Aviation Environmental Protection (CAEP) working groups. The work of the group has resulted in the replacement of ICAO's decade-old simple forecasting techniques with more rigorous econometric models.
2. DATA AND MODEL SPECIFICATION FOR PASSENGER AND CARGO FORECAST
2.1 A time-series data set of Revenue Passenger Kilometres (RPK) and Freight Tonne Kilometres (FTK) was created for both international and domestic operations at city pair and carrier levels from 1995 to 2012 by compiling:
a) actual traffic data reported by States to ICAO (through the Air Transport Reporting Forms A, B and C) and published directly by States, the coverage of which was over 90 per cent of air passenger traffic and 95 per cent of freight traffic; and
b) estimated traffic data based on the airline schedules published in the Official Airline Guide (OAG), which was used to fill the gaps.
2.2 This initial data set was subsequently reconciled with operations data in the Common Operations Database (COD) maintained by the CAEP in order to establish common baseline traffic volumes for the year 2012.
2.3 While the previous passenger traffic forecasts made in 2013 by the CAEP consisted of 32 route groups, the MDWG-LTF decided to segment passenger forecasts into a total of 50 route groups (40 international and 10 domestic, Appendix refers). In order to obtain the flexibility of having different elasticity estimates based on income level and market maturity, these 50 route groups were assigned to six different tiers based on the World Bank definitions of low, lower-middle, upper-middle and high-income economies (http://data.worldbank.org/about/country-and-lending-
1groups) . Concerning freight forecasts, since nearly 80 per cent of the traffic moves in the East-West trade lane, it was decided to use six regions instead of the 50 route groups.
2.4 The specification of the appropriate dynamic demand equations followed economic theories and a “general to 2specific” approach that starts with a model which is over parameterised and then simplifies to a more specific form
on the basis of statistical tests and the overall explanatory power of the model. After a series of diagnostic tests, the equation selected to predict annual change in passenger traffic for each route group is a function of real GDP per capita and cost of travel:
1 The 6 tiers are: T1 = both origin and destination are low-income economies; T2 = origin is low-income economies and destination is either lower-middle or upper-middle income economies or vice versa; T3 = origin is high-income economies and destination is low income economies or vice versa; T4 = origin is high-income economies and destination is either lower-middle or upper-middle income economies or vice versa; T5 = both origin and destination are either lower-middle or upper-middle income economies; and T6 = both origin and destination are high-income economies. 2 Explanatory variables considered and tested include gross domestic product (GDP), income, population, travel cost, international trade volumes and employment.
i: tier coefficient index, j: tier index, t: year, r: route group, pc: per capita, Δ: difference between t and t-1
ΔlogRPKpc =rt β (T ΔlogGDPpc )+β ΔlogCostofTravel +dummiesi j rt oil rt*i=1,j=1
6
ICAO LONG-TERM TRAFFIC FORECASTSINTERNATIONAL CIVIL AVIATION ORGANIZATION8. . . . . . . . . . . . . . . . . . . . . . . . . . . . . . . . . . . . . . . . . . . . . . . . . . . . . . . . . . . . . . . . . . . . . . . . . . . . . . . . . . . . . . . . . . . . . . . . . . . . . . . . . . . . . . . . . . . . . . . . . . . . . . . . . . . . . . . . . . . . . . . . . . . . . . . . . . . . . . . . . . .
. . . . . . . . . . . . . . . . . . . . . . . . . . . . . . . . . . . . . . . . . . . . . . . . . . . . . . . . . . . . . . . . . . . . . . . . . . . . . . . . . . . . . . . . . . . . . . . . . . . . . . . . . . . . . . . . . . . . . . . . . . . . . . . . . . . . . . . . . . . . . . . . . . . . . . . . . . . . . . . . . . . . . . . . . . . . .
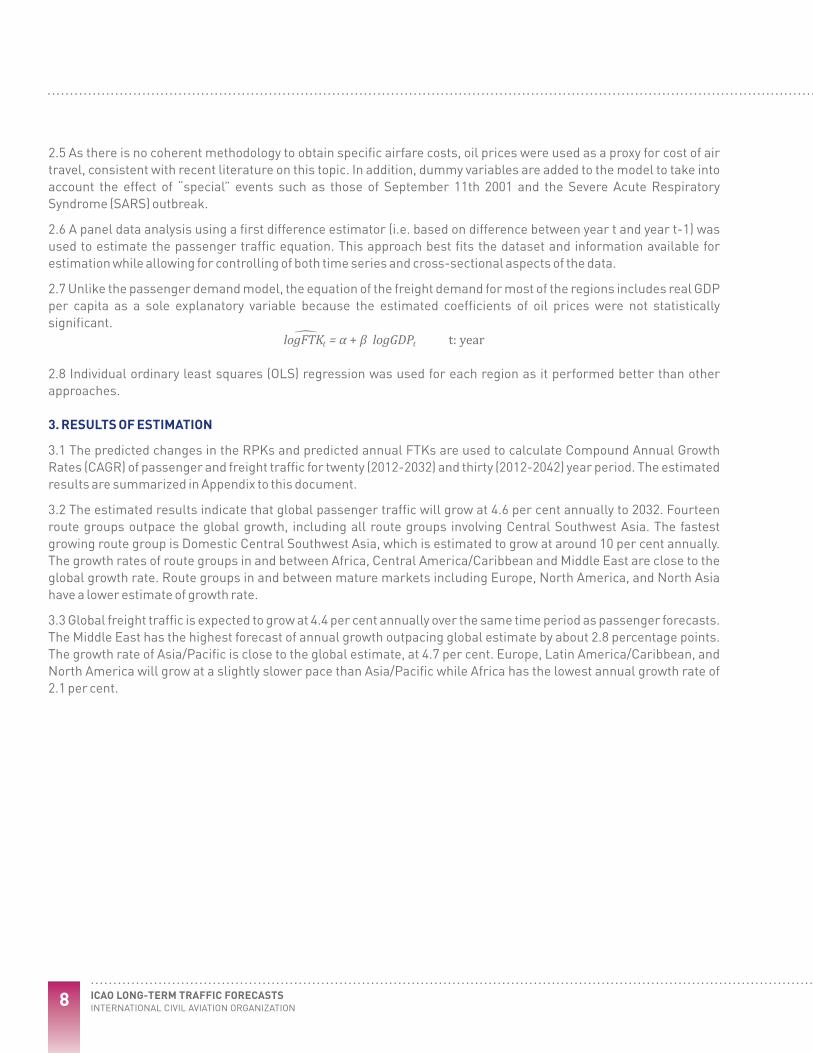
2.5 As there is no coherent methodology to obtain specific airfare costs, oil prices were used as a proxy for cost of air travel, consistent with recent literature on this topic. In addition, dummy variables are added to the model to take into account the effect of “special” events such as those of September 11th 2001 and the Severe Acute Respiratory Syndrome (SARS) outbreak.
2.6 A panel data analysis using a first difference estimator (i.e. based on difference between year t and year t-1) was used to estimate the passenger traffic equation. This approach best fits the dataset and information available for estimation while allowing for controlling of both time series and cross-sectional aspects of the data.
2.7 Unlike the passenger demand model, the equation of the freight demand for most of the regions includes real GDP per capita as a sole explanatory variable because the estimated coefficients of oil prices were not statistically significant.
2.8 Individual ordinary least squares (OLS) regression was used for each region as it performed better than other approaches.
3. RESULTS OF ESTIMATION
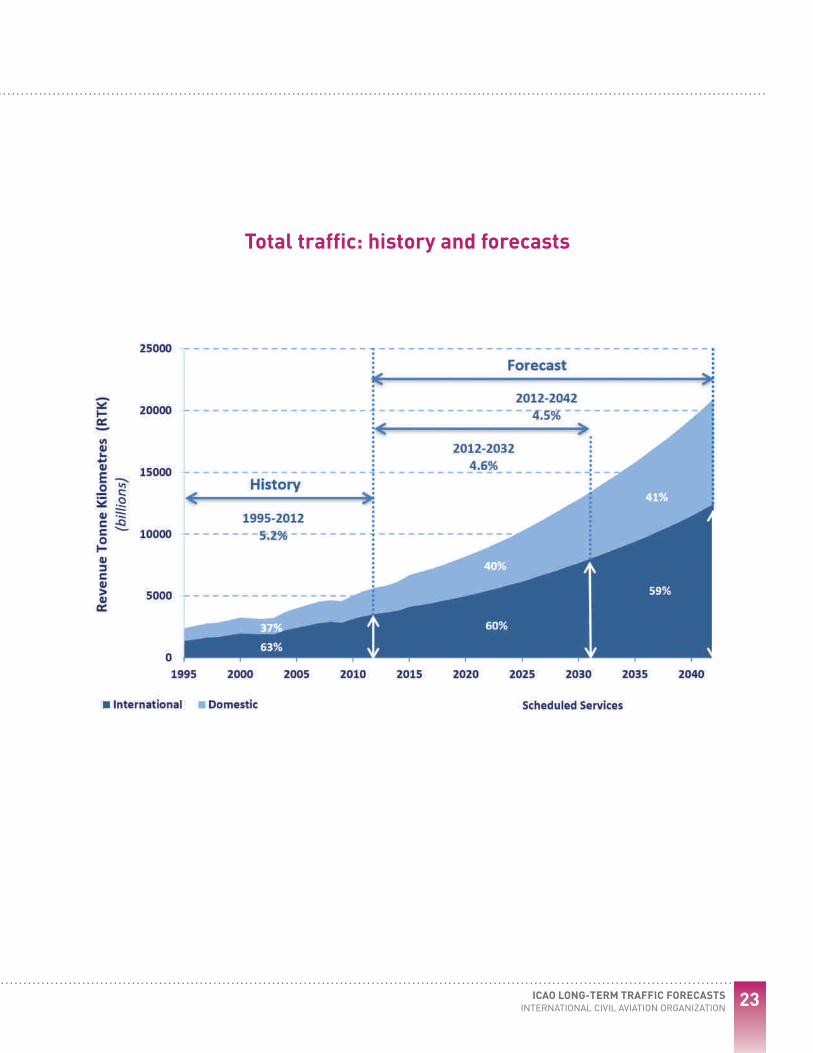
3.1 The predicted changes in the RPKs and predicted annual FTKs are used to calculate Compound Annual Growth Rates (CAGR) of passenger and freight traffic for twenty (2012-2032) and thirty (2012-2042) year period. The estimated results are summarized in Appendix to this document.
3.2 The estimated results indicate that global passenger traffic will grow at 4.6 per cent annually to 2032. Fourteen route groups outpace the global growth, including all route groups involving Central Southwest Asia. The fastest growing route group is Domestic Central Southwest Asia, which is estimated to grow at around 10 per cent annually. The growth rates of route groups in and between Africa, Central America/Caribbean and Middle East are close to the global growth rate. Route groups in and between mature markets including Europe, North America, and North Asia have a lower estimate of growth rate.
3.3 Global freight traffic is expected to grow at 4.4 per cent annually over the same time period as passenger forecasts. The Middle East has the highest forecast of annual growth outpacing global estimate by about 2.8 percentage points. The growth rate of Asia/Pacific is close to the global estimate, at 4.7 per cent. Europe, Latin America/Caribbean, and North America will grow at a slightly slower pace than Asia/Pacific while Africa has the lowest annual growth rate of 2.1 per cent.
logFTK =α+βlogGDP t:yeart t

ICAO LONG-TERM TRAFFIC FORECASTSINTERNATIONAL CIVIL AVIATION ORGANIZATION 9
. . . . . . . . . . . . . . . . . . . . . . . . . . . . . . . . . . . . . . . . . . . . . . . . . . . . . . . . . . . . . . . . . . . . . . . . . . . . . . . . . . . . . . . . . . . . . . . . . . . . . . . . . . . . . . . . . . . . . . . . . . . . . . . . . . . . . . . . . . . . . . . . . . . . . . . . . . . . . . . . . . . . .
. . . . . . . . . . . . . . . . . . . . . . . . . . . . . . . . . . . . . . . . . . . . . . . . . . . . . . . . . . . . . . . . . . . . . . . . . . . . . . . . . . . . . . . . . . . . . . . . . . . . . . . . . . . . . . . . . . . . . . . . . . . . . . . . . . . . . . . . . . . . . . . . . . . . . . . . . . . . . . . . . . . . . . . . . . . . .
World map of ICAO Regions

ICAO LONG-TERM TRAFFIC FORECASTSINTERNATIONAL CIVIL AVIATION ORGANIZATION10. . . . . . . . . . . . . . . . . . . . . . . . . . . . . . . . . . . . . . . . . . . . . . . . . . . . . . . . . . . . . . . . . . . . . . . . . . . . . . . . . . . . . . . . . . . . . . . . . . . . . . . . . . . . . . . . . . . . . . . . . . . . . . . . . . . . . . . . . . . . . . . . . . . . . . . . . . . . . . . . . . .
. . . . . . . . . . . . . . . . . . . . . . . . . . . . . . . . . . . . . . . . . . . . . . . . . . . . . . . . . . . . . . . . . . . . . . . . . . . . . . . . . . . . . . . . . . . . . . . . . . . . . . . . . . . . . . . . . . . . . . . . . . . . . . . . . . . . . . . . . . . . . . . . . . . . . . . . . . . . . . . . . . . . . . . . . . . . .
Total passenger traffic: history and forecasts
World top 10 passenger traffic by route group: 2012 vs. 2032 and 2012 vs. 2042
W o r l d

ICAO LONG-TERM TRAFFIC FORECASTSINTERNATIONAL CIVIL AVIATION ORGANIZATION 11
. . . . . . . . . . . . . . . . . . . . . . . . . . . . . . . . . . . . . . . . . . . . . . . . . . . . . . . . . . . . . . . . . . . . . . . . . . . . . . . . . . . . . . . . . . . . . . . . . . . . . . . . . . . . . . . . . . . . . . . . . . . . . . . . . . . . . . . . . . . . . . . . . . . . . . . . . . . . . . . . . . . . .
. . . . . . . . . . . . . . . . . . . . . . . . . . . . . . . . . . . . . . . . . . . . . . . . . . . . . . . . . . . . . . . . . . . . . . . . . . . . . . . . . . . . . . . . . . . . . . . . . . . . . . . . . . . . . . . . . . . . . . . . . . . . . . . . . . . . . . . . . . . . . . . . . . . . . . . . . . . . . . . . . . . . . . . . . . . . .
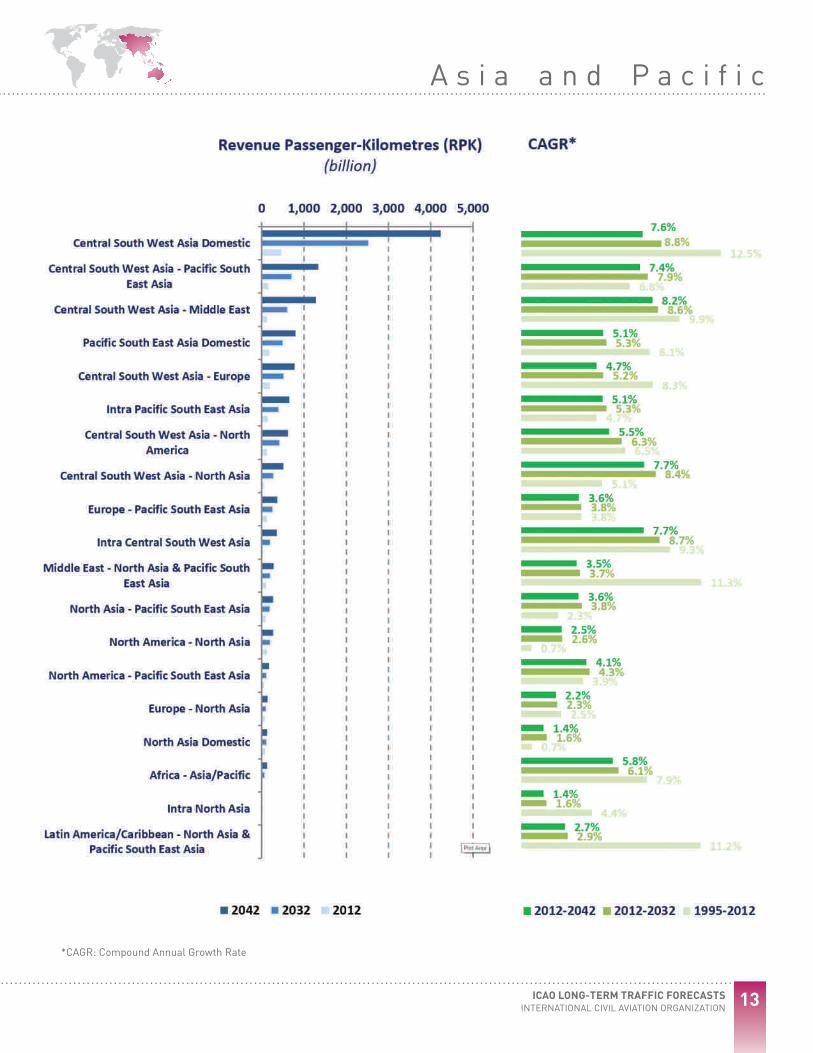
Forecast. Passenger traffic by route group by region: 2012 vs. 2032 and 2012 vs. 2042

ICAO LONG-TERM TRAFFIC FORECASTSINTERNATIONAL CIVIL AVIATION ORGANIZATION12. . . . . . . . . . . . . . . . . . . . . . . . . . . . . . . . . . . . . . . . . . . . . . . . . . . . . . . . . . . . . . . . . . . . . . . . . . . . . . . . . . . . . . . . . . . . . . . . . . . . . . . . . . . . . . . . . . . . . . . . . . . . . . . . . . . . . . . . . . . . . . . . . . . . . . . . . . . . . . . . . . .
. . . . . . . . . . . . . . . . . . . . . . . . . . . . . . . . . . . . . . . . . . . . . . . . . . . . . . . . . . . . . . . . . . . . . . . . . . . . . . . . . . . . . . . . . . . . . . . . . . . . . . . . . . . . . . . . . . . . . . . . . . . . . . . . . . . . . . . . . . . . . . . . . . . . . . . . . . . . . . . . . . . . . . . . . . . . .A f r i c a
*CAGR: Compound Annual Growth Rate
ICAO LONG-TERM TRAFFIC FORECASTSINTERNATIONAL CIVIL AVIATION ORGANIZATION 13
. . . . . . . . . . . . . . . . . . . . . . . . . . . . . . . . . . . . . . . . . . . . . . . . . . . . . . . . . . . . . . . . . . . . . . . . . . . . . . . . . . . . . . . . . . . . . . . . . . . . . . . . . . . . . . . . . . . . . . . . . . . . . . . . . . . . . . . . . . . . . . . . . . . . . . . . . . . . . . . . . . . . .
. . . . . . . . . . . . . . . . . . . . . . . . . . . . . . . . . . . . . . . . . . . . . . . . . . . . . . . . . . . . . . . . . . . . . . . . . . . . . . . . . . . . . . . . . . . . . . . . . . . . . . . . . . . . . . . . . . . . . . . . . . . . . . . . . . . . . . . . . . . . . . . . . . . . . . . . . . . . . . . . . . . . . . . . . . . . .A s i a a n d P a c i f i c
*CAGR: Compound Annual Growth Rate

ICAO LONG-TERM TRAFFIC FORECASTSINTERNATIONAL CIVIL AVIATION ORGANIZATION14. . . . . . . . . . . . . . . . . . . . . . . . . . . . . . . . . . . . . . . . . . . . . . . . . . . . . . . . . . . . . . . . . . . . . . . . . . . . . . . . . . . . . . . . . . . . . . . . . . . . . . . . . . . . . . . . . . . . . . . . . . . . . . . . . . . . . . . . . . . . . . . . . . . . . . . . . . . . . . . . . . .
. . . . . . . . . . . . . . . . . . . . . . . . . . . . . . . . . . . . . . . . . . . . . . . . . . . . . . . . . . . . . . . . . . . . . . . . . . . . . . . . . . . . . . . . . . . . . . . . . . . . . . . . . . . . . . . . . . . . . . . . . . . . . . . . . . . . . . . . . . . . . . . . . . . . . . . . . . . . . . . . . . . . . . . . . . . . .
*CAGR: Compound Annual Growth Rate
E u r o p e

ICAO LONG-TERM TRAFFIC FORECASTSINTERNATIONAL CIVIL AVIATION ORGANIZATION 15
. . . . . . . . . . . . . . . . . . . . . . . . . . . . . . . . . . . . . . . . . . . . . . . . . . . . . . . . . . . . . . . . . . . . . . . . . . . . . . . . . . . . . . . . . . . . . . . . . . . . . . . . . . . . . . . . . . . . . . . . . . . . . . . . . . . . . . . . . . . . . . . . . . . . . . . . . . . . . . . . . . . . .
. . . . . . . . . . . . . . . . . . . . . . . . . . . . . . . . . . . . . . . . . . . . . . . . . . . . . . . . . . . . . . . . . . . . . . . . . . . . . . . . . . . . . . . . . . . . . . . . . . . . . . . . . . . . . . . . . . . . . . . . . . . . . . . . . . . . . . . . . . . . . . . . . . . . . . . . . . . . . . . . . . . . . . . . . . . . .L a t i n A m e r i c a a n d t h e C a r i b b e a n
*CAGR: Compound Annual Growth Rate

ICAO LONG-TERM TRAFFIC FORECASTSINTERNATIONAL CIVIL AVIATION ORGANIZATION16. . . . . . . . . . . . . . . . . . . . . . . . . . . . . . . . . . . . . . . . . . . . . . . . . . . . . . . . . . . . . . . . . . . . . . . . . . . . . . . . . . . . . . . . . . . . . . . . . . . . . . . . . . . . . . . . . . . . . . . . . . . . . . . . . . . . . . . . . . . . . . . . . . . . . . . . . . . . . . . . . . .
. . . . . . . . . . . . . . . . . . . . . . . . . . . . . . . . . . . . . . . . . . . . . . . . . . . . . . . . . . . . . . . . . . . . . . . . . . . . . . . . . . . . . . . . . . . . . . . . . . . . . . . . . . . . . . . . . . . . . . . . . . . . . . . . . . . . . . . . . . . . . . . . . . . . . . . . . . . . . . . . . . . . . . . . . . . . .
*CAGR: Compound Annual Growth Rate
M i d d l e E a s t

ICAO LONG-TERM TRAFFIC FORECASTSINTERNATIONAL CIVIL AVIATION ORGANIZATION 17
. . . . . . . . . . . . . . . . . . . . . . . . . . . . . . . . . . . . . . . . . . . . . . . . . . . . . . . . . . . . . . . . . . . . . . . . . . . . . . . . . . . . . . . . . . . . . . . . . . . . . . . . . . . . . . . . . . . . . . . . . . . . . . . . . . . . . . . . . . . . . . . . . . . . . . . . . . . . . . . . . . . . .
. . . . . . . . . . . . . . . . . . . . . . . . . . . . . . . . . . . . . . . . . . . . . . . . . . . . . . . . . . . . . . . . . . . . . . . . . . . . . . . . . . . . . . . . . . . . . . . . . . . . . . . . . . . . . . . . . . . . . . . . . . . . . . . . . . . . . . . . . . . . . . . . . . . . . . . . . . . . . . . . . . . . . . . . . . . . .N o r t h A m e r i c a
*CAGR: Compound Annual Growth Rate
ICAO LONG-TERM TRAFFIC FORECASTSINTERNATIONAL CIVIL AVIATION ORGANIZATION18. . . . . . . . . . . . . . . . . . . . . . . . . . . . . . . . . . . . . . . . . . . . . . . . . . . . . . . . . . . . . . . . . . . . . . . . . . . . . . . . . . . . . . . . . . . . . . . . . . . . . . . . . . . . . . . . . . . . . . . . . . . . . . . . . . . . . . . . . . . . . . . . . . . . . . . . . . . . . . . . . . .
. . . . . . . . . . . . . . . . . . . . . . . . . . . . . . . . . . . . . . . . . . . . . . . . . . . . . . . . . . . . . . . . . . . . . . . . . . . . . . . . . . . . . . . . . . . . . . . . . . . . . . . . . . . . . . . . . . . . . . . . . . . . . . . . . . . . . . . . . . . . . . . . . . . . . . . . . . . . . . . . . . . . . . . . . . . . .
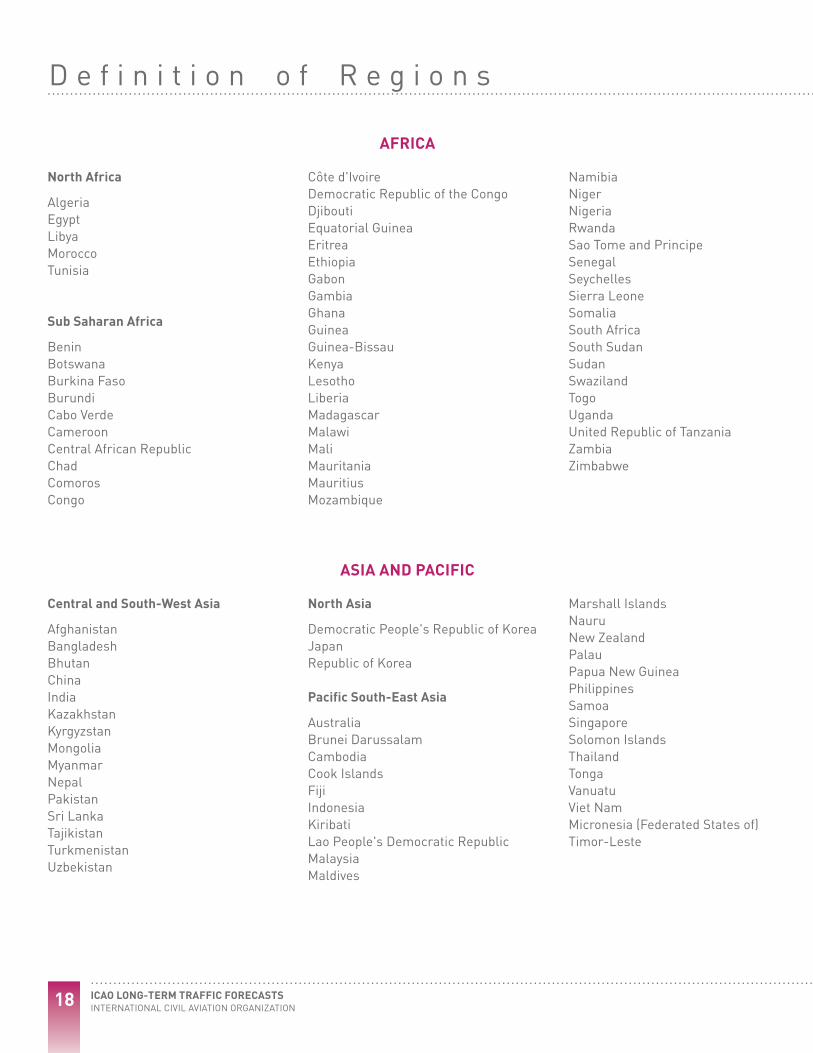
North Africa
Algeria Egypt Libya Morocco Tunisia
Sub Saharan Africa
BeninBotswanaBurkina FasoBurundiCabo VerdeCameroonCentral African RepublicChadComorosCongo
Côte d'IvoireDemocratic Republic of the CongoDjiboutiEquatorial GuineaEritreaEthiopiaGabonGambiaGhanaGuineaGuinea-BissauKenyaLesothoLiberiaMadagascar Malawi Mali Mauritania Mauritius Mozambique
Namibia Niger Nigeria Rwanda Sao Tome and Principe Senegal Seychelles Sierra Leone Somalia South Africa South Sudan Sudan Swaziland Togo Uganda United Republic of Tanzania Zambia Zimbabwe
AFRICA
Central and South-West Asia
AfghanistanBangladeshBhutanChinaIndiaKazakhstanKyrgyzstanMongoliaMyanmarNepalPakistanSri LankaTajikistanTurkmenistanUzbekistan
North Asia
Democratic People's Republic of KoreaJapanRepublic of Korea
Pacific South-East Asia
AustraliaBrunei DarussalamCambodiaCook IslandsFijiIndonesiaKiribatiLao People's Democratic RepublicMalaysiaMaldives
Marshall IslandsNauruNew ZealandPalauPapua New GuineaPhilippinesSamoaSingaporeSolomon IslandsThailandTongaVanuatuViet NamMicronesia (Federated States of)Timor-Leste
ASIA AND PACIFIC
D e f i n i t i o n o f R e g i o n s

ICAO LONG-TERM TRAFFIC FORECASTSINTERNATIONAL CIVIL AVIATION ORGANIZATION 19
. . . . . . . . . . . . . . . . . . . . . . . . . . . . . . . . . . . . . . . . . . . . . . . . . . . . . . . . . . . . . . . . . . . . . . . . . . . . . . . . . . . . . . . . . . . . . . . . . . . . . . . . . . . . . . . . . . . . . . . . . . . . . . . . . . . . . . . . . . . . . . . . . . . . . . . . . . . . . . . . . . . . .
. . . . . . . . . . . . . . . . . . . . . . . . . . . . . . . . . . . . . . . . . . . . . . . . . . . . . . . . . . . . . . . . . . . . . . . . . . . . . . . . . . . . . . . . . . . . . . . . . . . . . . . . . . . . . . . . . . . . . . . . . . . . . . . . . . . . . . . . . . . . . . . . . . . . . . . . . . . . . . . . . . . . . . . . . . . . .
AlbaniaAndorraArmeniaAustriaAzerbaijanBelarusBelgiumBosnia and HerzegovinaBulgariaCroatiaCyprusCzech RepublicDenmarkEstoniaFinlandFrance
GeorgiaGermanyGreeceHungaryIcelandIrelandItalyLatviaLithuaniaLuxembourgMaltaMonacoMontenegroNetherlandsNorwayPoland
PortugalRepublic of MoldovaRomaniaRussian FederationSan MarinoSerbiaSlovakiaSloveniaSpainSwedenSwitzerlandThe former Yugoslav Republic of MacedoniaTurkeyUkraineUnited Kingdom
EUROPE
Central America/ Caribbean
Antigua and BarbudaBahamasBarbadosBelizeCosta RicaCubaDominican RepublicEl SalvadorGrenadaGuatemalaHaiti
HondurasJamaicaMexicoNicaraguaPanamaSaint Kitts and NevisSaint LuciaSaint Vincent and the GrenadinesTrinidad and Tobago
South America
ArgentinaBolivia (Plurinational State of)BrazilChileColombiaEcuadorGuyanaParaguayPeruSurinameUruguayVenezuela (Bolivarian Republic of)
LATIN AMERICA AND THE CARIBBEAN
BahrainIran (Islamic Republic of)IraqIsrael
JordanKuwaitLebanonOman
QatarSaudi ArabiaSyrian Arab RepublicUnited Arab EmiratesYemen
MIDDLE EAST
Canada United States
NORTH AMERICA
ICAO LONG-TERM TRAFFIC FORECASTSINTERNATIONAL CIVIL AVIATION ORGANIZATION20. . . . . . . . . . . . . . . . . . . . . . . . . . . . . . . . . . . . . . . . . . . . . . . . . . . . . . . . . . . . . . . . . . . . . . . . . . . . . . . . . . . . . . . . . . . . . . . . . . . . . . . . . . . . . . . . . . . . . . . . . . . . . . . . . . . . . . . . . . . . . . . . . . . . . . . . . . . . . . . . . . .
. . . . . . . . . . . . . . . . . . . . . . . . . . . . . . . . . . . . . . . . . . . . . . . . . . . . . . . . . . . . . . . . . . . . . . . . . . . . . . . . . . . . . . . . . . . . . . . . . . . . . . . . . . . . . . . . . . . . . . . . . . . . . . . . . . . . . . . . . . . . . . . . . . . . . . . . . . . . . . . . . . . . . . . . . . . . .
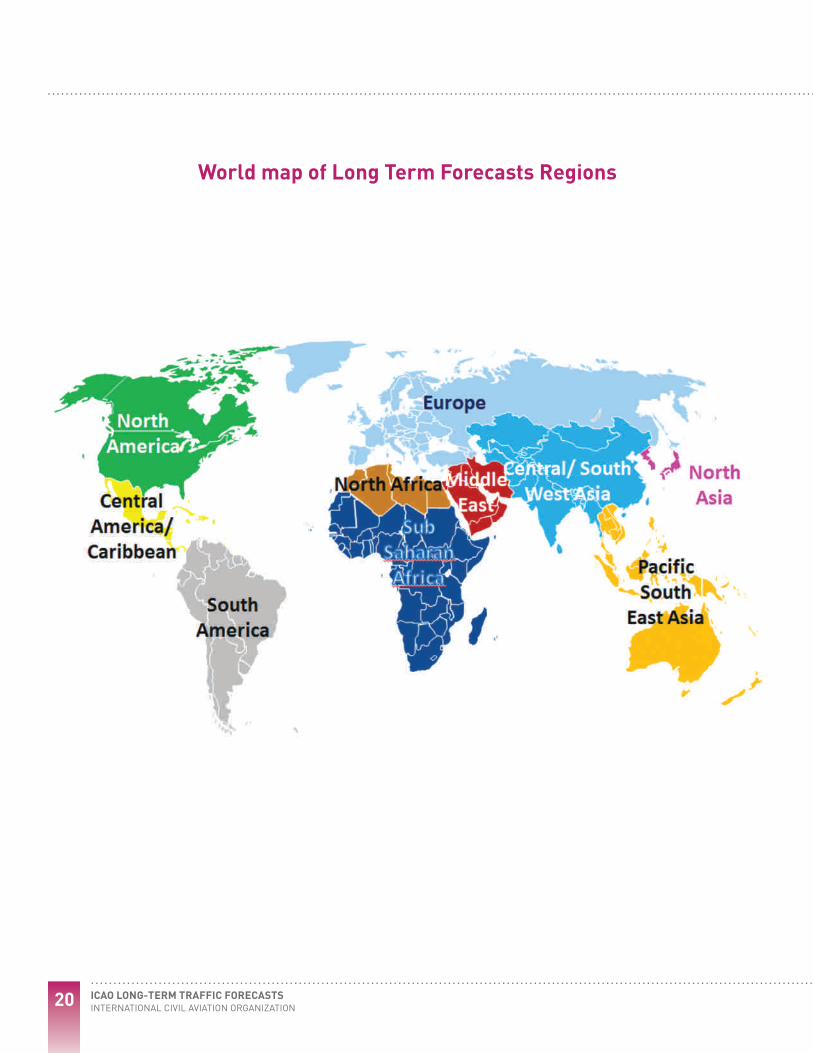
World map of Long Term Forecasts Regions

ICAO LONG-TERM TRAFFIC FORECASTSINTERNATIONAL CIVIL AVIATION ORGANIZATION 21
. . . . . . . . . . . . . . . . . . . . . . . . . . . . . . . . . . . . . . . . . . . . . . . . . . . . . . . . . . . . . . . . . . . . . . . . . . . . . . . . . . . . . . . . . . . . . . . . . . . . . . . . . . . . . . . . . . . . . . . . . . . . . . . . . . . . . . . . . . . . . . . . . . . . . . . . . . . . . . . . . . . . .
. . . . . . . . . . . . . . . . . . . . . . . . . . . . . . . . . . . . . . . . . . . . . . . . . . . . . . . . . . . . . . . . . . . . . . . . . . . . . . . . . . . . . . . . . . . . . . . . . . . . . . . . . . . . . . . . . . . . . . . . . . . . . . . . . . . . . . . . . . . . . . . . . . . . . . . . . . . . . . . . . . . . . . . . . . . . .
Summary of Passenger Traffic Forecasts by Route Group
Africa Domestic 4.6% 4.5% 4.3%Africa & Middle East - Central America/Caribbean 4.5% 4.4% 4.3%Africa & Middle East - South America 3.1% 3.8% 4.2%Africa - Asia/Pacific 6.6% 6.1% 5.8%Africa - Middle East 4.5% 4.9% 4.7%Africa - North America 3.3% 3.1% 3.1%Central America/Caribbean Domestic 4.0% 4.2% 4.2%Central America/Caribbean - Europe 3.1% 3.2% 2.9%Central America/Caribbean - North America 4.2% 4.0% 3.7%Central America/Caribbean - South America 2.8% 3.8% 4.0%Central South West Asia - North Asia 9.1% 8.4% 7.7%Central South West Asia - Pacific South East Asia 8.9% 7.9% 7.4%Central South West Asia Domestic 10.3% 8.8% 7.6%Central South West Asia - Europe 5.5% 5.2% 4.7%Central South West Asia - Middle East 8.2% 8.6% 8.2%Central South West Asia - North America 7.3% 6.3% 5.5%Europe Domestic 2.5% 2.5% 2.5%Europe - Middle East 3.4% 3.1% 2.9%Europe - North Africa 3.2% 3.3% 3.3%Europe - North America 2.9% 2.8% 2.7%Europe - North Asia 2.3% 2.3% 2.2%Europe - Pacific South East Asia 3.6% 3.8% 3.6%Europe - South America 2.8% 3.0% 2.9%Europe - Sub Saharan Africa 2.0% 2.1% 2.0%Intra Africa 4.5% 4.5% 4.3%Intra Central America/Caribbean 4.1% 4.2% 4.2%Intra Central & South West Asia 10.0% 8.7% 7.7%Intra Europe 2.5% 2.5% 2.5%Intra Middle East 4.7% 4.7% 4.4%Intra North America 3.3% 3.0% 2.9%Intra North Asia 1.7% 1.6% 1.4%Intra Pacific South East Asia 5.4% 5.3% 5.1%Intra South America 2.2% 3.2% 3.5%Latin America/Caribbean - Central Southwest Asia 8.0% 7.7% 6.7%Latin America/Caribbean - North Asia & Pacific South East Asia 2.6% 2.9% 2.7%Middle East Domestic 4.7% 4.7% 4.4%Middle East - North America 4.4% 3.6% 3.4%Middle East - North Asia & Pacific South East Asia 4.1% 3.7% 3.5%North America Domestic 3.3% 3.0% 2.9%North America - North Asia 2.8% 2.6% 2.5%North America - Pacific South East Asia 4.4% 4.3% 4.1%North America - South America 3.8% 3.7% 3.5%North Asia Domestic 1.7% 1.6% 1.4%North Asia - Pacific South East Asia 3.7% 3.8% 3.6%Pacific South East Asia Domestic 5.4% 5.3% 5.1%South America Domestic 2.2% 3.2% 3.5%
World Total 4.7% 4.6% 4.5%
Region / Region-pair
Passenger traffic results in terms of RPKs
10 Year(2012-2022)
30 Year(2012-2042)
CAGR*20 Year
(2012-2032)
*CAGR: Compound Annual Growth Rate

ICAO LONG-TERM TRAFFIC FORECASTSINTERNATIONAL CIVIL AVIATION ORGANIZATION22. . . . . . . . . . . . . . . . . . . . . . . . . . . . . . . . . . . . . . . . . . . . . . . . . . . . . . . . . . . . . . . . . . . . . . . . . . . . . . . . . . . . . . . . . . . . . . . . . . . . . . . . . . . . . . . . . . . . . . . . . . . . . . . . . . . . . . . . . . . . . . . . . . . . . . . . . . . . . . . . . . .
. . . . . . . . . . . . . . . . . . . . . . . . . . . . . . . . . . . . . . . . . . . . . . . . . . . . . . . . . . . . . . . . . . . . . . . . . . . . . . . . . . . . . . . . . . . . . . . . . . . . . . . . . . . . . . . . . . . . . . . . . . . . . . . . . . . . . . . . . . . . . . . . . . . . . . . . . . . . . . . . . . . . . . . . . . . . .
Summary of Total Cargo Traffic Forecasts by Region of Airline Registration
Europe Total 2.9% 2.6% 2.4%
International 2.9% 2.6% 2.4%
Domestic 0.2% 0.8% 1.0%
Africa Total 1.6% 2.1% 2.2%
International 1.6% 2.1% 2.2%
Domestic 0.3% 0.1% 0.1%
Middle East Total 6.6% 7.1% 6.9%
International 6.6% 7.1% 6.9%
Domestic 1.4% 0.7% 0.5%
Asia and Pacific Total 5.7% 5.1% 4.7%
International 5.2% 4.7% 4.3%
Domestic 8.7% 7.8% 7.0%
North America Total 2.7% 2.5% 2.6%
International 3.7% 3.5% 3.4%
Domestic 0.8% 0.7% 0.6%
Latin America and the Caribbean Total 3.1% 2.9% 2.8%
International 3.4% 3.1% 3.0%
Domestic 2.0% 1.7% 1.6%
WORLD Total scheduled 4.4% 4.3% 4.2%
International 4.5% 4.4% 4.2%
Domestic 3.9% 4.0% 4.0%
Region / Region-pair
(Scheduled Services) Cargo traffic results in terms of FTKs
10 Year(2012-2022)
30 Year(2012-2042)
CAGR*20 Year
(2012-2032)
ICAO LONG-TERM TRAFFIC FORECASTSINTERNATIONAL CIVIL AVIATION ORGANIZATION 23
. . . . . . . . . . . . . . . . . . . . . . . . . . . . . . . . . . . . . . . . . . . . . . . . . . . . . . . . . . . . . . . . . . . . . . . . . . . . . . . . . . . . . . . . . . . . . . . . . . . . . . . . . . . . . . . . . . . . . . . . . . . . . . . . . . . . . . . . . . . . . . . . . . . . . . . . . . . . . . . . . . . . .
. . . . . . . . . . . . . . . . . . . . . . . . . . . . . . . . . . . . . . . . . . . . . . . . . . . . . . . . . . . . . . . . . . . . . . . . . . . . . . . . . . . . . . . . . . . . . . . . . . . . . . . . . . . . . . . . . . . . . . . . . . . . . . . . . . . . . . . . . . . . . . . . . . . . . . . . . . . . . . . . . . . . . . . . . . . . .
Total traffic: history and forecasts


