ibisworld industry report 31212 breweries in the usbreweries+in... breweries in the us february 2012...
TRANSCRIPT

WWW.IBISWORLD.COM� Breweries�in�the�US February 2012 1
IBISWorld Industry Report 31212Breweries in the USFebruary�2012� Agata�Kaczanowska
Strong brew: Craft beers and microbrews will draw drinkers, as will high-quality imports
2� About�this�Industry2 Industry Definition
2 Main Activities
2 Similar Industries
2 Additional Resources
3� Industry�at�a�Glance
4� Industry�Performance4 Executive Summary
4 Key External Drivers
6 Current Performance
8 Industry Outlook
10 Industry Life Cycle
12� Products�&�Markets12 Supply Chain
12 Products & Services
13 Demand Determinants
14 Major Markets
15 International Trade
17 Business Locations
19� Competitive�Landscape19 Market Share Concentration
19 Key Success Factors
19 Cost Structure Benchmarks
21 Basis of Competition
22 Barriers to Entry
23 Industry Globalization
24� Major�Companies24 Anheuser-Busch InBev
25 MillerCoors LLC
27� Operating�Conditions27 Capital Intensity
28 Technology & Systems
28 Revenue Volatility
29 Regulation & Policy
30 Industry Assistance
31� Key�Statistics31 Industry Data
31 Annual Change
31 Key Ratios
32� Jargon�&�Glossary
www.ibisworld.com��|��1-800-330-3772��| ��[email protected]
WWW.IBISWORLD.COM� Breweries�in�the�US February 2012 2
The Breweries industry primarily produces alcoholic beverages using malted barley and hops.
The�primary�activities�of�this�industry�are
Beer production (alcoholic and non-alcoholic)
Ale production
Malt liquor production
31213 Wineries�in�the�USWinemakers either grow their own grapes or purchase them from vineyards to mix with other ingredients and produce wines and brandies. These are then packaged in bottles or casks and sold.
31214 Distilleries�in�the�USDistillers purchase a variety of ingredients, such as grains and sugar, and manufacture them into spirits (i.e. not beer or wine). These spirits are then bottled and sold.
Industry�Definition
Main�Activities�
Similar�Industries
Additional�Resources
About�this�Industry
For�additional�information�on�this�industry
www.ttb.gov�Alcohol and Tobacco Tax and Trade Bureau
www.brewersassociation.org�Brewers Association
www.beerinstitute.org�The Beer Institute
www.ers.usda.gov�USDA Economic Research Service
The�major�products�and�services�in�this�industry�are
Barrels and kegs of beer
Bottles of beer
Cans of beer – 12 ounces
Cans of beer – not 12 ounces
Other malt beverages and brewing products
�IBISWorld writes over 700 US industry reports, which are updated up to four times a year. To see all reports, go to www.ibisworld.com

WWW.IBISWORLD.COM� Breweries�in�the�US February 2012 3
% c
hang
e
2
−4
−3
−2
−1
0
1
1705 07 09 11 13 15Year
Demand from beer wholesaling
SOURCE: WWW.IBISWORLD.COM
% c
hang
e
15
−10
−5
0
5
10
1804 06 08 10 12 14 16Year
Revenue Employment
Revenue vs. employment growth
Products and services segmentation (2012)
45.8%Cans of beer – 12 ounces
38.3%Bottles of beer
9.1%Cans of beer – not 12 ounces
5.2%Barrels and kegs of beer
1.6%Other malt beverages and brewing products
SOURCE: WWW.IBISWORLD.COM
Key�Statistics�Snapshot
Industry�at�a�GlanceBreweries�in�2012
Industry�Structure Life Cycle Stage Mature
Revenue Volatility Medium
Capital Intensity Medium
Industry Assistance Low
Concentration Level High
Regulation Level Heavy
Technology Change Low
Barriers to Entry High
Industry Globalization Medium
Competition Level Medium
Revenue
$24.5bnProfit
$2.9bnExports
$2.8bnBusinesses
1,856
Annual�Growth�12-17
1.0%Annual�Growth�07-12
1.6%
Key�External�DriversDemand�from�beer�wholesalingDemand�from�bars�and�nightclubsDemand�from�beer,�wine�and�liquor�storesWorld�price�of�wheatPer�capita�alcohol�consumptionExcise�tax�on�beer
Market�ShareAnheuser-Busch InBev 48.3%
MillerCoors LLC 35.9%
p. 24
p. 4
FOR ADDITIONAL STATISTICS AND TIME SERIES SEE THE APPENDIX ON PAGE 31
SOURCE: WWW.IBISWORLD.COM

WWW.IBISWORLD.COM� Breweries�in�the�US February 2012 4
Key�External�Drivers Demand from beer wholesalingWholesalers are a crucial link in the supply chain. Therefore, manufacturers need to carefully plan distribution to influence the level of product promotion within liquor wholesaling outlets in order to maximize market share. This driver is expected to increase slowly during 2012, presenting a potential opportunity for the industry.
Demand from bars and nightclubsBecause beer consumption often occurs at bars, this industry is a crucial link in the marketing channel. As consumers’ discretionary income increases, they have more opportunities to go to bars and nightclubs. Therefore, beer manufacturers can benefit from carefully planned distribution and even ownership of such establishments to
Executive�Summary
The industry benefitted from consumers substituting cheaper beer for other alcoholic beverages during an extended period of low, postrecession disposable income. As a result, over the five years to 2012, industry revenue is expected to increase at an average annual rate of 1.6%. However, in the long term, breweries face increasing competition from other beverages, namely wines and spirits. As consumers expand their tastes for such alternatives, demand for beer is dropping. IBISWorld estimates a 0.2% decrease in 2012 industry revenue to
$24.5 billion as consumers, once again, begin drinking other beverages. Profit, however, increased over the period to an estimated 11.8% of revenue.
Ingredient price increases due to shortages in hops and grains and the establishment of specialty breweries were the chief causes of fluctuations in the average industry profit margin. Significant merger activity among the largest players also squeezed profit margins. Two mergers in 2008 combined the top US brewing companies in the US, Anheuser-Busch and Coors Brewing Company, with two international
behemoths, InBev and SABMiller, respectively. The new firms that resulted from the mergers are Anheuser-Busch InBev and MillerCoors, which control 84.2% of the US market share.
Trade has heavily influenced industry revenue; imports declined and exports benefitted from a weak dollar. Despite declines, imports will account for an estimated 14.6% share of domestic demand in 2012, or more than $3.7 billion. Meanwhile, exports as a source of revenue for American brewers increased at a 32.1% annualized rate, from 3.1% of revenue in 2007 to an expected 11.5% in 2012. Imports and exports are anticipated to continue increasing as a share of industry revenue, especially as consumer sentiment improves over the five years to 2017.
IBISWorld projects that industry revenue will grow at an average annual rate of 1.0% over the next five years, reaching $25.7 billion in 2017. Much of this increase will occur in the craft and premium beer segments, but a contraction in total industry sales by volume is expected to offset the growth. Because the market for specialty brews is saturated, a slowdown of new businesses entering the industry is also expected to benefit the industry’s bottom line. However, sales of lower-margin craft brews will maintain industry profit margin at about 11.6% of revenue in 2017.
Industry�PerformanceExecutive�Summary�� |�� Key�External�Drivers�� |�� Current�PerformanceIndustry�Outlook�� |�� Life�Cycle�Stage
� The growing popularity of high-quality premium and craft beers will hinder industry profitability

WWW.IBISWORLD.COM� Breweries�in�the�US February 2012 5
Industry�Performance
Key�External�Driverscontinued
influence the level of product promotion and availability in order to maximize market share. This driver is expected to increase during 2012.
Demand from beer, wine and liquor storesPackaged beer is often sold through retail outlets, so this industry is a crucial link in the marketing channel. Therefore, beer manufacturers need to carefully plan distribution and influence the level of product promotion within liquor outlets in order to maximize market share. This is imperative in the United States, where brand loyalty can vary by state and region. This driver is expected to decrease slowly during 2012, posing a potential threat to the industry.
World price of wheatWheat is a major input for breweries, and its price represents a good proxy for
all grain prices, which represent the dominant inputs for this industry. As the prices for grains increase, so does the cost of production, in turn decreasing profit. This driver is expected to decrease during 2012.
Per capita alcohol consumptionAlcohol consumption can affect beer sales, either positively or negatively. Consumers’ cultural and attitudinal changes often impact sales of beer. For example, many people drink only in moderation due to personal beliefs, which could reduce alcohol consumption and, therefore, total sales. This driver is expected to decrease slowly during 2012.
Excise tax on beerThe level of excise levied on beer impacts its final price and therefore affects the level of demand. This driver is expected to decrease slowly during 2012.
% c
hang
e
6
−4
−2
0
2
4
1705 07 09 11 13 15Year
Demand from beer, wine and liquor stores
SOURCE: WWW.IBISWORLD.COM
% c
hang
e
2
−4
−3
−2
−1
0
1
1705 07 09 11 13 15Year
Demand from beer wholesaling

WWW.IBISWORLD.COM� Breweries�in�the�US February 2012 6
Industry�Performance
Consumer�tastes�shift Higher demand for standard beer brands sustained revenue for breweries in the aftermath of the Great Recession. Nonetheless, beer is increasingly perceived as less healthy and exotic than wine and spirits. Substitution for premium beverages is slowing industry sales, even as consumers also show a significant interest in premium beer, including craft beer. Bulk beverage sales declined as a result of health-conscious individuals switching to high-quality products in smaller quantities despite limited disposable income.
In 2009 and 2010, the market for craft, import and some premium beers was limited due to low disposable income. However, this market rebounded
in 2011 and is expected to expand in 2012 as disposable income continues to rise and consumers begin spending on high-end products. This is expected to hamper industry revenue growth as sales of light and standard American beers decline once again.
The recession made 2008 the worst year for the industry in over a decade. Consumers cut back by drinking less and opting for packaged beer consumption in the home. Revenue was suffering even prior to 2008 because beer consumption fell. However, because disposable income remained low even after the recession, consumers continued consuming cheaper products at home, which boosted industry revenue.
Current�Performance
Increasingly knowledgeable and health-conscious consumers are trading up for higher-quality beers and other alcoholic beverages. This trend has stimulated growth in the premium and craft beer segments, but has been a detriment to high-volume sales of beer. Slowed consumer spending has helped revenue for the Breweries industry because people switched to cheap beers. As a result, revenue has grown at an average annual rate of 1.6% since 2007. However, revenue is expected to decrease 0.2% in 2012 to $24.5 billion. The decrease in 2012 is expected as higher disposable income leads consumers to switch some alcohol consumption to higher-end beverages, such as wine and spirits.
High degrees of competition and rising production costs have led to merger and acquisition activity among the largest players in this industry. In fact, just two companies, Anheuser-Bush InBev and MillerCoors, hold a massive 84.2% of the market share. On the other
end of the spectrum, craft breweries, which are smaller and target regional markets, are continuing to expand their numbers and popularity. However, their market share remains limited.
The streamlined operations of the major companies have led to increasing margins for the industry. Yet, the expansion of the craft brewery segment and the price volatility of key brewing ingredients have hindered profit margin growth. In particular, craft brews are lower margin products despite their higher-end status due to the larger costs associated with smaller production batches. Profit as a percentage of revenue slowly increased to 11.8% in 2012, compared with 8.8% in 2007.
� Competition and rising production costs have led to M&A activity among the largest players

WWW.IBISWORLD.COM� Breweries�in�the�US February 2012 7
Industry�Performance
Craft�brewing The craft brewing segment of this industry has grown consistently since the 1990s. Although its growth has since slowed, craft brewers are responsible for the 5.8% annualized rise in industry enterprises to 1,856 over the five years to 2012. Data from the Beer Institute’s
2010 Brewers Almanac (most recent data available) suggests that 98.8% of the estimated 1,678 breweries currently in operation in the United States qualify as specialty brewers. However, though they dominate the market in terms of business numbers, craft brewers are
Consolidation�and�globalization
Until 2002, most beer was produced domestically. The three major players in the industry, Anheuser-Bush, Coors Brewing Company and Miller Brewing Company, were domestically owned and together earned about three-fourths of industry revenue. Since the summer of 2002, however, a number of mergers have increased foreign ownership. First, international giant South African Breweries (SAB) acquired Miller Brewing Company to form SABMiller. Then, Molson Canada merged with Coors Brewing Company in 2005 to form Molson Coors. Three years later, these companies launched MillerCoors, a joint venture of their operations within the United States. This move brought their combined market share to 19.1%, allowing them to challenge the overwhelmingly dominant Anheuser-Busch, which also merged with foreign-owned InBev in 2008 to become the world’s largest brewery.
In addition to broadening their selection of offerings, the 2008 mergers helped each company reduce its distribution costs by pooling resources and realizing economies of scale in bargaining with suppliers. However, both Anheuser-Busch InBev and MillerCoors face the challenge of avoiding cannibalization because many of their offerings compete directly with each other. For example, Keystone is considered a direct substitute for Milwaukee’s Best (both are MillerCoors brands), as is Boddingtons for
Michelob Pale Ale (both Anheuser-Busch InBev brands).
The industry is exposed to global trends through heightened trade volumes and an increasing share of foreign ownership. Even with a weakening US dollar and consumers trading up, imports are projected to hover at 14.6% of demand in 2012, totaling $3.7 billion. However, the weakening dollar and improved international distribution channels have driven export growth, despite some setbacks caused by slowed trade when consumer spending fell during the recession. Exports in 2012 are expected to account for 11.5% of total industry revenue, or $2.8 billion, driven almost entirely by rapid growth in Mexico, Canada and China. In comparison, in 2007, imports comprised 15.3% of domestic demand while exports’ share of revenue was only 3.1% of revenue.
% c
hang
e
100
−20
0
20
40
60
80
1804 06 08 10 12 14 16Year
Revenue Exports
Revenue vs. exports
SOURCE: WWW.IBISWORLD.COM

WWW.IBISWORLD.COM� Breweries�in�the�US February 2012 8
Industry�Performance
Craft�brewingcontinued
responsible for only about 5.9% of industry revenue.
Craft brewers are not able to take advantage of mass production and do not have the ability to negotiate the larger supply contracts that come with economies of scale. Therefore, they must
charge higher prices to stay in business. Also, craft brewers are disproportionately exposed to fluctuations in the supply of inputs, which have cut into profit over the five years to 2012. This was aggravated by a shortage of hops and high, unpredictable grain prices.
Profitable�business Growth and volatility in input prices are expected to ease over the next five years after the turbulence of the past five years. Limited price competition between the major players, especially among easily substitutable brands, will result in some improvement in profitability. However, the increasing share of lower-margin craft breweries will diminish overall industry profit. Profit levels are projected to contract to 11.6% of industry revenue in 2017.
A smaller number of new entrants will significantly decrease the level of industry expenditure on brewery start-up costs, boosting the aggregate profit margin. As craft brewers create some competition, fewer companies will enter the industry compared with the past five years. Average
annual growth in the number of enterprises is projected at 3.9%, totaling 2,250 in 2017.
Excise tax increases for breweries are a possibility in the coming years as governments at all levels struggle to balance budgets. While it would adversely affect brewery profit, there is no current public discussion about enacting a nationwide increase of the excise tax on alcohol. However, some states, such as Connecticut, have proposed bills that could potentially increase the excise taxes on a state-by-state basis. In April 2011, Maryland’s General Assembly approved a 3.0% alcohol sales-tax increase. However, such actions are not expected to affect enough markets to cause significant changes in most industry operations.
Industry�Outlook
Beer is expected to attract a smaller share of the demand for alcoholic beverages over the five years to 2017 as consumers continue to switch to high-quality alcoholic beverages. Competition from substitutes like spirits and wine is anticipated to result in slow revenue increases despite robust growth in the craft and premium beer segments. Including initial growth
of 3.3% in 2013, the Breweries industry’s revenue is forecast to increase on average 1.0% per year through 2017 to $25.7 billion.
� Ongoing competition from substitute alcoholic drinks will hamper growth

WWW.IBISWORLD.COM� Breweries�in�the�US February 2012 9
Industry�Performance
International�trade The value of beer exports from the United States is forecast to increase at a much slower average rate of 19.1% per year over the next five years, compared to the 32.1% average annual growth of the prior five years. The slowdown will happen as the US dollar begins to appreciate and the most-accessible reservoirs of demand are tapped. Since the Anheuser-Busch merger with InBev, Anheuser-Busch products are expected to compete less aggressively in export markets where InBev products are often the primary competition. However, there will be some growth in export volumes of these varieties as the merged entity seeks to gain maximum value from the Anheuser-Busch brand through its larger, combined distribution network.
The appreciation of the US dollar will be the main influence on both the
demand for industry exports and the ability of imports to compete with local brewers. Imports are forecast to resume growth, increasing at an average annual rate of 2.5% over the five years to 2017 as consumers continue to shift to what they perceive as high-end beer, including more expensive foreign imports. However, this rapid influx of imports is also a likely reflection of some facilities moving to Canada and Mexico, whose proximity to the United States already makes them two of the main importers of US beer.
Big�brands�and�craft IBISWorld expects that the development of brand names over the next five years will be critical to players’ success, both in competition among brewers and competition against substitutes like wine and spirits. Such development will be an advantage to larger players that run more cost-effective promotional campaigns. However, younger beer drinkers (aged 21 to 24) will increasingly experiment with and seek out unusual flavors as part of their drinking experience, which will provide opportunities for
craft and microbreweries to expand their market reach.
Employment will be driven by the growth of existing craft and microbreweries, but the two major players will continue to lay off workers and streamline their business models. As a result, the number of industry workers is anticipated to increase at an average annual rate of 1.3% to about 30,698 in 2017. The average wage is also expected to grow due to the retention of more highly skilled and paid staff, such as those in marketing and management.
� Imports will grow rapidly as more consumers shift to higher-end foreign beers

WWW.IBISWORLD.COM� Breweries�in�the�US February 2012 10
Industry�PerformancePer capita consumption of mainstream American beer is declining as preferences shift to premium drinks
Growth has occurred in the craft brewing segment
Technological change has not altered industry operations significantly in the past five years
Life�Cycle�Stage
SOURCE: WWW.IBISWORLD.COM
30
25
20
15
10
5
0
–5
–10–10 100 20–5 155 25 30
%�G
row
th�o
f�pro
fi�t/G
DP
%�Growth�of�establishments
DeclineCrash or Grow?
Potential�Hidden�GemsFuture Industries
Quality�GrowthHigh growth in economic importance; weaker companies close down; developed technology and markets
Time�WastersHobby Industries
MaturityCompany consolidation;level of economic importance stable
Shake-out
Shake-out
Quantity�GrowthMany new companies; minor growth in economic importance; substantial technology change
Key�Features�of�a�Mature�Industry
Revenue grows at same pace as economyCompany numbers stabilize; M&A stageEstablished technology & processesTotal market acceptance of product & brandRationalization of low margin products & brands
Wineries
Beer�WholesalingDistilleries
Flour�Milling
Breweries

WWW.IBISWORLD.COM� Breweries�in�the�US February 2012 11
Industry�Performance
Industry�Life�Cycle The growth of craft and premium beer has contributed to declining demand for mainstream industry products. While consumers are continuing to consume beer, even at a higher price point, they consume less of it because craft and premium beers are fuller in body and flavor than the traditional light lager of major players. Sales by volume are in decline as consumers shift from gulping low-quality beer to sipping finer suds. The premium product segments that are performing well are also more profitable for large brewers; demand for craft brews from smaller breweries is also rising, though smaller breweries earn much lower profit due to lower production volumes. Consequently, industry value added (IVA), which measures the industry’s contribution to the economy, is expected to increase slowly at an annualized rate of 2.5% over the 10 years to 2017. Meanwhile GDP is anticipated to increase at an average of 1.9% per year during this time. As a result of a growing craft brew segment, the number of companies and their locations will increase at annualized rates of 4.9% and 4.8%, respectively, over the 10 years to 2017.
Industry revenue increased at an average annual rate of 1.6% over the five years to 2012. Revenue rebounded over the past five years due to consumers switching to less expensive beverages during periods of low disposable income, which benefitted breweries. During the recession, consumers bought more beer to drink at home instead of drinking at establishments that charge more for regular beer, cocktails and wine. Revenue is forecast to grow at a sluggish annualized rate of 1.0% over the next five years, much slower than GDP growth during this time. A shift in consumer preference toward premium products and substitute beverages like wine or spirits is expected to continue in the next five years.
Due to two mergers, the majority of Breweries industry market share was consolidated into just two companies: MillerCoors and Anheuser-Busch InBev. These companies were formed through the mergers of existing beer giants SABMiller and Molson Coors Brewing Company and Anheuser-Busch and international beverage behemoth InBev. The resulting companies dominate the industry and are responsible for about 84.2% of all beer production within the United States.
�This industry is Mature

WWW.IBISWORLD.COM� Breweries�in�the�US February 2012 12
Products�&�Services
Canned beer is most often sold through retail outlets as a cheaper alternative to bottles, while bottles are sold both in
retail outlets and at drinking establishments. Barrels and kegs, on the other hand, are sold almost exclusively
�Products�&�MarketsSupply�Chain�� |�� Products�&�Services�� |�� Demand�DeterminantsMajor�Markets�� |�� International�Trade�� |�� Business�Locations
KEY�BUYING�INDUSTRIES
42481� Beer�Wholesaling�in�the�US�Distributors are an essential link in the market channel for breweries. Because of the three-tiered regulatory system in place for alcoholic beverages in most states, beer manufacturers are not permitted to sell beer directly to retailers or consumers.
KEY�SELLING�INDUSTRIES
11117� Wheat,�Barley�&�Sorghum�Farming�in�the�US�Malt, a key ingredient in beer production, is made from grains like barley and hops.
31121� Flour�Milling�in�the�US�Brewers purchase malt from this industry. Malt comes from barley or other grains that have been germinated by soaking them in water and then kiln-drying them.
31131� Sugar�Processing�in�the�US�Sugar is a key component in making beer.
32192� Wood�Pallets�&�Skids�Production�in�the�US�Wooden pallets are used to transport the final product to end users, such as retailers, bars and clubs.
32221� Cardboard�Box�&�Container�Manufacturing�in�the�US�Paperboard containers are used to package bottles and cans of beer for the purpose of transportation.
32311� Printing�in�the�US�Brewers require printed labels on their products, a key success factor in marketing.
32721� Glass�Product�Manufacturing�in�the�US�Glass is required for packaging bottled beer.
42451� Corn,�Wheat�&�Soybean�Wholesaling�in�the�US�Barley and hops are purchased from grain wholesalers for making malt beverages.
Supply�Chain
Products and services segmentation (2012)
Total $24.5bn
45.8%Cans of beer –
12 ounces
38.3%Bottles of beer
9.1%Cans of beer – not 12 ounces
5.2%Barrels and kegs of beer
1.6%Other malt beverages and brewing products
SOURCE: WWW.IBISWORLD.COM

WWW.IBISWORLD.COM� Breweries�in�the�US February 2012 13
Products�&�Markets
DemandDeterminants
The major demand determinant for the Breweries industry is quality relative to substitutes, which include other brands of beer, other alcoholic beverages and some nonalcoholic beverages; changing preferences can influence the demand for these substitutes. Consumers often substitute between alcoholic beverage categories, and wine and spirit consumption has increased moderately in recent years. As consumers educate themselves about various beverages and explore the variety of beers available to them, the industry is forecast to benefit from growth in demand for niche and premium products.
Demand for beer is also influenced by marketing activities, including the level of advertising and sales promotion. New product introductions can also help increase demand for beer. Beer companies engage in these marketing activities to drive demand for their products.
Government intervention plays a role in demand via regulations, which include a minimum age for alcohol buyers, set trading hours for retailers and penalties for driving drunk. These regulations have not changed drastically over the five years to 2012 and are not anticipated to alter the demand for industry products in coming years.
Excise and other taxes substantially influence prices. Many consumers typically compare products within a certain price point, depending on the quality they desire. For instance, imported beers can be considered a substitute for domestically produced beers. The price of these imports can be affected by exchange rates, which have been particularly volatile due to uncertainties in the global economy.
Demand for alcoholic beverages, including beer, is higher among households that have higher disposable income. IBISWorld estimates that households earning the top 20.0% of income currently spend about 60.0% more on beer from retailers than the average household and 80.0% more on beer at licensed drinking establishments. Even so, general growth in income and rising living standards have contributed to a decline in per capita consumption of beer as people opt for wine and spirits. The recession partially reversed this trend, but was not enough to counter the drop in spending by most households.
The age profile of the population is another determinant of demand. Per capita consumption of beer is higher among 21 to 35 year olds than other
Products�&�Servicescontinued
to bars for on-tap service. Due to its price point, canned beer has increased as a share of industry revenue over the five years to 2012. Meanwhile, barrel and keg share declined because consumers spent less time drinking in establishments and saved money by purchasing beer to drink at home. The bottled beer segment did not change significantly because, although it is more expensive then canned beer, bottles can be bought at retail outlets for a fraction of the on-premise price. Additionally,
some consumers prefer bottled beer because it stays cold longer than its canned counterpart. As consumer spending picks up over the five years to 2017, barrels and kegs are anticipated to increase as a share of revenue, while canned products decline.
A small proportion of production, about 1.6%, is composed of malt and other beverages, such as malted milk. Demand from this product segment is usually steady and has little impact on producers within this industry.

WWW.IBISWORLD.COM� Breweries�in�the�US February 2012 14
Products�&�Markets
Major�Markets
As a share of the US population, younger people are a lot more likely to drink beer than those older than 50. The largest growth segment for beer over the five years to 2012 has been the youngest portion of the population of drinking age: those aged 21 to 34. While all consumers cut spending, college students and young professionals likely saved by switching to beer from wine or spirits. This group is also most likely to purchase beer for minors and, thus, may be consuming an average amount of beer once such purchases are taken into account. At the same time, however, this group (including minors) is most likely to explore a variety of premium and craft beers. Consumers aged 35 to 54 also switched somewhat to drinking beer, but
were much more likely to tighten their budgets altogether due to financial strain throughout the recession. Over the five years to 2017, the younger demographic will continue to be the main growth segment, with older consumers spending their money on other kinds of beverages.
Although there are slightly more women than men in the US population, about 58.0% of beer drinkers are men compared to 42.0% women. The share of women beer drinkers has increased gradually over the five years to 2012 and is anticipated to continue over the five years to 2017, spurred by the increased marketing and availability of certain beers, such as Blue Moon, and flavored malt beverages, such as Smirnoff Ice, which appeal to the female demographic.
DemandDeterminantscontinued
age groups (see Major Markets section). The proportion of the population within this age range and
its increasing disposable income will have a positive effect on demand for beer over the five years to 2017.
Major market segmentation (2012)
Total $24.5bn
23.2%Consumers aged
35 to 44
9.5%Consumers aged
21 to 24
22.8%Consumers aged
25 to 3421.8%
Consumers aged 45 to 54
13%Consumers aged
55 to 64
9.7%Consumers aged
65 and older
SOURCE: WWW.IBISWORLD.COM
WWW.IBISWORLD.COM� Breweries�in�the�US February 2012 15
Products�&�Markets
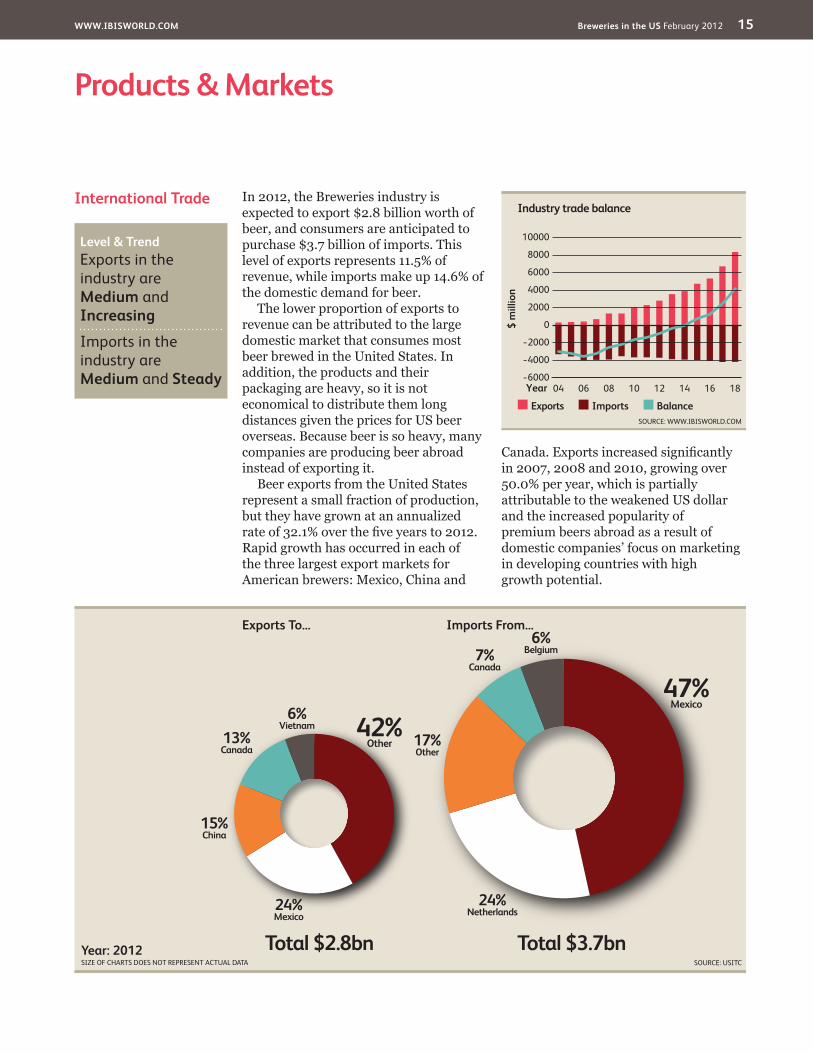
International�Trade In 2012, the Breweries industry is expected to export $2.8 billion worth of beer, and consumers are anticipated to purchase $3.7 billion of imports. This level of exports represents 11.5% of revenue, while imports make up 14.6% of the domestic demand for beer.
The lower proportion of exports to revenue can be attributed to the large domestic market that consumes most beer brewed in the United States. In addition, the products and their packaging are heavy, so it is not economical to distribute them long distances given the prices for US beer overseas. Because beer is so heavy, many companies are producing beer abroad instead of exporting it.
Beer exports from the United States represent a small fraction of production, but they have grown at an annualized rate of 32.1% over the five years to 2012. Rapid growth has occurred in each of the three largest export markets for American brewers: Mexico, China and
Canada. Exports increased significantly in 2007, 2008 and 2010, growing over 50.0% per year, which is partially attributable to the weakened US dollar and the increased popularity of premium beers abroad as a result of domestic companies’ focus on marketing in developing countries with high growth potential.
Imports From...
Total $3.7bn
47%Mexico
24%Netherlands
17%Other
7%Canada
6%Belgium
Exports To...
Total $2.8bn
42%Other
24%Mexico
15%China
13%Canada
6%Vietnam
Year: 2012SIZE OF CHARTS DOES NOT REPRESENT ACTUAL DATA SOURCE: USITC
$ m
illio
n
10000
−6000
−4000
−2000
0
2000
4000
6000
8000
1804 06 08 10 12 14 16Year
Exports Imports Balance
Industry trade balance
SOURCE: WWW.IBISWORLD.COM
Level�&�Trend��Exports in the industry are Medium and Increasing
�Imports in the industry are Medium and Steady

WWW.IBISWORLD.COM� Breweries�in�the�US February 2012 16
Products�&�Markets
International�Tradecontinued
Most imports are from Mexico, the Netherlands and Canada, which are countries to where other foreign brewers have outsourced production or are headquartered (such as Heineken in the Netherlands). Historically, these imports have grown considerably due to aggressive marketing by foreign brewers, such as the prominent Dos Equis TV commercials featuring “the most
interesting man in the world.” Along with the increasing consumer preference for exotic beers, these marketing campaigns are aimed to stimulate spending on imported beers and are anticipated to continue to do so, especially as consumer income rises. Nonetheless consumers are showing a preference for craft brews that not only support their local economy but also feature a more unique taste.

WWW.IBISWORLD.COM� Breweries�in�the�US February 2012 17
�Products�&�Markets
Business�Locations�2012
MO1.6
West
West
West
Rocky Mountains Plains
Southwest
Southeast
New England
Great Lakes
VT1.6
MA3.1
RI0.3
NJ0.5
DE0.3
NH1.0
CT0.8
MD1.0
DC0.3
1
5
3
7
2
6
4
8 9
Additional�States�(as marked on map)
AZ1.3
CA13.4
NV0.8
OR4.7
WA6.0
MT5.0
NE0.5
MN1.0
IA0.5
OH2.1 VA
1.6
FL2.4
KS0.3
CO4.2
UT1.0
ID1.1
TX2.9
OK0.5
NC1.8
AK2.1
WY0.3
TN0.8
KY0.5
GA1.9
IL1.3
ME2.4
ND0.0
WI6.0 MI
5.5 PA5.5
WV0.3
SD0.0
NM1.0
AR0.5
MS0.3
AL0.0
SC0.5
LA1.6
HI1.1
IN1.0
NY5.8 5
67
8
321
4
9
SOURCE: WWW.IBISWORLD.COM
Mid- Atlantic
Industry�establishments�(%)�
� Less�than�3%� 3%�to�less�than�10%� 10%�to�less�than�20%� 20%�or�more

WWW.IBISWORLD.COM� Breweries�in�the�US February 2012 18
�Products�&�Markets
Business�Locations The geographic spread of this industry is characterized by the volume of production and the number of breweries in a particular state. In general, volumes produced in particular states correlate with the population of the state. This is likely the result of producers locating their production facilities closer to major centers of the population to minimize costs of transportation. Another influence on the geographic spread is the climate of the region. Warm climates are more conducive to the consumption of beer, so there is likely to be greater demand for beer in regions along the southern coasts or the Mexican border. Other factors that affect geographic spread include access to raw materials, ease of access to export markets and taxes levied at the state level.
IBISWorld estimates that the Southeast accounts for the greatest proportion of production at 25.1%. This is attributable to the area being a large population center. Despite Anheuser-Busch breweries in Virginia and Georgia and a large MillerCoors brewery in Georgia as well, the region accounts for only 12.2% of establishments
The Great Lakes region accounts for the second-highest amount of beer produced at 16.6%. Production is greatest in Ohio, where Anheuser-Busch InBev and MillerCoors each have a brewery. Furthermore, many small breweries and brewpubs have established themselves in Cleveland to serve the local market.
The West is notable because it houses 28.1% of breweries, while accounting for only 13.5% of production. Most breweries are concentrated in California, which has the largest number of breweries of any state in the country at 304, the majority of which are brewpubs
or microbreweries. The region is a popular area for beer drinking due to its concentration of live entertainment events, such as awards shows and music festivals. Hence, many manufacturing establishments have opened there in recent years.
The Rocky Mountains account for an estimated 12.4% of beer production, while containing only 3.4% of the US population. A MillerCoors brewery in Golden, CO, contributes to the high level of production from this state, placing it second behind California.
The hot, dry climate of the Southwest is conducive to beer consumption. Despite this, the proportion of beer produced here is roughly in line with the population. Production in the Plains is also roughly in line with the population of the region. The Mid-Atlantic and New England regions have low levels of production relative to their population, possibly due to their cooler climates.
%
30
0
10
20
Sout
hwes
t
Wes
t
Gre
at L
akes
Mid
-Atla
ntic
New
Eng
land
Plai
ns
Rock
y M
ount
ains
Sout
heas
t
EstablishmentsPopulation
Establishments vs. population
SOURCE: WWW.IBISWORLD.COM

WWW.IBISWORLD.COM� Breweries�in�the�US February 2012 19
Cost�Structure�Benchmarks
The industry profit margin expanded over the five years to 2012 from 8.8% to 11.8% of revenue. In 2008, when the two major players restructured, the profit of Anheuser-Busch InBev fell an estimated 30.0%, and MillerCoors’ profit margin declined to an estimated 9.2% of revenue; however, both companies began to benefit from streamlined operations starting in 2011. These high profit margins, however, are contrary to the variable and often negative margins of
smaller breweries. Such differentiation among player profit is the result of high variable costs and the bargaining power that the two major players have with suppliers and distributors. As consumer sentiment improves and consumers turn to craft brews that are less profitable, average industry profit is forecast to decrease over next five years to 11.6% of industry revenue in 2017.
The largest costs to breweries are purchases of raw materials, which
Key�Success�Factors Market research and understandingFirms must be able to identify the geographic areas where it would be appropriate and profitable to sell their products.
Economies of scopeBrewers that produce a wide range of brands can achieve a cost advantage in distribution and advertising over smaller competitors.
Control of distribution arrangementsMarket power in the industry’s
distribution networks is very high, so any potential entrant must have access to distribution networks to survive.
Establishment of brand namesSuccessful branding through sales promotion and advertising is critical to success in a brand-competitive market.
Economies of scaleThe size of the operation will determine unit prices, which is a key variable with respect to competitiveness.
Market�Share�Concentration
The Breweries industry has a high level of concentration, with the four largest corporations generating about 86.7% of revenue. This represents relatively little change in market share from 2007 despite two major mergers in 2008. MillerCoors and Anheuser-Busch InBev were formed that year in the mergers of SABMiller with Molson Coors and Anheuser-Busch with InBev, respectively. The resulting companies dominate the industry and are responsible for the majority of all beer brewed within the United States. Medium-size breweries supply about 10.0% of the beer market. Their prominence within the industry declined
during the late 1990s due to difficult trading conditions and financial mismanagement, making them prime candidates for acquisition. MillerCoors and Anheuser-Busch InBev have grown in the past through acquisition.
In addition to these two giants, there are hundreds of other beer producers. But almost all of these are craft breweries, which account for less than 10.0% of industry revenue. While they remain a small proportion of the industry, craft brewers are growing at a fast rate as a segment. Their growth is far outpacing the industry as a whole, giving small companies an increasing proportion of market share.
Competitive�LandscapeMarket�Share�Concentration�� |�� Key�Success�Factors�� |�� Cost�Structure�BenchmarksBasis�of�Competition�� |�� Barriers�to�Entry�� |�� Industry�Globalization
Level��Concentration in this industry is High
�IBISWorld identifies 250 Key Success Factors for a business. The most important for this industry are:

WWW.IBISWORLD.COM� Breweries�in�the�US February 2012 20
Competitive�Landscape
Cost�Structure�Benchmarkscontinued
IBISWorld estimates will account for 58.3% of industry revenue in 2012. These raw materials include packaging: principally glass, aluminum and corrugated cardboard. Packaging costs have increased significantly over the past five years, particularly aluminum cans, due to commodity prices rising. Other raw materials include barley, sugar, malt, corn, rice, wheat, hops and preservatives, which are the critical ingredients required for brewing. The price of hops in particular was at a record high in 2008, but it steadied in 2010 and is estimated to account for 10.0% of revenue. The price of grains increased in 2010 as a result of Russia’s export ban. Over the five years to 2017, prices of raw ingredients are projected to decline as farmers compensate for the shortages that occurred over the past five years.
Labor is the next-largest cost to this industry, accounting for about 7.6% of
industry revenue in 2012. The ratio of wages to revenue decreased during the five years to 2012 because recent mergers resulted in decreased spending on labor, and revenue growth exceeded employment growth. Over the five years to 2017, more demand for craft brews is expected to increase labor costs as a share of revenue to about 8.0%.
In 2012, depreciation is estimated to be 2.5% of revenue. Because beer brewing is a capital-intensive process, depreciation of plants and equipment is significant. However, depreciation is smaller than in other manufacturing industries because there have not been any major technological breakthroughs over the past five years, and much of the equipment is extremely durable. Depreciation is not forecast to fluctuate over the five years to 2017 for the same reasons that it has remained minimal since 2007.
Sector�vs.�Industry�Costs
■�Profi�t■�Wages■�Purchases■�Depreciation■�Marketing■�Rent�&�Utilities■�Other
Average�Costs�of�all�Industries�in�sector�(2012)�
Industry�Costs�(2012)�
0
20
40
60
Perc
enta
ge o
f rev
enue
80
1008.8
13.04.2 1.03.4
55.2
14.4
11.8
16.0
3.82.5
58.3
7.6
SOURCE: WWW.IBISWORLD.COM

WWW.IBISWORLD.COM� Breweries�in�the�US February 2012 21
Competitive�Landscape
Basis�of�Competition Competition is increasing within the Breweries industry because the major industry players have a stronghold over the market, enabling them to dominate distribution activities and raw materials access. Competition has also increased from other beverage manufacturing industries and from foreign breweries. Imported brands, such as Heineken, present strong competition to domestic producers.
Internal competitionFor the brewing industry, price is not the most important factor. Competition is based primarily on brand, quality and packaging. Marketing efforts typically focus on 21 to 35 year olds because it is the largest market and the age range at which consumers are most likely to try new products. Smaller players have also gotten crafty, using marketing techniques like beer tastings and brewery tours.
There is significant loyalty to beer brands across the country, making it difficult to consistently win market share away from these brands in the long term. Competition for brand
loyalty has intensified on a regional level, and many regional players have aggressively sought to expand their geographic market reach as a result. Competition has also increased with the rise of the craft-brewing sector in the past five years. Internal competition is anticipated to continue growing over the five years to 2017.
External competitionCompetition from other beverages and beer imports is escalating, although imports did decrease over the five years to 2012 as a result of the recession, when people cut budgets by switching to domestic beer over more expensive varieties of alcohol. Over the five years to 2017, imports are forecast to grow as consumer spending picks up.
Other beverage industries are becoming more fragmented, offering drinks that are competing directly with beer. Not only is wine becoming increasingly popular with 21 to 35 year olds, but there are also new “adult” drinks aimed at consumers in this age range who are looking to relax. These
Cost�Structure�Benchmarkscontinued
Rent makes up about 2.3% of Breweries industry revenue and utility costs make up about 1.5%. Rent prices declined when the housing bubble burst, and utility prices have fluctuated but are near their 2007 level. Over the next five years, rent is projected to increase gradually and utility costs will continue to fluctuate.
Other costsTaxes make up an estimated 10.3% of industry revenue in 2012. For the most part, the tax rate is $18 per barrel, with several exceptions for smaller companies. Over the five years to 2017, the proportion of tax revenue is anticipated to decline as industry revenue grows and
also because Congress is likely to pass a proposal to lower taxes even further for small breweries.
Marketing is estimated to be 3.6% of industry revenue in 2012. The top two players have historically spent significantly on prime advertising, such as TV commercials during the Super Bowl and Olympics. Marketing has remained and is expected to remain at this share of revenue because, although advertising spots were cheaper during the recession, the industry has increased its outreach to stimulate spending on its products.
Other costs for domestic brewers include administration and legal costs. These have remained steady and are not anticipated to change through 2017.
Level�&�Trend��Competition in this industry is Medium and the trend is Increasing

WWW.IBISWORLD.COM� Breweries�in�the�US February 2012 22
Competitive�Landscape
Barriers�to�Entry The barriers to entry into the domestic brewing industry depend on whether a new operator is attempting to enter the small craft-brewing market or large-scale production. Entry into the craft-brewing market is facilitated by the option to purchase turnkey facilities and faces lesser taxes, but starting a large-scale production requires significant cash flow and continuous investment.
Barriers to entry include sunk costs and other high ongoing capital requirements, such as capital costs of manufacturing facilities and branding. Major companies have preexisting agreements with distributors, which are also heavily regulated and limited on a regional basis, severely limiting the exposure available to new players. Additionally, shelf space is limited in retail outlets and major players produce a wide variety of products, which prevents many new players from placing their products in certain stores.
Companies such as Anheuser-Busch InBev have diversified by importing and producing other beverages. This enhances their relationship with distributors and makes them more attractive to investors looking for a well-balanced portfolio. New entrants can also form distribution joint ventures with other beverage manufacturers to appeal to such investors, or join an existing portfolio such as North American Breweries (NAB).
The significant economies of scale achievable in brewing means that large
producers can earn enough revenue to spend significant amounts on branding, advertising and other promotions to attract new customers and maintain customer loyalties. Incumbent producers in the Breweries industry are known to be some of the largest advertisers in the US economy. This creates a barrier to entry because it makes it difficult for a new player to capture some of the market.
In addition to the high costs of establishing a distribution network for players that wish to compete in the national market, there are regulatory burdens that create barriers to entry. The distribution of alcohol in the United States is highly regulated, and many states do not allow producers to act as wholesalers. Licensed wholesalers have some degree of market power since their numbers are controlled. To make matters worse, it is more cost effective for wholesalers to deal with a limited number of manufacturers because this decreases their transaction costs.
Basis�of�Competitioncontinued
include low-sugar sodas that are marketed as healthy alternatives, like GuS (Grown-up Soda), relaxation drinks
and exotic juices that retailers, restaurants and other establishments are increasingly selling alongside beer.
Barriers�to�Entry�checklist� LevelCompetition MediumConcentration HighLife Cycle Stage MatureCapital Intensity MediumTechnology Change LowRegulation & Policy HeavyIndustry Assistance Low
SOURCE: WWW.IBISWORLD.COM
Level�&�Trend��Barriers to Entry in this industry are High and Steady

WWW.IBISWORLD.COM� Breweries�in�the�US February 2012 23
Competitive�Landscape
Industry�Globalization
The industry’s moderate level of globalization has increased rapidly over the five years to 2012 and is forecast to continue increasing over the next five years. Exports and imports are projected to increase as a share of revenue, growing to 26.1% and 16.3% of 2017 revenue, respectively. Nearly all the small to medium-size breweries are domestically owned, with little participation in international markets.
Meanwhile, both major players are foreign owned and heavily involved in the international brewing market. Anheuser-Busch InBev, which controls nearly 50.0% of the market, is headquartered in Belgium; the parent companies of the MillerCoors joint venture are located in South Africa and Canada. Even prior to its purchase by InBev, Anheuser-Busch had a majority stake in Harbin Brewery in China and purchased other Chinese breweries from Lion Nathan, an alcoholic beverage
company with operations in Australia and New Zealand. Furthermore, it had a 35.1% stake in Grupo Modelo, Mexico’s largest brewer, and a 9.9% stake in Tsingtao Brewing Company, the largest brewer in China. Large brewing companies are increasingly looking for exposure to markets with growing beer-consumption levels. This move is due to stagnant beer consumption in the United States, which restricts opportunities for growth.
Licensing agreements and international brewing operations have increased over the past five years, resulting in more foreign brands being marketed domestically. There are a number of license brewing arrangements for international brands, where beers originating outside the United States are brewed domestically using the original recipes. Other arrangements include exclusive rights to either import or distribute particular international beers.
SOURCE: WWW.IBISWORLD.COM
Trade�Globalization Going�Global:�Breweries�2000-2012
Expo
rts/
Reve
nue
Expo
rts/
Reve
nue
200
150
100
50
0
200
150
100
50
0
Imports/Domestic�Demand Imports/Domestic�Demand0 040 4080 80120 120160 160
International trade is a major determinant of an industry’s level of globalization.
Exports offer growth opportunities for fi rms. However there are legal, economic and political risks associated with dealing in foreign countries.
Import competition can bring a greater risk for companies as foreign producers satisfy domestic demand that local fi rms would otherwise supply.
Export ExportGlobal Global
ImportLocal ImportLocal
Breweries2000
2012
Level�&�Trend��Globalization in this industry is Medium and the trend is Increasing

WWW.IBISWORLD.COM� Breweries�in�the�US February 2012 24
Player�Performance Anheuser-Busch InBev (AB InBev) is the result of a 2008 merger between Anheuser-Busch (AB) and InBev. The combination of these two brewing giants gave the new company a clear leading position in the global brewing industry, with operations spanning all populated continents. The company’s stated goal is to focus on promoting its largest brands. This included outbidding MillerCoors to be the official sponsor of the NFL starting in the 2010 football season. Its sponsorship of the 2010 World Cup was successful, boosting sales of Budweiser for the two quarters following the games.
Prior to purchasing the company in 2008, InBev had a strong global presence in its own right. AB had already distributed its global brands in the United States, and the company held the position of largest brewer by volume. AB’s businesses included brewing, packaging, theme parks and real estate. Since the merger, the company sold its theme park
business to focus on beer. It operates 12 breweries in the United States.
AB InBev’s US beer production revenue is expected to have increased at an annualized rate of 0.1% over the five years to 2011 to $11.8 billion, demonstrating a 3.0% increase from 2010. Potential acquisitions of craft breweries, such as Craft Brewers Alliance (of which the company already holds a 42.0% stake), could significantly expand the AB InBev’s market share.
Despite slowed sales, the company’s profit margin (i.e. earnings before interest and taxes, or EBIT) is significantly higher than the industry average, at 45.6% of its revenue. AB InBev lowered its cost of sales by reducing its operating expenses and taking advantage of the merger. The increased profit margin is partially attributable to increased advertising exposure on newer and cheaper media outlets like social networking sites.
�Major�CompaniesAnheuser-Busch�InBev�� |�� MillerCoors�LLC�� |�� Other�Companies
15.8%Other
Anheuser-Busch�InBev�48.3%
MillerCoors�LLC�35.9%
SOURCE: WWW.IBISWORLD.COM
Major�players(Market share)
Anheuser-Busch�InBev��Market share: 48.3% Industry�Brand�NamesBudweiser Bud Light Beck’s Stella Artois Michelob Natural Light Leffe Hoegaarden O’Doul’s
Anheuser-Busch�InBev�(US�breweries�segment)��–�fi�nancial�performance
YearRevenue�
($ million) (% change)EBIT�
($ million) (% change)
2006* 11,759 -0.3 N/A N/C
2007* 12,228 4.0 N/A N/C
2008 12,099 -1.1 807 N/C
2009 11,888 -1.7 4,857 501.9
2010 11,490 -3.3 5,171 6.5
2011** 11,834 3.0 5,395 4.3
*AB�domestic�beer�production�pre-merger;�**EstimateSOURCE: ANNUAL REPORT AND IBISWORLD

WWW.IBISWORLD.COM� Breweries�in�the�US February 2012 25
Major�Companies
Player�Performance Starting in late 2008, SABMiller and Molson Coors agreed to combine their US businesses into a joint venture to better compete with the dominant AB InBev. SABMiller has a 58.0% equity stake in the company, while Molson Coors accounts for the remaining 42.0%. MillerCoors has eight breweries in the United States, is headquartered in Chicago and employed more than 8,500 people in 2011.
By brewing both SABMiller and Molson Coors beers at all sites the two brewers owned, the joint venture reduced production and transportation costs. Employee-related costs were also cut when hundreds of people were laid off due to the merger. The company reported that cost savings were greater than anticipated.
Much like AB InBev, MillerCoors’ large market share means that the trends it faces are fairly representative of the industry in general. MillerCoors has a wide array of offerings, including involvement in the craft-brewing segment. In 2009, after the first full year as a new company, MillerCoors focused on improving its merger and reducing marketing and administrative costs.
Financial performanceThe company’s US beer production revenue is estimated to have decreased at an annualized rate of 1.1% over the five years to 2011, taking into account the various company segments prior to the merger. In 2011, revenue decreased about 0.1% as consumer sentiment struggled to improve. The recession significantly hindered consumer spending on this company’s products. For example, sales by volume to retailers and wholesalers declined 1.7% in 2009, primarily due to lower consumer spending and downstream destocking. However, the newly merged company raised prices and industry-relevant revenue grew 1.2% that year despite the decline in volume.
Nonetheless, the company expects to unlock $750.0 million in synergies and cost savings by the end of 2012. An additional boon for the company has been favorable tax benefits to smaller breweries, some of which MillerCoors has an ownership stake in. Cost savings helped MillerCoors record a profit margin of about 12.9% in 2011.
MillerCoors�LLC�–�fi�nancial�performance*
YearRevenue�
($ million) (% change)Operating�Income�
($ million) (% change)
2008 8,746 N/C 544 N/C
2009 8,852 1.2 866 59.2
2010 8,818 -0.4 1,078 24.5
2011** 8,809 -0.1 1,138 5.6
*Results�prior�to�merger�are�not�comparable;�**EstimateSOURCE: ANNUAL REPORT AND IBISWORLD
MillerCoors�LLC��Market share: 35.9% Industry�Brand�NamesMiller Coors Blue Moon Mickey’s Pilsner Urquell Foster’s Keystone Milwaukee’s Best Steel Reserve Killian’s

WWW.IBISWORLD.COM� Breweries�in�the�US February 2012 26
Major�Companies
Other�Companies Craft breweriesThe craft-brewing sector is made up of microbreweries, brewpubs, contract brewing companies, regional breweries and regional specialty breweries. According to the Brewers Association, a craft brewer is small, independent and traditional. Small brewers are defined as producing fewer than 2 million barrels of beer per year. A brewer is considered independent if less than 25.0% of the craft brewery is owned or controlled (or equivalent economic interest) by an alcoholic beverage industry member who is not a craft brewer. Major brewers have been targeting the same demographic as craft brewers in order to capture some of the growth enjoyed by this smaller high-growth segment.
Microbreweries are businesses that produce less than 75,000 barrels a year. In the 1990s, a revival of small regional breweries was initiated in the United States with the passage of a law in 1993 that allowed restaurants and bars to produce and sell their own brews on their premises. Brewpubs became permitted to sell up to 5,000 barrels a year; though they may sell it at their establishments, many may not distribute it through retail outlets (a rule that varies from state to state).
In addition to the companies detailed below, other craft brewers include Sierra Nevada Brewing Co., New Belgium Brewing Co. and Redhook Ale Brewery.
The Boston Beer CompanyEstimated market share: 2.2%This company has benefited from the vibrant craft-brewing scene in its hometown of Boston. Its core brands include Samuel Adams Boston Lager and Sam Adams Light; however, it produces a large number of other beers as well as cider and flavored malt beverages. The company competes within the craft segment and concentrates on product quality rather
than engaging in price competition with larger brewers. Its competitive strengths over other regional brewers include a number of awards for its products, distribution capabilities and scale relative to other smaller brewers. It is expected to earn over $535 million in 2011, representing 5.7% growth year on year. The company continues to grow after stagnant sales of $453 million in 2009 and some success in 2010.
Pabst Brewing CompanyEstimated market share: Less than 1.0%Pabst Brewing Company is an Illinois-based brewer that was established in 1884 and survived as a company through Prohibition by producing soft drinks and cheese instead of beer. Following prohibition, the brewer emerged as a medium-size player and benefited from the growth of the industry through the 1940s and 1950s. Today, the company produces Pabst Blue Ribbon and Pabst Blue Ribbon Light. It has won medals in the Great American Beer Festival and remains a second-tier player, despite acquiring the Schiltz brand that was one of the top-selling beers in the 1960s. In 2007, the Brewers Association ranked the company as the No. 4 selling beer by volume.
Yuengling and Son IncorporatedEstimated market share: Less than 1.0%Yuengling is another brewer that survived prohibition, but it was first established as Eagle Brewery. It is the oldest brewing company in the United States and was founded over 100 years ago. The company’s products, including lagers and ales, are distributed in eastern states from New York to Florida and are marketed with a focus on the brewer’s history. The company produces its beers from three breweries and was ranked as the largest brewer by volume in 2011 according to trade journal Beer Marketer’s Insights.

WWW.IBISWORLD.COM� Breweries�in�the�US February 2012 27
Capital�Intensity Like all large-scale manufacturing, breweries require substantial amounts of capital investment. Stills, filtration systems, bottling lines and other machinery are bought when a plant is first established but require continuous maintenance and repair. Plants must spend an average of $450,000 annually in addition to the initial setup costs, which can be in the multimillions for some facilities. On average, breweries spend 33 cents on equipment for every dollar spent on labor. However, the specific amount of capital spending varies each year and by the size of the plant.
The majority of the production process is mechanized and little labor is needed, and because the industry
includes many craft breweries and brewpubs, 69.1% of companies have fewer than 20 employees. The largest
�Operating�ConditionsCapital�Intensity�� |�� Technology�&�Systems�� |�� Revenue�VolatilityRegulation�&�Policy�� |�� Industry�Assistance
Tools�of�the�Trade:�Growth�Strategies�for�Success
SOURCE: WWW.IBISWORLD.COM
Labo
r�Int
ensi
veCapital�Intensive
Change�in�Share�of�the�Economy
New�Age�Economy
Recreation,�Personal�Services,�Health�and�Education. Firms benefi t from personal wealth so stable macroeconomic conditions are imperative. Brand awareness and niche labor skills are key to product differentiation.
Traditional�Service�Economy
Wholesale�and�Retail. Reliant on labor rather than capital to sell goods. Functions cannot be outsourced therefore fi rms must use new technology or improve staff training to increase revenue growth.
Old�Economy
Agriculture�and�Manufacturing.�Traded goods can be produced using cheap labor abroad. To expand fi rms must merge or acquire others to exploit economies of scale, or specialize in niche, high-value products.
Investment�Economy
Information,�Communications,�Mining,�Finance�and�Real�Estate.�To increase revenue fi rms need superior debt management, a stable macroeconomic environment and a sound investment plan.
Wineries
Beer�Wholesaling Distilleries
Flour�Milling
Sugar�ProcessingBreweries
Capital intensity
0.5
0.0
0.1
0.2
0.3
0.4
SOURCE: WWW.IBISWORLD.COMDotted line shows a high level of capital intensity
Capital units per labor unit
BreweriesManufacturingEconomy
Level��The level of capital intensity is Medium

WWW.IBISWORLD.COM� Breweries�in�the�US February 2012 28
Operating�Conditions
Revenue�Volatility
Technology&�Systems
Traditional beer is generally made the same way as it has been for centuries. However, there have been some recent advancements in technology, such as more efficient boiling systems. Most of the technological developments in brewing now occur at the company level and revolve around refining brewing processes to improve the quality of the product.
Advancements have focused on reducing the energy consumption of brewing systems. An example of this is Anheuser-Busch’s goal of using renewable energy in its production operations. Another development on the horizon for the industry is the use of solar energy in the brewing process to supplement purchased energy sources.
Technology used for point-of-sale marketing has also been developed
over the five years to 2012. Breweries, most often by the big two, often send signs using LED streaming technology are often sent to bars and liquor stores. Other developments in advertising materials are catching on too, such as Nature’s Flash Light, a bioluminescent technology that produces special effects on signs.
Technologies used to distribute, store, package and keep track of beer products are also changing constantly, giving an indirect boost to the industry by lowering final prices through decreasing middleman costs. From electric and hybrid fleet vehicles adopted by distributors to inventory management software used by warehouses, technology helps the industry provide consumers with lower-cost beer.
Capital�Intensitycontinued
two, however, have a significant global presence, multiple factories and large corporate offices with executive and marketing departments. Their sizes
drive up their labor costs considerably because they must pay a greater number of workers, such as additional managers, salesmen and marketers.
Level��The level of Technology Change is Low
SOURCE: WWW.IBISWORLD.COM
Volatility�vs�Growth
Reve
nue�
vola
tility
*�(%
)�
1000
100
10
1
0.1
Five�year�annualized�revenue�growth�(%)�–30 –10 10 30 50 70
Hazardous
Stagnant
Rollercoaster
Blue�Chip
* Axis is in logarithmic scale
Breweries
A higher level of revenue volatility implies greater industry risk. Volatility can negatively affect long-term strategic decisions, such as the time frame for capital investment.
When a fi rm makes poor investment decisions it may face underutilized capacity if demand suddenly falls, or capacity constraints if it rises quickly.
Level��The level of Volatility is Medium

WWW.IBISWORLD.COM� Breweries�in�the�US February 2012 29
Operating�Conditions
Regulation�&�Policy Some laws that affect the Breweries industry have been “grandfathered from prohibition,” some are in place for perceived tax revenue generation and others are simply anticompetitive regulations that favor a select few. Many breweries across the country oppose such laws.
Bureau of Alcohol, Tobacco Firearms and Explosives (ATF)ATF is a law-enforcement agency within the US Department of the Treasury and is responsible for protecting the public, reducing violent crime and collecting revenue. ATF enforces the federal laws and regulations relating to alcohol, tobacco products, firearms, explosives and arson. As part of its alcohol responsibilities, the ATF approves labels and monitors advertising; regulates labeling, marking, packaging and branding of all distilled spirits, wine and beer sold in the United States; and regulates US production and the importation of all alcohol beverages, including distilled spirits, malt beverages and wine.
US Alcohol and Tobacco Tax and Trade Bureau (TTB)In 2003, the TTB published proposed regulations on the formulation, labeling and advertising of flavored malt beverages (FMBs). The final ruling was passed in 2005, which allowed for the addition of flavors and other
nonbeverage ingredients but limited the alcohol contribution of such flavors to 49.0% of the alcohol content of the product. For instance, beverages with alcohol content exceeding 6.0% alcohol by volume could contain no more than 1.5% of this alcohol from flavors and nonbeverage ingredients.
The TTB sends out publications to remind brewers and importers of limitations to the use of flavors and nonbeverage ingredients containing alcohol in the production of FMBs. When producers do not comply with the regulations, the beverage is classified as a distilled spirit and taxed at the much higher distilled spirits rate.
State regulationsThere are two types of regulatory environments in the United States where alcohol regulations are made on the state level: open and control states. In open states, brewers are allowed to sell beer and ale directly to independent distributors. In most control states, companies market their spirit products to state liquor control boards through a warehousing system, and from there, to state liquor stores. Beer distribution follows open states regulation across the entire United States.
Regulations vary from state to state for direct sales, brewery tours, brewpubs, microbreweries, excise, packaging and franchising and are usually more stringent throughout
Revenue�Volatilitycontinued
Industry revenue has been particularly volatile over the five years to 2012. The increased popularity of wine and other premium beverages resulted in a decline in demand for beer, which turned around when disposable income declined for a prolonged period. This trend and the increasing popularity of craft and premium beers
supported revenue growth. The already growing demand for these particular types of beer is anticipated to boost industry revenue, even as consumer spending picks up over the five years to 2017 and consumers switch back to premium alcoholic beverages both in and outside of the scope of this industry.
Level�&�Trend��The level of Regulation is Heavy and the trend is Steady

WWW.IBISWORLD.COM� Breweries�in�the�US February 2012 30
Operating�Conditions
Industry�Assistance Protection of the domestic brewing industry is in the form of tariffs on imported products. According to the latest information available from the International Trade Administration in the Department of Commerce, the general rate of import tariff on nonalcoholic beer is two cents per liter. For beer made from malt, there is no import tariff imposed. The industry is protected, up to a point, from imports by the high cost of transport given the weight of the product and the low value relative to this weight. However, favorable production conditions in Mexico and Canada have led foreign premium brands to set up shop in neighboring countries in order to produce beer for sale in the United States.
Other assistance is provided by organizations, including the Beer Institute, Small Brewers Caucus and Institute for Brewing Studies.
The Beer Institute was formed to represent the industry before Congress in 1986. It runs a number of initiatives, such as an advertising code and responsible drinking advocacy. The body also lobbies the government regarding beer taxes and state and federal regulatory issues and collects statistics about the industry that
it then distributes to members. Members include representatives from Anheuser-Busch InBev, MillerCoors, Heineken USA and Grupo Modelo.
The Small Brewers Caucus is composed of members of Congress who have an interest in the issues smaller brewers face. The aim of the caucus is to provide members with the opportunity to learn about the business and regulatory and societal issues relating to small breweries. The establishment of the caucus shows some recognition of smaller brewers’ significance in the industry and may give smaller brewers greater representation in Congress. It is supported by the Brewer’s Association, which is composed of small beer production companies.
The Institute for Brewing Studies offers establishment and marketing assistance to existing and prospective microbrewers across the country.
Regulation�&�Policycontinued
eastern states than those in the west. Of all the states, Florida and Georgia have the highest level of state excise, at 48 cents per gallon. The lowest state-based excise is in Wyoming, where excise is two cents per gallon. The US average rate is about 19 cents per gallon. In an effort to raise taxes and
stimulate small brewery business, some states have relaxed regulations on where beer can be sold and under what conditions, One example of this is South Carolina, which recently started allowing breweries to conduct tours and sell a limited amount of beer directly to customers.
Level�&�Trend��The level of Industry Assistance is Low and the trend is Steady
Key�tariffsGoods Low�rate High�rate
Non-alcoholic beer (cents per liter)
0 2
SOURCE: USITC

WWW.IBISWORLD.COM� Breweries�in�the�US February 2012 31
�Key�StatisticsRevenue�
($m)
Industry�Value�Added�
($m)Establish-
ments Enterprises EmploymentExports�
($m)Imports�
($m)Wages�($m)
Domestic�Demand
($m)
Craft�Beer�Production�
(Million barrels)2003 24,630.5 4,981.3 1,253 1,223 27,537 313.7 3,289.3 1,853.1 27,606.1 5.12004 23,824.7 4,632.8 1,291 1,261 27,380 313.3 3,303.8 1,750.0 26,815.2 5.62005 23,619.0 4,646.5 1,326 1,298 27,210 366.1 3,572.8 1,741.3 26,825.7 6.02006 23,745.4 4,872.2 1,370 1,344 26,996 418.6 4,005.6 1,690.3 27,332.4 7.12007 22,665.0 4,405.5 1,426 1,400 28,425 697.8 3,953.1 1,821.7 25,920.3 8.12008 20,510.7 5,339.5 1,487 1,458 27,072 1,335.0 3,902.6 1,668.1 23,078.3 8.52009 21,436.0 4,558.4 1,579 1,549 27,204 1,340.5 3,531.7 1,621.7 23,627.2 9.12010 24,134.4 5,612.0 1,742 1,711 28,840 2,028.3 3,672.9 1,830.9 25,779.0 9.62011 24,520.5 5,205.6 1,835 1,802 29,171 2,291.7 3,668.3 1,865.4 25,897.1 10.12012 24,479.8 5,375.3 1,888 1,856 28,826 2,803.5 3,714.1 1,867.4 25,390.4 10.52013 25,298.1 5,613.5 1,964 1,934 28,836 3,550.1 3,878.5 1,935.2 25,626.5 11.02014 24,889.3 5,394.8 1,998 1,968 28,701 3,886.3 3,922.3 1,919.3 24,925.3 11.42015 24,736.9 5,412.9 2,052 2,023 28,858 4,732.9 3,967.4 1,912.9 23,971.4 11.92016 25,032.1 5,524.7 2,147 2,117 29,543 5,329.0 4,074.1 1,989.0 23,777.2 12.22017 25,711.0 5,656.9 2,279 2,250 30,698 6,706.9 4,193.4 2,048.7 23,197.5 12.7Sector�Rank 63/195 85/195 44/195 40/195 118/195 73/183 87/183 91/195 69/183 N/AEconomy�Rank 307/705 379/705 472/704 431/704 530/705 92/229 99/229 450/705 86/229 N/A
IVA/Revenue�(%)
Imports/Demand�
(%)Exports/Revenue�
(%)
Revenue�per�Employee�
($’000)Wages/Revenue�
(%)Employees�
per�Est.Average�Wage�
($)
Share�of�the�Economy�
(%)2003 20.22 11.92 1.27 894.45 7.52 21.98 67,294.91 0.042004 19.45 12.32 1.32 870.15 7.35 21.21 63,915.27 0.042005 19.67 13.32 1.55 868.03 7.37 20.52 63,994.85 0.042006 20.52 14.66 1.76 879.59 7.12 19.71 62,612.98 0.042007 19.44 15.25 3.08 797.36 8.04 19.93 64,087.95 0.032008 26.03 16.91 6.51 757.64 8.13 18.21 61,617.17 0.042009 21.27 14.95 6.25 787.97 7.57 17.23 59,612.56 0.042010 23.25 14.25 8.40 836.84 7.59 16.56 63,484.74 0.042011 21.23 14.16 9.35 840.58 7.61 15.90 63,947.07 0.042012 21.96 14.63 11.45 849.23 7.63 15.27 64,781.79 0.042013 22.19 15.13 14.03 877.31 7.65 14.68 67,110.56 0.042014 21.68 15.74 15.61 867.19 7.71 14.36 66,872.23 0.042015 21.88 16.55 19.13 857.19 7.73 14.06 66,286.64 0.042016 22.07 17.13 21.29 847.31 7.95 13.76 67,325.59 0.042017 22.00 18.08 26.09 837.55 7.97 13.47 66,737.25 N/ASector�Rank 141/195 119/183 114/183 27/195 161/195 181/195 29/195 85/195Economy�Rank 522/705 137/229 140/229 91/705 591/705 338/704 135/705 379/705
Figures are inflation-adjusted 2012 dollars. Rank refers to 2012 data.
Revenue�(%)
Industry�Value�Added�
(%)
Establish-ments�
(%)Enterprises�
(%)Employment�
(%)Exports�
(%)Imports�
(%)Wages�
(%)
Domestic�Demand�
(%)
Craft�Beer�Production�
(%)2004 -3.3 -7.0 3.0 3.1 -0.6 -0.1 0.4 -5.6 -2.9 9.82005 -0.9 0.3 2.7 2.9 -0.6 16.9 8.1 -0.5 0.0 7.12006 0.5 4.9 3.3 3.5 -0.8 14.3 12.1 -2.9 1.9 18.32007 -4.5 -9.6 4.1 4.2 5.3 66.7 -1.3 7.8 -5.2 14.12008 -9.5 21.2 4.3 4.1 -4.8 91.3 -1.3 -8.4 -11.0 4.92009 4.5 -14.6 6.2 6.2 0.5 0.4 -9.5 -2.8 2.4 7.12010 12.6 23.1 10.3 10.5 6.0 51.3 4.0 12.9 9.1 5.52011 1.6 -7.2 5.3 5.3 1.1 13.0 -0.1 1.9 0.5 5.22012 -0.2 3.3 2.9 3.0 -1.2 22.3 1.2 0.1 -2.0 4.02013 3.3 4.4 4.0 4.2 0.0 26.6 4.4 3.6 0.9 4.82014 -1.6 -3.9 1.7 1.8 -0.5 9.5 1.1 -0.8 -2.7 3.62015 -0.6 0.3 2.7 2.8 0.5 21.8 1.1 -0.3 -3.8 4.42016 1.2 2.1 4.6 4.6 2.4 12.6 2.7 4.0 -0.8 2.52017 2.7 2.4 6.1 6.3 3.9 25.9 2.9 3.0 -2.4 4.1Sector�Rank 159/195 74/195 19/195 16/195 159/195 2/183 149/183 144/195 166/183 N/AEconomy�Rank 619/705 334/705 122/704 101/704 627/705 4/229 184/229 582/705 210/229 N/A
Annual�Change
Key�Ratios
Industry�Data
SOURCE: WWW.IBISWORLD.COM

WWW.IBISWORLD.COM� Breweries�in�the�US February 2012 32
Jargon�&�Glossary
BARRIERS�TO�ENTRY Barriers to entry can be High, Medium or Low. High means new companies struggle to enter an industry, while Low means it is easy for a firm to enter an industry.
CAPITAL/LABOR�INTENSITY An indicator of how much capital is used in production as opposed to labor. Level is stated as High, Medium or Low. High is a ratio of less than $3 of wage costs for every $1 of depreciation; Medium is $3 – $8 of wage costs to $1 of depreciation; Low is greater than $8 of wage costs for every $1 of depreciation.
CONSTANT�PRICES The dollar figures in the Key Statistics table, including forecasts, are adjusted for inflation using 2012 as the base year. This removes the impact of changes in the purchasing power of the dollar, leaving only the ‘real’ growth or decline in industry metrics. The inflation adjustments in IBISWorld’s reports are made using the US Bureau of Economic Analysis’ implicit GDP price deflator.
DOMESTIC�DEMAND The use of goods and services within the US; the sum of imports and domestic production minus exports.
EARNINGS�BEFORE�INTEREST�AND�TAX�(EBIT)� IBISWorld uses EBIT as an indicator of a company’s profitability. It is calculated as revenue minus expenses, excluding tax and interest.
EMPLOYMENT The number of working proprietors, partners, permanent, part-time, temporary and casual employees, and managerial and executive employees.
ENTERPRISE A division that is separately managed and keeps management accounts. The most relevant measure of the number of firms in an industry.
ESTABLISHMENT The smallest type of accounting unit within an Enterprise; usually consists of one or more locations in a state or territory of the country in which it operates.
EXPORTS The total sales and transfers of goods produced by an industry that are exported.
IMPORTS The value of goods and services imported with the amount payable to non-residents.
INDUSTRY�CONCENTRATION IBISWorld bases concentration on the top four firms. Concentration is identified as High, Medium or Low. High means the top four players account for over 70% of revenue; Medium is 40 –70% of revenue; Low is less than 40%.
INDUSTRY�REVENUE The total sales revenue of the industry, including sales (exclusive of excise and sales tax) of goods and services; plus transfers to other firms of the same business; plus subsidies on production; plus all other operating income from outside the firm (such as commission income, repair and service income, and rent, leasing and hiring income); plus capital work done by rental or lease. Receipts from interest royalties, dividends and the sale of fixed tangible assets are excluded.
INDUSTRY�VALUE�ADDED The market value of goods and services produced by an industry minus the cost of goods and services used in the production process, which leaves the gross product of the industry (also called its Value Added).
INTERNATIONAL�TRADE The level is determined by: Exports/Revenue: Low is 0 –5%; Medium is 5 –20%; High is over 20%. Imports/Domestic Demand: Low is 0 –5%; Medium is 5 –35%; and High is over 35%.
LIFE�CYCLE All industries go through periods of Growth, Maturity and Decline. An average life cycle lasts 70 years. Maturity is the longest stage at 40 years with Growth and Decline at 15 years each.
NON-EMPLOYING�ESTABLISHMENT Businesses with no paid employment and payroll are known as non-employing establishments. These are mostly set-up by self employed individuals.
VOLATILITY The level of volatility is determined by the percentage change in revenue over the past five years. Volatility levels: Very High is greater than ±20%; High Volatility is between ±10% and ±20%; Moderate Volatility is between ±3% and ±10%; and Low Volatility is less than ±3%.
WAGES The gross total wages and salaries of all employees of the establishment.
Industry�Jargon
IBISWorld�Glossary
BARREL A container for beer equivalent to 2 kegs, 31 gallons, 1.17 hectoliters or 330 12-ounce servings of beer.
BREWPUB A restaurant-brewery that sells more than 25.0% of its beer on-site.
CRAFT�BREWER A brewery that has annual production of less than two million barrels and has fewer than 25.0% of its ownership in the hands of a non-craft brewer. It typically targets local and regional markets.
MALT�BEVERAGE The general name for all products made with malted barley or hops. It must derive the majority of its alcohol content from the fermentation of brewing ingredients.
MALT�LIQUOR Defined as a malt beverage with an alcohol content of higher than 6.0% in most states; higher alcohol content usually results from corn, rice or sugar additives.
MICROBREWERIES Breweries that each produce fewer than 15,000 barrels of beer per year with 75.0% or more of its beer sold off-site.
REGIONAL�BREWERIES Breweries with annual beer production between 15,000 and 2 million barrels each.

Disclaimer
This product has been supplied by IBISWorld Inc. (‘IBISWorld’) solely for use by its authorized licenses strictly in accordance with their license agreements with IBISWorld. IBISWorld makes no representation to any other person with regard to the completeness or accuracy of the data or information contained herein, and it accepts no responsibility and disclaims all liability (save for liability which cannot be lawfully disclaimed) for loss or damage whatsoever suffered or incurred by any other person resulting from the use
of, or reliance upon, the data or information contained herein. Copyright in this publication is owned by IBISWorld Inc. The publication is sold on the basis that the purchaser agrees not to copy the material contained within it for other than the purchasers own purposes. In the event that the purchaser uses or quotes from the material in this publication – in papers, reports, or opinions prepared for any other person – it is agreed that it will be sourced to: IBISWorld Inc.
At IBISWorld we know that industry intelligence is more than assembling factsIt is combining data with analysis to answer the questions that successful businesses askIdentify�high�growth,�emerging�&�shrinking�marketsArm�yourself�with�the�latest�industry�intelligenceAssess�competitive�threats�from�existing�&�new�entrantsBenchmark�your�performance�against�the�competitionMake�speedy�market-ready,�profit-maximizing�decisions
Who�is�IBISWorld?We are strategists, analysts, researchers, and marketers. We provide answers to information-hungry, time-poor businesses. Our goal is to provide real world answers that matter to your business in our 700 US industry reports. When tough strategic, budget, sales and marketing decisions need to be made, our suite of Industry and Risk intelligence products give you deeply-researched answers quickly.
IBISWorld�MembershipIBISWorld offers tailored membership packages to meet your needs.
Copyright 2012 IBISWorld Inc
www.ibisworld.com��|��1800-330-3772��| ��[email protected]