Іi. electronic communications networks and …Іi. electronic communications networks and services...
TRANSCRIPT

ІI. ELECTRONIC COMMUNICATIONS NETWORKS AND SERVICES 19
1. Voice telephone services 19
1.1. Fixed voice telephone services 20
1.2. Mobile voice telephone services 25
1.3. Voice services via non-geographic numbers with national destination code 099x provided via networks for broadband wireless access (BWA) by means of radio frequency spectrum
34
2. Leased lines services 34
2.1. Market players 34
2.2. Volume of the market and market shares 35
3. Data transfer and Internet access 38
4. Transmission and/or broadcasting of radio and/or television programs services 42
4.1. Structure of market segment "Transmission and/or distribution of radio and/or TV programs services"
42
4.2. Retail distribution of radio and TV programs 44
4.3. Terrestrial radio relay transmission and terrestrial broadcasting 52
4.4. Wholesale provision of transmission and/or distribution of radio and/or TV programs and IPTV
54
5. Bundled services 56
6. Provision of universal service 62
6.1. Assignment of the universal service 62
6.2. Provision of the universal service on the entire territory of the country 62
6.3. Connection to the public telephone network at a fixed location and access to public telephone services
63
6.4. Public payphones of specified quality that allow making free of charge calls to emergency numbers
64
6.5. Telephone directory, telephone enquiry services 65
6.6. Affordability of the universal service prices 65
6.7. Quality of the universal service provision 66
6.8. Complaints and complaint resolution 67
6.9. Compensation of net costs accrued due to the universal service provision 69
6.10. Prospects for development of the universal service 69

19
ІI. ELECTRONIC COMMUNICATIONS NETWORKS AND SERVICES 1. Voice telephone services
In 2012, the volume of market segment "Voice telephone services" amounted to BGN 1.840 billion, which is a drop of 10.77% as compared to the year before. The voice services segment includes the provision of fixed voice services through geographic numbers from the NNP, the provision of public telephone service via the "carrier selection" service, telephone services via public payphones, mobile voice service through numbers from the NNP and other voice services. Revenue from the "other voice services" position is mainly formed from the provision of VoIP
1 and voice service through numbers with national destination code 99х.
The information about the number of undertakings which provided services in this market segment in 2012, the number of their subscribers/lines who used voice telephone services, and the revenue from services provided is presented in Table 2.
Table 2 Number of undertakings, subscribers/lines and revenue by type of voice telephone
services provided in 2012
Source: Data submitted to CRC
In 2012, the total number of undertakings which declared activity on providing fixed telephone service amounted to 25
2, which is by 2 more than the year before. A decrease was
reported in the number of undertakings which submitted information that they have been providing other voice services (mainly VoIP) – from 28 in the preceding year to 24 in 2012. The
1 Voice IP service where numbers (geographic or non-geographic) from the NNP are not used, the service
has no guaranteed quality and the user must use/have Internet access through the respective device -
computer/telephone. 2 SPECTRUM NET EAD is not included in the number of active undertakings at the end of 2012, since this
undertaking carried out activity until its merger into MOBILTEL EAD on 09.11.2012; the revenue
generated by the undertaking is included in the total volume of revenue from the provision of fixed
telephone service through numbers from the NNP in 2012.
Total 1 incl. bundled service subscribers
1. Fixed voice service 3 /// /// /// 308.957
1.1. Fixed voice service through numbers from the NNP and the carrier selection" service 25 2,074,410* 642,450 306.673
1.2. Telephone services through public payphones 3 11,080** /// 2.284
2. Mobile voice service through numbers from the NNP 3 10,780,732 1,362,727 1,523.807
3. Other voice services 4 24 /// /// 7.079
Total /// /// 1,839.843 1
Incl. bundled service subscribers 2
Excl. revenue from bundled services 3 One of the undertakings providing fixed voice telephone service through geographic numbers also provided telephone services through public payphones
4 Incl. VoIP, voice service through numbers with national destination code 099x and other (resale, trade agency)
* Number of lines of fixed telephone service subscribers ** Number of public payphones / booths
Number of subscribers/lines as of 31.12.2012
Number of undertakings providing the service as of 31.12.2012
Revenue (in million BGN,
VAT excl.) 2 Name of the service

20
total number of undertakings which declared activity on providing telephone service through public payphones/phone booths at the end of the year remained unchanged, compared to the previous year – 3. Actually, in 2012, activity was carried out by 4 undertakings, but at the end of the year one of them declared that it had no public payphones/phone booths. The number of undertakings providing voice telephone service remained 3 in 2012.
Figure 13 shows the distribution of revenue from different services in the segment volume. As it is clear from the presented data, in 2012, the breakdown of revenue by types of services in the market segment "voice telephone services" did not undergo any significant change, compared to the year before.
Source: Data submitted to CRC
Figure 13
For another consecutive year the mobile voice service hold the highest share in revenue generated from voice services (82.8%), followed by fixed voice service through numbers from the NNP and the "carrier selection" service with 16.7%, as the relative share formed by revenue from fixed voice service rose by 1.2 percentage points at the expense of the share of revenue from mobile voice service which registered a drop of 1.3 percentage points. The share of revenue from public payphones remains unchanged compared to the year before, and revenue from other voice services was up by only 0.1 percentage points.
1.1. Fixed voice telephone services
1.1.1. Players on the fixed telephone service market
Undertakings providing services included in segment "fixed voice telephone services" can generally be divided in two groups:
undertakings providing public electronic communications under an authorization regime through the use of individually assigned scarce resource - numbers. This group comprises undertakings providing access to public telephone service through geographic numbers and through the “carrier selection” service and undertakings providing services through non-
16.7%
0.1%
82.8%
0.4%
Structure of revenue by types of services on market segment "Voice telephone services" in 2012
Fixed voice service through numbers from NNP and “carrier selection” service Telephone services through public payphones Mobile voice service through numbers from NNP Other voice services

21
geographic numbers, telephone enquiry services, "transit" services, etc.
undertakings providing access to public telephone service via public payphones – the activity is carried out under a notification regime.
With respect to the first group of undertakings, it should be noted that in 2012 CRC issued authorizations for the use of individually assigned scarce resource – numbers for provision of public electronic communications to another three undertakings. In the beginning of 2012, PREMIUM NET INTERNATIONAL S.R.L was assigned geographic numbers from the NNP, as well as access code for value-added services. In the second half of 2012, access code for value-added services was given to one more undertaking - VOICECOM AD. Access code for the "carrier selection" service was given to the undertaking 669C EOOD.
Two of the undertakings providing access to fixed telephone service through geographic numbers in 2011 either did not carry out activity on providing this service in 2012 (SKAT TV OOD) or suspended their activity during the year (SPECTRUM NET EAD), as the latter was merged into MOBILTEL EAD. In 2012, SPECTRUM NET EAD and NEXCOM BULGARIA EAD suspended their activity on providing the service "access to public telephone service through the "carrier selection" service". At the same time, four undertakings started activity on providing public telephone service through geographic numbers from the NNP and access code for value-added services.
As a result, at the end of 2012, the number of undertakings which declared activity on providing fixed telephone services totaled 25. These are: IDT NETWORK AD, BLIZOO MEDIA AND BROADBAND EAD, BTC NET EOOD, BULGARIAN TELECOMMUNICATIONS COMPANY AD (BTC), VARNA NET OOD, VESTITEL BG AD, VMOBILE AD, VOICECOM AD, VOXBONE S.A., GLOBAL COMMUNICATION NET AD, GOLD TELECOM BULGARIA AD, ESCOM OOD, EASTERN TELECOMMUNICATION COMPANY AD, INTERBUILD OOD, INTEROUTE BULGARIA EAD, CABLE SAT-WEST OOD, COSMO BULGARIA MOBILE EAD, MOBILTEL EAD, NEXCOM-BULGARIA EAD, NET IS SAT OOD, NET-CONNECT INTERNET EOOD, NETFINITY EOOD, ORBITEL EAD, TELECOM 1 OOD and TERRA COMMUNICATIONS AD.
At the end of the year, the total number of undertakings which declared their intention to provide public telephone services via public payphones reached 15. Of them, only four undertakings declared before CRC that they carry out activity related to provision of this service during the year, as one of them suspended its activity at the end of 2012. The total number of active undertakings includes BTC which provides the “access to public telephone services via public payphones” service, as a part of its obligation to perform the universal service.
1.1.2. Change in the "fixed voice telephone service" segment
The total volume of revenue generated in 2012 from the provision of fixed telephone services
3, access to public telephone services through the "carrier selection" service, and access
to public telephone services through public payphones and phone booths, amounted to BGN 309.0 million. A drop was once again reported in the total volume of gained revenue, yet the decrease, compared to 2011, amounted to 3.8%, which is less than the previous period 2010 – 2011, when the reported drop was 15.8%.
The total outgoing traffic (measured in minutes) originated by subscribers4 from national
(local and long-distance calls, calls to land mobile networks, to networks for broadband wireless access, and to non-geographic numbers) and international calls also dropped. The decline in 2012, compared to 2011, was 10%, which is by 0.5 percentage points more than the decrease for the period 2010-2011.
3 Excluding revenue from installation fees and monthly subscriptions for bundled services which include
fixed telephone services. 4 Includes traffic originated by subscribers of fixed telephony services, including the "carrier selection"
service, as well as traffic from calls originated from public payphones.

22
In 2012, consumption of the "carrier selection" service continued to shrink. The volume of traffic generated by the use of the "carrier selection" service was down to half the traffic in 2011, and its share in the volume of telephone traffic originated by subscribers of fixed telephone service reached only 0.2%.
The market share of the incumbent, calculated on the basis of revenue5 from the
provision of public telephone service via fixed network and "carrier selection" service, dropped by 3.9 percentage points in 2012, compared to 2011, and reached 87.3%.
1.1.3. Fixed telephone lines
According to data submitted to CRC, the number of undertakings which provided access to fixed telephone service through geographic numbers from the NNP at the end of 2012 reached 20, and 3 of them also offered access to public telephone service via the "carrier selection" service.
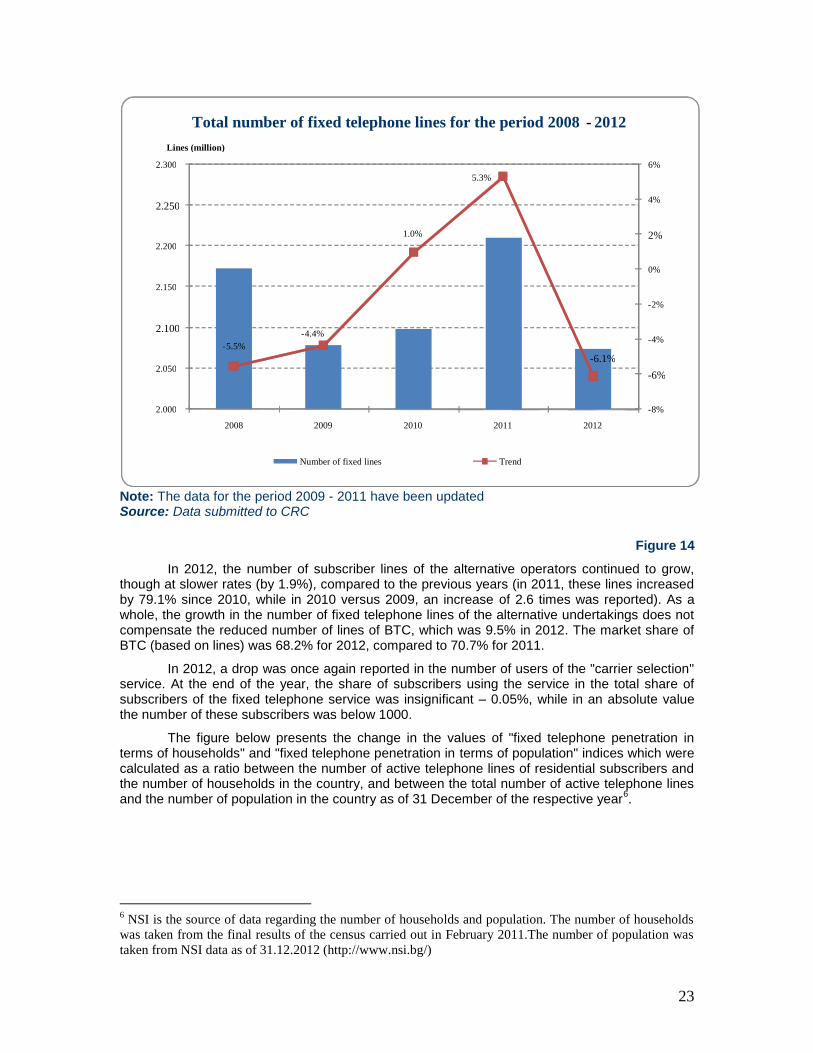
Following the increase in the number of fixed telephone lines in the period 2010 – 2011, a drop of 6.1% was registered at the end of 2012, compared to the year before, and this indicator nearly reached the level of 2009. The data submitted by undertakings providing access to end users to the fixed telephone service show that in 2012 the trend towards increase in the number of subscribers of fixed telephone lines with access via mobile networks and of those using the fixed telephone service in bundle with other electronic communication services has been slowing down for the past two years. The number of subscribers using fixed telephone service in bundle with another electronic communication service grew only by 1.8% during the year, compared to the nearly double increase in 2011. Fixed telephone lines with access via mobile networks registered an insignificant rise in 2012 – only 0.01%, as in the preceding year the number of these lines was up by 1.4 times, compared to 2010.
5 Using revenue from the provision of access to fixed telephone service (excl. revenue from monthly
subscriptions for bundled services which include fixed telephone service), retail traffic revenue and other
retail revenue from telephone service subscribers, wholesale interconnection services revenue, as the
revenue generated from the provision of the "international transit" service are taken into account after
deduction of the expenditure for traffic termination.
23
Note: The data for the period 2009 - 2011 have been updated Source: Data submitted to CRC
Figure 14
In 2012, the number of subscriber lines of the alternative operators continued to grow, though at slower rates (by 1.9%), compared to the previous years (in 2011, these lines increased by 79.1% since 2010, while in 2010 versus 2009, an increase of 2.6 times was reported). As a whole, the growth in the number of fixed telephone lines of the alternative undertakings does not compensate the reduced number of lines of BTC, which was 9.5% in 2012. The market share of BTC (based on lines) was 68.2% for 2012, compared to 70.7% for 2011.
In 2012, a drop was once again reported in the number of users of the "carrier selection" service. At the end of the year, the share of subscribers using the service in the total share of subscribers of the fixed telephone service was insignificant – 0.05%, while in an absolute value the number of these subscribers was below 1000.
The figure below presents the change in the values of "fixed telephone penetration in terms of households" and "fixed telephone penetration in terms of population" indices which were calculated as a ratio between the number of active telephone lines of residential subscribers and the number of households in the country, and between the total number of active telephone lines and the number of population in the country as of 31 December of the respective year
6.
6 NSI is the source of data regarding the number of households and population. The number of households
was taken from the final results of the census carried out in February 2011.The number of population was
taken from NSI data as of 31.12.2012 (http://www.nsi.bg/)
- 5.5% - 4.4%
1.0%
5.3%
- 6.1%
- 8%
- 6%
- 4%
- 2%
0%
2%
4%
6%
2.000
2.050
2.100
2.150
2.200
2.250
2.300
2008 2009 2010 2011 2012
Lines (million)
Total number of fixed telephone lines for the period 2008 - 2012
Number of fixed lines Trend

24
Source: Data submitted to CRC
Figure 15
As Figure 15 clearly shows, both indices reported a drop, compared to the year before. The value of the "fixed telephone penetration in terms of households" index decreased by 4%, and the "fixed telephone penetration in terms of population" index reported a decline of 2%.
1.1.4. Public payphones
The number of public payphones and phone booths amounted to 11,080 as of 31.12.2012, which is by 2.4% less than the end of the preceding year (Figure 16).
29 % 27 % 28 % 30 %
28 %
62 % 60 % 59 %
62 % 58 %
0 %
10 %
20 %
30 %
40 %
50 %
60 %
70 %
2008 2009 2010 2011 2012
Fixed telephone penetration by population and households for the period 2008 - 2012
Fixed telephone penetration by population Fixed telephone penetration by households

25
Source: Data submitted to CRC
Figure 16
For another consecutive year, the value of the "number of public payphones per 1,000 residents" index did not register significant change, as it amounted to 1.52, compared to 1.55 in 2011.
1.2. Mobile voice telephone services 1.2.1. Market players
At the end of 2012, three undertakings actually provided mobile voice telephone services on the Bulgarian market via networks operating in bands 900 MHz, 1800 MHz and 2 GHz – MOBILTEL EAD, COSMO BULGARIA MOBILE EAD and BTC.
1.2.2. Network coverage
The table below presents information about the coverage as of 31.12.2012 of terrestrial mobile networks operating in bands 900 MHz, 1800 MHz and 2 GHz.
Table 3
Undertaking Index
Mobiltel EAD Cosmo Bulgaria Mobile
EAD BTC
GSM UMTS GSM UMTS GSM UMTS
Coverage by territory
99.38% 96.60% 99.48% 76.51% 99.37% 95.95%
Coverage by population
99.99% 99.46% 99.98% 94.81% 99.99% 99.41%
Source: Data submitted to CRC
14 315
12 109
11 551 11 355 11 080
8 000
10 000
12 000
14 000
2008 2009 2010 2011 2012
Total number of public payphones for the period 2008 - 2012

26
Mobile undertakings continued to invest in their UMTS networks, which already cover nearly 95% of the country’s population. At the end of the year, MOBILTEL EAD was the undertaking with the largest UMTS coverage per population, while the three undertakings had almost the same coverage of GSM standard. On the other hand, the greatest growth in the UMTS coverage by territory was reported by BTC (almost 9 percentage points), followed by MOBILTEL EAD (7 percentage points) and COSMO BULGARIA MOBILE EAD (4 percentage points).
The considerable growth in the number of active base stations of UMTS standard should also be noted, as they reached a total of 3,410 for the three undertakings as of 31.12.2012. To compare with, their number was 2,014 as of 31.12.2011. Base stations of GSM standard increased only by 4.4%, yet their total number outstripped the number of stations of UMTS standard and reached 7,584 as of 31.12.2012.
1.2.3. Development of the voice telephone services market
Dynamics and development of the market
The total revenue from the provision of mobile telephone services reported another drop: for the reviewed period, it was down by 12.1%, reaching BGN 1.524 billion at the end of 2012.
7
The reported decline in revenue of mobile undertakings is a result of the unfavourable economic situation in the last several years, the long-term effects, such as saturation of the traditional voice services markets and their entering into the maturity stage, as well as the reduction of termination rates on individual mobile networks imposed by Decision 1362 of CRC as of 31.05.2012. Another significant factor for this drop which should be noted is the increased consumption of mobile telephone services offered in bundle with other electronic communication services, since the above amount includes revenue from monthly subscriptions for mobile telephone service offered as a standalone service. The number of subscribers of bundled services including mobile telephone services increased by 20.6% at an annual basis as of 31.12.2012, and they have already composed 12.6% of the total number of mobile telephone services users.
It is important to note that in 2012 the total retail revenue8 from the originated outgoing
calls by the mobile undertakings subscribers registered a drop of 17.5% since the year before. Taking into account the growth in the number of mobile telephone services users (Figure 17), we may say that in 2012, mobile voice services have become more affordable to users, as one of the main factors for this trend is precisely the reduction of wholesale termination rates on individual mobile networks.
At the end of the year, the number of active voice SIM cards was 10,780,7329 - up by
2.9% since the end of 2011 (Figure 17)
7 Includes revenues from mobile voice telephone services and supplementary services related to the mobile
voice service (such as SMS, MMS, video calls, information services, etc.), except for revenue from
monthly subscriptions for mobile telephone services provided bundled with other electronic communication
services. 8 Including revenue from calls originated within the same network, to other national mobile networks, to
national fixed networks, to national networks for broadband wireless access (BWA), and to international
networks. 9 Including the number of active SIM cards allowing the use of voice services and with 12-month validity
of prepaid cards. Excluding the data transfer cards not allowing the making of voice calls.

27
Note: In connection with the final data on the number of population at the end of 2010 and the end of 2011 published by NSI
10, the index of penetration of mobile voice services per population
for 2010 was recalculated, compared to the data published in the CRC’s Annual Report for 2010.
Source: Data submitted to CRC
Figure 17
In 2012, as a result of the increase in the total number of subscribers of mobile telephone services and the decline in the number of population
11, the index of mobile telephone density also
registered a growth of 5 percentage points since 2011, thus reaching 148%.
Ratio between users of prepaid services and contract subscribers
The number of contract subscribers in Bulgaria continues to exceed the number of pre-paid service subscribers whose share in the total number of subscribers of mobile voice services retained its 2011 level of 37% (Figure 18).
10
http://www.nsi.bg/ORPDOCS/Pop_6.1.1_Pop_DR.xls 11
According to data of NSI: http://www.nsi.bg/otrasal.php?otr=19&a1=376&a2=377&a3=378#cont
135 . 9 % 143 . 0 % 148 . 0 %
0
2 000 000
4 000 000
6 000 000
8 000 000
10 000 000
12 000 000
0 . 0 %
30 . 0 %
60 . 0 %
90 . 0 %
120 . 0 %
150 . 0 %
180 . 0 %
2010 2011 2012
N
um
ber
of
sub
scri
ber
s
Pen
etra
tio
n
Number of subscribers and penetration of mobile voice telephone services in Bulgaria for the period 2010 - 2012
Subscribers of mobile telephone services Mobile telephone density

28
Note: The 2010, 2011 and 2012 data do not take into account mobile data card services which do not allow voice calls. The ratios for preceding years were calculated on the basis of data concerning all cards due to lack of comparative information.
Source: Data submitted to CRC
Figure 18
It should be noted that over half (51.1%) of the new subscribers activated during the year were under contract.
Subscribers of services provided under different trademark12
In 2012, a considerable growth was reported in the number of subscribers of services provided under different trademark - as the chart in Figure 19 clearly shows, this increase is around 58%, compared to the preceding year. Their share in the total number of SIM cards allowing the use of voice services grew by a little over 2 percentage points – from 4.1% in 2011 to 6.3% in 2012.
12
Different trademarks are both trademarks owned by the undertaking (such as Loop, Frog Mobile) and
trademarks owned by other legal entities (such as Petrol Mobile and Alo, Da!). In 2012, BTC did not offer
services provided under different trademark.
52 %
59 %
62 %
63 %
63 %
48 %
41 %
38 %
37 %
37 %
0 2 000 000 4 000 000 6 000 000 8 000 000 10 000 000
2008
2009
2010
2011
2012
Ratio between users of prepaid services and contract subscribers for the period 2008 - 2012
Contract subscribers Users of prepaid services

29
Source: Data submitted to CRC
Figure 19
Distribution of revenue from services provided via mobile networks operating in bands 900 MHz, 1800 MHz and 2 GHz
As the data presented on Figure 20 clearly shows, voice telephony remained the main revenue source for undertakings, as it forms approximately 30.7% of the total amount of revenue from mobile services.
10 475 083 10 780 732
431 676 681 989
0
2 500 000
5 000 000
7 500 000
10 000 000
12 500 000
2011 2012
Number of subscribers
Subscribers of mobile services provided under different trademark
Total number of active SIM cards allowing the use of voice services
Number of subscribers of mobile services provided under diffeent trademark

30
Source: Data submitted to CRC
Figure 20
However, it should be taken into account that the actual share of voice services is even higher because revenue from calls included in the free-of-charge minute plans is reported as revenue from monthly subscription – in 2012, this revenue increased by 5.5 percentage points, as compared to 2011, and comprised 38.1% of the total revenue. The share of additional services related to the provision of the telephone service remained stable.
The breakdown of the outgoing traffic (Figure 21) generated by the subscribers of mobile undertakings clearly shows that traffic is closed within the same mobile network, as its relative share of the total generated retail traffic on mobile networks formed 85.5%. The volume of the outgoing traffic to other mobile networks is almost eight times lower than the one within its own mobile network. The relative share of the outgoing traffic to fixed networks is only 2.2% of the total generated traffic in 2012.
6.3% 6.8% 7.2%
35.0% 32.8% 30.7%
4.2% 4.7%
4.5%
31.5% 32.6%
38.1%
23.0% 23.1%
19.5%
0
500
1 000
1 500
2 000
2010 2011 2012
Revenue (million BGN)
Distribution of revenue from the provision of mobile telephone services for the period 2010 - 2012
Wholesale services (interconnection) Installation fees, monthly subscriptions and one-off payments SMS and MMS Telephone calls Other (roaming, voice mail, enquiry services, etc.)

31
Source: Data submitted to CRC Figure 21
The data displayed on Figure 23 show that the total number of sent multimedia messages (MMS) rose by 25.7% compared to 2011, while the number of sent short text messages (SMS) was a little over 9% higher than the year before.
Source: Data submitted to CRC Figure 22
576 627 101 661 978 975 673 698 395
895 866 736
979 171 448
4 109 463 5 221 347 5 533 760 6 180 558 7 768 011
0
100 000 000
200 000 000
300 000 000
400 000 000
500 000 000
600 000 000
700 000 000
800 000 000
900 000 000
1 000 000 000
1 100 000 000
2008 2009 2010 2011 2012
Number of SMS and MMS sent for the period 2008 - 2012
Sent SMS Sent MMS
Breakdown of outgoing traffic on terrestrial mobile
networks in 2012
To international
networks
1.5%
To national
fixed networks 2.2%
To other mobile networks
(OFF NET) 10.8%
Within the network (ON NET)
85.5%
32
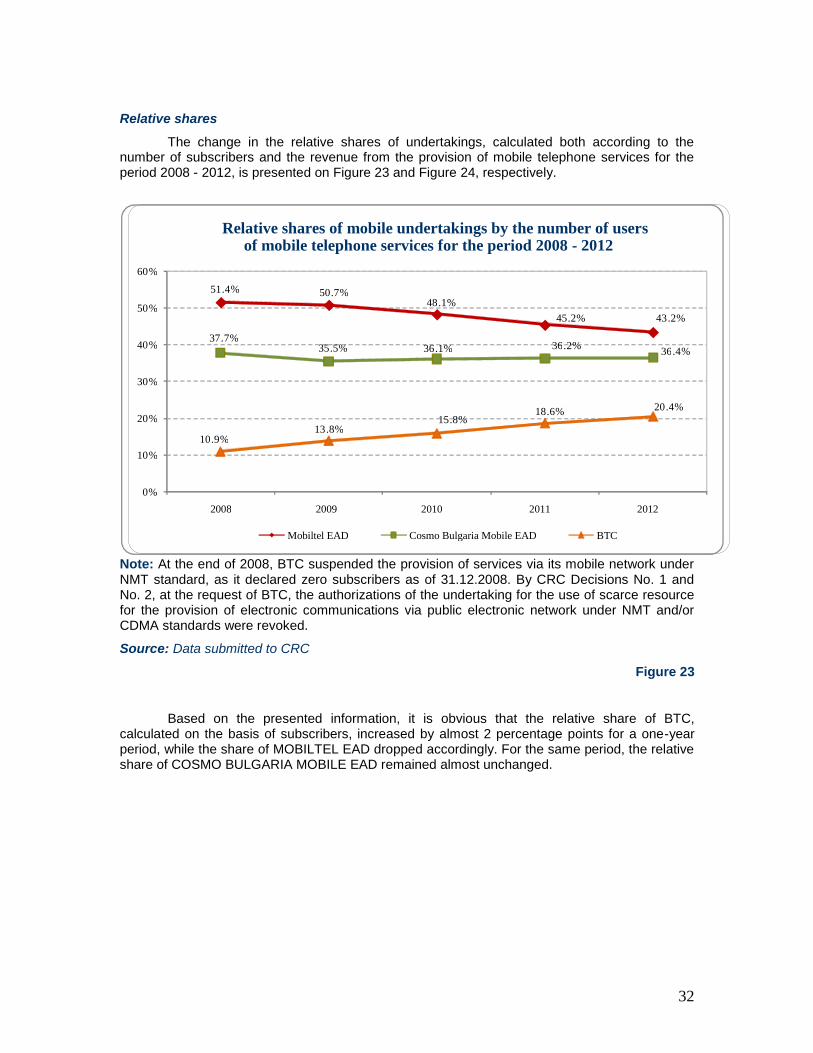
Relative shares
The change in the relative shares of undertakings, calculated both according to the number of subscribers and the revenue from the provision of mobile telephone services for the period 2008 - 2012, is presented on Figure 23 and Figure 24, respectively.
Note: At the end of 2008, BTC suspended the provision of services via its mobile network under NMT standard, as it declared zero subscribers as of 31.12.2008. By CRC Decisions No. 1 and No. 2, at the request of BTC, the authorizations of the undertaking for the use of scarce resource for the provision of electronic communications via public electronic network under NMT and/or CDMA standards were revoked.
Source: Data submitted to CRC
Figure 23
Based on the presented information, it is obvious that the relative share of BTC, calculated on the basis of subscribers, increased by almost 2 percentage points for a one-year period, while the share of MOBILTEL EAD dropped accordingly. For the same period, the relative share of COSMO BULGARIA MOBILE EAD remained almost unchanged.
51 . 4 % 50 . 7 % 48 . 1 %
45 . 2 % 43 . 2 %
37 . 7 % 35 . 5 % 36 . 1 % 36 . 2 %
36 . 4 %
10 . 9 % 13 . 8 %
15 . 8 % 18 . 6 % 20 . 4 %
0 %
10 %
20 %
30 %
40 %
50 %
60 %
2008 2009 2010 2011 2012
Relative shares of mobile undertakings by the number of users of mobile telephone services for the period 2008 - 2012
Mobiltel EAD Cosmo Bulgaria Mobile EAD BTC

33
Note: At the end of 2008, BTC suspended the provision of services via its mobile network under NMT standard, as until then it had generated revenue with a relative share displayed on the chart in Figure 24. Source: Data submitted to CRC
Figure 24
When looking into the relative shares by revenue13
, cash flows from the provision of mobile voice telephone services are once again seen as undergoing reshuffle. For a one-year period, the relative share of MOBILTEL EAD decreased by 4 percentage points, while BTC reported a corresponding growth in the same index, and the value of the index for COSMO BULGARIA MOBILE EAD remained unchanged.
Undertakings with significant market power
With Decision No. 1362/31.05.2012, as a result of the second round of definition, analysis and assessment of the wholesale market for voice call termination on individual mobile networks, CRC designated MOBILTEL EAD, COSMO BULGARIA MOBILE EAD and BTC as the undertakings having significant power on the wholesale market for voice call termination on their respective mobile networks. In accordance with the adopted by CRC glide path for reduction, call termination rates in the networks of the three undertakings were reduced by an average of 57.6%
14, as of 01.07.2012.
13
Market shares were calculated based on revenue from mobile voice services and additional services
related to the mobile voice service (such as SMS, MMS, video calls, information services, etc.). The 2010,
2011 and 2012 data exclude the revenue from monthly subscriptions for mobile telephone service provided
bundled with other electronic communication services. 14
Calculated based on the weighted average values of the price caps imposed by CRC for off-peak and
peak traffic, respectively, with weights for each separate undertaking in accordance with the traffic
terminated on its own network in 2012.
54 . 5 % 53 . 1 %
51 . 5 % 48 . 5 %
44 . 6 %
36 . 1 % 35 . 5 % 34 . 4 %
36 . 1 % 36 . 1 %
9 . 3 % 11 . 4 % 14 . 1 % 15 . 4 % 19 . 3 %
0 . 03 % 0 %
10 %
20 %
30 %
40 %
50 %
60 %
2008 2009 2010 2011 2012
Relative shares of mobile undertakings according to the revenue from wholesale and retail provision of mobile telephone services for the period
2008 - 2012
Mobiltel EAD Cosmo Bulgaria Mobile EAD BTC (under GSM/UMTS) standards
BTC (under NMT/CDMA) standards

34
1.3. Voice services provided via networks for broadband wireless access (BWA) by means of radio frequency spectrum
The networks for broadband wireless access (BWA) by means of radio frequency spectrum allow the provision of voice telephone services through geographic and non-geographic numbers and services related to broadband wireless Internet access. During the year, their development was characterized by an intensified interest and significantly increased number of subscribers of the broadband Internet access and subscribers of voice services.
As of 31.12.2012, four undertakings were licensed to build electronic communications networks for broadband wireless access (BWA): MAX TELECOM OOD, NEXCOM BULGARIA EAD, MOBILTEL EAD and CARRIER BG AD, of which commercial activity was carried out by MAX TELECOM OOD and NEXCOM BULGARIA EAD. MAX TELECOM provided voice services through non-geographic numbers with national destination code 099x, and NEXCOM BULGARIA EAD provided telephone services via fixed network - fixed terminal points, therefore their subscribers and revenue are included in the "fixed voice telephone service" segment.
As of 31.12.2012, the subscribers of voice services with destination code 099х increased by 141%, compared to the number of subscribers at the end of 2011. It should be noted that in 2012 MAX TELECOM OOD also declared to have been providing bundled services - 86% of the subscribers of voice services provided via the networks for broadband wireless access are subscribers of bundled services including Internet access. In spite of this growth, their number continues to occupy an insignificant share in the total number of subscribers of public voice telephone services, as it hardly reached 0.02%. The revenues
15 reported a decline of 88.3%
which is due to the reduced revenue from wholesale services as a result of the suspended provision of the "transit of incoming international calls" service.
Revenues from retail services formed 30% of the total revenue, and reported an increase of 70% since 2011. This growth is mainly due to the increased number of subscribers and intensified consumption which generated higher traffic revenue. However, this does not mean that there is an increased interest in voice services via networks for broadband wireless access (BWA). On the contrary - their development continues to be difficult and unpopular among the end users in Bulgaria. In the near future, this trend is expected to remain, as more hopes are laid on the development of 4G services through the building and exploitation of LTE networks. 2. Leased lines services
2.1. Market players
As of 31.12.2012, a total of 56 undertakings are included in the CRC List of undertakings that intend to provide the "leased lines" service, including "international leased lines". During the year, 12 new undertakings notified the Commission of their intention to provide this service. Three undertakings filed documents to terminate this activity.
According to the data submitted to CRC, in 2012, 4 of the undertakings that provided leased lines in 2011 suspended their activity related to the provision of this service (VARNA LAN OOD, RACOM AD, SUNNY BEACH AD and SPECTRUM NET EAD – due to its merger into MOBILTEL AD), while another 2 (PRONET TELECOM OOD and TELECABLE AD) started providing the service. As a result, at the end of 2012, 18 undertakings were active on the market segment of leased lines, nine of them provided the service at both retail and wholesale level (Table 4).
15
The used revenues are: non-traffic revenue (revenue from monthly subscriptions for separate services and
bundled services concerning telephony service only) and traffic revenue from retail and wholesale services.
Revenue from monthly subscription for bundled services is not included.

35
Table 4
Undertakings which provided the "leased lines" services for the period 2010 - 2012
Source: CRC Public Register and data submitted to CRC
2.2. Volume of the "leased lines" segment and relative shares
According to data submitted by the undertakings providing leased lines, the total revenue from the provision of leased lines reached nearly BGN 42.41 million in 2012
16, which represents
a drop of approximately 3.11%, compared to 2011.17
16
Including revenue from providing the service earned by SPECTRUM NET EAD and RACOM AD until
the time they suspended their activity in 2012. Revenue generated by RACOM AD is presented only in the
"Total revenue" position. 17
According to 2012 annual questionnaire on activity reporting, undertakings that offer international leased
lines are required to declare only the revenues from the national sections of the lines.
wholesale
retail
wholesale
retail
whole
sale
retail
ITD NETWORK AD BLIZOO MEDIA AND BROADBAND EAD BULGARTEL EAD BULGARIAN TELECOMMUNICATIONS COMPANY AD
VARNA LAN OOD VESTITEL BG AD GLOBAL COMMUNICATION NET AD NBI SYSTEMS OOD COSMO BULGARIA MOBILE EAD MOBILTEL EAD NETERRA EOOD NETSTAR TELECOM NETWORX BULGARIA OOD NOVATEL EOOD
PANTEL INTERNATIONAL PLADI COMPUTERS OOD RACOM AD PRONET TELECOM SUNNY BEACH AD SOFIA COMMUNICATIONS EAD SOFIA ONLINE EOOD TELECABLE SPECTRUM NET AD* TELNET OOD
Number of active undertakings providing wholesale and retail leased lines:
16 11 19 11 17 10
Total number of active undertakings:
Undertaking
2010 2011
18
2012
18 20

36
Figure 25 displays the distribution of revenue generated from the provision of leased lines (wholesale and retail) for the period 2010 – 2012.
Source: Data submitted to CRC
Figure 25
Regardless of the reported decrease in the total revenue from the provision of leased lines in 2012 since the year before, the structure in terms of wholesale and retail service provision is retained. In 2012, the share of revenue from the provision of wholesale leased lines in the total volume amounted to 71.6%, as revenue from the provision of the service dropped by 4.76%. On its part, revenue from the provision of retail leased lines formed 28.4% of the total revenue, as reduction of 0.64 % was reported for a one-year period.
The total number of wholesale and retail leased lines provided in 2012 in general, decreased by 14.73%, compared to the previous year. This is mainly due to the decrease in the number of provided wholesale leased lines (28.8%). The number of retail leased lines also registered a drop, yet only by 3.53%.
Figure 26 displays the distribution of the number of wholesale and retail leased lines provided for the period 2010 – 2012.
16.65
12 . 06 11.98
32 . 18 31 . 71 30.20
0 . 00
10 . 00
20 . 00
30.00
40.00
2010 2011 2012
(million BGN)
Revenue (million BGN) from leased lines for the period 2010 - 2012
Revenue from retail leased lines Revenue from wholesale leased lines

37
Source: Data submitted to CRC
Figure 26
As the chart clearly shows, the structure of leased lines provided in the period under review did not undergo significant change, and in 2012 the share of retail leased lines represents 63.1% of the total number of lines.
Figures 27 and 28 display the relative shares of BTC and the alternative undertakings calculated on the basis of generated revenue and number of leased lines provided for the period 2010 – 2012.
Source: Data submitted to CRC
Figure 27
Source: Data submitted to CRC
Figure 28
57.2% 45.2% 48.9%
42.8% 54.8% 51.1%
0%
20%
40%
60%
80%
100%
2010 2011 2012
Relative shares of BTC and the alternative undertakings calculated
based on number of lines for the period 2010 -2012
BTC Alternative undertakings
61.5% 55.6% 57.0%
38.5% 44.4% 43.0%
0%
20%
40%
60%
80%
100%
2010 2011 2012
Relative shares of BTC and the alternative undertakings calculated
based on revenue for the period 2010 -2012
BTC Alternative undertakings
6 585 6 258 6 037
3 809
4 967
3 535
0
2 000
4 000
6 000
8 000
10 000
2010 2011 2012
(Number) Number of leased lines for the period 2010 - 2012
Retail leased lines Wholesale leased lines

38
The calculated values of the relative shares show that no significant changes were observed in the reviewed period. In terms of revenue earned from this service, BTC retained a market share of over 55%, as this share grew by 1.4 percentage points for a one-year period. As for the "number of lines" indicator, as Figure 28 above clearly shows, the market share of BTC fell by 8.3 percentage points for the reviewed period, and reached a little below 50% at the end of the period.
Figures 29 and 30 display the trend in the wholesale and retail leased lines with alternative and traditional interface for the reviewed period.
Source: Data submitted to CRC
Figure 29
Source: Data submitted to CRC
Figure 30
In the period 2010 – 2012, the share of traditional leased lines in the total volume (traditional and alternative) changed from 61.3% at the beginning of the period to 50.6% in 2012. For the alternative ones, the change is from 38.7% in 2010 to 49.4% at the end of the period.
Retail leased lines registered a trend towards a gradual reduction in the number of lines with traditional interface and their replacement with leased lines with Ethernet interface. The decreased number of leased lines with Ethernet interface in 2012, compared to 2011, is mainly due to the merger of SPECTRUM NET EAD into MOBILTEL EAD, since in 2011 over 60% of the lines provided by SPECTRUM NET EAD were used by MOBILTEL EAD.
In the past year, a distinctive process of migration on part of users from traditional to alternative leased lines (based on Ethernet network protocol) was observed. These lines have functional characteristics analogous to the traditional leased lines, in addition to a series of advantages: comparable price, flexible and easy control and maintenance, cheap terminal devices and much higher traffic rate.
3. Data transfer and Internet access Services related to Internet access and data transfer in the country continued to undergo a dynamic development. In 2012, the total number of undertakings registered with CRC for their intention to provide these services was 874. The number of undertakings which actively provided Internet access and data transfer services stood at 633, down 2% from 2011. Information on the number of undertakings that provided Internet access and data transfer services, the number of their subscribers/users, and on the volume of revenue generated from them, along with the structure of the segment, is presented in Table 5:
4 357
2 011
3 691
1 680
3 612
1 232
0
1 000
2 000
3 000
4 000
5 000
retail wholesale
Number of leased lines with traditional interface for the period 2010 - 2012
2010 2011 2012
2 228 1 798
2 567
3 287
2 425 2 303
0
1 000
2 000
3 000
4 000
5 000
retail wholesale
Number of leased lines with alternative interface for the period 2010 - 2012
2010 2011 2012

39
Table 5 Number of subscribers/users and revenue by type of Internet access and data transfer
services provided in 2012
Revenue from Internet access and data transfer18
services provided in 2012 reported an increase of 9.78%, reaching BGN 346.962
19 million. According to data submitted to CRC,
revenue from wholesale services (sale of Internet capacity, MAN connectivity, bitstream access and unbundled access to subscriber line) amounted to BGN 35.177 million and increased by 2.54% compared to the preceding year. Revenue from retail Internet access and data transfer amounted to BGN 312 million, up by 10.7% since 2011.
In the past year, the number of Internet access services users in the country grew significantly. As of 31.12.2012, the total number of Internet services’ subscribers (fixed and mobile Internet access) reached 1,904,934
20, up 18.7% compared to 31.12.2011. The number of
subscribers of fixed Internet access (including bundled services) reached 1,308,529. The increased number of subscribers of Internet access services is due to the considerable growth of active subscribers of mobile Internet access services through data cards or modems, where a rise of 68.6% was registered for a one-year period.
18
Including revenue from services provided stand-alone related to retail Internet access (fixed and
wireless), retail data transfer and wholesale services (capacity for Internet connectivity, wholesale access
services, co-location of equipment for provision of Internet access lines, wholesale data transfer services). 19
According to an expert estimation based on data submitted to CRC by 89.1% of registered undertakings. 20
According to an expert estimation based on data submitted to CRC by 89.1% of registered undertakings.
Total 1 incl. bundled services subscribers
1. Retail Internet access and data transfer services /// /// /// 311.785
1.1. Internet access, 3 incl.: 633 1, 904,934 1,503,998 269.184
1.1.1. Fixed 555 1,308,529 /// ///
1.1.2. Wireless 164 596,405 /// ///
- Mobile access with data cards or mdem 3 532,746 /// ///
- Satellite 1 /// /// ///
- Other type (WiMAX, RLAN, HomeBox) 163 /// /// ///
1.2. Data transfer services 64 /// /// 42.601 2. Wholesale services /// /// 35.177 2.1. Provision of capacity for Internet connectivity (Peering and Transit) 70 639 /// 20.723
2.2. Wholesale provision of Internet access lines 1 1 /// ///
2.3. Co-location of equipment for wholesale provision of Internet access lines
2 194 /// ///
2.4. Data transfer services 24 654 /// 12.059
Total /// /// /// 346.962
Name of the service
Number of undertakings providing the service in
2012
Number of subscribers/users as of 31.12.2012 Revenue
(in million BGN, VAT excl.) 2
1 Incl. bundled services subscribers
2 Excl. revenue from bundled services 3 Data on the total number of Internet access services and revenue are obtained according to an expert estimation based on data submitted to CRC
by 89.1% of registered undertakings.

40
At the end of 2012, Internet penetration rate among households in the country was 40.4%
21 compared to 37.6% at the end of the preceding year. On population basis, penetration as
of 31.12.2012 reached 26.2% compared to 17.6%22
a year ago. The fragmentation of the Internet segment (excluding mobile Internet via data cards or modem) is illustrated by the ranking of the 10 largest undertakings. According to CRC data, the total market share of the ten biggest Internet providers in the country (based on subscribers) reached 69.4% as of 31.12.2012, increase of 2.9 percentage from a year ago.
Table 6
Top 10 Internet providers based on subscribers for the period 2011 – 2012
Source: Data submitted to CRC As the data displayed on the above table show, a considerable growth was registered in the share of MOBILTEL EAD in the total number of subscribers of fixed Internet access which is due to the final contracts signed in 2012 for acquiring the ownership of MEGALAN NETWORK AD and SPECTRUM NET EAD.
The most spread ways for provision of retail broadband access in Bulgaria are via ADSL, cable networks for broadcasting of radio and television programs (CaTV), optical connectivity - FTTx (FTTH/B/C/N), access through the UMTS/HSDPA networks of mobile undertakings, and LAN networks. Other alternative platforms provided on the Bulgarian market, although less common, are wireless access via RLAN and WiMAX networks and satellite access. The figures below represent the breakdown of subscribers at a fixed location by the type of access at the end of 2011
23 and 2012.
21
For calculation of this index, the data on residential subscribers (mobile Internet via data cards and
modem is not taken into account) were compared to the total number of households in the country
according to Census 2011 carried out by NSI. 22
For calculation of this index, the NSI data on the population in the country as of 31.12.2012 and
31.12.2011 were used. 23
For comparison purposes, the data for 2011 have been recalculated.
2012 2011
BULGARIAN TELECOMMUNICATIONS COMPANY 1 1
BLIZOO MEDIA AND BROADBAND
2 2
MOBILTEL 3 7
BULSATCOM
4 3
MAX TELECOM
5 5
NET 1 6 6
NETWORX - BULGARIA
7 8
ESCOM 8 10
POWERNET 9 ///
TELECABLE 10 ///
TOTAL 69.4% 66.5%
Rank Undertaking

41
Source: Data submitted to CRC
Figure 31 Source: Data submitted to CRC
Figure 32
Unlike the remaining EU countries where the most popular access technology at a fixed location is DSL, the prevailing part of subscribers of fixed Internet access in Bulgaria (77.6%) use technologies alternative to DSL (Figure 32). The most common way for access in 2012 was optical connectivity with different distance between the network point and the end user (mainly FTTB/FTTN) which reported a growth of 5.9 percentage points for a one-year period, and at the end of 2012 made up 42% of the total number of fixed access subscribers. The second most frequently used technology on the Bulgarian market is АDSL. However, subscribers of this type of fixed access registered a decline of 4.7 percentage points since 2011. ADSL services are provided by the incumbent BTC (through its own network) and by ORBITEL EAD (based on bitstream access to the incumbent's network). The trend towards reduction in the number of subscribers of ORBITEL EAD using services based on bitstream access was preserved in 2012, as they constituted only 0.003% of all subscribers of fixed Internet access. At the end of 2012, the networks of LAN operators were used by 20% of the subscribers of fixed Internet access. In the past year, this type of access also registered a drop (nearly 2 percentage points) of the relative share of LAN subscribers in the total market structure, as this reduction is mainly at the expense of a growing share of subscribers of optical connectivity. One of the main criteria for Internet service quality is the access speed. As the data displayed on Figure 33 show, according to CRC data as of 31.12.2012, an increase of nearly 6 percentage points was observed in the number of users of fixed Internet access using access with international download speed from 30 Mbps to 99 Mbps. At the end of 2012, over 54% of the users in Bulgaria used speeds exceeding 20 Mbps. For comparison purposes, as of 31.12.2011, 50% of the fixed Internet services users had an international download speed exceeding 15 Mbps.
Breakdown of subscribers by type of fixed Internet access as of
31.12.2012
22.4%
20.8%
0.1% 4.5% 14.9%
37.3%
FTTB/N/C ADSL LAN CaTV FTTH other type of access
Breakdown of subscribers by type of fixed Internet access as of
31.12.2011
22.6%
14.3% 0.1% 2.1%
27.1%
33.8%
FTTB/N/C ADSL LAN CaTV FTTH other type of access

42
Source: Data submitted to CRC
Figure 33
The significant increase observed in the number of subscribers of mobile Internet access (via data cards and modems), the increased number of subscribers using bundled Internet access services, in addition to the migration from traditional access technologies to optical and hybrid networks are among the main trends in the segment outlined in 2012. In 2013, these trends are expected to remain, while the relative share of the "Internet access services" segment in the total volume of the electronic communications market is expected to grow. 4. Transmission and/or broadcasting of radio and/or television programs services
4.1. Structure of market segment "Transmission and/or distribution of radio and/or TV programs services"
In 2012, the size of the market segment "Transmission and/or distribution of radio and/or TV programs services" reached BGN 235.157 million and for a second consecutive year registered a drop compared to the preceding year (by 3.6%), which is due to the decrease in revenue from cable television for end users (by 11.3%) and revenue generated from wholesale transmission of radio and television programs (by 3.1%). The highest growth in the segment was once again observed in revenue from the provision of IPTV wholesale services and IPTV to end users. The revenue from IPTV wholesale service grew by 21.4%, while the revenue from the provision of IPTV to end users was up by 97.2%.
Information on the number of undertakings that provided transmission and/or distribution of radio and/or TV programs services, the number of their subscribers/users, and on the volume of revenue generated from them, along with the structure of the segment, is presented in Table 7 and Figure 34 below:
70.0% 64.5%
28.5% 34.4%
1.5% 1.2%
0%
10%
20%
30%
40%
50%
60%
70%
80%
90%
100%
31.12.2011 31.12.2012
Breakdown of subscribers according to the access speed
over 100 Mbps from 30 Mbps to 99 Mbps from 144 Kbps to 29 Mbps

43
Table 7
Number of subscribers/users and revenue by type of transmission and/or distribution of radio and/or TV programs services in the segment provided in 2012
Source: Data submitted to CRC
Although the total number of cable television subscribers continued to decrease in 2012 (by 8.5%), an increase of 6.5% in the total number of subscribers using the pay TV services is observed on the market (cable, satellite and IPTV). This growth is due to the rise of 17.7% in the number of satellite television subscribers and 3.7 times in the number of IPTV subscribers. In an absolute value, the number of IPTV and satellite television subscribers was up by 177.1 thousand in 2012, while the number of cable television subscribers fell by 76.9 thousand. At the end of 2012, penetration rate of pay TV among households in the country was 54.4% (to compare with, at the end of 2011, this indicator was 51.2%, respectively). In 2012, a drop by 4.6% was registered in the number of undertakings providing terrestrial broadcasting of radio and TV programs services, while the number of undertakings providing wholesale transmission/distribution of radio and TV programs remains unchanged - 17.
Tota
l
1 incl. bundled
services
subscribers
1. Retail distribution of radio and television
programs 35
1 1,635,433 506,219 188.683
1.1. Cable television 3
30
9 826,522 279,626 83.951
1.2. Satellite television 3 712,645 136,280 103.800
1.3. IPTV 4
3 96,266 90,313 0.932
2. Terrestrial broadcasting of radio and/or
television programs
4 8
4 /// /// ///
3. Provision of transmission/distribution of radio and/or
television programs 1
7 16
4 /// 46.475
3.1. Transmission of radio and/or television
programs services 8 5
4 /// 10.616
3.2. Distribution of radio and/or television programs
services, incl. IPTV wholesale service
provided to other undertakings
1
0 11
0 /// 3.859
Total /// /// /// 235.157 1 Incl. bundled services subscribers
2 Excl. revenue from bundled services
3 Data on the total number of cable television subscribers and revenue are obtained according to an expert estimation based on data submitted to CRC by
92.95% of registered undertakings. 28 of the undertakings registered with CRC for the provision of the service have not submitted an activity report for 2012
. 4 5 of the undertakings registered with CRC for the provision of the service have not submitted an activity report for 2012.
Name of the service
Number
of undertakings
providing the
service in
2012
Number of subscribers/users as of
31.12.2012 Revenue
(in million BGN,
VAT excl.) 2

44
Source: Data submitted to CRC
Figure 34
In 2012, the largest share of the total volume of the segment (80.2%) continued to be occupied by the revenue from the provision of radio and TV retail programs services such as: cable television, satellite television and IPTV. Regardless of the high growth in the number of subscribers and revenue during the year, the share of revenue from IPTV provided to end users remains the lowest in the segment – 0.40%.
4.2. Retail distribution of radio and TV programs
4.2.1. Cable television
In 2012, 33 new undertakings notified CRC of their intention to provide cable television. The number of undertakings which filed documents with CRC to terminate this activity was 98.
The total number of undertakings registered with CRC was 39724
, as the number of undertakings that actually provided cable television decreased by 28 since 2011, reaching 309
25.
This indicates preservation of the trend observed in the past several years towards intensified competition in terms of quality and diversity of offered services, and consolidation of undertakings operating in this market segment.
24
Total number of undertakings providing cable television as of 31.12.2012. 25
28 undertakings of those registered as of 31.12.2012 did not provide activity report for 2012.
49 . 24 % 38 . 84 %
35 . 70 %
34 . 56 % 41 . 51 %
44 . 14 %
0 . 06 % 0 . 19 % 0 . 40 % 3 . 24 % 4 . 28 % 4 . 51 %
12. . 91 % 15 . 18 % 15 . 25 %
0 %
10 %
20 %
30 %
40 %
50 %
60 %
70 %
80 %
90 %
100 %
2010 2011 2012
Revenue structure by types of services on market segment “Transmission and/or distribution of radio and/or television
programs services" for the period 2010 – 2012
Cable television Satellite television IPTV Transmission of radio and/or television programs services
- Distribution of radio and/or television programs services, incl. IPTV wholesale service
-

45
Subscribers and revenue from cable television
According to an expert estimation based on data submitted to CRC by 92.95% of the registered undertakings, the total number of subscribers of cable television in Bulgaria was 826,522 as of 31.12.2012. It has decreased by 8.5% since 2011. The decrease in the number of subscribers is mainly due to the observed migration to alternative to cable television services, namely satellite television and IPTV, which registered a significant growth in the number of subscribers in 2012.
The penetration of the cable television among Bulgarian households dropped by 2.6 percentage points compared to 2011, and reached only 27.5% at the end of 2012 (Figure 35).
Source: Data submitted to CRC
Figure 35
Approximately half of the subscribers of cable television were concentrated in cities with population of over 100,000 residents (48%), while the relative share of subscribers in towns with population of over 60,000 residents dropped by 2 percentage points since 2011, thus reaching 58%. In small settlements with up to 5,000 residents, this index remains the same as in 2011 – 16% (Figure 36).
39 . 7 %
40.9%
34.3%
30 . 1 %
27 . 5 %
25%
27%
29%
31 %
33%
35%
37%
39%
41%
43 %
2008 2009 2010 2011 2012
Penetration of cable television service among households for the period 2008 - 2012
Penetration

46
Source: Data submitted to CRC
Figure 36
According to an expert estimation based on data submitted to CRC by 92.95% of the
registered undertakings, the volume of total revenue generated from cable television subscribers amounted to BGN 83.8 million, which is nearly 11.5% less, compared to 2011
26. This is due to the
decreased number of cable television subscribers at the expense of satellite and IP-based television, as well as to the significant share of bundled services subscribers which constituted 37% of the total number of cable television subscribers at the end of 2012.
Figure 37 presents the structure of revenue from the provision of cable television. It should be noted that revenue from undertakings that were effaced in 2012 and that carried out activity until then, amounts to BGN 131.6 thousand, as this revenue is not included in the breakdown of revenue by settlements, but it is included in the total volume of the market for transmission and/or broadcasting of radio and television programs.
26
The volume of total revenue from cable television excludes revenue from the provision of bundled
services.
5%
11%
5%
5 %
10%
6 %
10%
48 %
Breakdown of cable television subscribers by the number of residents in the settlements
as of 31.12.2012
up to 1000 from 1000 to 5000 from 5000 to 10 000 from 10 000 to 20 000 from 20 000 to 40 000 from 40 000 to 60 000 from 60 000 to 100 000 over 100 000

47
Source: Data submitted to CRC
Figure 37
The higher quality and more favourable conditions offered by undertakings, in addition to the technology development in terms of terminal devices stimulate a growing part of cable television users to replace the traditional analogue signal with a digital one. Due to the growing interest towards digital television programs, more undertakings switch their activity in this direction.
The number of undertakings providing digital television programs to subscribers increased by 25 against 2011, as it reached 101, which represents approximately 33% of the total number of undertakings that actually carried out activity in 2012. For comparison, this share was nearly 23% in the year before, and 16% in 2010. This is not only due to the growing interest in digital television, but also to the intensifying competition among undertakings providing television service based on different technological platforms (cable television, satellite television and IPTV).
4.2.2. Satellite television In 2012, three undertakings are authorised by CRC to provide satellite television: BULSATCOM AD, BTC and SATELLITE BG AD. As of 31.12.2012, they provided the satellite TV service both stand-alone or bundled with other electronic communication services to 712.6 thousand subscribers, which represents a growth of 17.7% in the number of subscribers compared with the end of 2011. In an absolute value, the number of satellite television subscribers grew by 107.2 thousand in the past year and 35% of them were subscribers of bundled services with satellite television included. In 2012, bundled services with satellite television were once again offered by BULSATCOM AD and BTC, as the number of subscribers using them rose by 39% in the past year, and their share in the total number of satellite television subscribers reached 19% in 2012. To compare with, only 16% of the subscribers of satellite TV used this service bundled in 2011.
6%
11%
6%
6%
9%
5 %
9 %
48 %
Structure of revenue from the provision of cable television by the number of residents in the settlements as of 31 . 12 . 2012
up to 1000 from 1000 to 5000 from 5000 to 10 000 from 10 000 to 20 000 from 20 000 to 40 000 from 40 000 to 60 000 from 60 000 to 100 000 over 100 000

48
Following the slight drop of BGN 0.1 million in the total revenue from satellite television provided stand-alone in 2011, an upward trend was once again observed in 2012, as the reported growth was 2.6% against 2011, and their total volume for 2012 reached BGN 103.8 million (Figure 38).
Source: Data submitted to CRC Figure 38
The penetration rate of satellite television service among households was 23.7% at the end of 2012, registering a growth of 3.6 percentage points, compared with 2011, when the reported penetration rate was 20.1%
27. To compare with, the penetration rate of cable television
in 2012 was 27.5% representing 2.6 percentage points less than the preceding year, while the penetration rate of IPTV was 3.2%, which represents an increase of 2.3 percentage points since 2011. Data on the number of subscribers of satellite television, cable television and IPTV for the period 2008–2012 is presented on Figure 39 below.
27
The number of households (3,005,589 - ordinary households) used to calculate the index was taken from
the last official census carried out by NSI in 2011.
315 . 20 306 . 40
450 . 00
605 . 40 712 . 60
62 . 46
73 . 62
101 . 33 101 . 20 103 . 80
0 . 0
20 . 0
40 . 0
60 . 0
80 . 0
100 . 0
120 . 0
0 . 0
100 . 0
200 . 0
300 . 0
400 . 0
500 . 0
600 . 0
700 . 0
800 . 0
2008 2009 2010 2011 2012
Rev
en
ue (
mil
lio
n B
GN
)
Subscribers (throusand)
Number of satellite TV subscribers and revenue for the period 2008 - 2012
Satellite TV subscribers Revenue (VAT excl.)

49
Source: Data submitted to CRC
Figure 39
The expected provision of new electronic communication services (fixed and mobile voice services) by BULSATCOM AD did not start in 2012, but the undertaking intends to introduce them in 2013 - this is a prerequisite for a growing competition in the offering of bundled services with satellite television on the market, and will be of benefit for the users as a result of the potentially more favourable offers that may be offered by competing undertakings. Another factor which could influence the competition and prices of the supplied paid satellite television on the market is the scheduled transition from analogue to digital broadcasting of radio and television programs in Bulgaria as of 1 September 2013. The terrestrial digital broadcasting of radio and television programs will enable the viewers to receive free-of-charge access on almost the entire territory of the country to a considerably higher number of Bulgarian television programs, compared to the present one. Currently, with regard to population in remote and hard-to-access areas of the country, such opportunity is offered by satellite television only.
4.2.3. IPTV IP-based television has gained greater popularity in the past years. As of 31.12.2012, 132 undertakings were registered as providing IPTV, 43of them actually provided the service. Another 14 undertakings have declared their intention to start offering the service in 2013. The number of subscribers as of 31.12.2012 reached 96,266, which represents an increase of nearly 4 times against 2011, and over 13 times against 2010. Revenue
28 for 2012 exceeded BGN 930
thousand, i.e. it has increased by almost 100%, as compared to 2011 (Figure 40).
28
The volume of total revenue from IPTV for 2011 and 2012 excludes revenue from the provision of
bundled services.
315.2 306 . 4
450 . 0
605.4 712 . 6
1,175.8 1,195 . 9 1,032 . 0
903.5 826 . 5
0 . 6 1 . 9 6 . 9 26 . 4 96 . 3
- 100.0
100.0
300 . 0
500 . 0
700.0
900 . 0
1,100.0
1,300 . 0
2008 2009 2010 2011 2012
Subscribers (thousand)
Number of subscribers of satellite television, cable television and IPTV for the period 2008 - 2012
Number of satellite television subscribers Number of cable television subscribers Number of IPTV subscribers I

50
Source: Data submitted to CRC
Figure 40 The considerable growth of both subscribers and revenue from the provision of IPTV is not only due to the advantages of this service over the traditional cable and satellite television, namely its interactivity, which allows a two-way connection and a great diversity of additional multimedia services (video on demand, time-shifted TV, personalized content, information, entertainment and other interactive applications), and the possibility for integration with other IP-based services (Internet, VoIP, etc.), but also to the greater diversity of bundled services offered by the undertakings. The following chart (Figure 41) presents the breakdown of the undertakings according to the way of provision of the IPTV service.
576 1,852 7,225
26,378
96,266
50.30
169.08 178 . 27
472 .47
931.81
0 . 0
100 . 0
200 . 0
300 . 0
400.0
500 . 0
600.0
700. . 0
800 . 0
900.0
1,000.0
0
20,000
40,000
60,000
80,000
100,000
120,000
2008 2009 2010 2011 2012
Rev
en
ue (
tho
usa
nd
BG
N)
Su
bsc
rib
ers
(um
ber)
Number of subscribers and revenue from IPTV for the period
2008 - 2012
Subscribers Revenue

51
Source: Data submitted to CRC
Figure 41
As the chart shows, 35 of the undertakings purchase the IPTV service from another undertaking for resale purposes. The purchase of IP-based television service and its resale to end users is a preferred method for the providers, in respect of costs for maintenance of own platform and settlement of copyright and related rights for radio and television programs.
Although the number of undertakings providing IPTV through an own platform remained unchanged in an absolute value since 2011, 3 undertakings new for this sector started offering this service in 2012. What makes an impression is the fact that undertakings providing television service through an own platform, although they make up only 19% of all players carrying out activity on this market segment, occupy a significant share in the number of subscribers receiving IP-based television (93%), and 89% of the IPTV users are subscribers of the two largest undertakings in the segment, BTC and MOBILTEL EAD. The Operators on the Bulgarian market are still using only a small part of the additional features of IPTV, yet new services are expected to be added and the interest of users is projected to increase in the future. 4.2.4. Value-added services – HDTV, Video on Demand (VOD) and Pay-Per-View (PPV) The high-definition television (HDTV) is becoming more popular among users of television services. The chart below shows the breakdown of subscribers using this format according to the type of television service they receive. The greatest share is held by satellite television users – 59%, followed by subscribers of cable television – 25%, and IPTV – 16% (Figure 42). The total number of subscribers of high-definition television was almost 400 thousand as of 31.12.2012, as it grew over 4 times since the year before when it was less than 92 thousand.
8
35
Breakdown of undertakings according to the way of providing IPTV in 2012
Undertakings providing IPTV through own platform Undertakings purchasing IPTV from another undertaking for resale purposes

52
Source: Data submitted to CRC
Figure 42 The services “Pay-per-View” (PPV) and Video on Demand (VOD), which entered the Bulgarian market in the last several years, are offered by undertakings providing cable television, as well as by IPTV providers, and as of 31.12.2012 the number of unique subscribers who have used the services at least once, is as follows:
- for the PPV service, this number increased 3.8 times, compared to the previous year, reaching 2,100;
- for the Video on Demand (VOD) service, the growth is over 7 times, reaching 25 thousand subscribers.
4.3. Terrestrial radio relay transmission and terrestrial broadcasting
In 2012, revenue from undertakings performing activity on terrestrial broadcasting of radio and television signals amounted to BGN 34.2 million registering a drop of 7.0% versus 2011.
The main part (95.3%) of this revenue was generated from the provision of services related to broadcasting of radio and television programs. The remaining 4.7% was earned from the provision of program transmission services.
4.3.1. VHF/FM broadcasting
At the end of 2012, a total of 76 undertakings were licensed for the provision of terrestrial broadcasting, and the number of issued authorizations totalled 309. Undertakings with local coverage were 74, which made up 97.4% of the total number of undertakings (Figure 43), as 29 of them (39.2%) carried out activity in more than one settlement.
The BNR programs coverage by population achieved as of 31.12.2012 was 95% for "Horizont" pragram, and 81% for "Hristo Botev" program, and the DARIK RADIO AD coverage was 95.5%.
Breakdown of subscribers of HDTV according to
the type of television service they receive as of 31.12.2012
59%
16%
25%
Satellite television IPTV Cable television

53
Source: CRC.
Figure 43
4.3.2. Television broadcasting
As of 31.12.2012, a total of 18 undertakings were entitled to provide electronic communications through the licenses for terrestrial analogue broadcasting of television signals issued to them, as 15 of them (83.3%) had local coverage (Figure 44).
Breakdown of undertakings carrying out activity
related to terrestrial analogue broadcasting of radio
signals, by coverage at the end of 2012
2.6%
97.4%
Undertakings with national coverage Undertakings with local coverage

54
Source: CRC
Figure 44 BULGARIAN NATIONAL TELEVISION (BNT), BTV MEDIA GROUP EAD and NOVA
BROADCASTING GROUP AD had licenses with national coverage. The coverage by population of the national programs of the three undertakings with
national coverage of networks achieved as of 31.12.2012 was 98.5% for BNT, 97.7% for BTV MEDIA GROUP EAD and 94% for NOVA BROADCASTING GROUP AD. 4.4. Wholesale provision of transmission and/or distribution of radio and TV programs and IPTV
In 2012, a total of 17 undertakings provided wholesale transmission and/or distribution of radio and television programs services, and their revenues amounted to BGN 46.475 million, registering a drop of 2.05%, as compared to the preceding year, as a result of the reported decrease in the revenue earned from the provision of wholesale terrestrial radio relay transmission (9.47%), other types of transmission - IP transmission via optical networks (98.06%) and terrestrial broadcasting (6.83%). In general, revenue from transmission of radio and television programs services rose by 1.67% against 2011, while a drop of 3.10% was reported in revenue from distribution of radio and television programs as a result of the decreased revenue from the "terrestrial broadcasting" service.
A detailed information on the number of undertakings which in 2012 provided wholesale transmission and/or distribution of radio and television programs services, the number of users of these services and the volume of revenues generated from them, as well as on the structure of
Breakdown of undertakings carrying out activity
related to terrestrial analogue broadcasting of television
signals, by coverage at the end of 2012
16.7%
83.3%
Undertakings with national coverage
Undertakings with local coverage

55
the above services’ market is displayed in Table 8 and on Figure 45 below:
Table 8
Number of subscribers/users and revenues from the provision of wholesale transmission and/or distribution of radio and TV programs services, incl. wholesale IPTV services, in
2012
Source: Data submitted to CRC
In 2012, the number of undertakings providing transmission of radio and TV programs services grew by 3 compared to the year before, while the number of users of these services registered a drop of 44% at the end of 2012. At the end of 2012, compared to 2011, a decline was reported in both the number of undertakings providing the distribution of radio and television programs services, including wholesale IPTV service (4 undertakings less), and in the number of users of this type of services (by 17%).
Types of services for the wholesale transmission and/or distribution of radio and/or television
programs
Number of undertakings providing the
service in 2012
Number of subscribers/ users of the service as of 31.12.2012
Revenue from the service in
2012 (in million BGN,
VAT excl.)
1.1. Transmission of radio and/or television programs services, incl.:
8 54 10.616
1.1.1. Terrestrial radio relay transmission 3 19 1.620
1.1.2. Satellite transmission 5 27 8.979
1.1.3. Other types of transmission 1 8 0.017
1.2. Distribution of radio and/or television programs services, incl. wholesale IPTV service provided to other undertakings, incl. :
10 110 35.859
1.2.1. Terrestrial broadcasting 6 59 32.539
1.2.2. Satellite broadcasting 1 14 2.471
1.2.3. Other types of distribution of radio and/or television programs, incl. wholesale IPTV service
4 37 0.849
Total 17 164 46.475

56
*The data for 2010 and 2011 have been updated
Source: Data submitted to CRC Figure 45
The data on Figure 45 shows that in 2012 the largest share in the revenue from provision of wholesale transmission and/or distribution of radio and TV programs services was again held by the terrestrial broadcasting – 70%, while the smallest share (0.04%) was occupied by the wholesale services for the provision of other types of distribution (cable) of radio and TV programs. VESTITEL BG AD and NETERRA COMMUNICATIONS EOOD continued to be the only undertakings that provided wholesale IPTV services. Although slower than the growth reported in 2011, revenue from wholesale IPTV services continues to increase (21.41%), as it has grown almost 3 times within the last 3 years (2010 – 2012). 5. Bundled services
In 2012, the relative share of the "Bundled services" segment represented 11.01% in the total volume of the Bulgarian electronic communications market, which is an increase of 2.9 percentage points, as compared to 2011.
Bundling of electronic communication services has positive effects both in terms of supply and demand. The users benefit by paying one price for several services at a certain discount rate and having contractual relations with only one provider. The undertakings investments in this segment are focused on single convergent networks for the provision of integrated services which, in turn, optimizes the costs of their provision. The range of products and services is expanded and new subscribers are attracted.
Pursuant to §1, item 79 of the supplementary provisions of LEC, the term “price package” is defined as a ”bundle of two or more services with prices different from the price of each service when offered outside the bundle“.
According to the description adopted by CRC, bundle services (bundling) include two or
4 . 09 % 3 . 77 % 3 . 49 %
15 . 96 % 16 . 41 % 19 . 32 % 0 . 00 % 1 . 83 % 0 . 04 %
77 . 75 % 73 . 61 % 70 . 00 %
1 . 44 % 2 . 85 % 5 . 32 %
0 . 76 % 1 . 53 % 1 . 83 %
0 %
10 %
20 %
30 %
40 %
50 %
60 %
70 %
80 %
90 %
100 %
2010 2011 2012
Breakdown of revenue by types of services related to wholesale transmission/distribution of radio and/or
-
television programs for the period
2010 - 2012 *
Terrestrial radio relay transmission
Satellite transmission Other types of transmission
Terrestrial broadcasting Satellite broadcasting
Other types of distribution and wholesale IPTV service
I

57
more electronic communications services offered jointly by a given undertaking (at a common price), as services are offered under fixed, pre-determined proportions and conditions. Generally, bundled services divide into two types: “pure bundle” and “mixed bundle” which differ in terms of whether the user has the option to purchase any of the bundled services separately. Tied services (tying), on their part, mean that a service is offered only if purchased together with another service, as the latter can also be purchased separately.
It should be taken into account that the information published in the Annual Report does not pertain to the cases of offered “pure bundles”, the most common of which is the provision of access to a public telephone network and publicly available telephone services at a fixed location.
From the data presented by undertakings which have been providing public electronic communications in Bulgaria for the last three years, it is clear that the subscribers’ interest in bundled services has been growing due to the convenience they offer. At the end of 2012, undertakings providing bundled services were 117, as most offered was the Double Play service “Television and Internet access” (by 106 undertakings).
Revenue29
(from installation fees and monthly subscription) generated by undertakings providing bundled electronic communications services at the end of 2012, amounted to BGN 310.6 million, which represents an increase of 30.2% since the preceding year. Revenue from the Double Play services held the largest share in the total volume of bundled services offered, as they exceeded BGN 234.4 million. Revenue from Triple Play services were BGN 71.1 million, while that from Quadruple Play service amounted to BGN 4.89 million. In 2012, revenue from the Double Play service comprising voice service through numbers with national destination code 099x and Internet access formed less than 1% of the total revenue from all bundled services. The following figure presents the breakdown of revenue by types of bundle services at the end of the year.
29
Excluding revenue from out-of-bundle consumption when the provided bundled services include voice
telephone services.
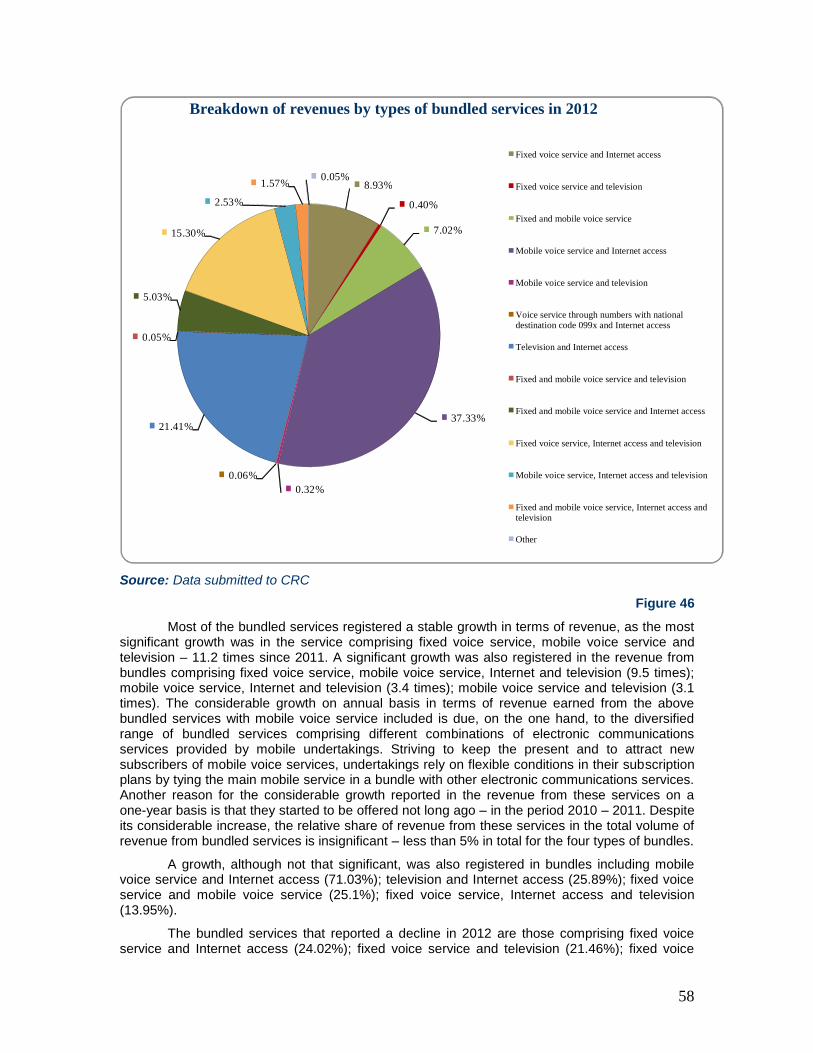
58
Source: Data submitted to CRC
Figure 46
Most of the bundled services registered a stable growth in terms of revenue, as the most significant growth was in the service comprising fixed voice service, mobile voice service and television – 11.2 times since 2011. A significant growth was also registered in the revenue from bundles comprising fixed voice service, mobile voice service, Internet and television (9.5 times); mobile voice service, Internet and television (3.4 times); mobile voice service and television (3.1 times). The considerable growth on annual basis in terms of revenue earned from the above bundled services with mobile voice service included is due, on the one hand, to the diversified range of bundled services comprising different combinations of electronic communications services provided by mobile undertakings. Striving to keep the present and to attract new subscribers of mobile voice services, undertakings rely on flexible conditions in their subscription plans by tying the main mobile service in a bundle with other electronic communications services. Another reason for the considerable growth reported in the revenue from these services on a one-year basis is that they started to be offered not long ago – in the period 2010 – 2011. Despite its considerable increase, the relative share of revenue from these services in the total volume of revenue from bundled services is insignificant – less than 5% in total for the four types of bundles.
A growth, although not that significant, was also registered in bundles including mobile voice service and Internet access (71.03%); television and Internet access (25.89%); fixed voice service and mobile voice service (25.1%); fixed voice service, Internet access and television (13.95%).
The bundled services that reported a decline in 2012 are those comprising fixed voice service and Internet access (24.02%); fixed voice service and television (21.46%); fixed voice
8 . 93 %
0 . 40 %
7 . 02 %
37 . 33 %
0 . 32 % 0 . 06 %
21 . 41 %
0 . 05 %
5 . 03 %
15 . 30 %
2 . 53 %
1 . 57 % 0 . 05 %
Breakdown of revenues by types of bundled services in 2012
Fixed voice service and Internet access
Fixed voice service and television
Fixed and mobile voice service
Mobile voice service and Internet access
Mobile voice service and television
Voice service through numbers with national destination code 099x and Internet access Television and Internet access
Fixed and mobile voice service and television
Fixed and mobile voice service and Internet access
Fixed voice service, Internet access and television
Mobile voice service, Internet access and television
Fixed and mobile voice service, Internet access and television
Other

59
service, mobile voice service and Internet access (9.81%). The common reason which may be pointed out for the three types of bundles is the decreasing consumption of fixed voice service.
Four types of bundled services formed over 80% of the total volume of revenue from bundled services at the end of the reviewed period.
The bundled service comprising mobile voice service and Internet access holds the highest relative share in the total revenue from all bundled services offered at the end of 2012 – 37.33%. Its relative share in 2012 continued to grow, though at slower rates – by 8.91 percentage points since the preceding year (compared to an increase of 20.26 percentage points for 2011). In an absolute value, the service registered a growth of 71% in 2012. A slowdown is also observed in the growth rates, which may be explained with the market saturation, on the one hand, and the transition of subscribers to Triple or Quadruple Play service including the same elements, on the other hand. It should be pointed out that this bundle includes both fixed and mobile Internet access. Considering that the bundled service is offered by mobile undertakings only, the considerably predominant consumption of mobile Internet in the bundle is objective.
The second place in terms of revenue is occupied by the Double Play service comprising television and Internet access (21.41%). Revenue from this bundled service continued to increase, as the reported growth was 25.89% versus 2011. Its high market share is due to the fact that this is the most offered bundled service by the undertakings, and it is also one of the first bundled combinations of electronic communication services offered on the market.
The next place in terms of revenue share in the total volume of revenues from bundled services is held by the Triple Play service comprising fixed voice service, Internet access and television (15.3%). It registered a growth of 13.95%, compared to the preceding year 2011.
The fourth bundled service in terms of revenue generated in 2012 is the fixed voice service combined with Internet access (8.93%). When compared to 2011, its relative share falls by 6.37 percentage points, and compared to 2010 – by another 9.36. The same trend was also observed in an absolute value – the service registered a drop of 24.02% since 2011 (while in 2011 versus 2010, there was a positive result – a growth of 47%). The drop in its position in terms of revenue could be explained with the faster increase of subscribers of mobile voice service with Internet access included, as well as by the specific use of the latter and its higher price. This Double Play service indirectly reflects the high penetration of the mobile voice service compared to the decreasing penetration of the fixed voice services, which partially determines the outstripping development of bundled service comprising mobile voice service and Internet access.
According to data of the undertakings providing electronic communications services in Bulgaria, the number of bundled services subscribers was 1.875 million at the end of 2012, which represents an increase of 18.24%, as compared to the preceding year 2011.
Despite the high growth rate of bundled services subscribers, their share, as a percentage of population, still remains low – at 25.75%
30. However, when compared to the end of
2011, the “penetration based on population” index has increased by more than 4 percentage points. At the end of 2012, the index “penetration based on households” came in at 54.69%
31
which represents an increase of 8 percentage points against 2011. The percentage value of this index suggests that in 2012 more than half of the Bulgarian households were subscribed to bundled electronic communications services which could be deemed as significant progress not only in the segment of bundled services, but also in the sphere of digital society in Bulgaria.
The breakdown of subscribers by types of bundled services in Bulgaria is presented on
30
The ”penetration based on population“ index was calculated on the basis of NSI data on the number of
population as of 31.12.2012, http://www.nsi.bg/otrasal.php?otr=19&a1=376&a2=377&a3=378#cont 31
Only residential subscribers of bundled services as of 31.12.2012 were taken into account for calculation
of the ”penetration based on population“ index. NSI data on the number of households as of 01.02.2011
were used.

60
Figure 47.
Source: Data submitted to CRC
Figure 47
The data presented on Figure 47 clearly shows that subscribers were mostly interested in three types of Double Play services: mobile voice service and Internet access (48.39%), fixed voice service and mobile voice service (18.64%), and television and Internet access (14.92%). These three most commonly used bundled services were most preferred in 2011 as well, in the same order in terms of the number of subscribers. Out of the three types of bundled services, the bundle comprising fixed voice service and mobile voice service was the only one to drop (by 1.5 percentage points, compared to the year before).
The most noticeable growth was registered by the Quadruple Play service comprising fixed voice service, mobile voice service, Internet and television – more than 2 times, compared to the previous year. The reason is once again the above mentioned expanding the share of mobile undertakings in the electronic communications market and attractting new subscribers. Nevertheless, the relative share based on number of subscribers of this bundled service hardly made up 1.31% of the total number of bundled services users. The following reporting periods will most probably observe development in its potential.
The next places in terms of growth rate are occupied by bundled services comprising mobile voice service, Internet and television (61.2%); fixed voice service, mobile voice service and television (55.06%); television and Internet access (40.05)%; mobile voice service and
3 . 54 %
0 . 38 %
18 . 64 %
48 . 39 %
0 . 31 %
0 . 12 %
14 . 92 %
0 . 03 %
1 . 99 %
8 . 04 %
2 . 00 % 1 . 31 %
0 . 34 %
Breakdown of subscribers by types of bundled services
as of 31.12.2012
Fixed voice service and Internet access
Fixed voice service and television
Fixed and mobile voice service
Mobile voice service and Internet access
Mobile voice service and television
Voice service through numbers with national destination code 099x and Internet access
Television and Internet access
Fixed and mobile voice service and television
Fixed and mobile voice service and Internet access
Fixed voice service, Internet access and television
Mobile voice service, Internet access and television
Fixed and mobile voice service, Internet access and television
Other

61
television (26.28%); mobile voice service and Internet access (24.76%); fixed voice service and mobile voice service (9.63%).
In 2012, the most significant decrease was observed in the number of subscribers of bundled services comprising fixed voice service and Internet access (26.93%); fixed voice service and television (19.27%); fixed voice service, mobile voice service and Internet access (16.74%). Less noticeable was the decrease in the bundle of fixed voice service, Internet access and television (2.19%). The types of bundles that reported a decline since the preceding year in terms of generated revenue (already discussed above), as well as in terms of number of subscribers are once again those that include fixed voice service.
Figure 48 presents the breakdown of bundled services subscribers according to the type of television service they receive.
Source: Data submitted to CRC
Figure 48
As it is clear from the chart above, more than half (55%) of subscribers of bundled services with television service included used cable television at the end of 2012, and even though, in absolute values, this number remained almost unchanged, in a relative expression it dropped by over 14 percentage points for the period 2011 – 2012. This decrease is due to the significant growth of the number of subscribers to bundled services with satellite and IP-based television included. Subscribers of bundles with satellite television grew by nearly 40 thousand for a one-year period, occupying 26.9%, and those of bundles with IPTV – by over 66 thousand, making up 17.8% of the market segment.
The bundled services market continued to develop and covered an increasing part of the population. This development observed in the last years is mainly due to the more active participation of mobile undertakings on the electronic communications market and the growing needs of mobile services users (voice services, mobile Internet).
95.9%
69.6%
55.2%
2.1%
24.5%
26.9%
2.0% 5.9%
17.8%
0%
10%
20%
30%
40%
50%
60%
70%
80%
90%
100%
2010 2011 2012
Breakdown of bundled services subscribers by the type of television service they receive for the period 2010 - 2012
Cable television Satellite television IPTV

62
6. Provision of universal service 6.1. Assignment of the universal service
The provisions of Art. 182, Para 2 of LEC laid down the set of services of a specified quality to which end users must have access at an affordable price. Pursuant to the acting legal provisions, the users have a guaranteed access to the public telephone network of an undertaking assigned with the provision of the universal service, in addition to access to public telephone services related to voice and data transfer with a functional Internet access. Similarly to the preceding years, in 2012, the undertaking obligated to provide the services within the scope
32
of the universal service of a predetermined quality, at affordable prices on the entire territory of the country, was BULGARIAN TELECOMMUNICATIONS COMPANY AD.
6.2. Provision of the universal service on the entire territory of the country
In performance of its obligation to provide the universal service on the entire territory of the country, as of 31.12.2012, BTC secured 84% coverage by number of territorial units, which represents a growth of 3 percentage points compared to 2011. The above coverage includes settlements and settlement formations (resorts, etc.), which are included in the Unified Classification of Administrative-Territorial and Territorial Units
33.
For another consecutive year, in 2012, phone density by households34
, amounting to 40.18%, registered a decline of 3.98 percentage points, compared to the year before. The drop in the values of this indicator reflects a sustainable downward trend in the number of residential subscribers which in 2012 decreased fell by 9.01% compared to 2011.
Source: Data submitted to CRC Figure 49
32
The scope of the universal service is defined in Art. 182, Para 2 of LEC 33
According to NSI data, the number of territorial units in Bulgaria was 5,267 as of 23.03.2013. 34
The "density by households" index is measured by dividing the total number of residential lines to the
number of households in the country.
1,327,384
1,207,750
3,005,589 3,005,589
44.16%
40.18%
38%
39%
40%
41%
42%
43%
44%
45%
0
500,000
1,000,000
1,500,000
2,000,000
2,500,000
3,000,000
3,500,000
2011 2012
Telephone density by households
Total number of residential POTS Number of households Density by households

63
6.3. Connection at a fixed location to the public telephone network and access to public telephone services
The sustainable downward trend in the number of subscribers to fixed voice telephone service is also reflected in the submitted reasonable requests
35 for connection to the public fixed
telephone network of BTC that reached 51,512 as of 31.12.2012. As it is clear from the chart below, the quantity of submitted reasonable requests was down by 1,146, compared to the same period in 2011. The drop in the number of reasonable requests submitted by people with disabilities observed in 2011 continued, as the number of submitted requests was by 21.17% lower than the year before.
Source: Data submitted to CRC
Figure 50
Striving to retain the number of its subscribers, in 2012, BTC provided access to 51,512 subscribers who had submitted reasonable requests, which is by 1,146 less than 2011, while the percentage of requests awaiting approval dropped from 18.56% in 2011 to 12.28% in 2012. The decrease in the number of the submitted requests for connection to the public fixed telephone network, which were given up due to the technical time necessary for creating a connection is approximately 13%, while rejections for other reasons increased to 3,625 in 2012 compared to 2,021 in 2011. The change in the reviewed indicators (respected requests and number of rejections) illustrates a sustainable downward trend in the consumer demand for the traditionally provided universal service. As the only provider of the universal service, BTC provided access to
35
BTC treats all requests submitted by residential subscribers as requests that refer to the permanent
address of the end user located within the construction borders of the settlement and provided that the end
user has no active telephone line within the undertaking's network.
52,658
5,315
9,775
51,512
4,190 6,324
0
10000
20000
30000
40000
50000
60000
Total number of submitted reasonable requests
Submitted reasonable requests by people with disabilities
Number of submitted reasonable requests awaiting approval
Submitted reasonable requests for connection to the public telephone network
2011 2012

64
public telephone services to 1,207,750 subscribers in 2012, which is by 119,634 less than 2011, when their totale number was 1,327,384.
There was a drastic withdrawal of dial-up Internet access subscribers who in 2012 reached 562, compared to 1,350 in 2011. The traffic of calls to the numbers for access 134хх dropped from 0.10% in 2011 to 0.02% in 2012 of the total number of calls to national numbers.
BTC fulfils its obligation to ensure free-of-charge calls to emergency numbers, and the volume of these calls, measured in minutes, has no significant changes, compared to the preceding year, and amounted to 0.21% of the total volume of calls to national numbers.
6.4. Public payphones of specified quality allowing free of charge calls to emergency numbers
In 2012, the obligations of BTC to provide public payphones, stipulated in Ordinance No. 6
36, stipulating criteria for reaching a sufficient number of public payphones, have been changed
compared to 2011 by including an additional criterion according to which a sufficient number of public payphones is considered to be present when there is at least 1 public payphone and/or 1 public access point for voice telephone services available in municipalities with up to 500 residents.
Table 9 presents data about the performance of the obligation to provide a sufficient number
37 of public payphones in 2012:
Table 9
Population Number of
municipalities
Number of public
payphones installed by
BTC
Sufficient number of public
payphones
Performance of the criteria for a
sufficient number of public
payphones
below 500 residents 699 406 699 - 293
from 500 to 1500 residents
1,046 1,175 1,341 - 166
over 1500 residents 525 9,495 3,909 + 5,586
Total: 2,270 11,076 5,949 + 5,127
Source: Data submitted to CRC
The reduction of the number of public payphones owned by BTC registered in previous years remained, and in 2012 registered a slight decrease by nearly 1.53% (from 11,248 in 2011 to 11,076 in 2012). As in 2011, in 2012, the criteria for a sufficient number of public payphones installed in municipalities with over 1500 residents exceeded considerably the minimum number required by Ordinance No. 6. In the remaining categories, the criteria for a sufficient number of public payphones were not met.
36
Ordinance No. 6 of 13 March 2008 on the universal service under the Law on the Electronic
Communications (title amended - SG, issue 77 of 9 October 2012) 37
According to Art. 5, Para 2 of Ordinance No. 6, a sufficient number of public payphones is considered to
be present when there is at least 1 public payphone and/or 1 public access point for voice telephone
services available in municipalities with up to 500 residents; at least 1 public payphone and/or 1 public
access point to voice telephone services per 500 residents in municipalities with more than 500 residents
and at least 1 public payphone and/or 1 public access point for voice telephone services per 1500 residents
in municipalities with more than 1500 residents.

65
The number of public telephones, property of BTC, whose qualitative characteristics include facilities for users with impaired hearing and for users with no or impaired eyesight, decreased by 2.18% compared to the preceding year and up to 31.12.2012 it reached 66.73% of the total number of public payphones in the country. Part of them provide for a textual or other type of connection for people with impaired hearing or speech and are accessible for users in wheelchairs by being installed in suitable locations. An increase of 19.67 percentage points was observed in the number of functional public payphones of BTC, which was 90% at the end of 2012. Free of charge calls to the national emergency numbers and to the single European emergency number 112 can be made from all public payphones owned by BTC. 6.5. Telephone directory, telephone enquiry services
In compliance with LEC and with relation to the provisions of Art. 6 of Ordinance No. 5
38, the undertakings obligated to provide the universal service must issue at least one telephone
directory in printed and/or electronic form. In 2012, BTC released a telephone directory in electronic form which is available at the undertaking's official website
39.
In compliance with its obligation to offer the numbers from the comprehensive telephone directory, BTC provided end users with a 24-hour telephone directory enquiry service in the past year through number 11 800. 6.6. Affordability of the universal service prices
In 2012, there were no changes in the obligations imposed on BTC for affordability40
of the universal service.
The undertaking continues to offer, without any change in the prices and the conditions, price packages intended for users with: low income ("Limited plan", as named by BTC); people with disabilities whose work capacity or capacity for social adaptation has been impaired by over 90% ("Handicap 160" and "Handicap 300" plan, as named by BTC); people with disabilities whose work capacity or capacity for social adaptation has been impaired by over 50% ("Handicap 300" plan, as named by BTC); people admitted to social or health institutions ("Social and health institutions" plan, as named by BTC).
The chart below displays the changes in the number of subscribers of price packages in the scope of the universal service for 2011 and 2012.
38 Ordinance No. 5 of 13.12.2007 on the terms and procedure for issuance of telephone directories,
including working with database, their transfer and use, and for provision of telephone enquiry services 39
http://www.vivacom.bg/online/cgi-bin/wpd.cgi?temp=home.html&ls=0; 40
Stipulated in the Methodology for determining prices and price packages for the universal service
adopted with Ordinance No. 2544 of 25.10.2008 of the Council of Ministers, prom. SG, issue 94 of
31.10.2008.

66
Source: Estimates based on data submitted to CRC
Figure 51
The chart clearly shows that the number of users of the three types of price packages was down by 2.3%, 3.9% and 6.1%, respectively the users of services in the scope of the universal service decreased by 2.7% in general.
6.7. Quality of the universal service provision
In 2012, the service quality parameters of the universal service provision, stipulated in Ordinance No. 6
41, were changed. Table 10 displays a comparison between the service quality
indicators of the previous year. Due to the amendments made to Ordinance No. 6, the information for 2012 is more detailed
Table 10
Quality parameters of the universal service provision
Parameters Measure unit 2011 2012
1. Supply time for initial connection: days 8 ///
1.1. Times by which the fastest 95% of orders are completed
days /// 13
1.2. Times by which the fastest 99% of orders are completed
days /// 24
1.3. Percentage of orders completed by the date agreed with the customer, and when this percentage is below 80% - the average days of delay
% /// 93
41
Ordinance No. 6 of 13 March 2008 on the universal service under the Law on the Electronic
Communications (title amended - SG, issue 77 of 9 October 2012)
266,467
76,358
723
260,264
73,382
679 0
50,000
100,000
150,000
200,000
250,000
300,000
Price package for people with disabilities
Price package for people with low income
Price package for people with special social
needs
?
Nu
mb
er o
f u
sers
Change in the number of subscribers of price packages in the scope of the universal service
2011 2012

67
Quality parameters of the universal service provision
2. Fault rate per subscriber line % 1.4 1.4
3. Fault repair time: hours 1.71 ///
3.1. Time by which the fastest 80% of valid faults on access lines are repaired
hours /// 4.5
3.2. Time by which the fastest 95% of valid faults on access lines are repaired
hours /// 26
3.3. Percentage of faults cleared within the time specified in the contract with the customer
% /// 95.6
4. Unsuccessful calls rate: % 0.10 ///
4.1. for national calls % /// 0.9
4.2. for international calls % /// 1.5
5. Call set up time: seconds 1.1 ///
5.1. average call set up time for national calls seconds /// 0.169
5.2. average call set up time for international calls seconds /// 0.376
6. Response time for operator supported calls /// /// ///
6.1. average response time seconds 14 16
6.2. rate of calls taken within 20 seconds % /// 92
7. Call set up time (response) for calls to telephone enquiry services
/// /// ///
7.1. average response time seconds 14 19
7.2. rate of calls taken within 20 seconds % /// 91
8. Percentage of bills correctness complaints % 26 21
9. The voice quality assessment factor (R factor) /// /// ///
9.1. for wired access technology /// 75 75
9.2. for wireless access technology /// 70 70
10. One-way voice delay milliseconds not more than 150
not more than 150
11. Ratio between coin and card operated public payphones
/// 1:5 1:5
12. Percentage of functional public telephone devices
% 72.33 90
Source: Data submitted to CRC
Data shows that, as compared to 2011, BTC reported a higher quality of the universal service in terms of complaints concerning the correctness of the bills as their number dropped by 38% (from 5,599 in 2011 to 3,498 in 2012), and in terms of percentage of functional public payphones which was up by 19.67 percentage points.
6.8. Complaints and complaint resolution
According to the General Conditions governing the relations between BTC and the end users, the undertaking gives options to the users to individually track and control their costs through:
the provision of detailed bills free of charge42
;
selective limitation of outgoing calls free of charge;
deferred payment when connecting to public telephone networks.
42
The content of the itemized bill is defined in Art. 260, Para 3 of LEC

68
The number of complaints filed with the undertaking regarding the provision of the universal service, was 16,756, which is by 23% less than in 2011, and stood at 13.87 complaints per 1,000 residential subscribers.
Most often complaints disputed technical failures, bills correctness, invoice delivery, violation of contractual clauses. The reasons are detailed on the chart below:
Source: Data submitted to CRC
Figure 52
As the data clearly show, percentage of complaints regarding technical failures was 13% of the total number of complaints, which is down by 13 percentage points compared to 2011. Percentage of complaints regarding contract termination was 22% of the total number of complaints, registering a rise of 5 percentage points, as compared to the same index in 2011.
BTC responded to 99.76% of the incoming complaints within the regulatory deadline of 30 days, which is by 25 percentage points more than in 2011, while the percentage of resolved complaints was 43%.
3% 1%
21%
13%
8%
22%
3%
16%
13%
Violation of contractual clauses Non-observance of deadlines for provision of the service
Disputes over bills correctness Technical failure
Other reasons Clarification of monthly bill
Contract termination Complaint over service
Enquiries / information Other
Complaints related to the provision of the universal service in 2012
Др
Oth
er r
easo
ns

69
6.9. Compensation of net costs accrued due to the universal service provision
6.9.1. Application for compensation of the unfair burden incurred by the provision of the universal service
In accordance with the terms set forth in LEC, in June, BTC filed with CRC a request for compensation of the net costs incurred by the provision of the universal service in 2011. CRC inspected the submitted calculations and evidence regarding the amount of requested compensation, and with Decision No. 324/26.04.2013, CRC called a public procurement with subject “Verification of the net costs incurred for the BULGARIAN TELECOMMUNICATIONS COMPANY AD by the provision of the universal service for 2011 financial year”.
6.9.2. Universal service compensation fund
The statutory amendments effected as of the end of 2011 by Decision No. 27/11.01.2012 forced the suspension of the opened procedure for assignment of public procurement with subject “Verification of the cost accounting system of the BULGARIAN TELECOMMUNICATIONS COMPANY AD and evaluation of the net costs for provision of the universal service in 2009 and 2010 financial years”. The suspended procedure for selection of contractor for the above public procurement and the opening of procedures for assigning two new public procurements
43,
combined with the appeal of one of the public procurements, reflected on the term for performing the independent audit which had not completed by 31.12.2012.
In this respect, in 2013, CRC will present its statement on the presence and amount of unfair burden from the provision of the universal service, and the Managing Board of the Fund will announce its decision concerning the total amount of compensation, and the specific amount to be paid to each undertaking under Art. 206, Para 1 of LEC.
6.10. Prospects for development of the universal service
The changes in the consumer demand caused by the development of new generation networks and the increased supply of bundled services form a sustainable downward trend in the provision of the universal service in Bulgaria. This trend will continue to develop in 2013. Taking into account the annual decrease of the number of subscribers using the universal service with all other conditions being equal, the costs per subscriber may be expected to grow, which in turn will reflect on the amount of the unfair burden and its compensation related with the obligation to provide the universal service. Finding a balance between the statutory requirement to guarantee the provision of a specified set of services and to compensate the unfair burden incurred by their provision puts on the agenda the need of a general discussion for review of the scope of the universal service in Bulgaria.
43
Public procurement with subject “Verification of the cost accounting system of the BULGARIAN
TELECOMMUNICATIONS COMPANY AD in 2009 and 2010 financial years" called with CRC Decision
No. 472 of 15.03.2012, and public procurement with subject "Evaluation of the net costs for provision of
the universal service in 2009 and 2010 financial years”.