hydrological impacts of land use change in three diverse south african catchments
TRANSCRIPT
Journal of Hydrology 414–415 (2012) 118–135
Contents lists available at SciVerse ScienceDirect
Journal of Hydrology
journal homepage: www.elsevier .com/locate / jhydrol
Hydrological impacts of land use change in three diverse South African catchments
Michele L. Warburton ⇑, Roland E. Schulze, Graham P.W. JewittSchool of Bioresources Engineering and Environmental Hydrology, University of KwaZulu-Natal, PBag X01, Scottsville 3209, South Africa
a r t i c l e i n f o s u m m a r y
Article history:Received 25 March 2011Received in revised form 22 June 2011Accepted 15 October 2011Available online 29 October 2011This manuscript was handled byKonstantine P. Georgakakos, Editor-in-Chief,with the assistance of Emmanouil N.Anagnostou, Associate Editor
Keywords:Land use changeBaseline land coverACRU agrohydrological modelHydrological response
0022-1694/$ - see front matter � 2011 Elsevier B.V. Adoi:10.1016/j.jhydrol.2011.10.028
⇑ Corresponding author. Tel.: +27 33 2606087; fax:E-mail address: [email protected] (M.L. Wa
In order to meet society’s needs for water, food, fuel and fibre, the earth’s natural land cover and land usehave been significantly changed. These changes have impacted on the hydrological responses and thusavailable water resources, as the hydrological responses of a catchment are dependent upon, and sensi-tive to, changes in the land use. The degree of anthropogenic modification of the land cover, the intensityof the land use changes and location of land uses within a catchment determines the extent to which landuses influences hydrological response of a catchment.
The objective of the study was to improve understanding of the complex interactions between hydro-logical response and land use to aid in water resources planning. To achieve this, a hydrological model,viz. the ACRU agrohydrological model, which adequately represents hydrological processes and is sensi-tive to land use changes, was used to generate hydrological responses from three diverse, complex andoperational South African catchments under both current land use and a baseline land cover. The selectedcatchments vary with respect to both land use and climate. The semi-arid sub-tropical Luvuvhu catch-ment has a large proportion of subsistence agriculture and informal residential areas, whereas in the win-ter rainfall Upper Breede catchment the primary land uses are commercial orchards and vineyards. Thesub-humid Mgeni catchment is dominated by commercial plantation forestry in the upper reaches, com-mercial sugarcane and urban areas in the middle reaches, with the lower reaches dominated by urbanareas.
The hydrological responses of the selected catchments to land use change were complex. Resultsshowed that the contributions of different land uses to the streamflow generated from a catchment isnot proportional to the relative area of that land use, and the relative contribution of the land use tothe catchment streamflow varies with the mean annual rainfall of the catchment. Furthermore, it wasshown that the location of specific land uses within a catchment has a role in the response of the stream-flow of the catchment to that land use change. From the Mgeni catchment, the significant role of thewater engineered system on catchment streamflow was evident. Hydrological models have drawbacksassociated with them due to inherent uncertainties. However, in this study the ACRU model proved tobe a useful tool to assess the impacts of land use change on the hydrological response as impacts fromthe local scale to catchment scale could be assessed as well as the progression of impacts of land usechanges as the streamflow cascades downstream through the catchment.
� 2011 Elsevier B.V. All rights reserved.
1. Introduction
The natural landscape has for centuries and even millennia beenmanipulated, both physically and chemically, to meet society’sneeds for water, food and security, and these changes both to landcover and land use have impacted on hydrological responses andthus on the water resources (e.g. Legesse et al., 2003; Claussenet al., 2004; De Fries and Eshleman, 2004; Calder, 2005). In thiscontext, and for the purposes of this document, land cover refersto the biophysical condition of the earth’s surface and immediatesubsurface in terms of broad categories such as grassland, crop-
ll rights reserved.
+27 33 2605818.rburton).
land, natural or planted forestry and human settlements (Turneret al., 1993, 1995). These broad land cover categories may be al-tered by natural forcing such as long-term climate changes or bynatural events such as volcanic activity. Most commonly, however,these categories of land cover are exploited by human actions andchanged through conversion or modification, to a land use (Turneret al., 1995; Lambin et al., 2000). Changes in land use alter the par-titioning of rainwater through the vegetation and soil into the crit-ical hydrological components of interception, infiltration, totalevaporation, surface runoff and groundwater recharge (Falken-mark et al., 1999; Costa et al., 2003). Thus, the hydrological re-sponses of a catchment are dependent, inter alia, upon the landuse of the catchment, and are sensitive to changes in land use (Fal-kenmark et al., 1999; Schulze, 2000; Bewket and Sterk, 2005).
M.L. Warburton et al. / Journal of Hydrology 414–415 (2012) 118–135 119
The extent to which the land use determines the hydrologicalresponse of a catchment depends on the degree of modificationof the natural land cover by human influences, the intensity ofthe changes, and the location of the land use within a catchment.Modifications in land use are easily measured at a local scale. How-ever, at a larger catchment scale it becomes difficult to distinguishthe effects which individual land use alterations have on hydrolog-ical responses. The accumulated effects of land use on the hydro-logical system are most easily identified at the river basin scale,‘‘as the water has a trace memory of its contact with the land’’(Falkenmark et al., 1999, p. 33). Certain land use changes do notimmediately alter the hydrological response of a catchment asthere may be a time lag between the land use change and its effecton the water balance (Schulze, 2003), for example the effect ofafforestation on low flow responses. Schulze (2003) argues that of-ten the management of the land may have a greater effect on thehydrological response of a catchment than the land use itself. Inthis regard, Lumsden et al. (2003) showed that the ploughing orthe type of tillage practice of an agricultural field may have fargreater impacts on the partitioning of rainfall into stormflow andbaseflow than a change in crop type, per se, may have.
The interaction of land use and water resources varies greatly intime and in space, as fluxes of water within a catchment move bothvertically (e.g. evapotranspiration) and laterally (through soils,hillslopes, aquifers and rivers). Thus, as water moves through thecatchment any impacts of the land use can be transmitted throughthe catchment (Falkenmark, 2003). The impacts of land use on thecatchment are often threshold related, with varying stable statesexisting for each specific catchment, while within each catchmentthere are feedbacks between the processes and components of thatcatchment. It has been accepted that use of a hydrological modelwhich is conceptualised to adequately represent hydrological pro-cesses, and is sensitive to land use changes, is an appropriate meth-od to assess the impacts of land use on catchment hydrologicalresponse (Turner et al., 1995; Ewen and Parkin, 1996; Lambinet al., 2000; Bronstert et al., 2002; De Fries and Eshleman, 2004;Samaniego and Bárdossy, 2006; Choi and Deal, 2008). The ACRUagrohydrological model (Schulze, 1995; Smithers and Schulze,2004) has been shown to be one such model that is suitable forland use impact studies (Warburton et al., 2010). This study buildson the confirmation study by Warburton et al. (2010) whichshowed that the ACRU model was able to successfully accommo-date a diverse range of land uses and simulate the streamflowand its components of stormflow and baseflow with acceptableconfidence in three climatically divergent South African catch-ments, viz. the Mgeni, Luvuvhu and Upper Breede catchments.
To be able to determine the impacts of land use on hydrologicalresponses a baseline land cover, i.e. a reference condition, againstwhich to assess changes is required. The magnitude of the assessedimpact of land use change on hydrological responses may also varyaccording to which baseline or reference land cover was used, andthis adds a further layer of complexity to the assessment of thehydrological impacts of land use change. For example, Schulze(2003) and Costa et al. (2003) determined impacts of land usechange against a natural land cover, while Choi and Deal (2008)and Bewket and Sterk (2005) assessed the impacts of land usechange between two points in time. Niehoff et al. (2002), on theother hand, assessed scenarios of land use change against the pres-ent land use. If these studies had used a different reference landuse or cover, their results may have differed. In South Africa, theneed for a baseline land cover against which to assess land usechange impacts became more important with the implementationof the South African Water Act (NWA, 1998), as reference flows arerequired for both the determination of the ecological reserve andthe assessment of the impact that specific land uses may have onlow flows. As the determination of the impact of the land use on
the streamflow is completely dependent on the water yield underbaseline conditions, it becomes imperative for a relatively accuratebaseline to be established (Jewitt et al., 2009). The South AfricanDepartment of Water Affairs (DWA) support and accepts the useof natural vegetation as a reasonable standard against which to as-sess land use impacts (Schulze, 2004; Jewitt et al., 2009). To date,the maps produced by Acocks (1953, 1975, 1988) remain the scien-tifically most respected and generally accepted maps of naturalvegetation from a perspective of South African hydrological impactstudies (Schulze, 2004). Thus, for the purposes of this study theAcocks (1988) Veld Types were used as a baseline land coveragainst which current land use changes will be assessed to deter-mine the hydrological impacts of these changes.
Given the above background, the objective of this study was toimprove the understanding of the dynamics between land use andhydrological response to assist in the integration of land use intowater resources planning. This was achieved by modelling thehydrological responses to land use change of three selected SouthAfrican catchments and assessing the following aspects, viz.
� the degree to which the contributions to streamflow from a spe-cific land use are in any way proportional to the relative areas ofthat land use,� whether the locations of specific land uses within a catchment
are important to the streamflow response and its componentsof baseflow and stormflow on the premise that the impacts ofthe land use on streamflow may be attenuated downstream oramplified,� whether specific land uses have relatively greater impacts on
different components (e.g. stormflows) of the streamflowresponse of a catchment, and� whether the water engineered system is relatively more impor-
tant than land use change in influencing the streamflowresponse of a catchment in terms of total flows, stormflows orbaseflows.
2. Study catchments
The South African catchments chosen for this study are de-scribed in detail by Warburton et al. (2010), with only a brief over-view provided here.
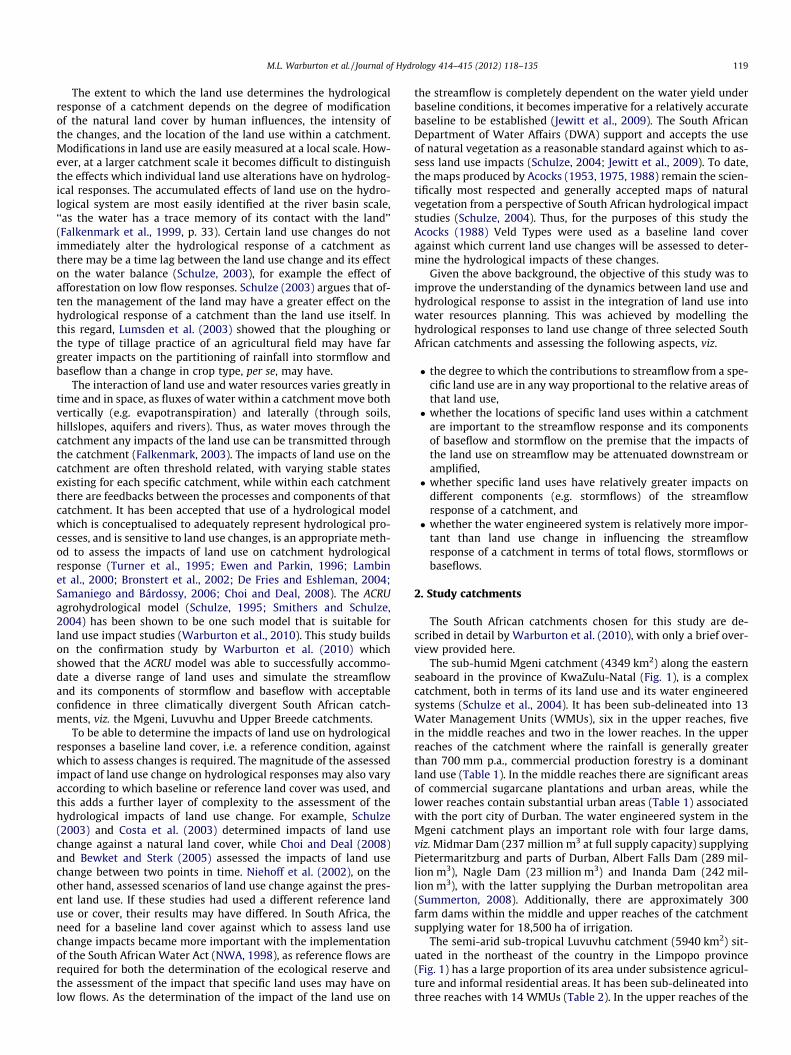
The sub-humid Mgeni catchment (4349 km2) along the easternseaboard in the province of KwaZulu-Natal (Fig. 1), is a complexcatchment, both in terms of its land use and its water engineeredsystems (Schulze et al., 2004). It has been sub-delineated into 13Water Management Units (WMUs), six in the upper reaches, fivein the middle reaches and two in the lower reaches. In the upperreaches of the catchment where the rainfall is generally greaterthan 700 mm p.a., commercial production forestry is a dominantland use (Table 1). In the middle reaches there are significant areasof commercial sugarcane plantations and urban areas, while thelower reaches contain substantial urban areas (Table 1) associatedwith the port city of Durban. The water engineered system in theMgeni catchment plays an important role with four large dams,viz. Midmar Dam (237 million m3 at full supply capacity) supplyingPietermaritzburg and parts of Durban, Albert Falls Dam (289 mil-lion m3), Nagle Dam (23 million m3) and Inanda Dam (242 mil-lion m3), with the latter supplying the Durban metropolitan area(Summerton, 2008). Additionally, there are approximately 300farm dams within the middle and upper reaches of the catchmentsupplying water for 18,500 ha of irrigation.
The semi-arid sub-tropical Luvuvhu catchment (5940 km2) sit-uated in the northeast of the country in the Limpopo province(Fig. 1) has a large proportion of its area under subsistence agricul-ture and informal residential areas. It has been sub-delineated intothree reaches with 14 WMUs (Table 2). In the upper reaches of the
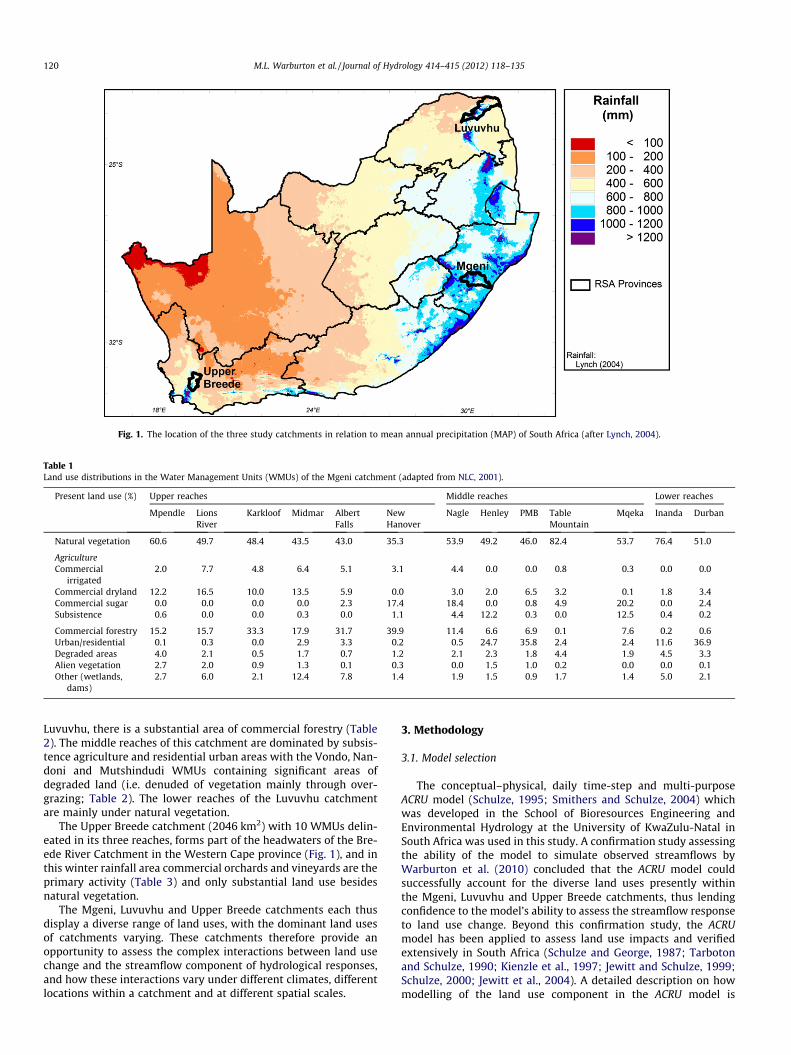
Fig. 1. The location of the three study catchments in relation to mean annual precipitation (MAP) of South Africa (after Lynch, 2004).
Table 1Land use distributions in the Water Management Units (WMUs) of the Mgeni catchment (adapted from NLC, 2001).
Present land use (%) Upper reaches Middle reaches Lower reaches
Mpendle LionsRiver
Karkloof Midmar AlbertFalls
NewHanover
Nagle Henley PMB TableMountain
Mqeka Inanda Durban
Natural vegetation 60.6 49.7 48.4 43.5 43.0 35.3 53.9 49.2 46.0 82.4 53.7 76.4 51.0
AgricultureCommercial
irrigated2.0 7.7 4.8 6.4 5.1 3.1 4.4 0.0 0.0 0.8 0.3 0.0 0.0
Commercial dryland 12.2 16.5 10.0 13.5 5.9 0.0 3.0 2.0 6.5 3.2 0.1 1.8 3.4Commercial sugar 0.0 0.0 0.0 0.0 2.3 17.4 18.4 0.0 0.8 4.9 20.2 0.0 2.4Subsistence 0.6 0.0 0.0 0.3 0.0 1.1 4.4 12.2 0.3 0.0 12.5 0.4 0.2
Commercial forestry 15.2 15.7 33.3 17.9 31.7 39.9 11.4 6.6 6.9 0.1 7.6 0.2 0.6Urban/residential 0.1 0.3 0.0 2.9 3.3 0.2 0.5 24.7 35.8 2.4 2.4 11.6 36.9Degraded areas 4.0 2.1 0.5 1.7 0.7 1.2 2.1 2.3 1.8 4.4 1.9 4.5 3.3Alien vegetation 2.7 2.0 0.9 1.3 0.1 0.3 0.0 1.5 1.0 0.2 0.0 0.0 0.1Other (wetlands,
dams)2.7 6.0 2.1 12.4 7.8 1.4 1.9 1.5 0.9 1.7 1.4 5.0 2.1
120 M.L. Warburton et al. / Journal of Hydrology 414–415 (2012) 118–135
Luvuvhu, there is a substantial area of commercial forestry (Table2). The middle reaches of this catchment are dominated by subsis-tence agriculture and residential urban areas with the Vondo, Nan-doni and Mutshindudi WMUs containing significant areas ofdegraded land (i.e. denuded of vegetation mainly through over-grazing; Table 2). The lower reaches of the Luvuvhu catchmentare mainly under natural vegetation.
The Upper Breede catchment (2046 km2) with 10 WMUs delin-eated in its three reaches, forms part of the headwaters of the Bre-ede River Catchment in the Western Cape province (Fig. 1), and inthis winter rainfall area commercial orchards and vineyards are theprimary activity (Table 3) and only substantial land use besidesnatural vegetation.
The Mgeni, Luvuvhu and Upper Breede catchments each thusdisplay a diverse range of land uses, with the dominant land usesof catchments varying. These catchments therefore provide anopportunity to assess the complex interactions between land usechange and the streamflow component of hydrological responses,and how these interactions vary under different climates, differentlocations within a catchment and at different spatial scales.
3. Methodology
3.1. Model selection
The conceptual–physical, daily time-step and multi-purposeACRU model (Schulze, 1995; Smithers and Schulze, 2004) whichwas developed in the School of Bioresources Engineering andEnvironmental Hydrology at the University of KwaZulu-Natal inSouth Africa was used in this study. A confirmation study assessingthe ability of the model to simulate observed streamflows byWarburton et al. (2010) concluded that the ACRU model couldsuccessfully account for the diverse land uses presently withinthe Mgeni, Luvuvhu and Upper Breede catchments, thus lendingconfidence to the model’s ability to assess the streamflow responseto land use change. Beyond this confirmation study, the ACRUmodel has been applied to assess land use impacts and verifiedextensively in South Africa (Schulze and George, 1987; Tarbotonand Schulze, 1990; Kienzle et al., 1997; Jewitt and Schulze, 1999;Schulze, 2000; Jewitt et al., 2004). A detailed description on howmodelling of the land use component in the ACRU model is
Table 2Land use distributions in the WMUs of the Luvuvhu Catchment (adapted from NLC, 2001).
Present landuse (%)
Upper reaches Middle reaches Lower reaches
Goede-hoop
Albasini Livhun-gwa
Welte-vrede
Vondo Nandoni Mutshin-dudi
Mhinga Matsa-ringwe
UpperMutale
Mutale Mbadi LowerMutale
LowerLuvuvhu
Naturalvegetation
71.0 90.4 13.8 5.2 6.0 21.1 33.1 59.0 96.8 60.6 68.0 60.4 78.5 95.7
AgricultureCommercial 9.6 0.8 38.3 24.7 1.0 1.2 0.7 1.1 0.0 2.6 0.2 0.0 0.0 0.0Subsistence 0.0 0.1 0.2 3.1 34.9 38.2 23.6 28.5 2.0 13.4 22.1 30.7 11.0 0.5Comm.
forestry16.7 3.7 36.5 54.9 14.3 0.0 16.8 0.0 0.0 12.7 0.0 0.0 0.0 0.0
Urban/residential
0.5 2.7 7.0 4.0 30.2 11.7 9.4 9.1 0.5 4.3 6.8 6.6 9.0 3.1
Degradedareas
0.1 0.4 1.2 6.3 12.5 26.9 15.7 1.7 0.0 6.2 2.3 1.8 0.8 0.0
Other(wetlands,dams)
2.1 2.0 3.0 1.8 1.1 0.9 0.7 0.6 0.6 0.2 0.6 0.5 0.7 0.7
Table 3Land use distributions in the WMUs of the Upper Breede catchment (adapted from NLC, 2001).
Present land use (%) Upper reaches Middle reaches Lower reaches
Upper Breë Koekedou Breë Witrivier Upper Witrivier Slanghoek Elands Stettynskloof Jan Du Toits Brandvlei
Natural vegetation 66.4 77.8 100.0 83.2 71.6 58.2 97.6 95.4 82.1 45.0
AgricultureCommercial permanent 16.2 18.5 0.0 9.8 16.3 28.7 1.7 1.5 8.1 16.5Commercial temporary 12.9 0.0 0.0 3.6 6.4 11.5 0.7 1.8 7.2 12.7Commercial forestry 0.4 0.2 0.0 1.7 2.9 0.0 0.0 0.0 0.0 0.0Urban/residential 1.5 0.0 0.0 0.7 1.2 0.2 0.0 0.0 1.4 0.5Other (wetlands, dams) 2.5 3.5 0.0 0.9 1.6 1.4 0.0 1.4 1.2 25.3
Fig. 2. An example from the Mgeni catchment of cascading (i.e. routing) of flowsbetween subcatchments and hydrological response units within each subcatchment(Warburton et al., 2010).
M.L. Warburton et al. / Journal of Hydrology 414–415 (2012) 118–135 121
conceptualised, data sources and parameters used is given in War-burton et al. (2010), with a brief overview provided here.
3.2. Data sources and model configuration
The Luvuvhu, Mgeni and Upper Breede catchments weredelineated into WMUs by DWA. These were further delineated intosubcatchments, the Mgeni catchment by Kienzle et al. (1997) andthe Luvuvhu and Upper Breede catchments by Warburton et al.(2010), which reflect the altitude, topography, soils properties,land cover, water management (water input and abstractions),and the location of streamflow gauging stations. These subcatch-ments were considered to be relatively homogeneous with respectto climate and soils. However, the land uses within each subcatch-ment varied. Thus, each subcatchment was further divided intohydrological response units based on land use (Warburton et al.,2010). These modelling units were configured to cascade into eachother in a logical sequence representative of river flow (Fig. 2).
For each of the subcatchments within the three study areas, arepresentative daily rainfall station was chosen and 40-year record(1960–1999) was extracted from a comprehensive database of dai-ly rainfall for South Africa compiled by Lynch (2004). The stationselection was based on the reliability of the record, the altitudeof the rainfall station in comparison to that of the subcatchment,and the location with respect to the subcatchment. The daily rain-fall records were adjusted to improve their representation of thesubcatchments areal rainfall (Warburton et al., 2010). The dailyminimum and maximum temperatures for the same 40-year peri-od as the rainfall were extracted from a one arc minute latitude/longitude gridded database of daily temperatures for South Africa(Schulze and Maharaj, 2004) for the centroid of each subcatch-ment. Daily A-pan equivalent potential evaporation values were
derived from the Hargreaves and Samani (1985) equation whichrequires only daily maximum and minimum temperatures byway of climate inputs, as no daily measured evaporation recordswere available.
The ACRU model revolves around a daily multi-soil-layer waterbudget and operates with a surface layer and two active soil hori-
122 M.L. Warburton et al. / Journal of Hydrology 414–415 (2012) 118–135
zons, viz. the topsoil and subsoil, in which rooting developmentand extraction of soil water takes place through evaporation fromthe soil surface and transpiration, as well as by soil water uptakethrough capillary action, while other losses occur throughstormflows and saturated drainage (Schulze, 1995). Values of thethickness of the topsoil and subsoil, as well as soil water contentat the soil’s lower limit, field capacity and saturation for both thetopsoil and subsoil; as well as the fraction of saturated soil waterabove field capacity to be redistributed daily from the topsoil tothe subsoil, and from the subsoil into the intermediate/groundwa-ter store were obtained for the three study areas from Schulze(2008).
The portion of generated surface and near-surface runoff (i.e.stormflow) and the portion of the intermediate or groundwaterstores which contributes the baseflow component to the totalstreamflow exiting a catchment on a particular day, are governedin ACRU by streamflow response variables dependent on subcatch-ment size, slope, typical rainfall intensities and other factors. Basedon a previous study (Kienzle et al., 1997) it was estimated that 30%of the total stormflow generated in the Mgeni and Luvuvhu catch-ments would exit on the same day as the rainfall event which gen-erated it. Given the steepness of the Upper Breede catchment itwas assumed that 60% of the total stormflow generated in a sub-catchment would exit on the same day (Schulze et al., 2004; basedon research by Kienzle et al., 1997). On any particular day it wasassumed that 0.9% of the groundwater store would become base-flow (Schulze et al., 2004). The depth of the soil from which storm-flow generation occurred was set to the thickness of the topsoil,except in the sugarcane and commercial forestry land use unitswhere it was set to 0.35 in accordance with the findings of Schulze(1995) and Schmidt et al. (1998).
Three land use specific components which affect evapotranspi-ration are considered by the ACRU model, viz. canopy interceptionlosses per rainday (ACRU variable name = VEGINT), evaporationfrom vegetated surfaces (CAY), and evaporation from the soil sur-face (PCSUCO), with the latter two influenced by soil water extrac-tion processes by plant roots (ROOTA) from the two soil horizons(Schulze, 1995). The rainfall abstracted by canopy and surface litterinterception, surface detention storage and initial infiltration be-fore stormflow commences is estimated in ACRU by the productof a coefficient of initial abstraction (COIAM) and soil water con-tent (Schulze, 2004). The above input values vary from month-to-month and differ according to the land use (Appendix A). Imper-vious areas were represented in the urbanised land use units byinputing the fraction of the subcatchment that is impervious, usingthe typical values for different types of urbanisation developed byTarboton and Schulze (1992).
Surface areas of both the large reservoirs and smaller farm damsin the Mgeni, Luvuvhu and Upper Breede catchments were ob-tained from 1:50,000 topographic map sheets. From these surfaceareas the full supply capacity of the reservoirs was calculated usingan algorithm developed by Tarboton and Schulze (1992). Seepageand environmental flow releases were set to equal 1/1500 of thedam’s full supply capacity per day, as suggested in Schulze(1995) for dams where these amounts were not known. For theMidmar, Albert Falls and Inanda reservoirs in the Mgeni catchmentthe daily environmental releases were known. No seepage was as-sumed to occur from these dams. Irrigation areas were identifiedfrom the NLC (2001). Irrigation applications were assumed to be20 mm net application in a 7 day cycle, with the cycle interruptedonly following a 20 mm daily rainfall event. Evaporation and winddrift losses of 12% and conveyance losses of 10% were input (Smi-thers and Schulze, 2004).
To assess the magnitude of the impacts of current land uses onwater resources, hydrological attributes of a baseline land coverare required as a reference input to hydrological models, in order
to be able to simulate changes in streamflow response that wouldoccur between the baseline land cover and perturbed land useconditions.
3.3. Baseline land cover
For the purposes of this study the Acocks (1988) Veld Typeswere used as the baseline land cover against which current landuse changes were assessed to determine the hydrological impactsof these changes. The monthly values of water use coefficients(CAY), interception per rainday (VEGINT), root mass distributionin the topsoil (ROOTA), coefficient of infiltration (COIAM) and theindex of suppression of soil water evaporation by a litter/mulchlayer (PCSUCO), for the Acocks Veld Types occurring in the Mgeni,Luvuvhu and Upper Breede catchments were developed by Schulze(2004) based on a set of working rules linking these parameters toclimatically derived variables (MAP, monthly heat units, frostoccurrence, soil water status in wet, average and dry years) andcrop physiological characteristics. Values for these variables forthe various Acocks Veld Types are given in Appendix B.
The same climate data were used in both the current land useand baseline land cover simulations, any simulated changes tostreamflows thus being attributable solely to changes in land use.
4. Results: modelled hydrological responses to land use change
To assess the impacts of current land uses on the streamflowand its components of baseflow and stormflow within the selectedcatchments, modelled streamflow generated under the currentland use was compared to modelled streamflow generated underbaseline land cover conditions. These results were then used to ad-dress the questions which follow.
4.1. To what extent are contributions from a specific land useproportional to the relative area of that land use in a catchment?
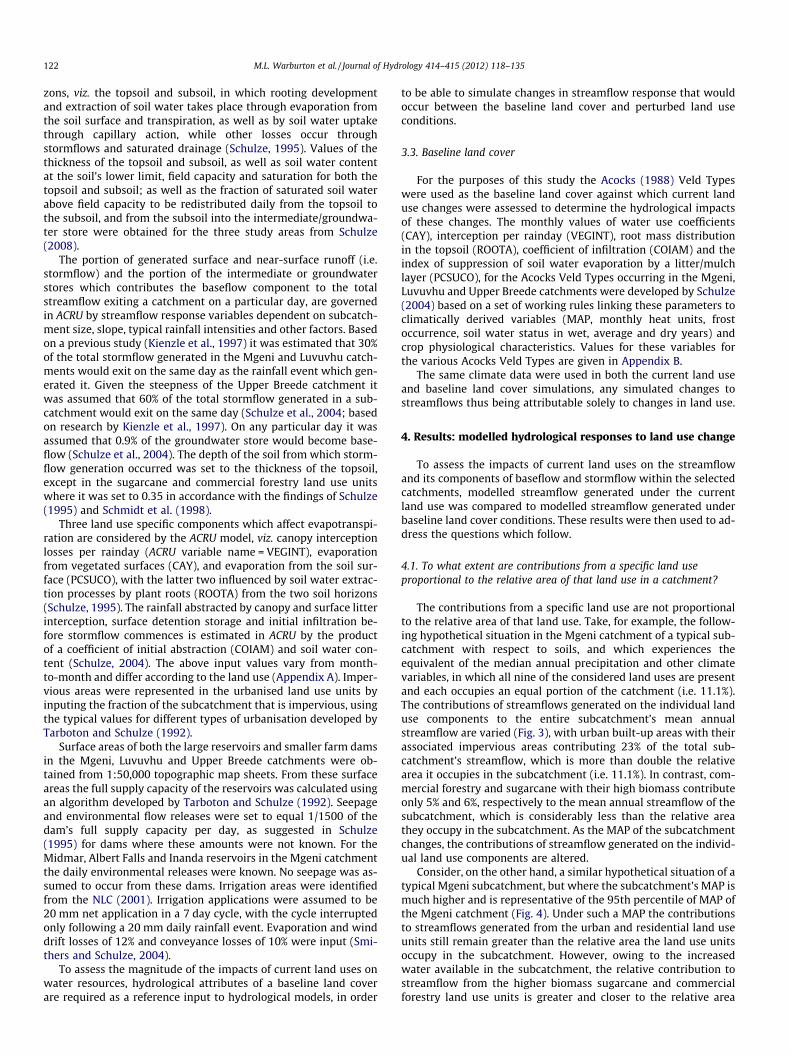
The contributions from a specific land use are not proportionalto the relative area of that land use. Take, for example, the follow-ing hypothetical situation in the Mgeni catchment of a typical sub-catchment with respect to soils, and which experiences theequivalent of the median annual precipitation and other climatevariables, in which all nine of the considered land uses are presentand each occupies an equal portion of the catchment (i.e. 11.1%).The contributions of streamflows generated on the individual landuse components to the entire subcatchment’s mean annualstreamflow are varied (Fig. 3), with urban built-up areas with theirassociated impervious areas contributing 23% of the total sub-catchment’s streamflow, which is more than double the relativearea it occupies in the subcatchment (i.e. 11.1%). In contrast, com-mercial forestry and sugarcane with their high biomass contributeonly 5% and 6%, respectively to the mean annual streamflow of thesubcatchment, which is considerably less than the relative areathey occupy in the subcatchment. As the MAP of the subcatchmentchanges, the contributions of streamflow generated on the individ-ual land use components are altered.
Consider, on the other hand, a similar hypothetical situation of atypical Mgeni subcatchment, but where the subcatchment’s MAP ismuch higher and is representative of the 95th percentile of MAP ofthe Mgeni catchment (Fig. 4). Under such a MAP the contributionsto streamflows generated from the urban and residential land useunits still remain greater than the relative area the land use unitsoccupy in the subcatchment. However, owing to the increasedwater available in the subcatchment, the relative contribution tostreamflow from the higher biomass sugarcane and commercialforestry land use units is greater and closer to the relative area
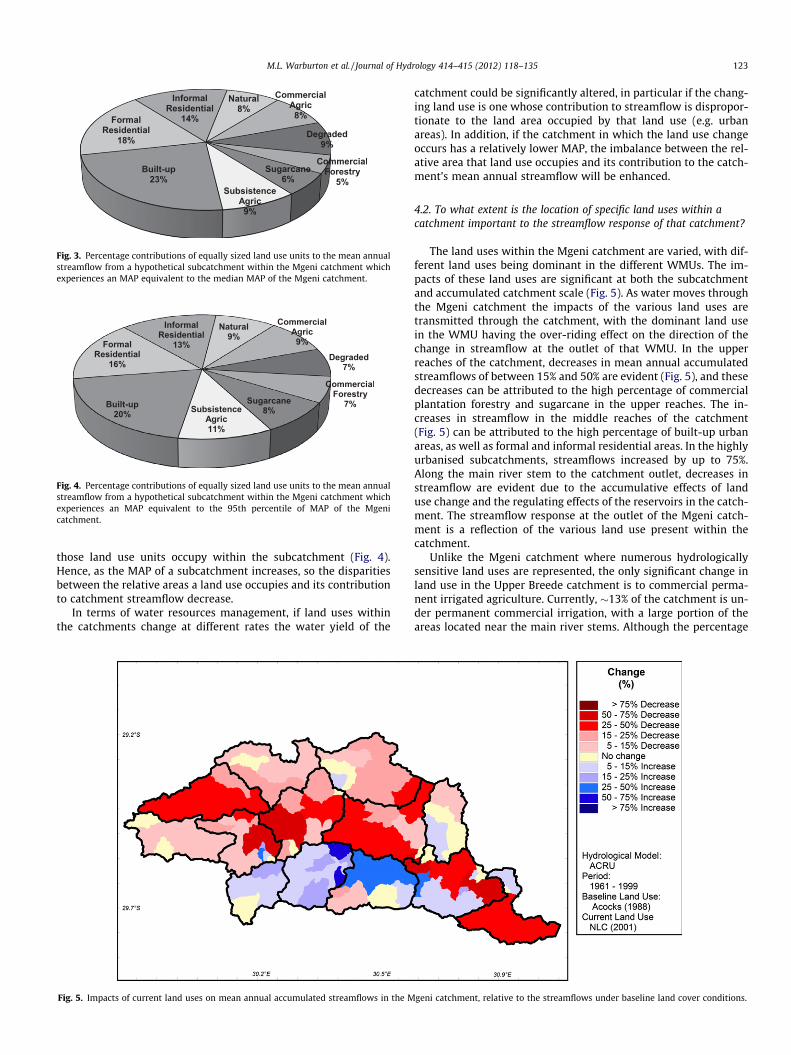
Fig. 3. Percentage contributions of equally sized land use units to the mean annualstreamflow from a hypothetical subcatchment within the Mgeni catchment whichexperiences an MAP equivalent to the median MAP of the Mgeni catchment.
Fig. 4. Percentage contributions of equally sized land use units to the mean annualstreamflow from a hypothetical subcatchment within the Mgeni catchment whichexperiences an MAP equivalent to the 95th percentile of MAP of the Mgenicatchment.
M.L. Warburton et al. / Journal of Hydrology 414–415 (2012) 118–135 123
those land use units occupy within the subcatchment (Fig. 4).Hence, as the MAP of a subcatchment increases, so the disparitiesbetween the relative areas a land use occupies and its contributionto catchment streamflow decrease.
In terms of water resources management, if land uses withinthe catchments change at different rates the water yield of the
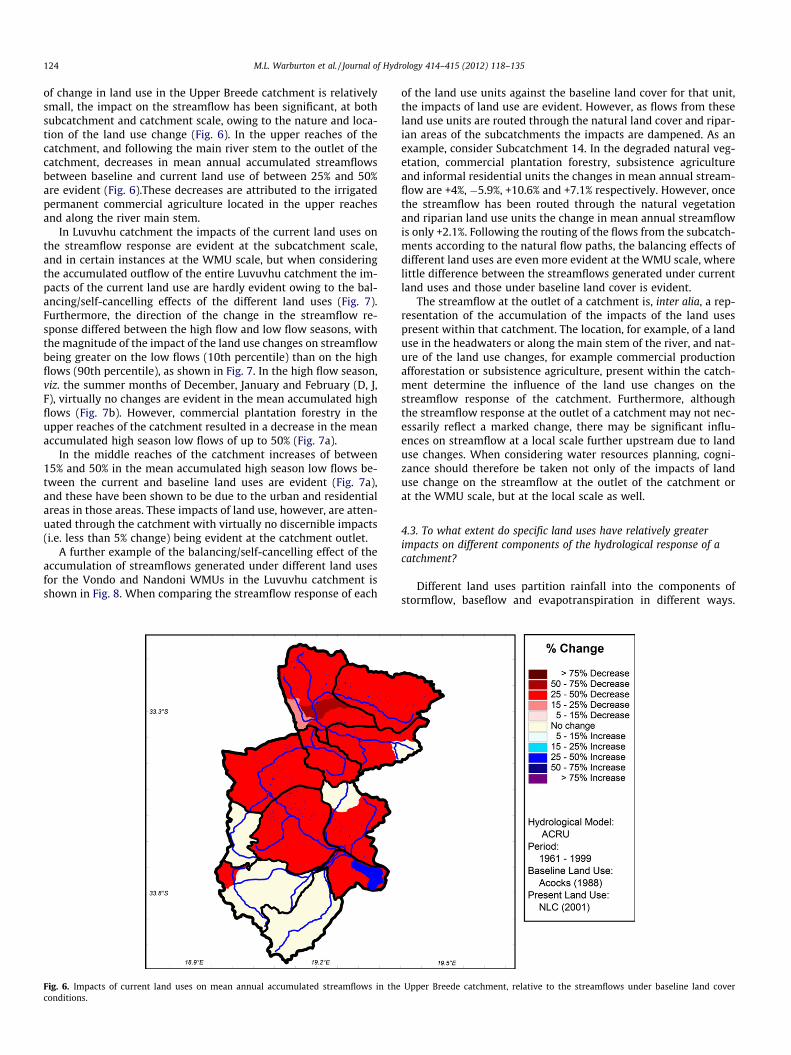
Fig. 5. Impacts of current land uses on mean annual accumulated streamflows in the M
catchment could be significantly altered, in particular if the chang-ing land use is one whose contribution to streamflow is dispropor-tionate to the land area occupied by that land use (e.g. urbanareas). In addition, if the catchment in which the land use changeoccurs has a relatively lower MAP, the imbalance between the rel-ative area that land use occupies and its contribution to the catch-ment’s mean annual streamflow will be enhanced.
4.2. To what extent is the location of specific land uses within acatchment important to the streamflow response of that catchment?
The land uses within the Mgeni catchment are varied, with dif-ferent land uses being dominant in the different WMUs. The im-pacts of these land uses are significant at both the subcatchmentand accumulated catchment scale (Fig. 5). As water moves throughthe Mgeni catchment the impacts of the various land uses aretransmitted through the catchment, with the dominant land usein the WMU having the over-riding effect on the direction of thechange in streamflow at the outlet of that WMU. In the upperreaches of the catchment, decreases in mean annual accumulatedstreamflows of between 15% and 50% are evident (Fig. 5), and thesedecreases can be attributed to the high percentage of commercialplantation forestry and sugarcane in the upper reaches. The in-creases in streamflow in the middle reaches of the catchment(Fig. 5) can be attributed to the high percentage of built-up urbanareas, as well as formal and informal residential areas. In the highlyurbanised subcatchments, streamflows increased by up to 75%.Along the main river stem to the catchment outlet, decreases instreamflow are evident due to the accumulative effects of landuse change and the regulating effects of the reservoirs in the catch-ment. The streamflow response at the outlet of the Mgeni catch-ment is a reflection of the various land use present within thecatchment.
Unlike the Mgeni catchment where numerous hydrologicallysensitive land uses are represented, the only significant change inland use in the Upper Breede catchment is to commercial perma-nent irrigated agriculture. Currently, �13% of the catchment is un-der permanent commercial irrigation, with a large portion of theareas located near the main river stems. Although the percentage
geni catchment, relative to the streamflows under baseline land cover conditions.
124 M.L. Warburton et al. / Journal of Hydrology 414–415 (2012) 118–135
of change in land use in the Upper Breede catchment is relativelysmall, the impact on the streamflow has been significant, at bothsubcatchment and catchment scale, owing to the nature and loca-tion of the land use change (Fig. 6). In the upper reaches of thecatchment, and following the main river stem to the outlet of thecatchment, decreases in mean annual accumulated streamflowsbetween baseline and current land use of between 25% and 50%are evident (Fig. 6).These decreases are attributed to the irrigatedpermanent commercial agriculture located in the upper reachesand along the river main stem.
In Luvuvhu catchment the impacts of the current land uses onthe streamflow response are evident at the subcatchment scale,and in certain instances at the WMU scale, but when consideringthe accumulated outflow of the entire Luvuvhu catchment the im-pacts of the current land use are hardly evident owing to the bal-ancing/self-cancelling effects of the different land uses (Fig. 7).Furthermore, the direction of the change in the streamflow re-sponse differed between the high flow and low flow seasons, withthe magnitude of the impact of the land use changes on streamflowbeing greater on the low flows (10th percentile) than on the highflows (90th percentile), as shown in Fig. 7. In the high flow season,viz. the summer months of December, January and February (D, J,F), virtually no changes are evident in the mean accumulated highflows (Fig. 7b). However, commercial plantation forestry in theupper reaches of the catchment resulted in a decrease in the meanaccumulated high season low flows of up to 50% (Fig. 7a).
In the middle reaches of the catchment increases of between15% and 50% in the mean accumulated high season low flows be-tween the current and baseline land uses are evident (Fig. 7a),and these have been shown to be due to the urban and residentialareas in those areas. These impacts of land use, however, are atten-uated through the catchment with virtually no discernible impacts(i.e. less than 5% change) being evident at the catchment outlet.
A further example of the balancing/self-cancelling effect of theaccumulation of streamflows generated under different land usesfor the Vondo and Nandoni WMUs in the Luvuvhu catchment isshown in Fig. 8. When comparing the streamflow response of each
Fig. 6. Impacts of current land uses on mean annual accumulated streamflows in theconditions.
of the land use units against the baseline land cover for that unit,the impacts of land use are evident. However, as flows from theseland use units are routed through the natural land cover and ripar-ian areas of the subcatchments the impacts are dampened. As anexample, consider Subcatchment 14. In the degraded natural veg-etation, commercial plantation forestry, subsistence agricultureand informal residential units the changes in mean annual stream-flow are +4%, �5.9%, +10.6% and +7.1% respectively. However, oncethe streamflow has been routed through the natural vegetationand riparian land use units the change in mean annual streamflowis only +2.1%. Following the routing of the flows from the subcatch-ments according to the natural flow paths, the balancing effects ofdifferent land uses are even more evident at the WMU scale, wherelittle difference between the streamflows generated under currentland uses and those under baseline land cover is evident.
The streamflow at the outlet of a catchment is, inter alia, a rep-resentation of the accumulation of the impacts of the land usespresent within that catchment. The location, for example, of a landuse in the headwaters or along the main stem of the river, and nat-ure of the land use changes, for example commercial productionafforestation or subsistence agriculture, present within the catch-ment determine the influence of the land use changes on thestreamflow response of the catchment. Furthermore, althoughthe streamflow response at the outlet of a catchment may not nec-essarily reflect a marked change, there may be significant influ-ences on streamflow at a local scale further upstream due to landuse changes. When considering water resources planning, cogni-zance should therefore be taken not only of the impacts of landuse change on the streamflow at the outlet of the catchment orat the WMU scale, but at the local scale as well.
4.3. To what extent do specific land uses have relatively greaterimpacts on different components of the hydrological response of acatchment?
Different land uses partition rainfall into the components ofstormflow, baseflow and evapotranspiration in different ways.
Upper Breede catchment, relative to the streamflows under baseline land cover
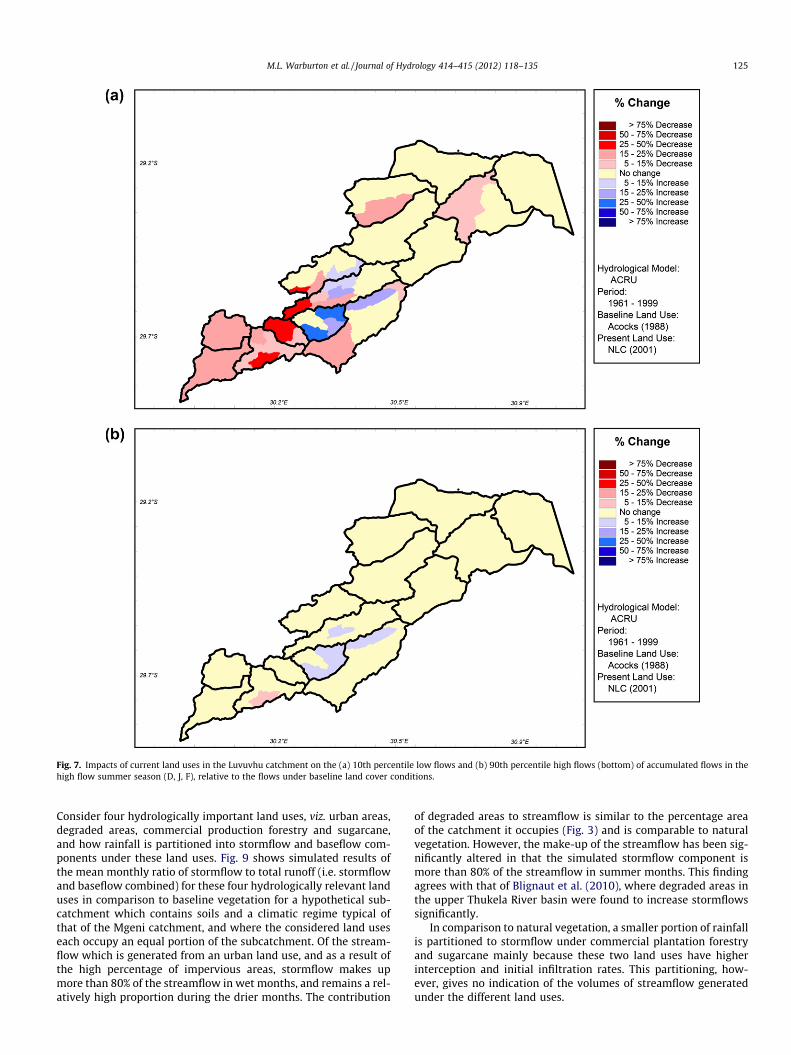
Fig. 7. Impacts of current land uses in the Luvuvhu catchment on the (a) 10th percentile low flows and (b) 90th percentile high flows (bottom) of accumulated flows in thehigh flow summer season (D, J, F), relative to the flows under baseline land cover conditions.
M.L. Warburton et al. / Journal of Hydrology 414–415 (2012) 118–135 125
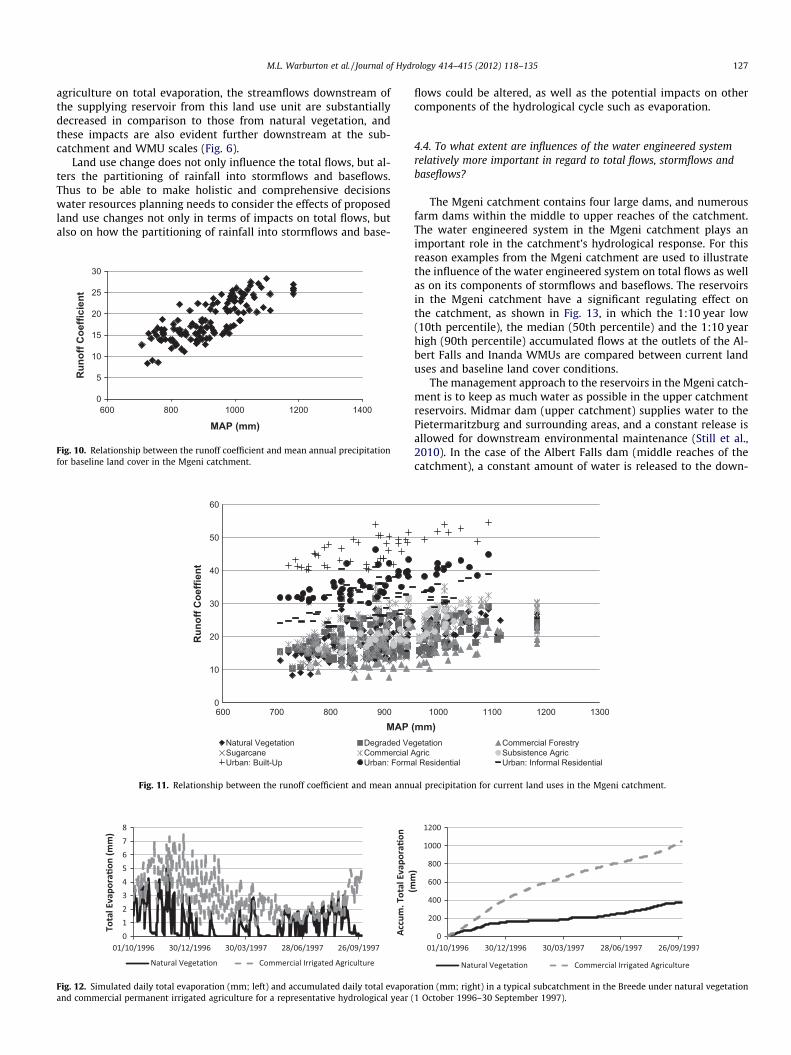
Consider four hydrologically important land uses, viz. urban areas,degraded areas, commercial production forestry and sugarcane,and how rainfall is partitioned into stormflow and baseflow com-ponents under these land uses. Fig. 9 shows simulated results ofthe mean monthly ratio of stormflow to total runoff (i.e. stormflowand baseflow combined) for these four hydrologically relevant landuses in comparison to baseline vegetation for a hypothetical sub-catchment which contains soils and a climatic regime typical ofthat of the Mgeni catchment, and where the considered land useseach occupy an equal portion of the subcatchment. Of the stream-flow which is generated from an urban land use, and as a result ofthe high percentage of impervious areas, stormflow makes upmore than 80% of the streamflow in wet months, and remains a rel-atively high proportion during the drier months. The contribution
of degraded areas to streamflow is similar to the percentage areaof the catchment it occupies (Fig. 3) and is comparable to naturalvegetation. However, the make-up of the streamflow has been sig-nificantly altered in that the simulated stormflow component ismore than 80% of the streamflow in summer months. This findingagrees with that of Blignaut et al. (2010), where degraded areas inthe upper Thukela River basin were found to increase stormflowssignificantly.
In comparison to natural vegetation, a smaller portion of rainfallis partitioned to stormflow under commercial plantation forestryand sugarcane mainly because these two land uses have higherinterception and initial infiltration rates. This partitioning, how-ever, gives no indication of the volumes of streamflow generatedunder the different land uses.
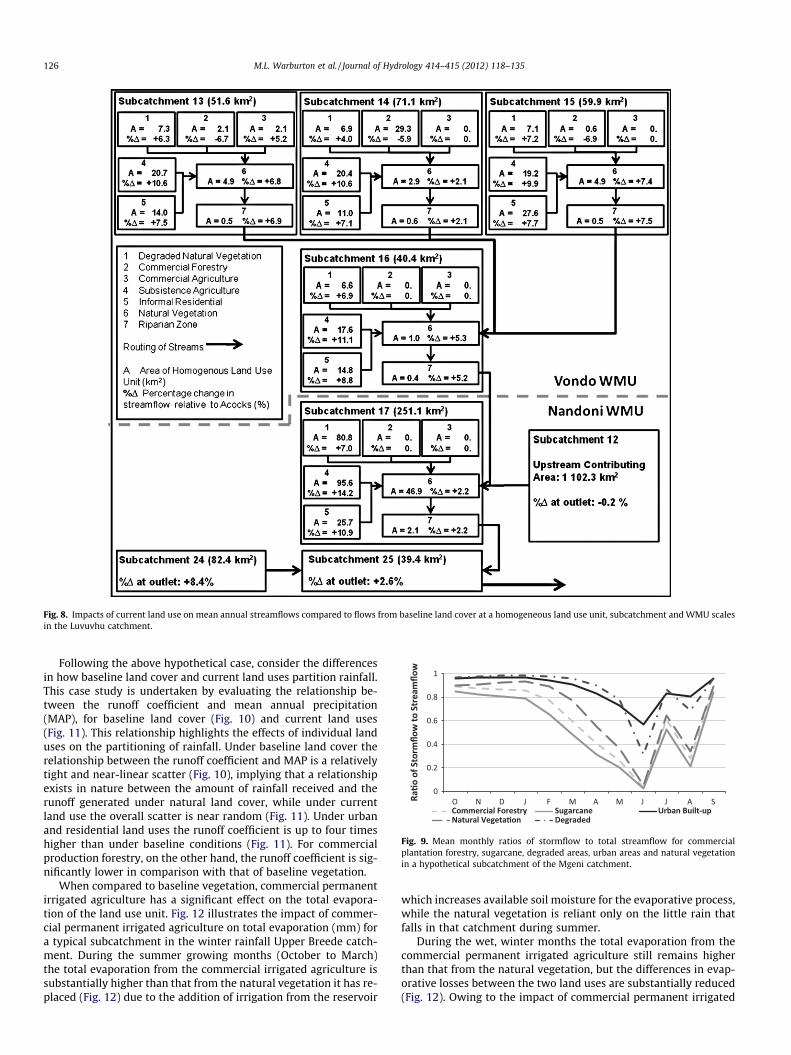
Fig. 8. Impacts of current land use on mean annual streamflows compared to flows from baseline land cover at a homogeneous land use unit, subcatchment and WMU scalesin the Luvuvhu catchment.
Fig. 9. Mean monthly ratios of stormflow to total streamflow for commercialplantation forestry, sugarcane, degraded areas, urban areas and natural vegetationin a hypothetical subcatchment of the Mgeni catchment.
126 M.L. Warburton et al. / Journal of Hydrology 414–415 (2012) 118–135
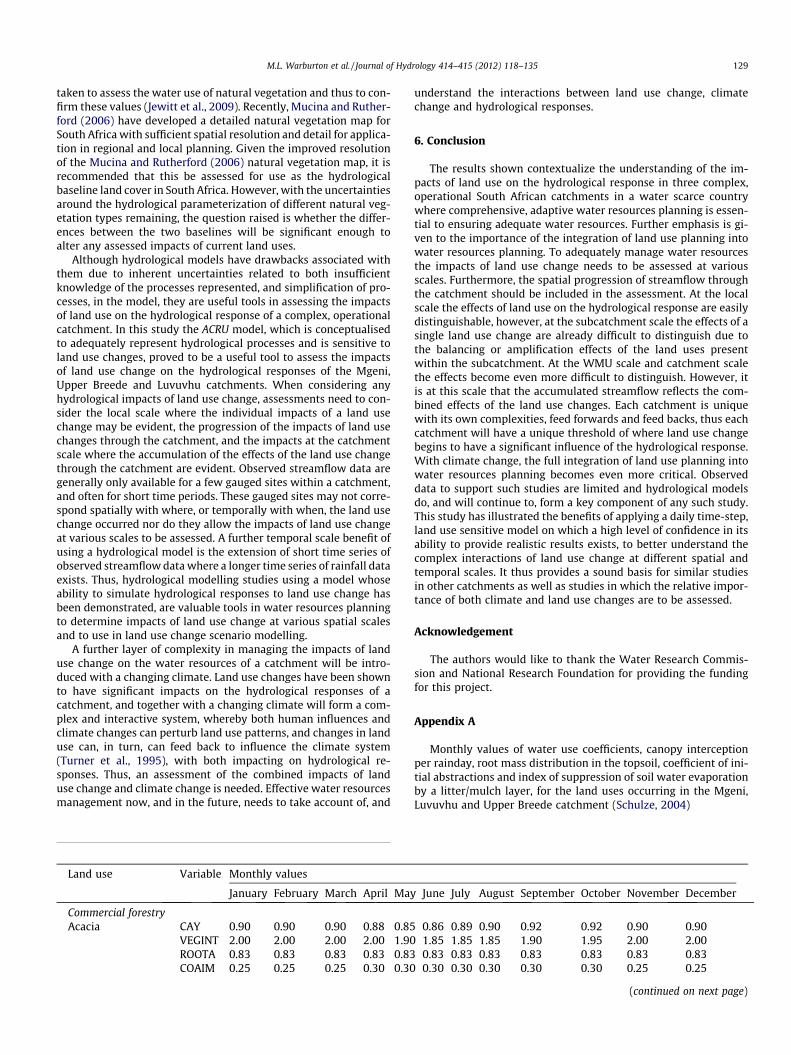
Following the above hypothetical case, consider the differencesin how baseline land cover and current land uses partition rainfall.This case study is undertaken by evaluating the relationship be-tween the runoff coefficient and mean annual precipitation(MAP), for baseline land cover (Fig. 10) and current land uses(Fig. 11). This relationship highlights the effects of individual landuses on the partitioning of rainfall. Under baseline land cover therelationship between the runoff coefficient and MAP is a relativelytight and near-linear scatter (Fig. 10), implying that a relationshipexists in nature between the amount of rainfall received and therunoff generated under natural land cover, while under currentland use the overall scatter is near random (Fig. 11). Under urbanand residential land uses the runoff coefficient is up to four timeshigher than under baseline conditions (Fig. 11). For commercialproduction forestry, on the other hand, the runoff coefficient is sig-nificantly lower in comparison with that of baseline vegetation.
When compared to baseline vegetation, commercial permanentirrigated agriculture has a significant effect on the total evapora-tion of the land use unit. Fig. 12 illustrates the impact of commer-cial permanent irrigated agriculture on total evaporation (mm) fora typical subcatchment in the winter rainfall Upper Breede catch-ment. During the summer growing months (October to March)the total evaporation from the commercial irrigated agriculture issubstantially higher than that from the natural vegetation it has re-placed (Fig. 12) due to the addition of irrigation from the reservoir
which increases available soil moisture for the evaporative process,while the natural vegetation is reliant only on the little rain thatfalls in that catchment during summer.
During the wet, winter months the total evaporation from thecommercial permanent irrigated agriculture still remains higherthan that from the natural vegetation, but the differences in evap-orative losses between the two land uses are substantially reduced(Fig. 12). Owing to the impact of commercial permanent irrigated
M.L. Warburton et al. / Journal of Hydrology 414–415 (2012) 118–135 127
agriculture on total evaporation, the streamflows downstream ofthe supplying reservoir from this land use unit are substantiallydecreased in comparison to those from natural vegetation, andthese impacts are also evident further downstream at the sub-catchment and WMU scales (Fig. 6).
Land use change does not only influence the total flows, but al-ters the partitioning of rainfall into stormflows and baseflows.Thus to be able to make holistic and comprehensive decisionswater resources planning needs to consider the effects of proposedland use changes not only in terms of impacts on total flows, butalso on how the partitioning of rainfall into stormflows and base-
600 800 1000 1200 1400
Run
off C
oeffi
cien
t
MAP (mm)
0
5
10
15
20
25
30
Fig. 10. Relationship between the runoff coefficient and mean annual precipitationfor baseline land cover in the Mgeni catchment.
600 700 800 900
Run
off C
oeffi
ent
MAP Natural Vegetation Degraded VeSugarcane Commercial AUrban: Built-Up Urban: Forma
0
10
20
30
40
50
60
Fig. 11. Relationship between the runoff coefficient and mean annu
Fig. 12. Simulated daily total evaporation (mm; left) and accumulated daily total evaporand commercial permanent irrigated agriculture for a representative hydrological year (
flows could be altered, as well as the potential impacts on othercomponents of the hydrological cycle such as evaporation.
4.4. To what extent are influences of the water engineered systemrelatively more important in regard to total flows, stormflows andbaseflows?
The Mgeni catchment contains four large dams, and numerousfarm dams within the middle to upper reaches of the catchment.The water engineered system in the Mgeni catchment plays animportant role in the catchment’s hydrological response. For thisreason examples from the Mgeni catchment are used to illustratethe influence of the water engineered system on total flows as wellas on its components of stormflows and baseflows. The reservoirsin the Mgeni catchment have a significant regulating effect onthe catchment, as shown in Fig. 13, in which the 1:10 year low(10th percentile), the median (50th percentile) and the 1:10 yearhigh (90th percentile) accumulated flows at the outlets of the Al-bert Falls and Inanda WMUs are compared between current landuses and baseline land cover conditions.
The management approach to the reservoirs in the Mgeni catch-ment is to keep as much water as possible in the upper catchmentreservoirs. Midmar dam (upper catchment) supplies water to thePietermaritzburg and surrounding areas, and a constant release isallowed for downstream environmental maintenance (Still et al.,2010). In the case of the Albert Falls dam (middle reaches of thecatchment), a constant amount of water is released to the down-
1000 1100 1200 1300
(mm)getation Commercial Forestrygric Subsistence Agricl Residential Urban: Informal Residential
al precipitation for current land uses in the Mgeni catchment.
ation (mm; right) in a typical subcatchment in the Breede under natural vegetation1 October 1996–30 September 1997).
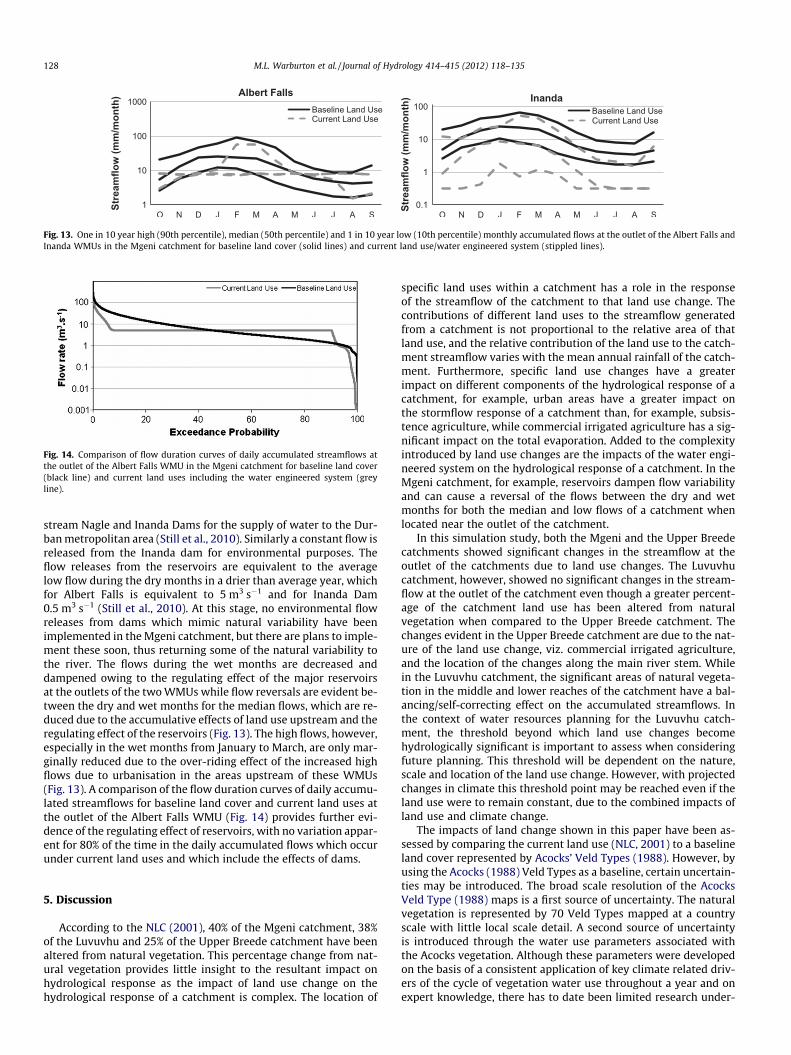
Fig. 13. One in 10 year high (90th percentile), median (50th percentile) and 1 in 10 year low (10th percentile) monthly accumulated flows at the outlet of the Albert Falls andInanda WMUs in the Mgeni catchment for baseline land cover (solid lines) and current land use/water engineered system (stippled lines).
Fig. 14. Comparison of flow duration curves of daily accumulated streamflows atthe outlet of the Albert Falls WMU in the Mgeni catchment for baseline land cover(black line) and current land uses including the water engineered system (greyline).
128 M.L. Warburton et al. / Journal of Hydrology 414–415 (2012) 118–135
stream Nagle and Inanda Dams for the supply of water to the Dur-ban metropolitan area (Still et al., 2010). Similarly a constant flow isreleased from the Inanda dam for environmental purposes. Theflow releases from the reservoirs are equivalent to the averagelow flow during the dry months in a drier than average year, whichfor Albert Falls is equivalent to 5 m3 s�1 and for Inanda Dam0.5 m3 s�1 (Still et al., 2010). At this stage, no environmental flowreleases from dams which mimic natural variability have beenimplemented in the Mgeni catchment, but there are plans to imple-ment these soon, thus returning some of the natural variability tothe river. The flows during the wet months are decreased anddampened owing to the regulating effect of the major reservoirsat the outlets of the two WMUs while flow reversals are evident be-tween the dry and wet months for the median flows, which are re-duced due to the accumulative effects of land use upstream and theregulating effect of the reservoirs (Fig. 13). The high flows, however,especially in the wet months from January to March, are only mar-ginally reduced due to the over-riding effect of the increased highflows due to urbanisation in the areas upstream of these WMUs(Fig. 13). A comparison of the flow duration curves of daily accumu-lated streamflows for baseline land cover and current land uses atthe outlet of the Albert Falls WMU (Fig. 14) provides further evi-dence of the regulating effect of reservoirs, with no variation appar-ent for 80% of the time in the daily accumulated flows which occurunder current land uses and which include the effects of dams.
5. Discussion
According to the NLC (2001), 40% of the Mgeni catchment, 38%of the Luvuvhu and 25% of the Upper Breede catchment have beenaltered from natural vegetation. This percentage change from nat-ural vegetation provides little insight to the resultant impact onhydrological response as the impact of land use change on thehydrological response of a catchment is complex. The location of
specific land uses within a catchment has a role in the responseof the streamflow of the catchment to that land use change. Thecontributions of different land uses to the streamflow generatedfrom a catchment is not proportional to the relative area of thatland use, and the relative contribution of the land use to the catch-ment streamflow varies with the mean annual rainfall of the catch-ment. Furthermore, specific land use changes have a greaterimpact on different components of the hydrological response of acatchment, for example, urban areas have a greater impact onthe stormflow response of a catchment than, for example, subsis-tence agriculture, while commercial irrigated agriculture has a sig-nificant impact on the total evaporation. Added to the complexityintroduced by land use changes are the impacts of the water engi-neered system on the hydrological response of a catchment. In theMgeni catchment, for example, reservoirs dampen flow variabilityand can cause a reversal of the flows between the dry and wetmonths for both the median and low flows of a catchment whenlocated near the outlet of the catchment.
In this simulation study, both the Mgeni and the Upper Breedecatchments showed significant changes in the streamflow at theoutlet of the catchments due to land use changes. The Luvuvhucatchment, however, showed no significant changes in the stream-flow at the outlet of the catchment even though a greater percent-age of the catchment land use has been altered from naturalvegetation when compared to the Upper Breede catchment. Thechanges evident in the Upper Breede catchment are due to the nat-ure of the land use change, viz. commercial irrigated agriculture,and the location of the changes along the main river stem. Whilein the Luvuvhu catchment, the significant areas of natural vegeta-tion in the middle and lower reaches of the catchment have a bal-ancing/self-correcting effect on the accumulated streamflows. Inthe context of water resources planning for the Luvuvhu catch-ment, the threshold beyond which land use changes becomehydrologically significant is important to assess when consideringfuture planning. This threshold will be dependent on the nature,scale and location of the land use change. However, with projectedchanges in climate this threshold point may be reached even if theland use were to remain constant, due to the combined impacts ofland use and climate change.
The impacts of land change shown in this paper have been as-sessed by comparing the current land use (NLC, 2001) to a baselineland cover represented by Acocks’ Veld Types (1988). However, byusing the Acocks (1988) Veld Types as a baseline, certain uncertain-ties may be introduced. The broad scale resolution of the AcocksVeld Type (1988) maps is a first source of uncertainty. The naturalvegetation is represented by 70 Veld Types mapped at a countryscale with little local scale detail. A second source of uncertaintyis introduced through the water use parameters associated withthe Acocks vegetation. Although these parameters were developedon the basis of a consistent application of key climate related driv-ers of the cycle of vegetation water use throughout a year and onexpert knowledge, there has to date been limited research under-
M.L. Warburton et al. / Journal of Hydrology 414–415 (2012) 118–135 129
taken to assess the water use of natural vegetation and thus to con-firm these values (Jewitt et al., 2009). Recently, Mucina and Ruther-ford (2006) have developed a detailed natural vegetation map forSouth Africa with sufficient spatial resolution and detail for applica-tion in regional and local planning. Given the improved resolutionof the Mucina and Rutherford (2006) natural vegetation map, it isrecommended that this be assessed for use as the hydrologicalbaseline land cover in South Africa. However, with the uncertaintiesaround the hydrological parameterization of different natural veg-etation types remaining, the question raised is whether the differ-ences between the two baselines will be significant enough toalter any assessed impacts of current land uses.
Although hydrological models have drawbacks associated withthem due to inherent uncertainties related to both insufficientknowledge of the processes represented, and simplification of pro-cesses, in the model, they are useful tools in assessing the impactsof land use on the hydrological response of a complex, operationalcatchment. In this study the ACRU model, which is conceptualisedto adequately represent hydrological processes and is sensitive toland use changes, proved to be a useful tool to assess the impactsof land use change on the hydrological responses of the Mgeni,Upper Breede and Luvuvhu catchments. When considering anyhydrological impacts of land use change, assessments need to con-sider the local scale where the individual impacts of a land usechange may be evident, the progression of the impacts of land usechanges through the catchment, and the impacts at the catchmentscale where the accumulation of the effects of the land use changethrough the catchment are evident. Observed streamflow data aregenerally only available for a few gauged sites within a catchment,and often for short time periods. These gauged sites may not corre-spond spatially with where, or temporally with when, the land usechange occurred nor do they allow the impacts of land use changeat various scales to be assessed. A further temporal scale benefit ofusing a hydrological model is the extension of short time series ofobserved streamflow data where a longer time series of rainfall dataexists. Thus, hydrological modelling studies using a model whoseability to simulate hydrological responses to land use change hasbeen demonstrated, are valuable tools in water resources planningto determine impacts of land use change at various spatial scalesand to use in land use change scenario modelling.
A further layer of complexity in managing the impacts of landuse change on the water resources of a catchment will be intro-duced with a changing climate. Land use changes have been shownto have significant impacts on the hydrological responses of acatchment, and together with a changing climate will form a com-plex and interactive system, whereby both human influences andclimate changes can perturb land use patterns, and changes in landuse can, in turn, can feed back to influence the climate system(Turner et al., 1995), with both impacting on hydrological re-sponses. Thus, an assessment of the combined impacts of landuse change and climate change is needed. Effective water resourcesmanagement now, and in the future, needs to take account of, and
Land use Variable Monthly values
January February March April May
Commercial forestryAcacia CAY 0.90 0.90 0.90 0.88 0.85
VEGINT 2.00 2.00 2.00 2.00 1.90ROOTA 0.83 0.83 0.83 0.83 0.83COAIM 0.25 0.25 0.25 0.30 0.30
understand the interactions between land use change, climatechange and hydrological responses.
6. Conclusion
The results shown contextualize the understanding of the im-pacts of land use on the hydrological response in three complex,operational South African catchments in a water scarce countrywhere comprehensive, adaptive water resources planning is essen-tial to ensuring adequate water resources. Further emphasis is gi-ven to the importance of the integration of land use planning intowater resources planning. To adequately manage water resourcesthe impacts of land use change needs to be assessed at variousscales. Furthermore, the spatial progression of streamflow throughthe catchment should be included in the assessment. At the localscale the effects of land use on the hydrological response are easilydistinguishable, however, at the subcatchment scale the effects of asingle land use change are already difficult to distinguish due tothe balancing or amplification effects of the land uses presentwithin the subcatchment. At the WMU scale and catchment scalethe effects become even more difficult to distinguish. However, itis at this scale that the accumulated streamflow reflects the com-bined effects of the land use changes. Each catchment is uniquewith its own complexities, feed forwards and feed backs, thus eachcatchment will have a unique threshold of where land use changebegins to have a significant influence of the hydrological response.With climate change, the full integration of land use planning intowater resources planning becomes even more critical. Observeddata to support such studies are limited and hydrological modelsdo, and will continue to, form a key component of any such study.This study has illustrated the benefits of applying a daily time-step,land use sensitive model on which a high level of confidence in itsability to provide realistic results exists, to better understand thecomplex interactions of land use change at different spatial andtemporal scales. It thus provides a sound basis for similar studiesin other catchments as well as studies in which the relative impor-tance of both climate and land use changes are to be assessed.
Acknowledgement
The authors would like to thank the Water Research Commis-sion and National Research Foundation for providing the fundingfor this project.
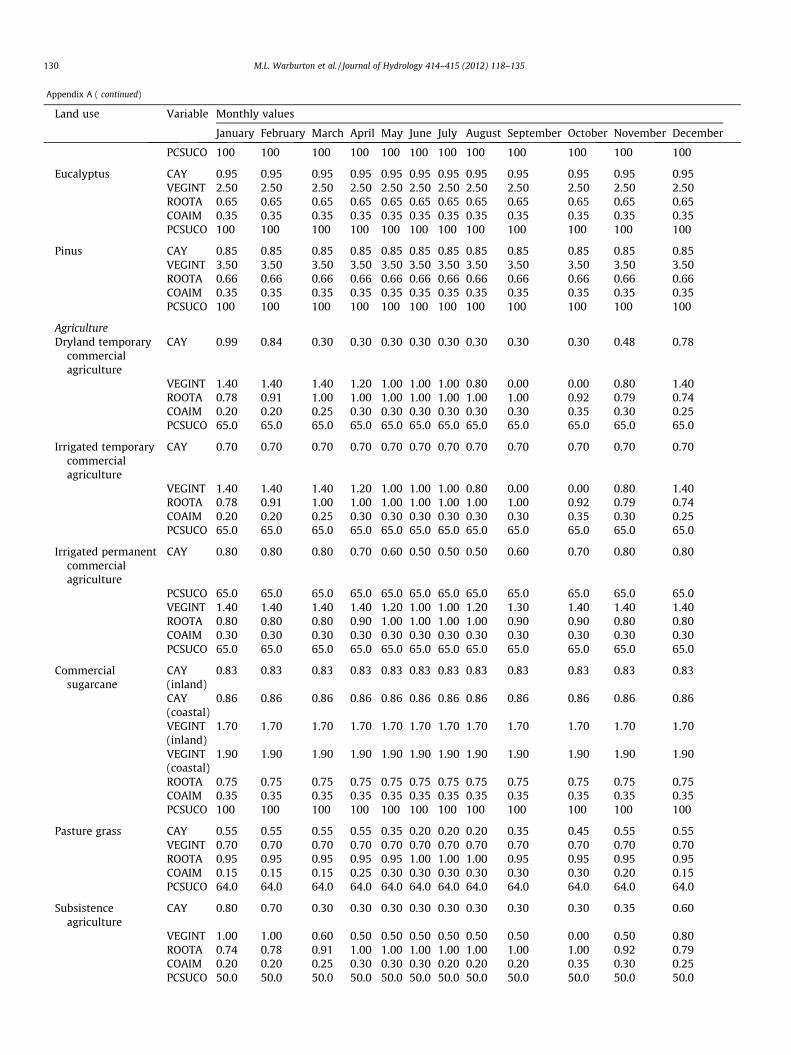
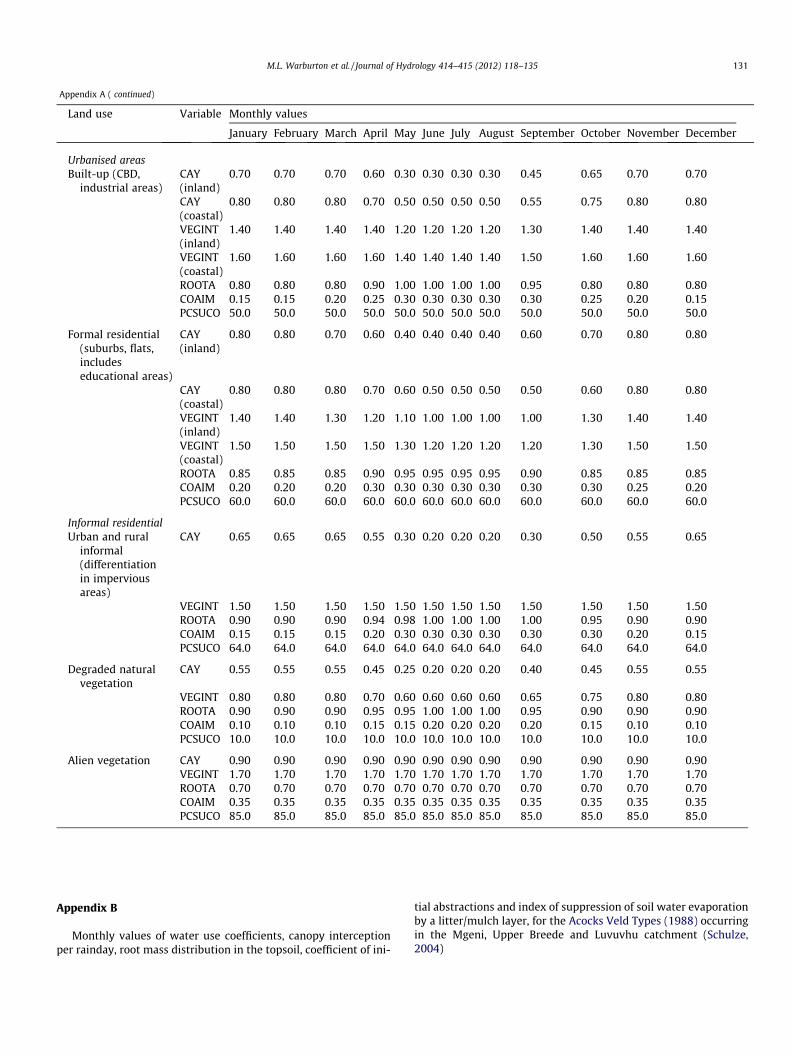
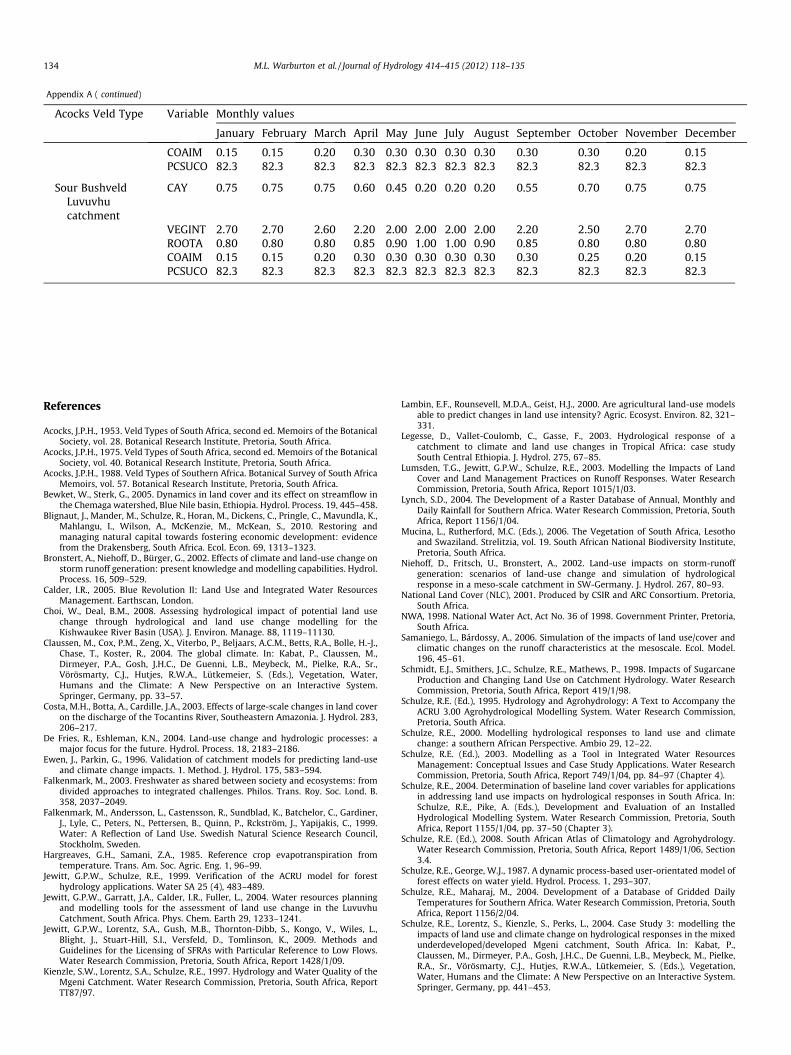
Appendix A
Monthly values of water use coefficients, canopy interceptionper rainday, root mass distribution in the topsoil, coefficient of ini-tial abstractions and index of suppression of soil water evaporationby a litter/mulch layer, for the land uses occurring in the Mgeni,Luvuvhu and Upper Breede catchment (Schulze, 2004)
June July August September October November December
0.86 0.89 0.90 0.92 0.92 0.90 0.901.85 1.85 1.85 1.90 1.95 2.00 2.000.83 0.83 0.83 0.83 0.83 0.83 0.830.30 0.30 0.30 0.30 0.30 0.25 0.25
(continued on next page)
Appendix A ( continued)
Land use Variable Monthly values
January February March April May June July August September October November December
PCSUCO 100 100 100 100 100 100 100 100 100 100 100 100
Eucalyptus CAY 0.95 0.95 0.95 0.95 0.95 0.95 0.95 0.95 0.95 0.95 0.95 0.95VEGINT 2.50 2.50 2.50 2.50 2.50 2.50 2.50 2.50 2.50 2.50 2.50 2.50ROOTA 0.65 0.65 0.65 0.65 0.65 0.65 0.65 0.65 0.65 0.65 0.65 0.65COAIM 0.35 0.35 0.35 0.35 0.35 0.35 0.35 0.35 0.35 0.35 0.35 0.35PCSUCO 100 100 100 100 100 100 100 100 100 100 100 100
Pinus CAY 0.85 0.85 0.85 0.85 0.85 0.85 0.85 0.85 0.85 0.85 0.85 0.85VEGINT 3.50 3.50 3.50 3.50 3.50 3.50 3.50 3.50 3.50 3.50 3.50 3.50ROOTA 0.66 0.66 0.66 0.66 0.66 0.66 0.66 0.66 0.66 0.66 0.66 0.66COAIM 0.35 0.35 0.35 0.35 0.35 0.35 0.35 0.35 0.35 0.35 0.35 0.35PCSUCO 100 100 100 100 100 100 100 100 100 100 100 100
AgricultureDryland temporary
commercialagriculture
CAY 0.99 0.84 0.30 0.30 0.30 0.30 0.30 0.30 0.30 0.30 0.48 0.78
VEGINT 1.40 1.40 1.40 1.20 1.00 1.00 1.00 0.80 0.00 0.00 0.80 1.40ROOTA 0.78 0.91 1.00 1.00 1.00 1.00 1.00 1.00 1.00 0.92 0.79 0.74COAIM 0.20 0.20 0.25 0.30 0.30 0.30 0.30 0.30 0.30 0.35 0.30 0.25PCSUCO 65.0 65.0 65.0 65.0 65.0 65.0 65.0 65.0 65.0 65.0 65.0 65.0
Irrigated temporarycommercialagriculture
CAY 0.70 0.70 0.70 0.70 0.70 0.70 0.70 0.70 0.70 0.70 0.70 0.70
VEGINT 1.40 1.40 1.40 1.20 1.00 1.00 1.00 0.80 0.00 0.00 0.80 1.40ROOTA 0.78 0.91 1.00 1.00 1.00 1.00 1.00 1.00 1.00 0.92 0.79 0.74COAIM 0.20 0.20 0.25 0.30 0.30 0.30 0.30 0.30 0.30 0.35 0.30 0.25PCSUCO 65.0 65.0 65.0 65.0 65.0 65.0 65.0 65.0 65.0 65.0 65.0 65.0
Irrigated permanentcommercialagriculture
CAY 0.80 0.80 0.80 0.70 0.60 0.50 0.50 0.50 0.60 0.70 0.80 0.80
PCSUCO 65.0 65.0 65.0 65.0 65.0 65.0 65.0 65.0 65.0 65.0 65.0 65.0VEGINT 1.40 1.40 1.40 1.40 1.20 1.00 1.00 1.20 1.30 1.40 1.40 1.40ROOTA 0.80 0.80 0.80 0.90 1.00 1.00 1.00 1.00 0.90 0.90 0.80 0.80COAIM 0.30 0.30 0.30 0.30 0.30 0.30 0.30 0.30 0.30 0.30 0.30 0.30PCSUCO 65.0 65.0 65.0 65.0 65.0 65.0 65.0 65.0 65.0 65.0 65.0 65.0
Commercialsugarcane
CAY(inland)
0.83 0.83 0.83 0.83 0.83 0.83 0.83 0.83 0.83 0.83 0.83 0.83
CAY(coastal)
0.86 0.86 0.86 0.86 0.86 0.86 0.86 0.86 0.86 0.86 0.86 0.86
VEGINT(inland)
1.70 1.70 1.70 1.70 1.70 1.70 1.70 1.70 1.70 1.70 1.70 1.70
VEGINT(coastal)
1.90 1.90 1.90 1.90 1.90 1.90 1.90 1.90 1.90 1.90 1.90 1.90
ROOTA 0.75 0.75 0.75 0.75 0.75 0.75 0.75 0.75 0.75 0.75 0.75 0.75COAIM 0.35 0.35 0.35 0.35 0.35 0.35 0.35 0.35 0.35 0.35 0.35 0.35PCSUCO 100 100 100 100 100 100 100 100 100 100 100 100
Pasture grass CAY 0.55 0.55 0.55 0.55 0.35 0.20 0.20 0.20 0.35 0.45 0.55 0.55VEGINT 0.70 0.70 0.70 0.70 0.70 0.70 0.70 0.70 0.70 0.70 0.70 0.70ROOTA 0.95 0.95 0.95 0.95 0.95 1.00 1.00 1.00 0.95 0.95 0.95 0.95COAIM 0.15 0.15 0.15 0.25 0.30 0.30 0.30 0.30 0.30 0.30 0.20 0.15PCSUCO 64.0 64.0 64.0 64.0 64.0 64.0 64.0 64.0 64.0 64.0 64.0 64.0
Subsistenceagriculture
CAY 0.80 0.70 0.30 0.30 0.30 0.30 0.30 0.30 0.30 0.30 0.35 0.60
VEGINT 1.00 1.00 0.60 0.50 0.50 0.50 0.50 0.50 0.50 0.00 0.50 0.80ROOTA 0.74 0.78 0.91 1.00 1.00 1.00 1.00 1.00 1.00 1.00 0.92 0.79COAIM 0.20 0.20 0.25 0.30 0.30 0.30 0.20 0.20 0.20 0.35 0.30 0.25PCSUCO 50.0 50.0 50.0 50.0 50.0 50.0 50.0 50.0 50.0 50.0 50.0 50.0
130 M.L. Warburton et al. / Journal of Hydrology 414–415 (2012) 118–135
Appendix A ( continued)
Land use Variable Monthly values
January February March April May June July August September October November December
Urbanised areasBuilt-up (CBD,
industrial areas)CAY(inland)
0.70 0.70 0.70 0.60 0.30 0.30 0.30 0.30 0.45 0.65 0.70 0.70
CAY(coastal)
0.80 0.80 0.80 0.70 0.50 0.50 0.50 0.50 0.55 0.75 0.80 0.80
VEGINT(inland)
1.40 1.40 1.40 1.40 1.20 1.20 1.20 1.20 1.30 1.40 1.40 1.40
VEGINT(coastal)
1.60 1.60 1.60 1.60 1.40 1.40 1.40 1.40 1.50 1.60 1.60 1.60
ROOTA 0.80 0.80 0.80 0.90 1.00 1.00 1.00 1.00 0.95 0.80 0.80 0.80COAIM 0.15 0.15 0.20 0.25 0.30 0.30 0.30 0.30 0.30 0.25 0.20 0.15PCSUCO 50.0 50.0 50.0 50.0 50.0 50.0 50.0 50.0 50.0 50.0 50.0 50.0
Formal residential(suburbs, flats,includeseducational areas)
CAY(inland)
0.80 0.80 0.70 0.60 0.40 0.40 0.40 0.40 0.60 0.70 0.80 0.80
CAY(coastal)
0.80 0.80 0.80 0.70 0.60 0.50 0.50 0.50 0.50 0.60 0.80 0.80
VEGINT(inland)
1.40 1.40 1.30 1.20 1.10 1.00 1.00 1.00 1.00 1.30 1.40 1.40
VEGINT(coastal)
1.50 1.50 1.50 1.50 1.30 1.20 1.20 1.20 1.20 1.30 1.50 1.50
ROOTA 0.85 0.85 0.85 0.90 0.95 0.95 0.95 0.95 0.90 0.85 0.85 0.85COAIM 0.20 0.20 0.20 0.30 0.30 0.30 0.30 0.30 0.30 0.30 0.25 0.20PCSUCO 60.0 60.0 60.0 60.0 60.0 60.0 60.0 60.0 60.0 60.0 60.0 60.0
Informal residentialUrban and rural
informal(differentiationin imperviousareas)
CAY 0.65 0.65 0.65 0.55 0.30 0.20 0.20 0.20 0.30 0.50 0.55 0.65
VEGINT 1.50 1.50 1.50 1.50 1.50 1.50 1.50 1.50 1.50 1.50 1.50 1.50ROOTA 0.90 0.90 0.90 0.94 0.98 1.00 1.00 1.00 1.00 0.95 0.90 0.90COAIM 0.15 0.15 0.15 0.20 0.30 0.30 0.30 0.30 0.30 0.30 0.20 0.15PCSUCO 64.0 64.0 64.0 64.0 64.0 64.0 64.0 64.0 64.0 64.0 64.0 64.0
Degraded naturalvegetation
CAY 0.55 0.55 0.55 0.45 0.25 0.20 0.20 0.20 0.40 0.45 0.55 0.55
VEGINT 0.80 0.80 0.80 0.70 0.60 0.60 0.60 0.60 0.65 0.75 0.80 0.80ROOTA 0.90 0.90 0.90 0.95 0.95 1.00 1.00 1.00 0.95 0.90 0.90 0.90COAIM 0.10 0.10 0.10 0.15 0.15 0.20 0.20 0.20 0.20 0.15 0.10 0.10PCSUCO 10.0 10.0 10.0 10.0 10.0 10.0 10.0 10.0 10.0 10.0 10.0 10.0
Alien vegetation CAY 0.90 0.90 0.90 0.90 0.90 0.90 0.90 0.90 0.90 0.90 0.90 0.90VEGINT 1.70 1.70 1.70 1.70 1.70 1.70 1.70 1.70 1.70 1.70 1.70 1.70ROOTA 0.70 0.70 0.70 0.70 0.70 0.70 0.70 0.70 0.70 0.70 0.70 0.70COAIM 0.35 0.35 0.35 0.35 0.35 0.35 0.35 0.35 0.35 0.35 0.35 0.35PCSUCO 85.0 85.0 85.0 85.0 85.0 85.0 85.0 85.0 85.0 85.0 85.0 85.0
M.L. Warburton et al. / Journal of Hydrology 414–415 (2012) 118–135 131
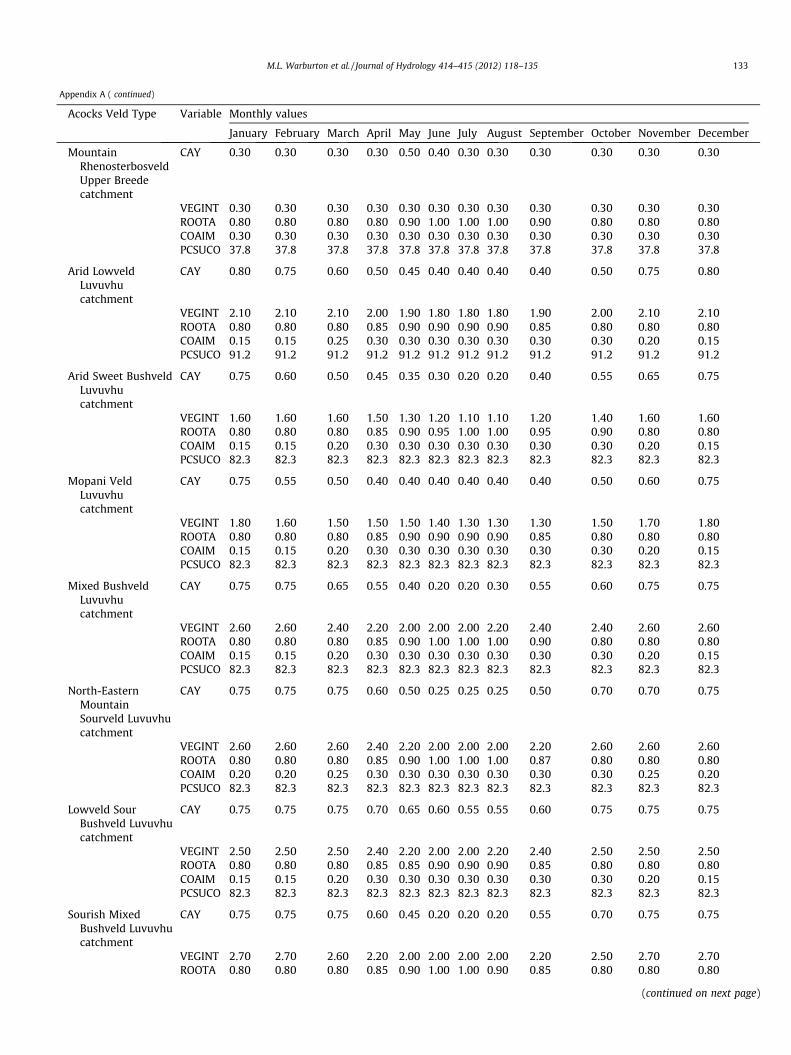
Appendix B
Monthly values of water use coefficients, canopy interceptionper rainday, root mass distribution in the topsoil, coefficient of ini-
tial abstractions and index of suppression of soil water evaporationby a litter/mulch layer, for the Acocks Veld Types (1988) occurringin the Mgeni, Upper Breede and Luvuvhu catchment (Schulze,2004)
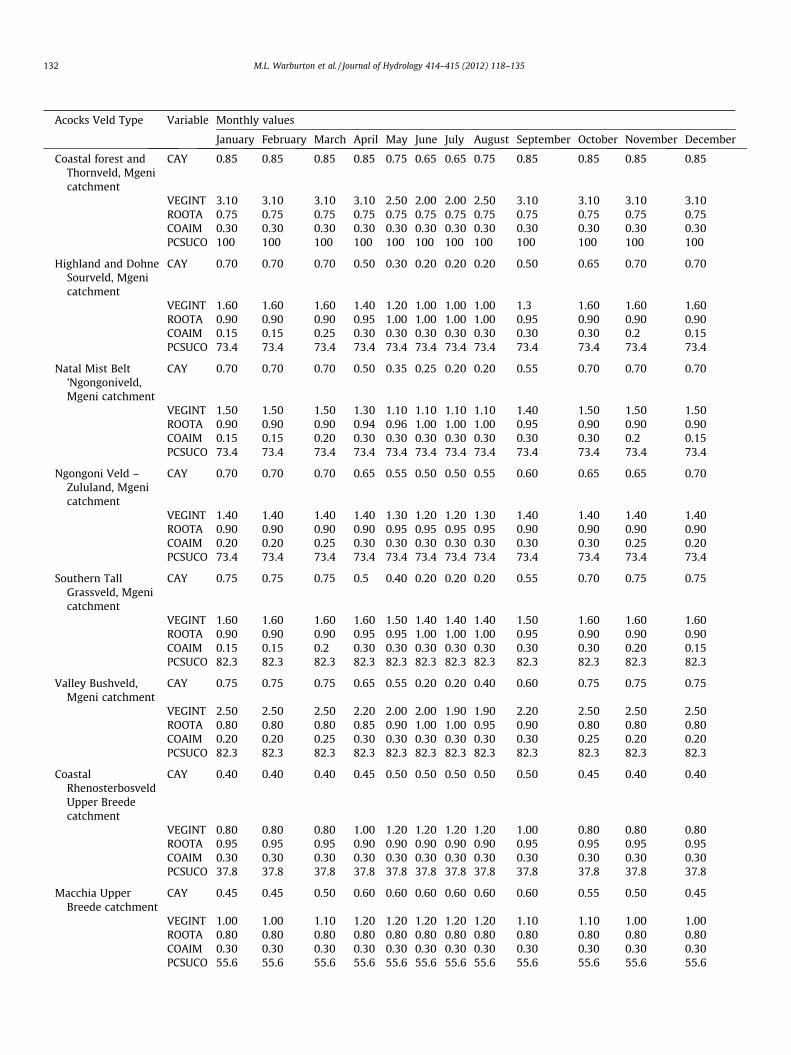
Acocks Veld Type Variable Monthly values
January February March April May June July August September October November December
Coastal forest andThornveld, Mgenicatchment
CAY 0.85 0.85 0.85 0.85 0.75 0.65 0.65 0.75 0.85 0.85 0.85 0.85
VEGINT 3.10 3.10 3.10 3.10 2.50 2.00 2.00 2.50 3.10 3.10 3.10 3.10ROOTA 0.75 0.75 0.75 0.75 0.75 0.75 0.75 0.75 0.75 0.75 0.75 0.75COAIM 0.30 0.30 0.30 0.30 0.30 0.30 0.30 0.30 0.30 0.30 0.30 0.30PCSUCO 100 100 100 100 100 100 100 100 100 100 100 100
Highland and DohneSourveld, Mgenicatchment
CAY 0.70 0.70 0.70 0.50 0.30 0.20 0.20 0.20 0.50 0.65 0.70 0.70
VEGINT 1.60 1.60 1.60 1.40 1.20 1.00 1.00 1.00 1.3 1.60 1.60 1.60ROOTA 0.90 0.90 0.90 0.95 1.00 1.00 1.00 1.00 0.95 0.90 0.90 0.90COAIM 0.15 0.15 0.25 0.30 0.30 0.30 0.30 0.30 0.30 0.30 0.2 0.15PCSUCO 73.4 73.4 73.4 73.4 73.4 73.4 73.4 73.4 73.4 73.4 73.4 73.4
Natal Mist Belt’Ngongoniveld,Mgeni catchment
CAY 0.70 0.70 0.70 0.50 0.35 0.25 0.20 0.20 0.55 0.70 0.70 0.70
VEGINT 1.50 1.50 1.50 1.30 1.10 1.10 1.10 1.10 1.40 1.50 1.50 1.50ROOTA 0.90 0.90 0.90 0.94 0.96 1.00 1.00 1.00 0.95 0.90 0.90 0.90COAIM 0.15 0.15 0.20 0.30 0.30 0.30 0.30 0.30 0.30 0.30 0.2 0.15PCSUCO 73.4 73.4 73.4 73.4 73.4 73.4 73.4 73.4 73.4 73.4 73.4 73.4
Ngongoni Veld –Zululand, Mgenicatchment
CAY 0.70 0.70 0.70 0.65 0.55 0.50 0.50 0.55 0.60 0.65 0.65 0.70
VEGINT 1.40 1.40 1.40 1.40 1.30 1.20 1.20 1.30 1.40 1.40 1.40 1.40ROOTA 0.90 0.90 0.90 0.90 0.95 0.95 0.95 0.95 0.90 0.90 0.90 0.90COAIM 0.20 0.20 0.25 0.30 0.30 0.30 0.30 0.30 0.30 0.30 0.25 0.20PCSUCO 73.4 73.4 73.4 73.4 73.4 73.4 73.4 73.4 73.4 73.4 73.4 73.4
Southern TallGrassveld, Mgenicatchment
CAY 0.75 0.75 0.75 0.5 0.40 0.20 0.20 0.20 0.55 0.70 0.75 0.75
VEGINT 1.60 1.60 1.60 1.60 1.50 1.40 1.40 1.40 1.50 1.60 1.60 1.60ROOTA 0.90 0.90 0.90 0.95 0.95 1.00 1.00 1.00 0.95 0.90 0.90 0.90COAIM 0.15 0.15 0.2 0.30 0.30 0.30 0.30 0.30 0.30 0.30 0.20 0.15PCSUCO 82.3 82.3 82.3 82.3 82.3 82.3 82.3 82.3 82.3 82.3 82.3 82.3
Valley Bushveld,Mgeni catchment
CAY 0.75 0.75 0.75 0.65 0.55 0.20 0.20 0.40 0.60 0.75 0.75 0.75
VEGINT 2.50 2.50 2.50 2.20 2.00 2.00 1.90 1.90 2.20 2.50 2.50 2.50ROOTA 0.80 0.80 0.80 0.85 0.90 1.00 1.00 0.95 0.90 0.80 0.80 0.80COAIM 0.20 0.20 0.25 0.30 0.30 0.30 0.30 0.30 0.30 0.25 0.20 0.20PCSUCO 82.3 82.3 82.3 82.3 82.3 82.3 82.3 82.3 82.3 82.3 82.3 82.3
CoastalRhenosterbosveldUpper Breedecatchment
CAY 0.40 0.40 0.40 0.45 0.50 0.50 0.50 0.50 0.50 0.45 0.40 0.40
VEGINT 0.80 0.80 0.80 1.00 1.20 1.20 1.20 1.20 1.00 0.80 0.80 0.80ROOTA 0.95 0.95 0.95 0.90 0.90 0.90 0.90 0.90 0.95 0.95 0.95 0.95COAIM 0.30 0.30 0.30 0.30 0.30 0.30 0.30 0.30 0.30 0.30 0.30 0.30PCSUCO 37.8 37.8 37.8 37.8 37.8 37.8 37.8 37.8 37.8 37.8 37.8 37.8
Macchia UpperBreede catchment
CAY 0.45 0.45 0.50 0.60 0.60 0.60 0.60 0.60 0.60 0.55 0.50 0.45
VEGINT 1.00 1.00 1.10 1.20 1.20 1.20 1.20 1.20 1.10 1.10 1.00 1.00ROOTA 0.80 0.80 0.80 0.80 0.80 0.80 0.80 0.80 0.80 0.80 0.80 0.80COAIM 0.30 0.30 0.30 0.30 0.30 0.30 0.30 0.30 0.30 0.30 0.30 0.30PCSUCO 55.6 55.6 55.6 55.6 55.6 55.6 55.6 55.6 55.6 55.6 55.6 55.6
132 M.L. Warburton et al. / Journal of Hydrology 414–415 (2012) 118–135
Appendix A ( continued)
Acocks Veld Type Variable Monthly values
January February March April May June July August September October November December
MountainRhenosterbosveldUpper Breedecatchment
CAY 0.30 0.30 0.30 0.30 0.50 0.40 0.30 0.30 0.30 0.30 0.30 0.30
VEGINT 0.30 0.30 0.30 0.30 0.30 0.30 0.30 0.30 0.30 0.30 0.30 0.30ROOTA 0.80 0.80 0.80 0.80 0.90 1.00 1.00 1.00 0.90 0.80 0.80 0.80COAIM 0.30 0.30 0.30 0.30 0.30 0.30 0.30 0.30 0.30 0.30 0.30 0.30PCSUCO 37.8 37.8 37.8 37.8 37.8 37.8 37.8 37.8 37.8 37.8 37.8 37.8
Arid LowveldLuvuvhucatchment
CAY 0.80 0.75 0.60 0.50 0.45 0.40 0.40 0.40 0.40 0.50 0.75 0.80
VEGINT 2.10 2.10 2.10 2.00 1.90 1.80 1.80 1.80 1.90 2.00 2.10 2.10ROOTA 0.80 0.80 0.80 0.85 0.90 0.90 0.90 0.90 0.85 0.80 0.80 0.80COAIM 0.15 0.15 0.25 0.30 0.30 0.30 0.30 0.30 0.30 0.30 0.20 0.15PCSUCO 91.2 91.2 91.2 91.2 91.2 91.2 91.2 91.2 91.2 91.2 91.2 91.2
Arid Sweet BushveldLuvuvhucatchment
CAY 0.75 0.60 0.50 0.45 0.35 0.30 0.20 0.20 0.40 0.55 0.65 0.75
VEGINT 1.60 1.60 1.60 1.50 1.30 1.20 1.10 1.10 1.20 1.40 1.60 1.60ROOTA 0.80 0.80 0.80 0.85 0.90 0.95 1.00 1.00 0.95 0.90 0.80 0.80COAIM 0.15 0.15 0.20 0.30 0.30 0.30 0.30 0.30 0.30 0.30 0.20 0.15PCSUCO 82.3 82.3 82.3 82.3 82.3 82.3 82.3 82.3 82.3 82.3 82.3 82.3
Mopani VeldLuvuvhucatchment
CAY 0.75 0.55 0.50 0.40 0.40 0.40 0.40 0.40 0.40 0.50 0.60 0.75
VEGINT 1.80 1.60 1.50 1.50 1.50 1.40 1.30 1.30 1.30 1.50 1.70 1.80ROOTA 0.80 0.80 0.80 0.85 0.90 0.90 0.90 0.90 0.85 0.80 0.80 0.80COAIM 0.15 0.15 0.20 0.30 0.30 0.30 0.30 0.30 0.30 0.30 0.20 0.15PCSUCO 82.3 82.3 82.3 82.3 82.3 82.3 82.3 82.3 82.3 82.3 82.3 82.3
Mixed BushveldLuvuvhucatchment
CAY 0.75 0.75 0.65 0.55 0.40 0.20 0.20 0.30 0.55 0.60 0.75 0.75
VEGINT 2.60 2.60 2.40 2.20 2.00 2.00 2.00 2.20 2.40 2.40 2.60 2.60ROOTA 0.80 0.80 0.80 0.85 0.90 1.00 1.00 1.00 0.90 0.80 0.80 0.80COAIM 0.15 0.15 0.20 0.30 0.30 0.30 0.30 0.30 0.30 0.30 0.20 0.15PCSUCO 82.3 82.3 82.3 82.3 82.3 82.3 82.3 82.3 82.3 82.3 82.3 82.3
North-EasternMountainSourveld Luvuvhucatchment
CAY 0.75 0.75 0.75 0.60 0.50 0.25 0.25 0.25 0.50 0.70 0.70 0.75
VEGINT 2.60 2.60 2.60 2.40 2.20 2.00 2.00 2.00 2.20 2.60 2.60 2.60ROOTA 0.80 0.80 0.80 0.85 0.90 1.00 1.00 1.00 0.87 0.80 0.80 0.80COAIM 0.20 0.20 0.25 0.30 0.30 0.30 0.30 0.30 0.30 0.30 0.25 0.20PCSUCO 82.3 82.3 82.3 82.3 82.3 82.3 82.3 82.3 82.3 82.3 82.3 82.3
Lowveld SourBushveld Luvuvhucatchment
CAY 0.75 0.75 0.75 0.70 0.65 0.60 0.55 0.55 0.60 0.75 0.75 0.75
VEGINT 2.50 2.50 2.50 2.40 2.20 2.00 2.00 2.20 2.40 2.50 2.50 2.50ROOTA 0.80 0.80 0.80 0.85 0.85 0.90 0.90 0.90 0.85 0.80 0.80 0.80COAIM 0.15 0.15 0.20 0.30 0.30 0.30 0.30 0.30 0.30 0.30 0.20 0.15PCSUCO 82.3 82.3 82.3 82.3 82.3 82.3 82.3 82.3 82.3 82.3 82.3 82.3
Sourish MixedBushveld Luvuvhucatchment
CAY 0.75 0.75 0.75 0.60 0.45 0.20 0.20 0.20 0.55 0.70 0.75 0.75
VEGINT 2.70 2.70 2.60 2.20 2.00 2.00 2.00 2.00 2.20 2.50 2.70 2.70ROOTA 0.80 0.80 0.80 0.85 0.90 1.00 1.00 0.90 0.85 0.80 0.80 0.80
(continued on next page)
M.L. Warburton et al. / Journal of Hydrology 414–415 (2012) 118–135 133
Appendix A ( continued)
Acocks Veld Type Variable Monthly values
January February March April May June July August September October November December
COAIM 0.15 0.15 0.20 0.30 0.30 0.30 0.30 0.30 0.30 0.30 0.20 0.15PCSUCO 82.3 82.3 82.3 82.3 82.3 82.3 82.3 82.3 82.3 82.3 82.3 82.3
Sour BushveldLuvuvhucatchment
CAY 0.75 0.75 0.75 0.60 0.45 0.20 0.20 0.20 0.55 0.70 0.75 0.75
VEGINT 2.70 2.70 2.60 2.20 2.00 2.00 2.00 2.00 2.20 2.50 2.70 2.70ROOTA 0.80 0.80 0.80 0.85 0.90 1.00 1.00 0.90 0.85 0.80 0.80 0.80COAIM 0.15 0.15 0.20 0.30 0.30 0.30 0.30 0.30 0.30 0.25 0.20 0.15PCSUCO 82.3 82.3 82.3 82.3 82.3 82.3 82.3 82.3 82.3 82.3 82.3 82.3
134 M.L. Warburton et al. / Journal of Hydrology 414–415 (2012) 118–135
References
Acocks, J.P.H., 1953. Veld Types of South Africa, second ed. Memoirs of the BotanicalSociety, vol. 28. Botanical Research Institute, Pretoria, South Africa.
Acocks, J.P.H., 1975. Veld Types of South Africa, second ed. Memoirs of the BotanicalSociety, vol. 40. Botanical Research Institute, Pretoria, South Africa.
Acocks, J.P.H., 1988. Veld Types of Southern Africa. Botanical Survey of South AfricaMemoirs, vol. 57. Botanical Research Institute, Pretoria, South Africa.
Bewket, W., Sterk, G., 2005. Dynamics in land cover and its effect on streamflow inthe Chemaga watershed, Blue Nile basin, Ethiopia. Hydrol. Process. 19, 445–458.
Blignaut, J., Mander, M., Schulze, R., Horan, M., Dickens, C., Pringle, C., Mavundla, K.,Mahlangu, I., Wilson, A., McKenzie, M., McKean, S., 2010. Restoring andmanaging natural capital towards fostering economic development: evidencefrom the Drakensberg, South Africa. Ecol. Econ. 69, 1313–1323.
Bronstert, A., Niehoff, D., Bürger, G., 2002. Effects of climate and land-use change onstorm runoff generation: present knowledge and modelling capabilities. Hydrol.Process. 16, 509–529.
Calder, I.R., 2005. Blue Revolution II: Land Use and Integrated Water ResourcesManagement. Earthscan, London.
Choi, W., Deal, B.M., 2008. Assessing hydrological impact of potential land usechange through hydrological and land use change modelling for theKishwaukee River Basin (USA). J. Environ. Manage. 88, 1119–11130.
Claussen, M., Cox, P.M., Zeng, X., Viterbo, P., Beljaars, A.C.M., Betts, R.A., Bolle, H.-J.,Chase, T., Koster, R., 2004. The global climate. In: Kabat, P., Claussen, M.,Dirmeyer, P.A., Gosh, J.H.C., De Guenni, L.B., Meybeck, M., Pielke, R.A., Sr.,Vörösmarty, C.J., Hutjes, R.W.A., Lütkemeier, S. (Eds.), Vegetation, Water,Humans and the Climate: A New Perspective on an Interactive System.Springer, Germany, pp. 33–57.
Costa, M.H., Botta, A., Cardille, J.A., 2003. Effects of large-scale changes in land coveron the discharge of the Tocantins River, Southeastern Amazonia. J. Hydrol. 283,206–217.
De Fries, R., Eshleman, K.N., 2004. Land-use change and hydrologic processes: amajor focus for the future. Hydrol. Process. 18, 2183–2186.
Ewen, J., Parkin, G., 1996. Validation of catchment models for predicting land-useand climate change impacts. 1. Method. J. Hydrol. 175, 583–594.
Falkenmark, M., 2003. Freshwater as shared between society and ecosystems: fromdivided approaches to integrated challenges. Philos. Trans. Roy. Soc. Lond. B.358, 2037–2049.
Falkenmark, M., Andersson, L., Castensson, R., Sundblad, K., Batchelor, C., Gardiner,J., Lyle, C., Peters, N., Pettersen, B., Quinn, P., Rckström, J., Yapijakis, C., 1999.Water: A Reflection of Land Use. Swedish Natural Science Research Council,Stockholm, Sweden.
Hargreaves, G.H., Samani, Z.A., 1985. Reference crop evapotranspiration fromtemperature. Trans. Am. Soc. Agric. Eng. 1, 96–99.
Jewitt, G.P.W., Schulze, R.E., 1999. Verification of the ACRU model for foresthydrology applications. Water SA 25 (4), 483–489.
Jewitt, G.P.W., Garratt, J.A., Calder, I.R., Fuller, L., 2004. Water resources planningand modelling tools for the assessment of land use change in the LuvuvhuCatchment, South Africa. Phys. Chem. Earth 29, 1233–1241.
Jewitt, G.P.W., Lorentz, S.A., Gush, M.B., Thornton-Dibb, S., Kongo, V., Wiles, L.,Blight, J., Stuart-Hill, S.I., Versfeld, D., Tomlinson, K., 2009. Methods andGuidelines for the Licensing of SFRAs with Particular Reference to Low Flows.Water Research Commission, Pretoria, South Africa, Report 1428/1/09.
Kienzle, S.W., Lorentz, S.A., Schulze, R.E., 1997. Hydrology and Water Quality of theMgeni Catchment. Water Research Commission, Pretoria, South Africa, ReportTT87/97.
Lambin, E.F., Rounsevell, M.D.A., Geist, H.J., 2000. Are agricultural land-use modelsable to predict changes in land use intensity? Agric. Ecosyst. Environ. 82, 321–331.
Legesse, D., Vallet-Coulomb, C., Gasse, F., 2003. Hydrological response of acatchment to climate and land use changes in Tropical Africa: case studySouth Central Ethiopia. J. Hydrol. 275, 67–85.
Lumsden, T.G., Jewitt, G.P.W., Schulze, R.E., 2003. Modelling the Impacts of LandCover and Land Management Practices on Runoff Responses. Water ResearchCommission, Pretoria, South Africa, Report 1015/1/03.
Lynch, S.D., 2004. The Development of a Raster Database of Annual, Monthly andDaily Rainfall for Southern Africa. Water Research Commission, Pretoria, SouthAfrica, Report 1156/1/04.
Mucina, L., Rutherford, M.C. (Eds.), 2006. The Vegetation of South Africa, Lesothoand Swaziland. Strelitzia, vol. 19. South African National Biodiversity Institute,Pretoria, South Africa.
Niehoff, D., Fritsch, U., Bronstert, A., 2002. Land-use impacts on storm-runoffgeneration: scenarios of land-use change and simulation of hydrologicalresponse in a meso-scale catchment in SW-Germany. J. Hydrol. 267, 80–93.
National Land Cover (NLC), 2001. Produced by CSIR and ARC Consortium. Pretoria,South Africa.
NWA, 1998. National Water Act, Act No. 36 of 1998. Government Printer, Pretoria,South Africa.
Samaniego, L., Bárdossy, A., 2006. Simulation of the impacts of land use/cover andclimatic changes on the runoff characteristics at the mesoscale. Ecol. Model.196, 45–61.
Schmidt, E.J., Smithers, J.C., Schulze, R.E., Mathews, P., 1998. Impacts of SugarcaneProduction and Changing Land Use on Catchment Hydrology. Water ResearchCommission, Pretoria, South Africa, Report 419/1/98.
Schulze, R.E. (Ed.), 1995. Hydrology and Agrohydrology: A Text to Accompany theACRU 3.00 Agrohydrological Modelling System. Water Research Commission,Pretoria, South Africa.
Schulze, R.E., 2000. Modelling hydrological responses to land use and climatechange: a southern African Perspective. Ambio 29, 12–22.
Schulze, R.E. (Ed.), 2003. Modelling as a Tool in Integrated Water ResourcesManagement: Conceptual Issues and Case Study Applications. Water ResearchCommission, Pretoria, South Africa, Report 749/1/04, pp. 84–97 (Chapter 4).
Schulze, R.E., 2004. Determination of baseline land cover variables for applicationsin addressing land use impacts on hydrological responses in South Africa. In:Schulze, R.E., Pike, A. (Eds.), Development and Evaluation of an InstalledHydrological Modelling System. Water Research Commission, Pretoria, SouthAfrica, Report 1155/1/04, pp. 37–50 (Chapter 3).
Schulze, R.E. (Ed.), 2008. South African Atlas of Climatology and Agrohydrology.Water Research Commission, Pretoria, South Africa, Report 1489/1/06, Section3.4.
Schulze, R.E., George, W.J., 1987. A dynamic process-based user-orientated model offorest effects on water yield. Hydrol. Process. 1, 293–307.
Schulze, R.E., Maharaj, M., 2004. Development of a Database of Gridded DailyTemperatures for Southern Africa. Water Research Commission, Pretoria, SouthAfrica, Report 1156/2/04.
Schulze, R.E., Lorentz, S., Kienzle, S., Perks, L., 2004. Case Study 3: modelling theimpacts of land use and climate change on hydrological responses in the mixedunderdeveloped/developed Mgeni catchment, South Africa. In: Kabat, P.,Claussen, M., Dirmeyer, P.A., Gosh, J.H.C., De Guenni, L.B., Meybeck, M., Pielke,R.A., Sr., Vörösmarty, C.J., Hutjes, R.W.A., Lütkemeier, S. (Eds.), Vegetation,Water, Humans and the Climate: A New Perspective on an Interactive System.Springer, Germany, pp. 441–453.

M.L. Warburton et al. / Journal of Hydrology 414–415 (2012) 118–135 135
Smithers, J.C., Schulze, R.E., 2004. ACRU Agrohydrological Modelling System: UserManual Version 4.00. School of Bioresources Engineering and EnvironmentalHydrology. University of KwaZulu-Natal, South Africa.
Still, D.A., Dickens, C., Breen, C.M., Mander, M., Booth, A., 2010. Balancing resourceprotection and development in a highly regulated river: the role of conjunctiveuse. Water SA 36, 371–378.
Summerton, M.J., 2008. A Preliminary Assessment of the Impact of Climate Changeon the Water Resources of the Mgeni Catchment. Umgeni Water, PlanningServices, Report Number 160.8/R001/2008.
Tarboton, K.C., Schulze, R.E., 1990. Impacts of increased afforestation and farmdams on water resources of the upper Mgeni catchments. Agric. Eng. S. Afr. 22,20215.
Tarboton, K.C., Schulze, R.E., 1992. Distributed Hydrological Modelling System forthe Mgeni Catchment. Water Research Commission, Pretoria, South Africa,Report 234/1/92.
Turner, B.L., Moss, R.H., Skole, D.L., 1993. Relating Land Use and Global Land-coverChange: A Proposal for an IGBP-HDP Core Project. IGBP, Stockholm, Sweden.IGBP Report, 24.
Turner, B.L., Skole, B., Sanderson, S., Fischer, G., Fresco, L., Leemans, R., 1995. Land-Use and Land-Cover Change: Science Research Plan. IGBP Report, 35, IGBP,Stockholm, Sweden.
Warburton, M.L., Schulze, R.E., Jewitt, G.P.W., 2010. Confirmation of ACRU modelresults for applications in land use and climate change studies. Hydrol. EarthSyst. Sci. 14, 2399–2414.