hydrogen sulfide emissions from open/dry-lot cattle...
TRANSCRIPT
IntroductionHydrogen sulfide (H2S) is a naturally occur-
ring, colorless gas with a foul smell like rotten eggs. Toxic to humans at certain concentra-tions, it is regulated by federal and state gov-ernments. Hydrogen sulfide has been detected downwind of beef cattle feedlots, but usually at very low concentrations.
Hydrogen sulfide sources on beef feedyards
Hydrogen sulfide is often produced when bacteria decompose organic matter containing sulfur, such as manure, in anaerobic (without oxygen) conditions. In general, H2S emissions from feedyards come from surfaces such as pens or manure piles where manure accumulates and from the surface of treatment lagoons or runoff holding ponds.1 Extended anaerobic conditions on surfaces normally associated with standing
Hydrogen Sulfide Emissions from Open/Dry-Lot Cattle-Feeding OperationsSharon L. M. Preece
*, Kenneth D. Casey *, and Brent W. Auvermann
*,**
*Texas A&M AgriLife Research, **Texas A&M AgriLife Exten-sion Service
1A “lagoon” is a pond designed to treat organic wastes. A “run-off holding pond” is a pond designed to store runoff water for a short term.
E-62010/12
water or wet manure can generate H2S gas over large areas.
Sulfur is found in livestock feed and drink-ing water and is an essential nutrient for cattle. It has been estimated that every 1,000 head of beef cattle in the Texas Panhandle consume about 25 to 42 kilograms of sulfur daily. Cattle retain only 10 to 20 percent of the sulfur they ingest, and excrete the remaining 80 to 90 percent.
Hydrogen sulfide and human health Hydrogen sulfide is toxic to humans and
causes negative health effects even at low con-centrations (Table 1). Some are reversible, but others are often permanent, such as damage to the lungs, eyes, or brain. At elevated concentra-tions, H2S is highly toxic and can cause instant death.
Humans can be exposed to H2S by breath-ing contaminated air or drinking contaminated water. Natural sources of H2S contamination include groundwater, natural gas, and volcanic gases. Anthropogenic sources (those caused by human activity) include sour crude oil refineries, pulp and paper mills, oil and gas operations, sewage treatment plants, and animal agriculture.
2
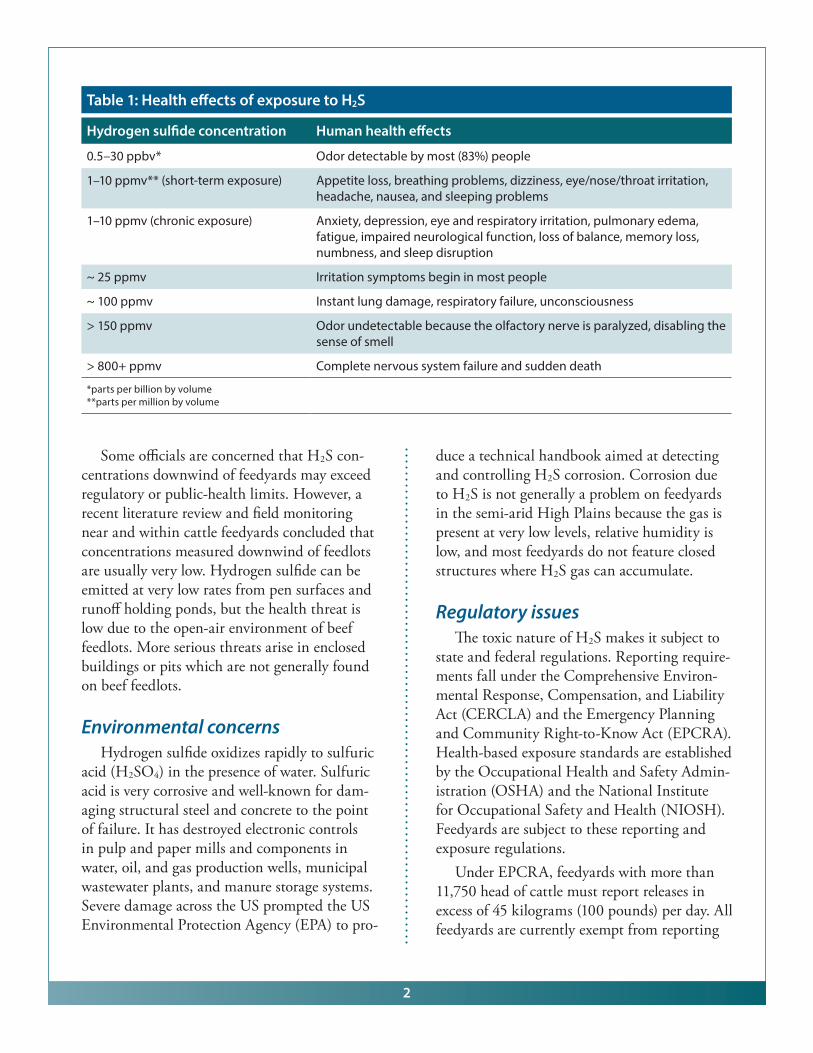
Table 1: Health effects of exposure to H2S
Hydrogen sulfide concentration Human health effects
0.5–30 ppbv* Odor detectable by most (83%) people
1–10 ppmv** (short-term exposure) Appetite loss, breathing problems, dizziness, eye/nose/throat irritation, headache, nausea, and sleeping problems
1–10 ppmv (chronic exposure) Anxiety, depression, eye and respiratory irritation, pulmonary edema, fatigue, impaired neurological function, loss of balance, memory loss, numbness, and sleep disruption
~ 25 ppmv Irritation symptoms begin in most people
~ 100 ppmv Instant lung damage, respiratory failure, unconsciousness
> 150 ppmv Odor undetectable because the olfactory nerve is paralyzed, disabling the sense of smell
> 800+ ppmv Complete nervous system failure and sudden death
*parts per billion by volume**parts per million by volume
Some officials are concerned that H2S con-centrations downwind of feedyards may exceed regulatory or public-health limits. However, a recent literature review and field monitoring near and within cattle feedyards concluded that concentrations measured downwind of feedlots are usually very low. Hydrogen sulfide can be emitted at very low rates from pen surfaces and runoff holding ponds, but the health threat is low due to the open-air environment of beef feedlots. More serious threats arise in enclosed buildings or pits which are not generally found on beef feedlots.
Environmental concernsHydrogen sulfide oxidizes rapidly to sulfuric
acid (H2SO4) in the presence of water. Sulfuric acid is very corrosive and well-known for dam-aging structural steel and concrete to the point of failure. It has destroyed electronic controls in pulp and paper mills and components in water, oil, and gas production wells, municipal wastewater plants, and manure storage systems. Severe damage across the US prompted the US Environmental Protection Agency (EPA) to pro-
duce a technical handbook aimed at detecting and controlling H2S corrosion. Corrosion due to H2S is not generally a problem on feedyards in the semi-arid High Plains because the gas is present at very low levels, relative humidity is low, and most feedyards do not feature closed structures where H2S gas can accumulate.
Regulatory issuesThe toxic nature of H2S makes it subject to
state and federal regulations. Reporting require-ments fall under the Comprehensive Environ-mental Response, Compensation, and Liability Act (CERCLA) and the Emergency Planning and Community Right-to-Know Act (EPCRA). Health-based exposure standards are established by the Occupational Health and Safety Admin-istration (OSHA) and the National Institute for Occupational Safety and Health (NIOSH). Feedyards are subject to these reporting and exposure regulations.
Under EPCRA, feedyards with more than 11,750 head of cattle must report releases in excess of 45 kilograms (100 pounds) per day. All feedyards are currently exempt from reporting
3
H2S releases under CERCLA. Producer orga-nizations, such as Beef USA and the National Cattlemen’s Beef Association, have provided research-based guidelines to feedyards for esti-mating and reporting H2S releases.
A ceiling limit is a maximum permissible concentration limit that must never be exceeded. The OSHA-acceptable 10-minute ceiling limit for H2S is 20 ppmv, and NIOSH recommends a 10-minute ceiling limit of 10 ppmv. Feedyards must keep records and file annual reports with OSHA regarding H2S, but are exempt from the record-keeping requirements if they employ 10 or fewer non-family workers.
The Texas Administrative Code (TAC) sets two thresholds—urban and rural—for locations downwind of a H2S source:
• Theurbanthresholdisanet,ground-level concentration2 of 0.08 ppmv (parts per million by volume) averaged over any 30-minute period at any residential, business, or commercial property.
• Theruralthresholdisanet,ground-levelconcentration of 0.12 ppmv averaged over
any 30-minute period and applies to any property that is not residential, business, or commercial.
The Texas Commission on Environmental Quality (TCEQ) enforces the thresholds spec-ified in the TAC and has established regulatory values for a 30-minute average ambient con-centration of 0.08 ppmv downwind of sources, including feedyards.
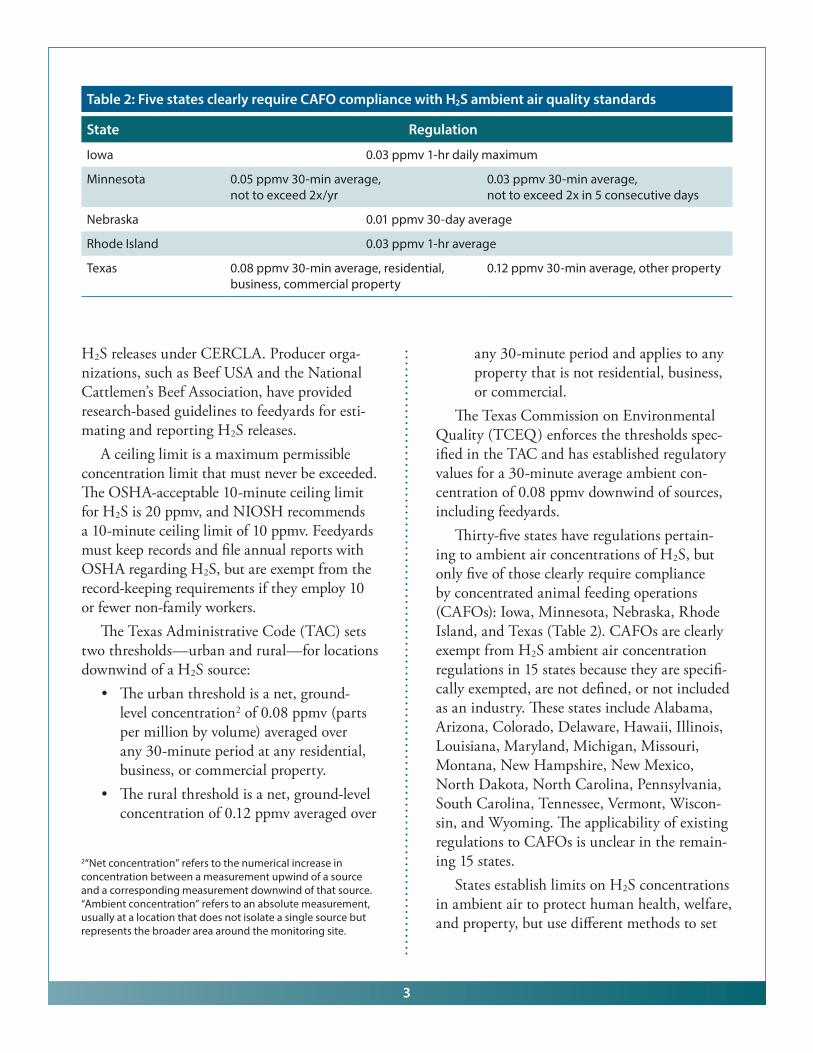
Thirty-five states have regulations pertain-ing to ambient air concentrations of H2S, but only five of those clearly require compliance by concentrated animal feeding operations (CAFOs): Iowa, Minnesota, Nebraska, Rhode Island, and Texas (Table 2). CAFOs are clearly exempt from H2S ambient air concentration regulations in 15 states because they are specifi-cally exempted, are not defined, or not included as an industry. These states include Alabama, Arizona, Colorado, Delaware, Hawaii, Illinois, Louisiana, Maryland, Michigan, Missouri, Montana, New Hampshire, New Mexico, North Dakota, North Carolina, Pennsylvania, South Carolina, Tennessee, Vermont, Wiscon-sin, and Wyoming. The applicability of existing regulations to CAFOs is unclear in the remain-ing 15 states.
States establish limits on H2S concentrations in ambient air to protect human health, welfare, and property, but use different methods to set
Table 2: Five states clearly require CAFO compliance with H2S ambient air quality standards
State Regulation
Iowa 0.03 ppmv 1-hr daily maximum
Minnesota 0.05 ppmv 30-min average, not to exceed 2x/yr
0.03 ppmv 30-min average,not to exceed 2x in 5 consecutive days
Nebraska 0.01 ppmv 30-day average
Rhode Island 0.03 ppmv 1-hr average
Texas 0.08 ppmv 30-min average, residential, business, commercial property
0.12 ppmv 30-min average, other property
2“Net concentration” refers to the numerical increase in concentration between a measurement upwind of a source and a corresponding measurement downwind of that source. “Ambient concentration” refers to an absolute measurement, usually at a location that does not isolate a single source but represents the broader area around the monitoring site.
4
those limits. Some states derive their regulatory values from EPA estimates of human health effects.3 Other states, such as Iowa, use data from local monitoring studies and health data to establish regulatory levels. North Dakota established its levels from a literature review on H2S. Others, such as California and New York, base their levels on odor thresholds. Property damage from the corrosive effect of H2S on buildings and structures is the rationale for levels set by Nebraska and Pennsylvania.
Due to its strong, distinctive smell, states sometimes regulate H2S as a nuisance odor. Hawaii, Minnesota, New York, and Texas base their regulations, in part, on nuisance odor abatement. Similarly, Minnesota currently regulates feedlot nuisance odor by limiting H2S emissions.
Monitoring methodsCompliance with environmental regulations
requires continuous monitoring of H2S accord-ing to established protocols with approved instrumentation. Instruments must be regularly inspected and calibrated by knowledgeable per-sonnel to ensure accurate measurements.
There are many scientific instruments capa-ble of measuring H2S, including Dräger tubes, Jerome hydrogen sulfide analyzers, and pulsed fluorescence analyzers.
Dräger tubeA Dräger tube detects H2S gas by drawing
an air sample through a glass vial filled with a
reagent. The reagent changes color to indicate the presence of H2S gas, and the length of the color change along the tube indicates the con-centration.
Different models of Dräger tubes use various reagents to detect H2S gas at specific ranges. For example, model 0.2/b uses mercuric chloride (HgCl2) to detect concentrations between 0.1 and 6 ppmv, while model 2/a uses a mercuric ion (Hg2+) to detect concentrations between 2 and 200 ppmv. Other gases may interfere with H2S readings, depending on the model of the instrument and the reagent used.
Jerome meterThe Jerome Meter 631-X is a common,
portable instrument that can detect H2S from 2 ppbv to 50 ppmv. In a Jerome meter, sulfur compounds adsorb to a gold film sensor causing changes in its resistivity. Trace amounts of other sulfur compounds can also affect the sensor resistivity, so the H2S concentrations reported by a Jerome meter may be biased slightly upward. The degree of the bias depends on the concentration of other sulfurous compounds in the air.
Pulsed fluorescence analyzerAn electronic pulsed fluorescence analyzer
can detect H2S between 3 ppbv and 100 ppmv. Designed for use in a laboratory or other protected environment such as a mobile instru-ment shelter, it can also be used in the field if equipped with a protective housing and power supply. This instrument catalytically converts H2S to sulfur dioxide (SO2) and then measures the SO2 concentration with a pulsed fluores-cence analyzer. Other gases present at feedyards, such as ammonia (NH3), may interfere with the H2S measurements.
Other equipmentMicroprocessor-based electrochemical
sensors can be used for personal protection in areas where H2S gas may exist. These smaller,
3The EPA’s No Observable Adverse Effect Level (NOAEL) for H2S is 10 ppmv, and Lowest Observable Adverse Effect Level (LOAEL) is 30 ppmv, and the Reference Concentration for Chronic Inhalation (RfC) is 0.0001 ppmv. The NOAEL and LOAEL values are inhalation reference concentrations and are extrapolated using uncertainty factors from effect levels observed in rats to predicted effect levels for humans. The RfC is an estimate of a continuous inhalation exposure concen-tration to humans, including sensitive subgroups, that is not likely to risk harmful health effects during a lifetime.
5
portable instruments can be mounted near equipment, clipped to a belt, or carried in hand. They are used primarily as an early warning device to alert users when they should vacate an area. However, they are not designed for pre-cise concentration measurements or regulatory compliance monitoring. When gas concentra-tions exceed a predetermined threshold, the instrument emits a visual and/or audible alarm. Examples of this type of instrument include the MSA Altair Pro and the Drager Pac III.
What we knowData concerning H2S concentrations near
feedyards are scarce, especially prior to 2003. Among the four studies described below, none reported ambient 30-minute average H2S concentrations in excess of the State of Texas regulatory value (0.08 ppmv).
• Jeromemeterswereusedtomonitorthree feedyards in Nebraska for 1 week in the spring, summer, and fall of 2000. The weekly average H2S point concen-trations downwind of the pens ranged
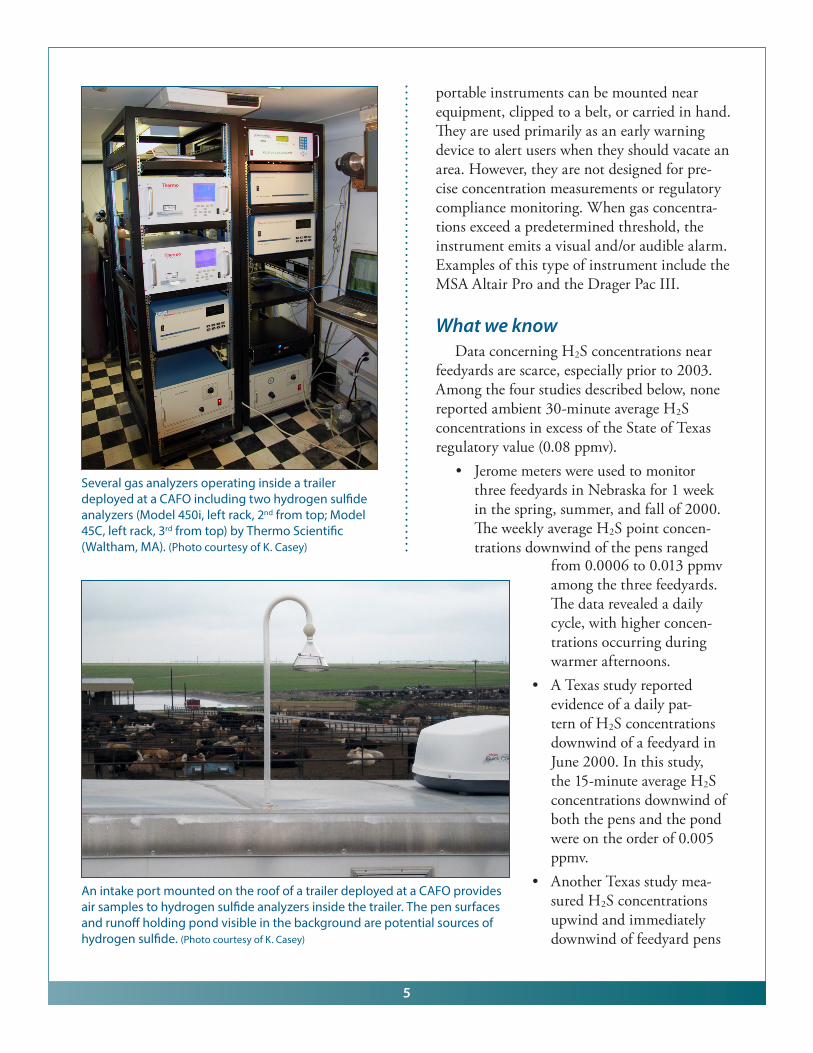
Several gas analyzers operating inside a trailer deployed at a CAFO including two hydrogen sulfide analyzers (Model 450i, left rack, 2nd from top; Model 45C, left rack, 3rd from top) by Thermo Scientific (Waltham, MA). (Photo courtesy of K. Casey)
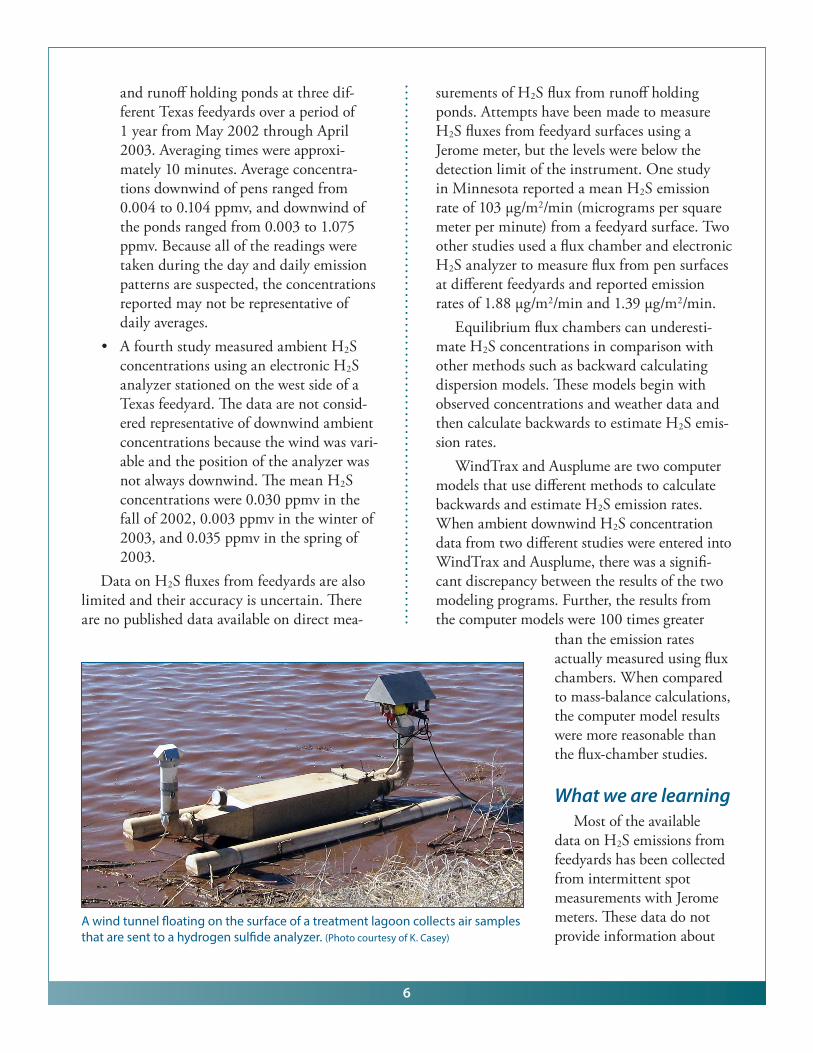
An intake port mounted on the roof of a trailer deployed at a CAFO provides air samples to hydrogen sulfide analyzers inside the trailer. The pen surfaces and runoff holding pond visible in the background are potential sources of hydrogen sulfide. (Photo courtesy of K. Casey)
from 0.0006 to 0.013 ppmv among the three feedyards. The data revealed a daily cycle, with higher concen-trations occurring during warmer afternoons.
• ATexasstudyreportedevidence of a daily pat-tern of H2S concentrations downwind of a feedyard in June 2000. In this study, the 15-minute average H2S concentrations downwind of both the pens and the pond were on the order of 0.005 ppmv.
• AnotherTexasstudymea-sured H2S concentrations upwind and immediately downwind of feedyard pens
6
and runoff holding ponds at three dif-ferent Texas feedyards over a period of 1 year from May 2002 through April 2003. Averaging times were approxi-mately 10 minutes. Average concentra-tions downwind of pens ranged from 0.004 to 0.104 ppmv, and downwind of the ponds ranged from 0.003 to 1.075 ppmv. Because all of the readings were taken during the day and daily emission patterns are suspected, the concentrations reported may not be representative of daily averages.
• AfourthstudymeasuredambientH2S concentrations using an electronic H2S analyzer stationed on the west side of a Texas feedyard. The data are not consid-ered representative of downwind ambient concentrations because the wind was vari-able and the position of the analyzer was not always downwind. The mean H2S concentrations were 0.030 ppmv in the fall of 2002, 0.003 ppmv in the winter of 2003, and 0.035 ppmv in the spring of 2003.
Data on H2S fluxes from feedyards are also limited and their accuracy is uncertain. There are no published data available on direct mea-
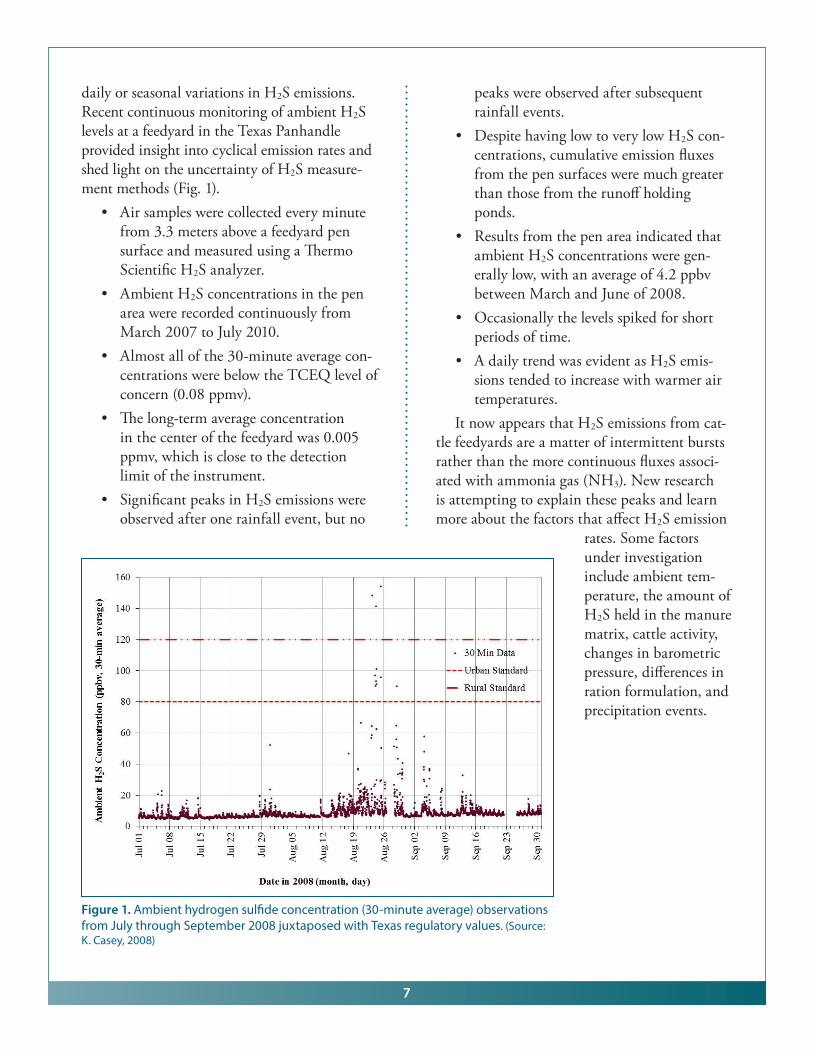
A wind tunnel floating on the surface of a treatment lagoon collects air samples that are sent to a hydrogen sulfide analyzer. (Photo courtesy of K. Casey)
surements of H2S flux from runoff holding ponds. Attempts have been made to measure H2S fluxes from feedyard surfaces using a Jerome meter, but the levels were below the detection limit of the instrument. One study in Minnesota reported a mean H2S emission rate of 103 μg/m2/min (micrograms per square meter per minute) from a feedyard surface. Two other studies used a flux chamber and electronic H2S analyzer to measure flux from pen surfaces at different feedyards and reported emission rates of 1.88 μg/m2/min and 1.39 μg/m2/min.
Equilibrium flux chambers can underesti-mate H2S concentrations in comparison with other methods such as backward calculating dispersion models. These models begin with observed concentrations and weather data and then calculate backwards to estimate H2S emis-sion rates.
WindTrax and Ausplume are two computer models that use different methods to calculate backwards and estimate H2S emission rates. When ambient downwind H2S concentration data from two different studies were entered into WindTrax and Ausplume, there was a signifi-cant discrepancy between the results of the two modeling programs. Further, the results from the computer models were 100 times greater
than the emission rates actually measured using flux chambers. When compared to mass-balance calculations, the computer model results were more reasonable than the flux-chamber studies.
What we are learningMost of the available
data on H2S emissions from feedyards has been collected from intermittent spot measurements with Jerome meters. These data do not provide information about
7
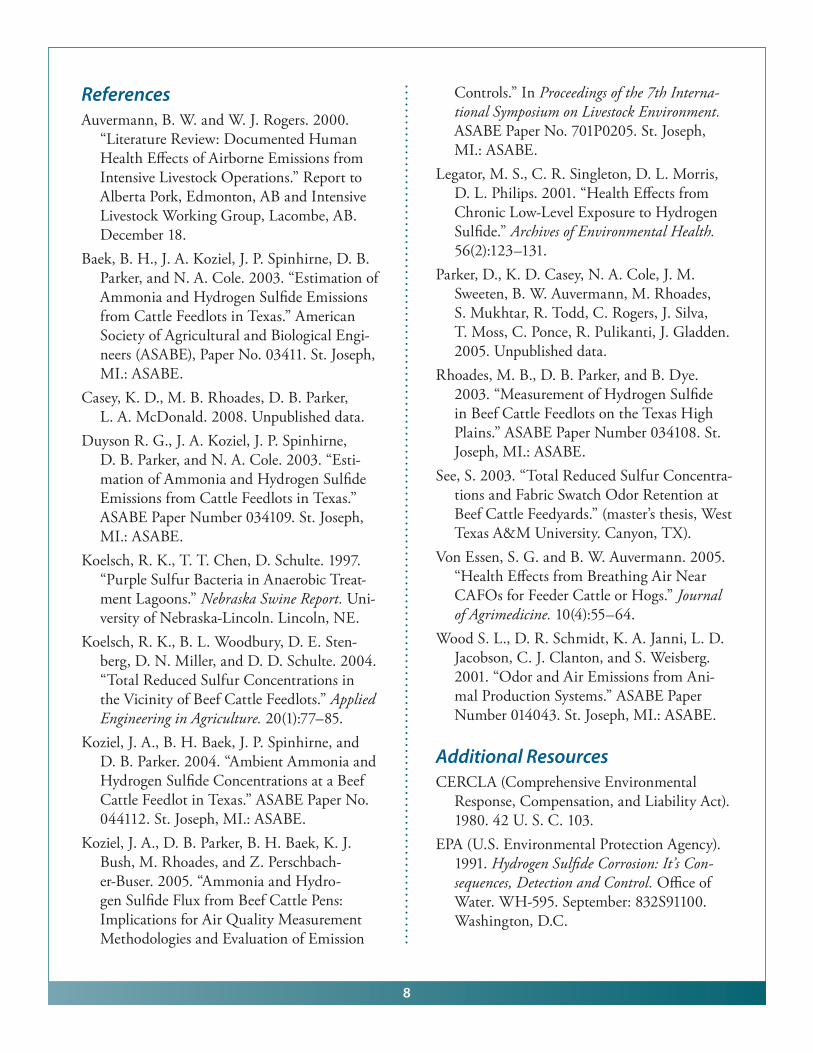
daily or seasonal variations in H2S emissions. Recent continuous monitoring of ambient H2S levels at a feedyard in the Texas Panhandle provided insight into cyclical emission rates and shed light on the uncertainty of H2S measure-ment methods (Fig. 1).
• Airsampleswerecollectedeveryminutefrom 3.3 meters above a feedyard pen surface and measured using a Thermo Scientific H2S analyzer.
• AmbientH2S concentrations in the pen area were recorded continuously from March 2007 to July 2010.
• Almostallofthe30-minuteaveragecon-centrations were below the TCEQ level of concern (0.08 ppmv).
• Thelong-termaverageconcentrationin the center of the feedyard was 0.005 ppmv, which is close to the detection limit of the instrument.
• SignificantpeaksinH2S emissions were observed after one rainfall event, but no
peaks were observed after subsequent rainfall events.
• DespitehavinglowtoverylowH2S con-centrations, cumulative emission fluxes from the pen surfaces were much greater than those from the runoff holding ponds.
• Resultsfromthepenareaindicatedthatambient H2S concentrations were gen-erally low, with an average of 4.2 ppbv between March and June of 2008.
• Occasionallythelevelsspikedforshortperiods of time.
• AdailytrendwasevidentasH2S emis-sions tended to increase with warmer air temperatures.
It now appears that H2S emissions from cat-tle feedyards are a matter of intermittent bursts rather than the more continuous fluxes associ-ated with ammonia gas (NH3). New research is attempting to explain these peaks and learn more about the factors that affect H2S emission
Figure 1. Ambient hydrogen sulfide concentration (30-minute average) observations from July through September 2008 juxtaposed with Texas regulatory values. (Source: K. Casey, 2008)
rates. Some factors under investigation include ambient tem-perature, the amount of H2S held in the manure matrix, cattle activity, changes in barometric pressure, differences in ration formulation, and precipitation events.
8
ReferencesAuvermann, B. W. and W. J. Rogers. 2000.
“Literature Review: Documented Human Health Effects of Airborne Emissions from Intensive Livestock Operations.” Report to Alberta Pork, Edmonton, AB and Intensive Livestock Working Group, Lacombe, AB. December 18.
Baek, B. H., J. A. Koziel, J. P. Spinhirne, D. B. Parker, and N. A. Cole. 2003. “Estimation of Ammonia and Hydrogen Sulfide Emissions from Cattle Feedlots in Texas.” American Society of Agricultural and Biological Engi-neers (ASABE), Paper No. 03411. St. Joseph, MI.: ASABE.
Casey, K. D., M. B. Rhoades, D. B. Parker, L. A. McDonald. 2008. Unpublished data.
Duyson R. G., J. A. Koziel, J. P. Spinhirne, D. B. Parker, and N. A. Cole. 2003. “Esti-mation of Ammonia and Hydrogen Sulfide Emissions from Cattle Feedlots in Texas.” ASABE Paper Number 034109. St. Joseph, MI.: ASABE.
Koelsch, R. K., T. T. Chen, D. Schulte. 1997. “Purple Sulfur Bacteria in Anaerobic Treat-ment Lagoons.” Nebraska Swine Report. Uni-versity of Nebraska-Lincoln. Lincoln, NE.
Koelsch, R. K., B. L. Woodbury, D. E. Sten-berg, D. N. Miller, and D. D. Schulte. 2004. “Total Reduced Sulfur Concentrations in the Vicinity of Beef Cattle Feedlots.” Applied Engineering in Agriculture. 20(1):77–85.
Koziel, J. A., B. H. Baek, J. P. Spinhirne, and D. B. Parker. 2004. “Ambient Ammonia and Hydrogen Sulfide Concentrations at a Beef Cattle Feedlot in Texas.” ASABE Paper No. 044112. St. Joseph, MI.: ASABE.
Koziel, J. A., D. B. Parker, B. H. Baek, K. J. Bush, M. Rhoades, and Z. Perschbach-er-Buser. 2005. “Ammonia and Hydro-gen Sulfide Flux from Beef Cattle Pens: Implications for Air Quality Measurement Methodologies and Evaluation of Emission
Controls.” In Proceedings of the 7th Interna-tional Symposium on Livestock Environment. ASABE Paper No. 701P0205. St. Joseph, MI.: ASABE.
Legator, M. S., C. R. Singleton, D. L. Morris, D. L. Philips. 2001. “Health Effects from Chronic Low-Level Exposure to Hydrogen Sulfide.” Archives of Environmental Health. 56(2):123–131.
Parker, D., K. D. Casey, N. A. Cole, J. M. Sweeten, B. W. Auvermann, M. Rhoades, S. Mukhtar, R. Todd, C. Rogers, J. Silva, T. Moss, C. Ponce, R. Pulikanti, J. Gladden. 2005. Unpublished data.
Rhoades, M. B., D. B. Parker, and B. Dye. 2003. “Measurement of Hydrogen Sulfide in Beef Cattle Feedlots on the Texas High Plains.” ASABE Paper Number 034108. St. Joseph, MI.: ASABE.
See, S. 2003. “Total Reduced Sulfur Concentra-tions and Fabric Swatch Odor Retention at Beef Cattle Feedyards.” (master’s thesis, West Texas A&M University. Canyon, TX).
Von Essen, S. G. and B. W. Auvermann. 2005. “Health Effects from Breathing Air Near CAFOs for Feeder Cattle or Hogs.” Journal of Agrimedicine. 10(4):55–64.
Wood S. L., D. R. Schmidt, K. A. Janni, L. D. Jacobson, C. J. Clanton, and S. Weisberg. 2001. “Odor and Air Emissions from Ani-mal Production Systems.” ASABE Paper Number 014043. St. Joseph, MI.: ASABE.
Additional ResourcesCERCLA (Comprehensive Environmental
Response, Compensation, and Liability Act). 1980. 42 U. S. C. 103.
EPA (U.S. Environmental Protection Agency). 1991. Hydrogen Sulfide Corrosion: It’s Con-sequences, Detection and Control. Office of Water. WH-595. September: 832S91100. Washington, D.C.
9
EPA. 2003. Toxicological Review of Hydrogen Sulfide (CAS No. 7783-06-4). Washington, D.C. EPA/635/R-03-005.
EPA. 2009. “CERCLA/EPCRA Administra-tive Reporting Exemptions: Air Releases of Hazardous Substances from Animal Waste at Farms.” 76948-76960. Federal Register 73:244(18 Dec, 2008), pp. 76948–76960.
EPCRA (Emergency Planning and Community Right-To-Know Act). 1986. 42 U. S. C. 116.
MPCA (Minnesota Pollution Control Agency). 2000. Livestock Odor. 116MS§0713.
NRC (National Research Council). 2000. Nutrient Requirements of Beef Cattle: Update 2000. National Academy Press. Washington, DC.
NIOSH (National Institute for Occupational Safety and Health). 2005. Centers for Dis-ease Control and Prevention. Publication 2005-149.
OSHA (Occupational Safety and Health Administration). 2001. 29CFR§1904 and 29CFR§1910.
TCEQ (Texas Commission on Environmen-tal Quality). 1973. Control of Air Pollution from Sulfur Compounds. 30 T. A. C. 112.31-112.32.
TOXNET. 2009. Hydrogen Sulfide, CASRN 7783-06-4. Hazardous Substances Database, National Library of Medicine. Available online at: http://toxnet.nlm.nih.gov.
Texas A&M AgriLife Extension Service
AgriLifeExtension.tamu.edu
More Extension publications can be found at AgriLifeBookstore.org
Educational programs of the Texas A&M AgriLife Extension Service are open to all people without regard to race, color, sex, disability, religion, age, or national origin.
The Texas A&M University System, U.S. Department of Agriculture, and the County Commissioners Courts of Texas Cooperating.
Produced by Texas A&M AgriLife CommunicationsNew