hydrogen production by anaerobic digestion of pig manure: effect of operating conditions
TRANSCRIPT

at SciVerse ScienceDirect
Renewable Energy 53 (2013) 187e192
Contents lists available
Renewable Energy
journal homepage: www.elsevier .com/locate/renene
Hydrogen production by anaerobic digestion of pig manure: Effect of operatingconditions
M. Hernández*, M. RodríguezEnvironmental Engineering Research Center (CIIA), Department of Civil and Environmental Engineering, Universidad de los Andes, Carrera 1Este No. 19A-40, Bogotá, Colombia
a r t i c l e i n f o
Article history:Received 21 May 2012Accepted 21 November 2012Available online 23 December 2012
Keywords:Hydrogen productionOrganic loadpHPig manureRetention time
* Corresponding author. Tel.: þ57 1 3394949x2803E-mail addresses: [email protected] (
uniandes.edu.co (M. Rodríguez).
0960-1481/$ e see front matter � 2012 Elsevier Ltd.http://dx.doi.org/10.1016/j.renene.2012.11.024
a b s t r a c t
Experiments were conducted in an Anaerobic Batch Reactor (ABR) to assess the influence of pH, organicload and retention time on hydrogen production using pig manure as substrate. The study was conductedin two stages: the first stage focused on the effect of pH and the second stage assessed the effect ofretention time and organic load on hydrogen production. The pH values investigated were 5.0, 5.5 and6.0. The retention times were 12, 24 and 36 h with organic loading rates of 96.4, 48.2 and 32.1 kg VS/m3d,respectively. pH 5.5 had a maximum hydrogen concentration and production rate of 26.9% and 31.8 mLH2/h, respectively. Meanwhile, the retention time and organic load of 12 h and 96.2 kg VS/m3d produceda maximum hydrogen concentration and production rate of 23.6% and 102.1 mL H2/h, respectively. Thehydrogen concentration obtained by ABR of pig manure is limited. Methanogenesis was inhibited asconcluded from the methane concentrations being below 1% during all experiments except pH 6.0 anda retention time of 36 h. At pH 6.0, an inverse linear relationship between methane and hydrogenconcentration was found. Finally, a modified Gompertz model was used to fit hydrogen production atretention time of 12 and 24 h.
� 2012 Elsevier Ltd. All rights reserved.
1. Introduction
Hydrogen has been studied as an alternative energy carrierwhich produces water as its final combustion product. It can beproduced through a number of chemical processes such as steamreforming, gasification, electrolysis and pyrolysis, which use non-renewable sources as raw materials and demand high tempera-tures. Biological processes require less energy and use renewablebiomass [1e3]. In this case, photofermentation and dark fermen-tation can use wastes for hydrogen production. However, thephotofermentation process presents a number of disadvantagessuch as sunlight-dependence, which requires large surface areas. Inaddition, during photofermentation, hydrogen production is cata-lyzed by nitrogenases, which produces hydrogen at a lower ratethan hydrogenases [1,3e5]. As a result, dark fermentation showssome advantages and could be used as a preliminary step to pho-tofermentation in a sequential system. This configuration canincrease the global hydrogen production to rates 1.4e4.6 foldshigher than dark fermentation [3,4]. Dark fermentation generatesless biomass, but maintaining acceptable growth rates for
; fax: þ57 1 3324313.M. Hernández), manuel-r@
All rights reserved.
hydrogen-producing microorganisms [1,6]. Some studies in whichdark fermentation was used for hydrogen production are listed inTable 1. In this case, the highest hydrogen production is obtainedthrough the use of substrates rich in carbohydrates, nutrients, andselected or pretreated inoculum. However, the costs involved inmaintaining these specific conditions remain a challenge.
There are many environmental parameters such as pH,temperature, retention time, organic load and nutrients that drivethe anaerobic digestion required for hydrogen production. Underan acidic pH, it is possible to inhibit methanogenesis as metha-nogen activity requires a minimum pH of 6.5 [13,14]. In somestudies, pH between 5.0 and 6.0 has been reported as a successfulrange for hydrogen production [15,16]. Even though high organicloadsmay increase the time response, high values of this parameterincrease hydrogen production [17]. Organic shock loads inhibithydrogen-consumingmicroorganisms and improve growth rates ofhydrogen-producing microorganisms. As a result, the production ofVFA, hydrogen and carbon dioxide is faster and stronger [18].Therefore, pH and retention time decrease which, in turn, limit thereactions related to hydrogen consumers [19]. In addition, thereduction in retention time could limit the hydrolytic stage andacid formation decreasing hydrogen production. During darkfermentation, pure substrates such as glucose and starch requirea minimum biomass contact time between 2 and 12 h to reachmaximum hydrogen production [7,20]. Meanwhile, complex
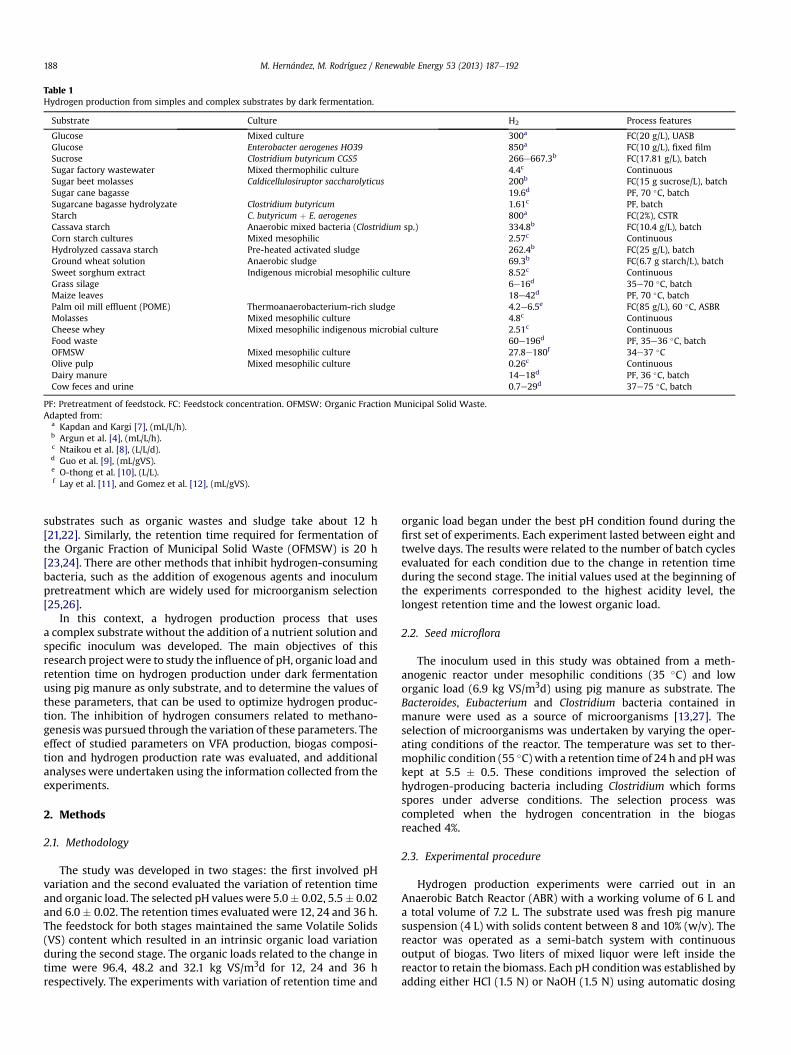
Table 1Hydrogen production from simples and complex substrates by dark fermentation.
Substrate Culture H2 Process features
Glucose Mixed culture 300a FC(20 g/L), UASBGlucose Enterobacter aerogenes HO39 850a FC(10 g/L), fixed filmSucrose Clostridium butyricum CGS5 266e667.3b FC(17.81 g/L), batchSugar factory wastewater Mixed thermophilic culture 4.4c ContinuousSugar beet molasses Caldicellulosiruptor saccharolyticus 200b FC(15 g sucrose/L), batchSugar cane bagasse 19.6d PF, 70 �C, batchSugarcane bagasse hydrolyzate Clostridium butyricum 1.61c PF, batchStarch C. butyricum þ E. aerogenes 800a FC(2%), CSTRCassava starch Anaerobic mixed bacteria (Clostridium sp.) 334.8b FC(10.4 g/L), batchCorn starch cultures Mixed mesophilic 2.57c ContinuousHydrolyzed cassava starch Pre-heated activated sludge 262.4b FC(25 g/L), batchGround wheat solution Anaerobic sludge 69.3b FC(6.7 g starch/L), batchSweet sorghum extract Indigenous microbial mesophilic culture 8.52c ContinuousGrass silage 6e16d 35e70 �C, batchMaize leaves 18e42d PF, 70 �C, batchPalm oil mill effluent (POME) Thermoanaerobacterium-rich sludge 4.2e6.5e FC(85 g/L), 60 �C, ASBRMolasses Mixed mesophilic culture 4.8c ContinuousCheese whey Mixed mesophilic indigenous microbial culture 2.51c ContinuousFood waste 60e196d PF, 35e36 �C, batchOFMSW Mixed mesophilic culture 27.8e180f 34e37 �COlive pulp Mixed mesophilic culture 0.26c ContinuousDairy manure 14e18d PF, 36 �C, batchCow feces and urine 0.7e29d 37e75 �C, batch
PF: Pretreatment of feedstock. FC: Feedstock concentration. OFMSW: Organic Fraction Municipal Solid Waste.Adapted from:
a Kapdan and Kargi [7], (mL/L/h).b Argun et al. [4], (mL/L/h).c Ntaikou et al. [8], (L/L/d).d Guo et al. [9], (mL/gVS).e O-thong et al. [10], (L/L).f Lay et al. [11], and Gomez et al. [12], (mL/gVS).
M. Hernández, M. Rodríguez / Renewable Energy 53 (2013) 187e192188
substrates such as organic wastes and sludge take about 12 h[21,22]. Similarly, the retention time required for fermentation ofthe Organic Fraction of Municipal Solid Waste (OFMSW) is 20 h[23,24]. There are other methods that inhibit hydrogen-consumingbacteria, such as the addition of exogenous agents and inoculumpretreatment which are widely used for microorganism selection[25,26].
In this context, a hydrogen production process that usesa complex substrate without the addition of a nutrient solution andspecific inoculum was developed. The main objectives of thisresearch project were to study the influence of pH, organic load andretention time on hydrogen production under dark fermentationusing pig manure as only substrate, and to determine the values ofthese parameters, that can be used to optimize hydrogen produc-tion. The inhibition of hydrogen consumers related to methano-genesis was pursued through the variation of these parameters. Theeffect of studied parameters on VFA production, biogas composi-tion and hydrogen production rate was evaluated, and additionalanalyses were undertaken using the information collected from theexperiments.
2. Methods
2.1. Methodology
The study was developed in two stages: the first involved pHvariation and the second evaluated the variation of retention timeand organic load. The selected pH values were 5.0� 0.02, 5.5� 0.02and 6.0� 0.02. The retention times evaluated were 12, 24 and 36 h.The feedstock for both stages maintained the same Volatile Solids(VS) content which resulted in an intrinsic organic load variationduring the second stage. The organic loads related to the change intime were 96.4, 48.2 and 32.1 kg VS/m3d for 12, 24 and 36 hrespectively. The experiments with variation of retention time and
organic load began under the best pH condition found during thefirst set of experiments. Each experiment lasted between eight andtwelve days. The results were related to the number of batch cyclesevaluated for each condition due to the change in retention timeduring the second stage. The initial values used at the beginning ofthe experiments corresponded to the highest acidity level, thelongest retention time and the lowest organic load.
2.2. Seed microflora
The inoculum used in this study was obtained from a meth-anogenic reactor under mesophilic conditions (35 �C) and loworganic load (6.9 kg VS/m3d) using pig manure as substrate. TheBacteroides, Eubacterium and Clostridium bacteria contained inmanure were used as a source of microorganisms [13,27]. Theselection of microorganisms was undertaken by varying the oper-ating conditions of the reactor. The temperature was set to ther-mophilic condition (55 �C) with a retention time of 24 h and pHwaskept at 5.5 � 0.5. These conditions improved the selection ofhydrogen-producing bacteria including Clostridium which formsspores under adverse conditions. The selection process wascompleted when the hydrogen concentration in the biogasreached 4%.
2.3. Experimental procedure
Hydrogen production experiments were carried out in anAnaerobic Batch Reactor (ABR) with a working volume of 6 L anda total volume of 7.2 L. The substrate used was fresh pig manuresuspension (4 L) with solids content between 8 and 10% (w/v). Thereactor was operated as a semi-batch system with continuousoutput of biogas. Two liters of mixed liquor were left inside thereactor to retain the biomass. Each pH conditionwas established byadding either HCl (1.5 N) or NaOH (1.5 N) using automatic dosing
0 1 2 3 4 5 6 7 80
5
10
15
20
VFA
(g/L
)
0 1 2 3 4 5 6 7 80
10
20
30
40
Biog
as c
ompo
sitio
n (%
v/v
)
5.05.56.0
M−5.0H−5.0M−5.5H−5.5M−6.0H−6.0
M. Hernández, M. Rodríguez / Renewable Energy 53 (2013) 187e192 189
pumps regulated by a control system. The bioreactor was stirredconstantly at 200 rpm to prevent the sedimentation of high solidsand to improve the hydrogen transfer from liquid to gas phase. Thethermophilic temperature (55 �C) was controlled by a heatingjacket coupled to a control system. Biogas was collected in 1 LTedlar�. Volatile fatty acids, biogas volume, hydrogen, carbondioxide (some data are shown in Sections 3.2 and 3.3) andmethaneconcentrationswere also recorded for each experimental condition.
2.4. Analytical methods
Hydrogen in the biogas was measured using a gas chromato-graph (GC, Hewlett Packard� 5890 series II) equipped witha thermal conductivity detector (TDC) and a stainless steel columnpacked with Carbosieve S-II (100/120 100 � 1/800 stainless column).The operational temperature of the injection port and the detectorwas at 250 �C. Helium was used as the carrier gas at a flow rate of30 mL/min. Concentrations of carbon dioxide and methane wererecorded on line using an Infra-red Gas Analyzer (GeotechnicalInstruments� e MK IIC) with a maximum deviation of �3%. Gasconcentration was reported as % (v/v). The cumulative hydrogenproduction was fitted with the modified Gompertz equation [28]:
H ¼ Pexp�� exp
hrmeP
ðl� tÞ þ 1i�
The concentrations of chemical oxygen demand (COD), VFA,Total Kjeldahl Nitrogen (TKN), ammonia, sulfide, Total Solids (TS)and VS were measured according to the Standard Methods [29].VFA were expressed as acetic acid concentration (g AA/L).
3. Results and discussion
3.1. Substrate
Pig manure is different from traditional substrates used for theinvestigation of biological hydrogen production (i.e., glucose andstarch), those are made up mainly of carbohydrates. This substrateis advantageous because it is a source of carbon and nitrogen, butpresents the disadvantage that contains sulfide, which implies thepossibility of reactions induced by sulfate-reducing bacteria(Table 2), which, in turn, could play an important role as inhibitorsof hydrogen production [30]. Additionally, a sulfide concentrationof above 150 mg/L has been reported as inhibitor of microbialgrowth during the methanogenic process. The heterogeneity of thepig manure results in high variation in the C/N ratio: 21.5 to 120,which is within the range for hydrogen production [10,20,31]. Thepig manure was preserved at�4 �C for only 15 days in order to limitbiodegradation. After that, fresh waste was collected and replacedevery fortnight to continue the experiments. The pH of the 15 day-old substrate was 6.1 and that of fresh manure, 7.0, presentinga decrease that could be a result of degradation processes and theheterogeneity of this kind of substrate.
Table 2Pig manure characterization.
Parameters Unit Value
pH e 6.1e7.0COD g/L 62.7e78.1TS % 8.1e9.5VS % 6.5e7.6VS/TS e 0.8TKN g/L 0.65e2.92Ammonia g/L 0.29e0.51S� mg/L 40e70
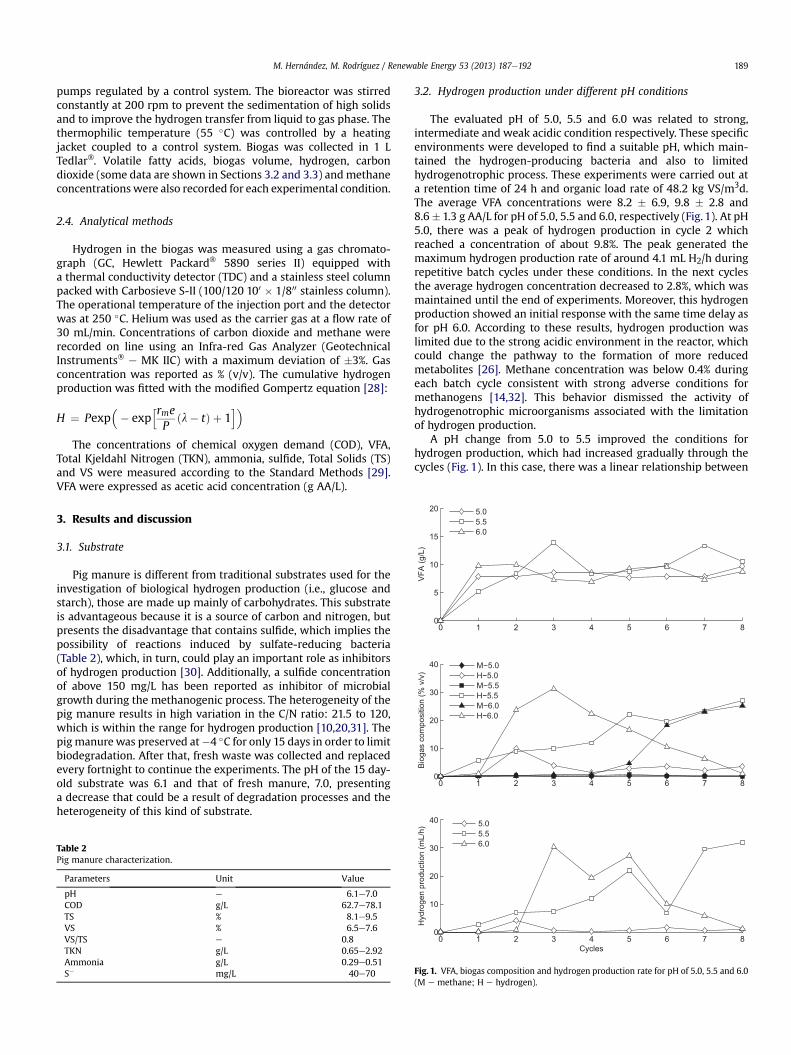
3.2. Hydrogen production under different pH conditions
The evaluated pH of 5.0, 5.5 and 6.0 was related to strong,intermediate and weak acidic condition respectively. These specificenvironments were developed to find a suitable pH, which main-tained the hydrogen-producing bacteria and also to limitedhydrogenotrophic process. These experiments were carried out ata retention time of 24 h and organic load rate of 48.2 kg VS/m3d.The average VFA concentrations were 8.2 � 6.9, 9.8 � 2.8 and8.6� 1.3 g AA/L for pH of 5.0, 5.5 and 6.0, respectively (Fig. 1). At pH5.0, there was a peak of hydrogen production in cycle 2 whichreached a concentration of about 9.8%. The peak generated themaximum hydrogen production rate of around 4.1 mL H2/h duringrepetitive batch cycles under these conditions. In the next cyclesthe average hydrogen concentration decreased to 2.8%, which wasmaintained until the end of experiments. Moreover, this hydrogenproduction showed an initial response with the same time delay asfor pH 6.0. According to these results, hydrogen production waslimited due to the strong acidic environment in the reactor, whichcould change the pathway to the formation of more reducedmetabolites [26]. Methane concentration was below 0.4% duringeach batch cycle consistent with strong adverse conditions formethanogens [14,32]. This behavior dismissed the activity ofhydrogenotrophic microorganisms associated with the limitationof hydrogen production.
A pH change from 5.0 to 5.5 improved the conditions forhydrogen production, which had increased gradually through thecycles (Fig. 1). In this case, there was a linear relationship between
0 1 2 3 4 5 6 7 80
10
20
30
40
Cycles
Hyd
roge
n pr
oduc
tion
(mL/
h)
5.05.56.0
Fig. 1. VFA, biogas composition and hydrogen production rate for pH of 5.0, 5.5 and 6.0(M e methane; H e hydrogen).

0 1 2 3 4 5 6 7 80
5
10
15
20
VFA
(mg/
L)
0 1 2 3 4 5 6 7 80
5
10
15
20
25
30
Biog
as c
ompo
sitio
n (%
v/v
)
0 1 2 3 4 5 6 7 80
20
40
60
80
100
120
Cycles
Hyd
roge
n pr
oduc
tion
(mL/
h)12 24 36
12 24 36
M−12 H−12 M−24 H−24 M−36 H−36
Fig. 2. VFA, biogas composition and hydrogen rate behavior in 12, 24 and 36 h (M e
methane; H e hydrogen).
M. Hernández, M. Rodríguez / Renewable Energy 53 (2013) 187e192190
hydrogen concentrations and the number of repetitive batchcultivations with a correlation factor of 0.951. In addition, the VFAconcentration changed from 8.3 to 10.5 g AA/L between cycle 2 and8 with two peaks above 13.2 g AA/L. This behavior was associatedwith the acclimatization of mixed culture increasing the amountsof metabolites related to hydrogen production [15]. However, thesevariations did not show a clear effect on biogas composition andhydrogen production rate, which had an independent trend duringeach cycle. Under these conditions, the maximum hydrogenconcentration was 26.9% with a hydrogen production rate of31.8 mL H2/h. The hydrogen production trend was conserved evenafter the significant drop observed at cycle 6 with just 6.8 mL H2/h.At the same time, the continuous increase of hydrogen showedthe inhibition of hydrogenotrophic microorganisms reachinga maximum methane concentration of 0.6% at cycle 5, but it thendecreased back to concentrations below the detection limit (0.2%)during the last experiments.
At pH 6.0, a special case was observed related to the change inbiogas composition between hydrogen and methane. During thefirst cycles, the hydrogen concentration in biogas increased quicklyfrom 0.9% to 31.2% reaching a maximum hydrogen production rateof 30.4 mL H2/h. The methane concentration increased to 0.5%at this point (cycle 3). Between cycles 3 and 5, the hydrogenproduction rate remained between 19.3 and 30.4mL H2/h related tothe rise in VFA concentration. The methane concentrationincreased from 4.6% (cycle 5) to a maximum of 25.2% consumingthe hydrogen produced in the process; this was associated with theactivation of methanogens, which began to colonize the biomass,working with hydrogen producers in a typical anaerobic digestionprocess [14]. As a result, the hydrogen concentration decreased to0.9%, while the hydrogen production rate decreased gradually to1.3 mL H2/h. Carbon dioxide concentration changed from 77.2 to67.2% between cycles 5 and 8 due its utilization with hydrogen toproduce methane. Similarly, there was a slight decrease in VFAconcentration suggesting the activation of acetoclastic microor-ganisms [14].
3.3. Hydrogen production under the variation of retention time andorganic load
Short retention times allow hydrogen-producing reactionsreducing VFA accumulation in the reactor and methanogenicprocesses [14,26]. These experiments were conducted under theoptimum pH condition (5.5). The VFA concentrations became stableduring each experimental condition achieving an average produc-tion of 10.2 � 5.2, 9.8 � 2.8 and 7.8 � 9.7 g AA/L for 12, 24 and 36 h,respectively (Fig. 2). The VFA accumulation was related to theinhibition of methanogenesis, which is a main VFA consumingprocess. At 12 and 24 h, there was an increasing trend on hydrogenconcentration in biogas showing the acclimatization of biomass inthe reactor as a result of repetitive batch cultivation. The maximumhydrogen concentrations achieved were 26.9 and 23.6% for 12 and24 h, respectively. The hydrogen production rate showed a similargradual increase for 24 h. Meanwhile, the condition of 12 h required5 cycles to reach the final production rates. The maximumhydrogen production rates were 102.1 and 31.8 mL H2/h for 12 and24 h, respectively. The VFA maintained similar steady concentra-tions despite the high increase in the rates at 12 h. The favorableresponse during the time reduction and organic increase could berelated to shock loads, which improve the quick VFA, hydrogen andcarbon dioxide production [17,18]. Carbon dioxide concentrationswere between 32.4e74.7% and 61.2e71.4% for 24 and 12 hrespectively. The maximum methane concentrations for 12 and24 h were 3.1 and 0.6%, respectively. However, these concentrationsdecreased at the end of each experiment to values below 0.5% for
both retention times. In experiments with pig manure conductedby Zhu et al. [33], methane concentrations were below 2 and 5% inbiogas for 16 and 20 h, respectively. Results showed the high impacton methanogenesis associated with the absence of nutrient solu-tion, which could limit the growth of methanogens.
The retention time of 36 h was evaluated after the pH conditionof 6.0. The response in cycle 1 showed a hydrogen concentration of21.7% associated with the more favorable pH condition (previously5.5). Methanogens were affected achieving methane concentra-tions of 0.5%. The next cycle showed a different trend related to thelonger retention time, which allowed the acclimatization of othermicroorganisms in the mixed culture. Methane concentrationbegan to increase through the repetitive batch cultivation untilreaching 2.1% at the end of the cycles. Meanwhile, the hydrogenconcentration decreased to 1.0% with sporadic increases at cycles 5and 8. Results show the unstable response of mixed culture underthese conditions due to the presence of several microorganisms.Similarly, hydrogen production rate decreased from 11.6 to 1.3 mLH2/h. This condition ended in a hydrogen production rate similar tothe rate at the end of the experiments at pH 6.0. Both conditionsimproved the methanogenic process due to higher retention timeand weak acidic condition.
Finally, the hydrogen concentrations reached under the two bestexperimental conditions, 12 and 24 h, were 23.6 and 26.9%respectively. Both results were close suggesting a limiting hydrogenconcentration in biogas using pig manure as a substrate [33]. Thehydrogen concentration was independent of the variation ofretention time and organic load. In addition, these experimentsshowed that the variation in both parameters (retention time andorganic load) did not produce a proportional response in hydrogen

10
15
20
25
30
Met
hane
(%)
y=−1.2725+28.745
M. Hernández, M. Rodríguez / Renewable Energy 53 (2013) 187e192 191
production. Further evidence that hydrogen production was notdirectly associated with these both parameters was obtained whenthe experimental retention time was reduced to 12 h and theorganic load increased 2-fold to 96.4 kg VS/m3d. In this case, thehydrogen production rate increased 3.2-fold as compared to thatobtained for 24 h and 48.2 kg VS/m3d. The molar ratios betweencarbon dioxide and hydrogen from the beginning to the end of theexperiments were 9.5:1 to 3:1 and 5.7:1 to 2.6:1 for 12 and 24 hrespectively. That suggested the development of different routes,which differ from the classical stoichiometry ratios of 1:2 and 1:1for acetic and butyric acids production [24].
0 5 10 15 20 25 30 350
5
Hydrogen (%)
Fig. 3. Relationship between methane and hydrogen for pH condition of 6.0.
3.4. Hydrogen production predicted through the Gompertz modeland the relationship with methane
The experimental data obtained during hydrogen productionwere fitted to the Gompertz equation and a relationship betweenthe concentrations of methane and hydrogen was developed. Theparameters calculated by the Gompertz equation are shown inTable 3. These were calculated for the curves with the highesthydrogen potential, 12 and 24 h. Hydrogen production potentialincreased 1.6-fold with a reduction in retention time from 24 to12 h, and an increase in organic load from 48.2 to 96.2 kg VS/m3d.At the same time, the 2.8-fold increase in the maximum hydrogenproduction rate showed the high influence of the operativeparameters over rm more than P. The Gompertz model was used tocalculate the maximum hydrogen production rate associated withthe development of hydrogen production during each retentiontime. The hydrogen production rate reported during the variationof retention time and organic load (Section 3.2) was associatedwiththe total hydrogen production at the end of each cycle. Thisexplains the difference in the ratio between 12 and 24 h, which was3.2 fold for the total hydrogen production and 2.8 fold for theevolution of hydrogen production over time. According to themodel, the lag-phase time of the process was reduced from 3.8 to3.4 h due to the response of microorganisms to the increase inorganic load [17,18]. The correlation coefficients for 12 and 24 hwere high with values of 0.995 and 0.998, respectively. Resultsshowed the ability of the Gompertz model to describe hydrogenproduction from pig manure under the influence of these operatingparameters.
Methane production was controlled through several environ-mental conditions managed during this study. Nevertheless, atpH 6.0 a maximum methane concentration was reached in biogasshowing a clear interference with hydrogen production. In thiscase, an inverse linear relationship was established betweenmethane and hydrogen concentrations (Fig. 3). The relationshipwas reached after undergoing three repetitive batch cultivationcycles. This observation supports the hypothesis that methaneproduction began after an acclimation period of the microorgan-isms. Hydrogenwas released while the methane concentrationwasbelow 1% until cycle 4. Nevertheless, at cycle 5 the methaneconcentration increased from 4.6 to 25.2% at cycle 8. Based on thestoichiometry of the reaction, to produce 1 mol of CH4, 4 mol of H2are required, whichmeans that themaximumhydrogen productionachieved at cycle 3 could have produced 21.2% of the final methaneat cycle 8. Therefore, there was an activation of the other methaneproducing mechanism related to acetoclastic microorganisms,
Table 3Kinetic parameters for hydrogen production obtained by Gompertz equation.
pH Time retention (h) P (mL) rm (mL/h) l (h) R2
5.5 12 1224.7 222.2 3.4 0.99524 763.3 75.2 3.8 0.998
which found favorable conditions at this pH condition. This resul-ted in methane concentrations above 20% and an increase in VFAconcentrations, suggesting a good response of the biomass due tohydrogen removal.
3.5. Specific hydrogen production rate
This parameter was calculated by dividing the maximumhydrogen production rate by the amount of volatile solids added.The specific hydrogen production rate was 18.6 mL H2/g VS for pH5.5 and 12 h, which were comparable to results obtained with otherorganic wastes. Shin et al. [23] reached a maximum specifichydrogen production rate of 46.1e91.5 mL H2/g VS using foodwastes, specific seed of microorganisms and TS and VS concentra-tions of 5.3 and 5 g/L, respectively. Nevertheless, the specifichydrogen production decreased to 40.1 mL H2/g VS during theexperiments at pH 5.5 and VS of 1 g/L. Lay et al. [11] workingwith OFMSW obtained specific hydrogen production rates of 140e180mL H2/g VS. These productions were reached using two specificseeds, hydrogen-producing bacteria and pretreated anaerobicdigestion sludge. But, when the addition of these microbial cultureswas below 10 and 20 g respectively, the specific hydrogen potentialwas below 10 and 40e50mLH2/g VS, respectively. Gomez et al. [12]obtained a specific hydrogen production of 27.8 and 28.3 mL H2/gVS through the use of OFMSW with two inocula from a sludgedigester of a wastewater treatment plant and reactor that digestedslaughterhouse waste, respectively.
The use of pig manure reached similar hydrogen specificproduction rates as obtainedusingotherorganicwastes suchas beancurd manufacturing waste, rice bran and wheat branwith a specificproduction rangeof 14e21, 31e61 and10e43mLH2/gVS [21]. In thiscase, when the TS content was above 6%, hydrogen productionpotential of bean curd manufacturing waste, rice bran and wheatbran decreased to 19e21, 33e35 and 10e14mLH2/g VS respectively.These differences show the importance of the solids content in thespecific hydrogenproduction,which suggests some limitation of thecurrent study resulting from high solid content. There are otherresults reportedbyGuoet al. [9] using corn straw (9e68mLH2/gVS),cow feces and urine (0.7e29 mL H2/g VS), dairy manure (14e18 mLH2/g VS) and food waste (3e196 mL H2/g VS). In this case, thespecific production obtained in this study is comparable with thesewastes, especially with cow feces and urine, and dairy manure.
3.6. Real application prospects
For real applications, substrates should be rich in simplecarbohydrates, polysaccharides or starch as seen in Table 1. This

M. Hernández, M. Rodríguez / Renewable Energy 53 (2013) 187e192192
aspect must be considered first for real applications, given thathydrogen production yields observed for complex substrates,including in this study, are lower than those found forcarbohydrate-rich substrates. Similarly, some challenges are relatedto complex substrates, which may contain polysaccharides, arisefrom their complexity, which limits the uptake by microorganismslowering the hydrogen production yield. As a result, theseapplications may require increased retention times, improvingthe development of consumption reactions, which limitedhydrogen production. Therefore, the use of these substrates forhydrogenproduction presents high limitations for real applications.Carbohydrate-rich substrates are more appropriate for developinga real scale process [10,34]. In addition, the process should becontinuous in order to have constant hydrogen production ratesand to avoid inhibition by metabolites and hydrogen production.Carbohydrate-rich substrates present some advantages in terms ofhydrogen production; but, even so, they have limitations due to thenutrients requirements and low hydrogen yields [4,24]. As a result,pig manure may be considered a co-substrate that can provide thenutrients and microorganisms required for the process, whichcannot be provided by carbohydrate-rich wastes. In addition,hydrogen can be produced from pig manure without the applica-tion of pre-treatments, and avoiding methanogenic activity [8].Finally, the effluent from dark fermentation must be treated due tothe high concentrations of VFA and solvents. Therefore, a secondstage such as anaerobic digestion or photofermentation could beadded to the system [4,5].
4. Conclusions
pH had a clear effect on the thermophilic dark fermentation ofpig manure. At pH 5.5 a hydrogen concentration and productionrate of 26.9% and 31.8 mL H2/h respectively, were obtained. pH 6.0was suitable for hydrogen production during the first cycles, butthrough the repetitive batch cultivation, the process shifted tomethane production, which resulted in an inverse linear relation-ship between methane and hydrogen concentrations. The variationof retention time and organic load showed that 12 h and 96.2 kg VS/m3d had a positive effect on hydrogen concentration (23.6%) andhydrogen production rate (102.1mL H2/h). Both sets of experimentsshowed a maximum hydrogen concentration range between 23.6and 26.9% for 12 and 24 h respectively, suggesting that there isa limit hydrogen concentration in biogas using pig manure assubstrate. The methanogenic stage was inhibited at pH 5.5 andretention time of 12 and 24 h. Amodified Gompertzmodel was ableto fit the hydrogen production reached at 12 and 24 h with highcorrelation coefficients. The experiments carried out in the ABRachieved a specific hydrogen production rate comparable withother complex substrates. Nevertheless, the process could not beconsidered for a real application due to the low hydrogen produc-tion rates; indeed, pig manure showed the ability to producehydrogen, which could be useful to support features for the process.
Acknowledgments
The authors would like to acknowledge the practical support ofthe members of the Environmental Laboratory at Universidad delos Andes and the financial support of the Research Center of theFaculty of Engineering (CIFI). Also, special thanks to Karen Lopezand Mildred Lemus, research assistants at the CIIA.
References
[1] Ni M, Leung DYC, Leung MKH, Sumathy K. An overview of hydrogenproduction from biomass. Fuel Process Technol 2006;87:461e72.
[2] Orecchini F. The era of energy vectors. Int J Hydrogen Energy 2006;31:1951e4.
[3] Kirtay E. Recent advances in production of hydrogen from biomass. EnergyConvers Manag 2011;52:1778e89.
[4] Argun H, Kargi F. Bio-hydrogen production by different operational modes ofdark and photo-fermentation: an overview. Int J Hydrogen Energy 2011;36:7443e59.
[5] Hallenbeck P, Abo-Hashesh M, Ghosh D. Strategies for improving biologicalhydrogen production. Bioresour Technol 2012;110:1e9.
[6] Hallenbeck PC, Benemann JR. Biological hydrogen production; fundamentalsand limiting processes. Int J Hydrogen Energy 2002;27:1185e93.
[7] Kapdan IK, Kargi F. Bio-hydrogen production from waste materials. EnzymeMicrob Technol 2006;38:569e82.
[8] Ntaikou I, Antonopoulou G, Lyberatos G. Biohydrogen production frombiomass and wastes via dark fermentation: a review. Waste Biomass Valor2010;1:21e39.
[9] Guo X, Trably E, Latrille E, Carrère H, Steyer JP. Hydrogen production fromagricultural waste by dark fermentation: a review. Int J Hydrogen Energy2010;35:10660e73.
[10] O-Thong S, Prasertsan P, Intrasungkha N, Dhamwichukorn S, Birkeland N-K.Optimization of simultaneous thermophilic fermentative hydrogen produc-tion and COD reduction from palm oil mill effluent by Thermoanaer-obacterium-rich sludge. Int J Hydrogen Energy 2008;33:1221e31.
[11] Lay JJ, Lee YJ, Noike T. Feasibility of biological hydrogen production fromorganic fraction of municipal solid waste. Water Res 1999;33:2579e86.
[12] Gomez X, Cuetos MJ, Prieto JI, Moran A. Bio-hydrogen production from wastefermentation: mixing and static conditions. Renew Energy 2009;34:970e5.
[13] Zhu J. A review of microbiology in swine manure odor control. Agric EcosystEnviron 2000;78:93e106.
[14] Appels L, Baeyens J, Degrève J, Dewil R. Principles and potential of theanaerobic digestion of waste-activated sludge. Prog Energy Combust Sci 2008;34:755e81.
[15] Fang HHP, Liu H. Effect of pH on hydrogen production from glucose bya mixed culture. Bioresour Technol 2002;82:87e93.
[16] Zheng XJ, Yu HQ. Roles of pH in biologic production of hydrogen and volatilefatty acids from glucose by enriched anaerobic cultures. Appl Biochem Bio-technol 2004;112:79e90.
[17] Lee KS, Hsu YF, Lo YC, Lin PJ, Lin CY, Chang JS. Exploring optimal environ-mental factors for fermentative hydrogen production from starch using mixedanaerobic microflora. Int J Hydrogen Energy 2008;33:1565e72.
[18] Voolapalli RK, Stuckey DC. Hydrogen production in anaerobic reactors duringshock loads e influence of formate production and H2 kinetics. Water Res2001;35:1831e41.
[19] Hawkes FR, Dinsdale R, Hawkes DL, Hussy I. Sustainable fermentativehydrogen production: challenges for process optimization. Int J HydrogenEnergy 2002;27:1339e47.
[20] Wang J, Wan W. Factors influencing fermentative hydrogen production:a review. Int J Hydrogen Energy 2009;34:799e811.
[21] Noike T, Mizuno O. Hydrogen fermentation of organic municipal wastes.Water Sci Technol 2000;42:155e62.
[22] Massanet-Nicolau J, Dinsdale R, Guwy A. Hydrogen production from sewagesludge using mixed microflora inoculum: effect of pH and enzymaticpretreatment. Bioresour Technol 2008;99:6325e31.
[23] Shin HS, Youn JH, Kim SH. Hydrogen production from food waste in anaerobicmesophilic and thermophilic acidogenesis. Int J Hydrogen Energy 2004;29:1355e63.
[24] Valdez-Vazquez I, Ríos-Leal E, Esparza-García F, Cecchi F, Poggi-Varaldo HM.Semi-continuous solid substrate anaerobic reactors for H2 production fromorganic waste: mesophilic versus thermophilic regime. Int J Hydrogen Energy2005;30:1383e91.
[25] Chan ASK, Parkin TB. Evaluation of potential inhibitors of methanogenesisand methane oxidation in a landfill cover soil. Soil Biol Biochem 2000;32:1581e90.
[26] Valdez-Vazquez I, Poggi-Varaldo HM. Hydrogen production by fermentativeconsortia. Renew Sustain Energy Rev 2009;13:1000e13.
[27] Snell-Castro R, Godon JJ, Delgenes JP, Dabert P. Characterisation of themicrobial diversity in a pig manure storage pit using small subunit rDNAsequence analysis. FEMS Microbiol Ecol 2005;52:229e42.
[28] Mu Y, Zheng XJ, Yu HQ, Zhu RF. Biological hydrogen production by anaerobicsludge at various temperatures. Int J Hydrogen Energy 2006;31:780e5.
[29] American Public Health Association (APHA). Standard methods for theexamination of water and wastewater. 21st ed.; 2005. Washington, DC.
[30] Chen Y, Cheng JJ, Creamer KS. Inhibition of anaerobic digestion process:a review. Bioresour Technol 2008;99:4044e64.
[31] Kim D-H, Kim S-H, Kim K-Y, Shin H-S. Experience of a pilot-scale hydrogen-producing anaerobic sequencing batch reactor (ASBR) treating food waste. IntJ Hydrogen Energy 2010;35:1590e4.
[32] Kim IS, Hwang MH, Jang NJ, Hyun SH, Lee ST. Effect of low pH on the activityof hydrogen utilizing methanogen in bio-hydrogen process. Int J HydrogenEnergy 2004;29:1133e40.
[33] Zhu J, Wu X, Miller C, Yu F, Chen P, Ruan R. Biohydrogen production throughfermentation using liquid swine manure as substrate. J Environ Sci Health B2007;42:393e401.
[34] Van Ginkel S, Oha S-E, Logan B. Biohydrogen gas production from food pro-cessing and domestic wastewaters. Int J Hydrogen Energy 2005;30:1535e42.