humic substances formed during the composting of organic matter
TRANSCRIPT
DIVISION S-3-SOIL MICROBIOLOGY& BIOCHEMISTRY
Humic Substances Formed during the Composting of Organic MatterY. Inbar, Y. Chen,* and Y. Hadar
ABSTRACTHumic substances (HS) were extracted from separated cattle-man-
ure compost (CSM) at various stages of decomposition. Carbon-13nuclear magnetic resonance (UC-NMR) and Fourier-transform in-frared (FTIR) spectroscopy measurements were performed on thepurified humic acids (HA) as well as crude fiber and chemical anal-yses. Levels of HS extracted from the CSM samples doubled duringthe composting (from 377 to 710 g kg-1 organic matter [OM|). TheHS were divided into: (i) HA, which increased from 184 to 457 gkg-1 OM; and (ii) a fulvic fraction (FF). The FF was separated onXAD-8 resin to: (i) fulvic acid (FA), which maintained an unchangedlevel during composting (80-100 g kg-1); and (ii) a nonhumic fraction(NHF), which increased from 107 to 170 g kg-1 OM during theprocess. The ratios between the concentrations of these fractionswere tested as humification indexes. These indexes changed signif-icantly during the process and were found to correlate exponentiallywith the composting time, C/N ratio, or both. Quantities of low-molecular-weight components (FF and NHF) rapidly increased dur-ing the first 40 d of composting and were nearly constant thereafter.The HA and HS contents reached nearly constant values after ~90d. Only slight compositional and structural changes in CSM HAwere detected with cross-polarization magic-angle spinning(CPMAS) 13C-NMR, FTIR spectra, and chemical analyses. Theelemental composition and functional groups of CSM HA resembledthose reported for HA of plant residues, peats, and incompletelyhumified materials. The CPMAS 13C-NMR spectra of the CSM HAresembled that of lignin. The aromaticity of the HA was about 40%and the lignin content was approximately 60%. The NMR data cor-related well with results obtained by FTIR spectroscopy, bothindicating that the CSM HA are composed of partially degradedconstituents of plant tissue, which still retain to some extent theirchemical structures. The major plant components identified in theHA were lignin, carbohydrates, and long-chain aliphatic structuralgroups.
IN THE LAST DECADE, the demand for peat as a pot-ting medium in horticulture has increased, while
its availability has decreased. A number of organicwastes, such as tree bark, leaf mold, city and urbanrefuse, sewage sludge, sawdust, and treated animal ex-creta, have been introduced as peat substitutes in sub-strates after proper composting (Verdonck, 1984;Ravivet al, 1986). In recent studies, compost pro-duced from the solid fraction of CSM was found tobe a high-quality peat substitute for container-grownplants (Inbar et al, 1986; Chen et al., 1988). However,the chemical characteristics and the degree of decom-Y. Inbar and Y. Chen, Dep. of Soil and Water Sciences, and Y.Hadar, Dep. of Plant Pathology and Microbiology, Faculty of Ag-riculture, Hebrew Univ. of Jerusalem, Rehovot 76100, Israel. Con-tribution from the Seagram Center for Soil and Water Sciences.Received 11 Aug. 1989. "Corresponding author.
Published in Soil Sci. Soc. Am. J. 54:1316-1323 (1990).
position of the organic matter required further elab-oration.
Recently, application of NMR spectroscopy in stud-ies on HA has gained considerable attention. Both 'Hand 13C-NMR, in the solid and liquid state, have beenused. Studies have shown that the technique of solid-state CPMAS 13C-NMR (Bartuska et al., 1977) canprovide C "fingerprints" of such diverse solid samplesas peats (Hatcher et al., 1986; Preston et al., 1987;Wilson et al., 1983), whole soils (Preston and Rip-meester, 1983; Wilson et al., 1983), composts (Pio-trowski et al., 1984; Gerasimowicz and Byler, 1985;Preston et al., 1986; Newman et al., 1987; Inbar et al.,1989), and HS isolated from a variety of sources(Hatcher et al., 1983; Malcolm, 1989). An in-depthreview of the state-of-the-art of NMR spectroscopytheory, techniques, and applications to a wide rangeof organic and inorganic geochemistry and soil chem-istry has been published by Wilson (1987).
Infrared (IR) analysis has contributed substantiallyto the knowledge of the chemistry of HA (Schnitzerand Khan, 1972; Stevenson, 1982; MacCarthy andRice, 1985), and complements the information ob-tained from solid-state CPMAS 13C-NMR spectros-copy (Lobartini and Tan, 1988; Gerasimowicz andByler, 1985; Inbar et al., 1989).
The objectives of this study were to measure andquantify the amounts of HS produced during the com-posting of CSM, to characterize the HA produced bychemical analysis and spectroscopical techniques, andto develop analytical methods for the determinationof compost maturity.
MATERIALS AND METHODSMaterials
A solid fibrous fraction was obtained from liquid cattlemanure using a Lisep Alfa Laval separator (Tumba, Swe-den). The solid phase (cake) was composted in 2 by 1 m3
perforated plastic boxes for 147 d. The material was turned,mixed thoroughly, and sampled after 0, 3, 10, 18, 26, 39, 60,91, 116, and 147 d. Samples of 25 L were stored at -4 °C.Two-liter subsamples were taken, dried at 105 °C, groundto pass through 0.25 mm, and stored in a desiccator undervacuum.Quantitative Estimation of Extractable Humic Substances
Two-gram samples of dried bulk compost at varying de-grees of decomposition were weighed into 50-mL centrifugetubes, 20 to 25 mL of 0.1 M NaOH were added, and themixture was shaken for 24 to 48 h under N2. The extractwas separated from the solids by centrifugation at 30 OOOgfor 30 min. The supernatant was transferred immediatelyinto a plastic bottle, acidified to pH 2 with concentratedH2SO4, and stored at 4 °C. Twenty milliliters of 0.1 M NaOH
1316

INBAR ET AL.: HUMIC SUBSTANCES FROM COMPOSTING 1317
solution were added to the sediment in the tubes and thesame extraction process was repeated 11 times. A combinedextract of about 220 mL was collected. The HS were redis-solved by adjusting the pH to 12 with NaOH granules. Thesuspensions were then filtered through Whatman no. 40 filterpaper and made up to a volume of 250 mL. Subsampleswere analyzed for C by the dichromate oxidation method(Page et al., 1982). The remaining solution was immediatelyacidified with concentrated H2SO4 to pH 2 and a 30-mLsample was centrifuged at 30 OOOg for 30 min. The precip-itate and supernatant were defined as HA and FF, respec-tively. Organic C was determined on an aliquot of the FF.In order to separate FA from the FF, a modification of amethod suggested by Sequi et al. (1986) was used. A 12.5-mL aliquot of the FF was applied to a small column packedwith about 6 cm3 of Amberlite XAD-8 resin (Rohm andHaas, Philadelphia, PA) previously conditioned accordingto Thurman and Malcolm (1981) and equilibrated with0.005 M H2SO4. The sample was eluated, the column waswashed with 10 mL of 0.005 MH2SO4, and the total eluatewas made up to volume in a 25-mL volumetric flask. OrganicC in this solution was determined and defined as NHF. Theamount of FA was calculated by subtracting NHF from FF.
Extraction and Purification ofHumic AcidsHumic substances were extracted by a modification of the
procedure described by Schnitzer and Preston (1986). Fivehundred grams (dry-weight basis) of compost (at naturalmoisture level) were suspended in 12.5 L of 0.1 MNaOHsolution and shaken for 24 h at room temperature («25 °C)under N2. The supernatant liquid containing the soluble HSwas separated by centrifugation at 16 OOOg for 30 min. Theresidue was resuspended in 0.1 MNaOH and the procedurewas repeated five times. The combined solutions were fil-tered to remove solids, acidified with 6 M HC1 to pH 1, andallowed to stand at room temperature for 24 h. The super-natant containing the extracted FF was separated from theprecipitated HA by centrifugation. The HA was purified bythe HC1/HF method (Schnitzer and Preston, 1986) until theash content was <1.0%. Following this treatment, the HAwas dialyzed against distilled water until the dialyzate wasfree of Cl and exhibited a neutral pH, at which point it wasfreeze-dried.
Chemical AnalysesElemental analyses of the HA were performed on duplicate
samples by Huffman Laboratories, Golden, CO and wereconducted as follows (Huffman and Stuber, 1985).
Prior to the analysis, the samples were dried under vac-uum at 60 °C to a constant weight. Carbon, H, and O2 weredetermined by a modified coulometric method, N by theDumas technique, S by an O2 flask combustion followed byion chromatography, P by acid digestion followed by a phos-phomolybdate colorimetric method, and ash by combustionto a constant weight of 750 °C.
Functional-group analyses were conducted by a modifi-cation of the method of Bowles et al. (1989). A 20-mg sampleof HA was dissolved in 4 mL of 0.08 M NaOH and stirredfor 30 min under N2. The solution was titrated with O.I MHC1 to pH 2.5 (15 min). Carboxyl content was calculatedbased on the amount of acid required to titrate the suspen-sion between pH 8.0 and the end point («pH 3.0). Phenolcontent was calculated by assuming that 50% of the phenolsare dissociated at pH 10. Accordingly, the acid consumptionbetween pH 8.0 and 10.0 should represent half of the phenolcontent (Bowles et al., 1989). Total acidity was calculatedby summation of the carboxyls and phenols. The EJEt ratioswere measured according to Chen et al. (1977). Optical den-sity was determined by using a Philips PU 8600 UV/VIS
spectrophotometer (Pye Unicam, Ltd., Cambridge,England).
Acid-soluble organic matter, cellulose, and lignin were de-termined on the HA using the acid-detergent-lignin (ADL)procedure of Goering and Van Soest (1971) (a modificationof the crude-fiber analysis of which the neutral-detergent fi-ber [NDF] step was omitted). One gram of dried HA wasrefluxed for 60 min in an acid detergent solution (0.5 MH2SO4, acid-detergent fiber [ADF] procedure). The ADF-soluble fraction includes protein and hemicellulose. The re-maining material was stirred with 72% H2SO4 for 3 h (ADL)to dissolve cellulose. Ashing the residue determined thecrude lignin fraction.
All chemical analyses were performed in triplicate. Resultsare stated as mean value for each measurement. Statisticalanalyses of the data were conducted using a Plotit nonlinearregression analysis with either the linearization or the Mar-quardt iteration method.
Carbon-13 Nuclear Magnetic Resonance SpectroscopyHigh-resolution solid-state 13C-NMR spectra with
CPMAS were obtained on a "home-built" spectrometer atthe Chemistry Department, Colorado State University. Thespectrometer operating conditions were: 'H frequency, 90.1MHz; 13C frequency, 22.6 MHz; spinning rate, near 4.0 kHz;contact time, 1 ms; external standard, hexamethylbenzene;acquisition time, 1,024 ms; sweep width, 531.11 ppm; andline broadening, 40 Hz. Oven-dried (105 °C) samples wereplaced into a bullet-type rotor and spun at a frequency ofabout 3.5 kHz at the magic angle (54.7° to the magneticfield). The 13C-NMR spectra were divided into the followingregions (Preston et al., 1987; Malcolm, 1989): 0 to 50 ppm(alkyl C), 50 to 60 (methoxyl groups), 60 to 110 ppm (C incarbohydrates and aliphatic structures bearing OH groups),110 to 145 ppm (aromatic C), 145 to 165 ppm (phenolic C),165 to 190 ppm (C in carboxyl groups), and 190 to 215 ppm(carbonyl C). Peak areas were measured with an integrator.Total aromaticity was calculated by expressing aromatic C(110-165 ppm) as percent of aliphatic C (0-110 ppm) plusaromatic C (Hatcher et al., 1981).
Infrared SpectroscopyFourier-transform infrared spectra were obtained at a
wavenumber range of 4000 to 400 cirr' on a Nicolet MX-Sspectrophotometer (Madison, WI) interfaced to an IBM PCand a digital plotter. Bulk materials or HA obtained fromthe composts were oven dried at 105 °C and finely ground.The samples were prepared for the analyses by mixing 100mg of KBr with about 2.4 mg of the material and then com-pressing the mixture to pellets. In order to compare onespectrum with another, a linear baseline correction functionwas applied using 4000 cm-', 2000 cm-', and 860 cm-' aszero-absorbance points (Inbar et al., 1989).
RESULTS AND DISCUSSIONExtraction of Humic Substances
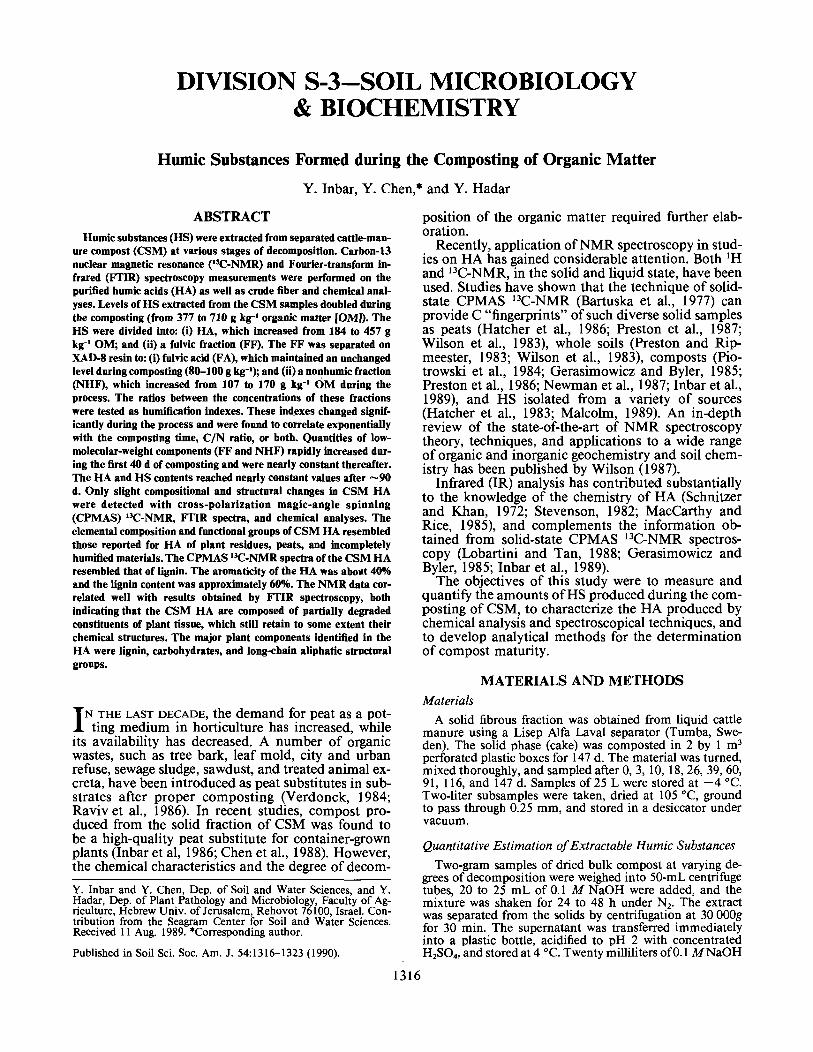
Total HS content doubled during the 147-d com-posting process (from 377 to 710 g kg-1 OM; Fig. 1A).This total-HS extract consisted of two main fractions:HA and FF. Both fractions increased during the de-composition process (from 184 to 457 g kg-1 OM forthe HA and from 194 to 253 g kg-1 OM for the FF;Fig. IB). The FF consisted of two subtractions: FA,which remained essentially unchanged (80-100 g kg-1
OM), and NHF, which increased from 107 g kg"1 OMin the fresh material to 170 g kg-' in the matured com-post (Fig. 1C). A similar trend during the composting
1318 SOIL SCI. SOC. AM. J., VOL. 54, SEPTEMBER-OCTOBER 1990
20 40 60 80 100 120
COMPOSTING T IME ( D A Y S )140
Fig. 1. Changes in the organic-matter content of humic substances,and their fractions extracted from separated cattle manure sam-ples during a 147-d composting process (HS = total humic sub-stances; HA = humic acid; FF = fulvic fraction; FA = fulvicacid; NHF = nonhumic fraction).
process of increase in soluble organic materials wasalso found in a crude-fiber analysis of bulk CSM andwas attributed to a continuous release of breakdownproducts during decomposition of the organic matter(Inbar et al., 1989).
Humification IndexesRatios between some of the measured values were
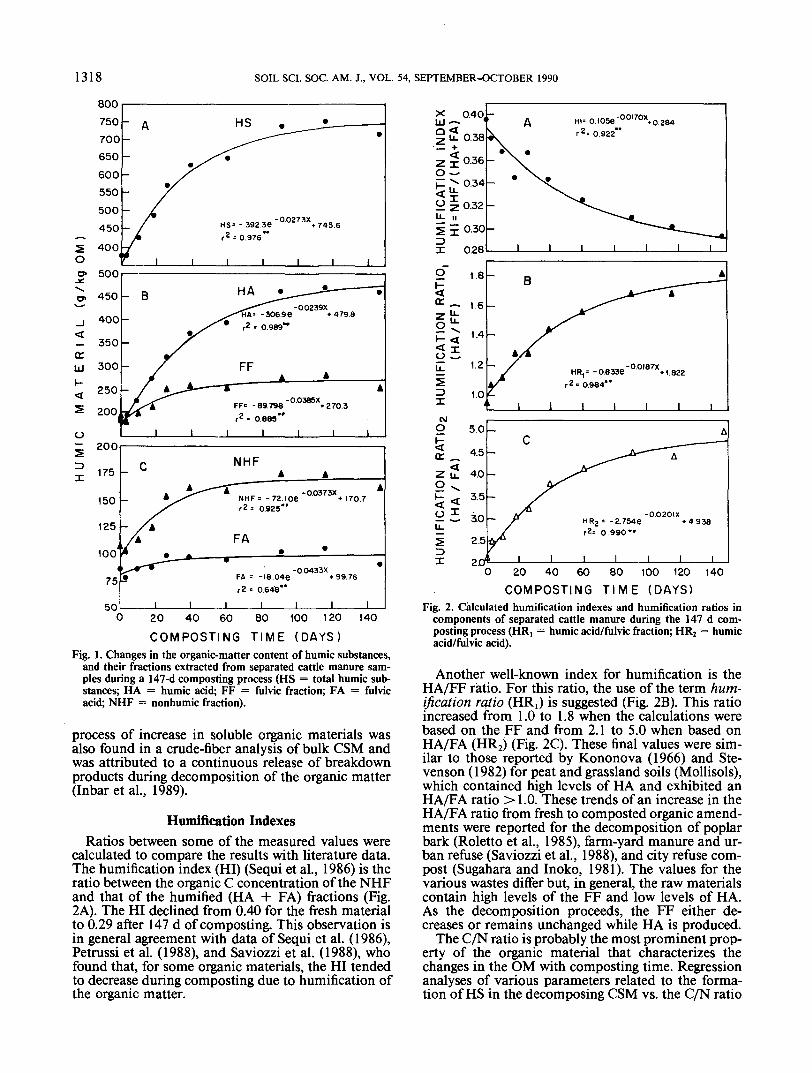
calculated to compare the results with literature data.The humification index (HI) (Sequi et al., 1986) is theratio between the organic C concentration of the NHFand that of the humified (HA + FA) fractions (Fig.2A). The HI declined from 0.40 for the fresh materialto 0.29 after 147 d of composting. This observation isin general agreement with data of Sequi et al. (1986),Petrussi et al. (1988), and Saviozzi et al. (1988), whofound that, for some organic materials, the HI tendedto decrease during composting due to humification ofthe organic matter.
if 038
•2. 0.36O •-H£0,4
2 Z 0.32U- n5 I 0.303I 0.28
2~ 1.8<°=~ 1.6
J7 1.25DX
CJO
1.0i
5.0
4.5CK _
•Z. if 4.0~x
25 30
2.5
20L
A HI- o.i05e-00'70x,0.284r 2- n QOO
HR,= -0.8336r2 - 0.984*"
-OO2OIXHR2= -27548 *4938r2= 0.990"
I _L I I J_ _L20 40 60 80 100 120 140
COMPOSTING T I M E (DAYS)Fig. 2. Calculated humification indexes and humification ratios in
components of separated cattle manure during the 147 d com-posting process (HR! = humic acid/fulvic fraction; HR2 = humicacid/fulvic acid).
Another well-known index for humification is theHA/FF ratio. For this ratio, the use of the term hum-ification ratio (HRO is suggested (Fig. 2B). This ratioincreased from 1.0 to 1.8 when the calculations werebased on the FF and from 2.1 to 5.0 when based onHA/FA (HR2) (Fig. 2C). These final values were sim-ilar to those reported by Kononova (1966) and Ste-venson (1982) for peat and grassland soils (Mollisols),which contained high levels of HA and exhibited anHA/FA ratio >1.0. These trends of an increase in theHA/FA ratio from fresh to composted organic amend-ments were reported for the decomposition of poplarbark (Roletto et al., 1985), farm-yard manure and ur-ban refuse (Saviozzi et al., 1988), and city refuse com-post (Sugahara and Inoko, 1981). The values for thevarious wastes differ but, in general, the raw materialscontain high levels of the FF and low levels of HA.As the decomposition proceeds, the FF either de-creases or remains unchanged while HA is produced.
The C/N ratio is probably the most prominent prop-erty of the organic material that characterizes thechanges in the OM with composting time. Regressionanalyses of various parameters related to the forma-tion of HS in the decomposing CSM vs. the C/N ratio

INBAR ET AL: HUMIC SUBSTANCES FROM COMPOSTING 1319
Table 1. Regression equations for the levels of extracted componentsof humic substances and for humification indexes vs. C/N ratioof the bulk organic matter or time, during a 147-d compostingprocess of separated cattle manure.
Table 2. Elemental analysis, atomic ratios, and functional-group con-tents of humic acids (HA) extracted from separated cattle manureat various stages of the composting process (oven-dry and ash-free basis).
Component! Regression equation SignificanceC/N
HSJ
HAJ
FF*
NHFJ
FA
HI
HR,
HR2
17.37 X exp(-0.0476* Time)+ 9.009
1000.4* exp(-0.0887* C/N)+ 260.1
808.2* exp(-0.1002* C/N)+ 120.1
226.8* exp(-0.0661* C/N)+ 145.9
178.9* exp(-0.0560* C/N)+ 60.88
45.012* exp(-0.0699* C/N)+ 75.96
-0.2527* exp(-0.0965* C/N)+ 0.3417
2.1 15* exp(-0.1001* C/N)+ 0.5686
6.885* exp(-0.0951* C/N)+ 1.5855
0.991
0.962
0.981
0.825
0.877
0.636
0.894
0.912
0.967
**
**
**
**
**
**
**
**
**
** Significant at 0.01 probability level; n = 27.t HS = humic substances; HA = humic acids; FF = fulvic fractions; NHF
= nonhumic fraction; FA = fulvic acid; HI = NHF/(HA + FA); HR, =HA/FF; HR? = HA/FA.
^ g kg~' organic matter.
of the bulk OM were performed, and are summarizedin Table 1. These analyses showed the following: (i)the C/N ratio was highly correlated to time (jR2 =0.991); (ii) the concentration of HS and all the frac-tions (HA, FF, FA, and NHF) were highly correlatedto the C/N ratio (R2 = 0.636-0.981); and (iii) the hum-ification indexes (HI, HR,, and HR2) were highly cor-related to the C/N ratio (R2 = 0.894-0.967). All thesecorrelations were exponential in nature and werehighly significant (P = 0.01).
Elemental and Functional-Group AnalysisElemental composition and atomic ratios of HA ex-
tracted from CSM at various stages of decomposition,compared with a model HA (Schnitzer, 1978), are pre-sented in Table 2. No significant changes were notedbetween the HA during the composting process. Theaverage composition of the HA extracted from CSMis close to that of the model HA, which represents HAfrom a large number of soils formed under widely dif-fering conditions (Schnitzer, 1978). There are somedifferences, however, that may differentiate the for-mation of the HA extracted from the CSM.
The C content of HA isolated from the CSM was582 g kg"1, which is somewhat higher than that foundfor soil HA, but in agreement with values reported byOrlov (1986) for HA extracted from Chernozems, hu-mus allophanes, peat bogs, and peats (580-590 g kg-1).The relative high C content is also typical of HA iso-lated from plant residues (Kononova and Alexan-drova, 1973). The H contents in the samples showedsimilar trends to those for C. The O content was com-paratively low and may suggest a low degree of oxi-dation. The N and S contents were close to the averagereported in the literature. When the H/C and O/Hratios (Table 2) were fitted to the H/C vs. O/H diagram(Kumada, 1987), the CSM HA were in the Rp HA typearea. This category represents HA extracted from in-
Composting time
Constituent
CHONSPAsh
H/CO/CN/CO/H
O d
58557
30436102
<1
1.160.390.050.34
18 d 91 d 147 d
Elemental analysis_ i._.
584 581 57857 54 53
303 316 31340 38 3810 11 113 3 3
15 6 6Atomic ratio
1.16 1.12 1.110.39 0.41 0.410.06 0.06 0.060.33 0.36 0.37
Average
-i
582 ± 2.4$55 ± 1.4
309 ± 5.638 ± 1.311 ±0.73 ± 0.47 ± 4.9
1.14 ± 0.0220.40 ± 0.0080.06 ± 0.0020.35 ± 0.013
ModelHAf
56247
355328
ND§ND
1.000.470.050.47
Functional groups
Total acidityCO2HPhenolic OHEJEJ
3.211.921.297.3
3.41 3.43 3.46 3.33 ± 0.142.02 2.15 2.211.39 1.28 1.267.2 7.1 7.8
2.04 ±0.151.29 ± 0.087.3 ± 0.34
6.703.603.904.8
f From Schnitzer, 1978.$ Standard deviation.§ ND = not determined.H EJE6 = absorbance at 465 nm/absorbance at 665 nm.
completely humified materials or from soils enrichedwith organic residues (comparatively low degree ofhumification). The H/C atomic ratios of peat are usu-ally 1.1 or less and are indicative of a high degree ofaromaticity (Hatcher et al, 1983), as found in the HAextracted from the composts (an average H/C == 1.14).
The major differences between the model andcompost HA were in the functional-group analyses.Compared with soil HA, the CSM HA contained ap-preciably less O-containing functional groups (Table 2).There was a slight increase in the carboxyl-groupcontent (from 1.92 to 2.21 mol kg-') during the com-posting process, whereas no change in the phenolic-OHcontents was observed. The average total acidity for theCSM HA was 3.33 mol kg"1. The carboxyl groupsreached concentrations of 2.04 mol kg"1, and the phe-nolic-OH concentration was 1.29 mol kg"1. These levelsare lower than the lowest limit of the range for soil HA(5.6-8.9, 1.5-5.7, and 2.1-5.7 mol kg"1, respectively;Schnitzer, 1978). Such low contents of O-containingfunctional groups are similar to those reported for HAfrom decomposing plant residues (Kononova and Al-exandrova, 1973; Zhigunov and Simakov, 1977), andvarious organic wastes (Riffaldi et al., 1983). Theselevels are also in agreement with the low O contentsfound in newly formed HA. The E4/E6 ratio (absorb-ance at 465 nm/absorbance at 665 nm) of the compostHA was much higher (average = 7.3) than that foundin soil HA (average = 4.8), indicating lower molecularweights (Chen et al., 1977).
These results indicate only minor differences be-tween HA extracted from the CSM at various stagesof composting. The elementary and functional-groupscompositions were similar to young forms of HA re-

1320 SOIL SCI. SOC. AM. J., VOL. 54, SEPTEMBER-OCTOBER 1990
ported in the literature. However, the concentrationof the HS increased significantly during composting.
Crude-Fiber AnalysesResults of the crude-fiber analyses are presented in
Table 3. The acid-soluble OM, which consisted mainlyof proteins and carbohydrates, decreased from 44.9 to
Table 3. Crude-fiber constituents and nuclear magnetic resonance(NMR) determined components of humic acids extracted fromseparated cattle manure at the beginning and at the end of a 147-d composting process.
Composting timeComponent Units O d 147 d
Crude-fiber analysesAcid-soluble organic matterCelluloseLigninAsh
%DMf%DM%DM%DM
44.92.7
51.60.8
32.42.0
65.00.6
Aliphatic CAromatic CCarboxylic CAromatic! tyLignin
NMR Data% of total C% of total C% of total C
%DM
53.635.49.5
39.756.7
50.437.110.642.461.5
t DM = dry matter.
l I
32.4% (28% reduction) during the composting process.The residual cellulose content was approximately 2%.The lignin content increased by 26% (from 51.6 to65.0%). The ash content was < 1%. Lignin is, therefore,the main organic constituent found in the HA ex-tracted from CSM.
Carbon-13 Nuclear Magnetic ResonanceSpectroscopy
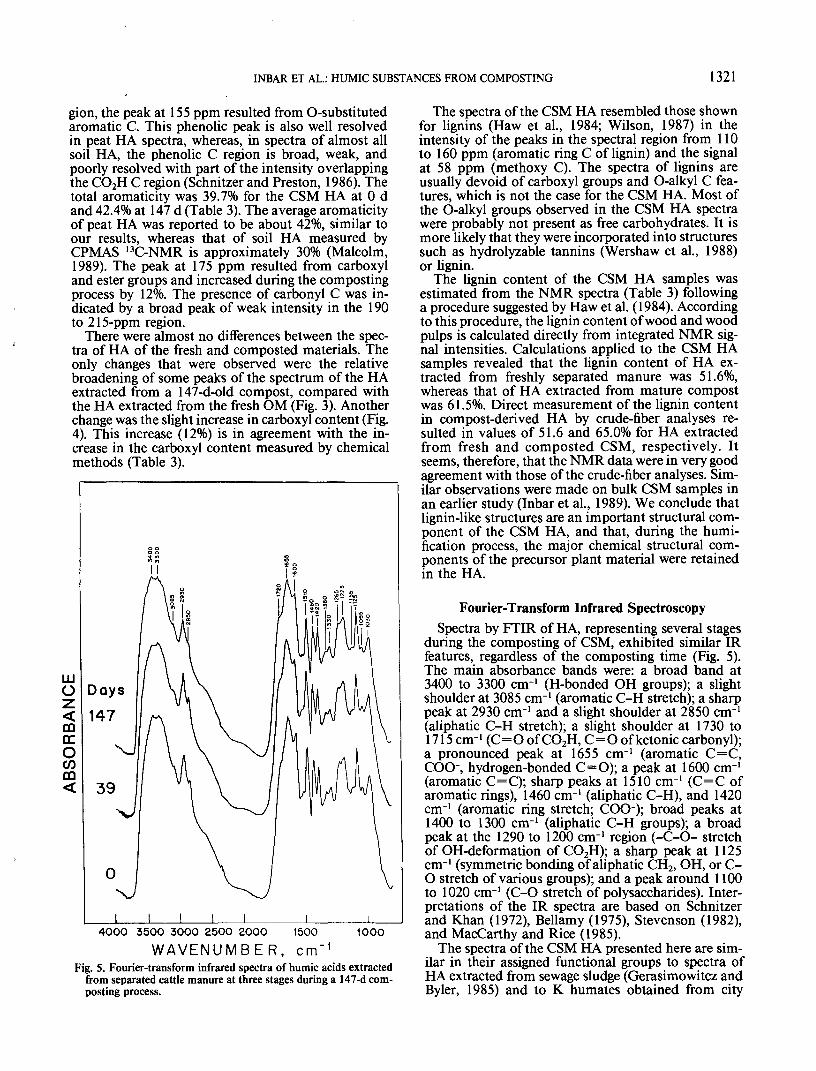
Spectra obtained by solid-state CPMAS I3C-NMRof HA extracted from fresh and mature CSM areshown in Fig. 3. The main feature in the aliphaticregion is the signal at 58 ppm, which was attributedto methoxy C, principally of lignin (Haw et al., 1984).The major peak in the alkyl region is centered at 31ppm, which is the chemical shift of methylene C ineither long-chain paraffinic structures or cycloparaf-fins. The shoulder at 25 ppm might suggest the pres-ence of methylene groups adjacent to a terminal C.The concentration of the alkyl groups (0-50 ppm) wasslightly reduced from 16.9 to 15.6% during composting(Fig. 4). The same trend was observed for the methoxygroups (50-60 ppm), which decreased from 10.6 to8.9%. The level of O-alkyl C, which was about 26%(60-110 ppm), did not change during the process. The73-ppm peak could have resulted from a side-chain Cof lignin. The 108-ppm peak seemed to appear as ashoulder in the aromatic region. This peak was as-signed to either C-2 and C-6 carbons of syringyl lignin,to tannin C, or to anomeric C of carbohydrates. Thealiphatic C (0-110 ppm) represented 53.6% of the totalC in the HA extracted from fresh CSM and 50.4% ofthe HA extracted from the composted material (Table3). The aromatic-C region (110-165 ppm) exhibitedvery well resolved peaks at 155 and 135 ppm and anadditional peak at 118 ppm. The peak at 135 ppmresulted from alkyl-substituted aromatic C (C-l car-bons of lignin), whereas the peaks at 110- to 120-ppmregion were assigned to aromatic C that are ortho orpara to O-substituted aromatic C. In the phenolic re-
OUJ
1Uoc
190-166165-146146-110 110-60 60-60 60-0CARBOXYL PHENOLIC AROMATIC O-ALKYL METHOXY ALKYL
25O 200 150 100 50 0 CHEMICAL SHIFT (ppm)
CHEMICAL SHIFT, b , ppmFig. 3. Cross-polarized magic-angle spinning 13C nuclear magnetic
resonance spectra of humic acids extracted from separated cattlemanure at the beginning and at the end of a 147-d compostingprocess.
• FRESH (0 days) ] COMPOST (147 days)
Fig. 4. Distribution of C in humic acids extracted from fresh and147-d-composted separated manure, and percentage of changefrom fresh to composted material as determined by cross-polar-ized magic-angle spinning 13C nuclear magnetic resonance.
INBAR ET AL.: HUMIC SUBSTANCES FROM COMPOSTING 1321
gion, the peak at 155 ppm resulted from O-substitutedaromatic C. This phenolic peak is also well resolvedin peat HA spectra, whereas, in spectra of almost allsoil HA, the phenolic C region is broad, weak, andpoorly resolved with part of the intensity overlappingthe CO2H C region (Schnitzer and Preston, 1986). Thetotal aromaticity was 39.7% for the CSM HA at 0 dand 42.4% at 147 d (Table 3). The average aromaticityof peat HA was reported to be about 42%, similar toour results, whereas that of soil HA measured byCPMAS 13C-NMR is approximately 30% (Malcolm,1989). The peak at 175 ppm resulted from carboxyland ester groups and increased during the compostingprocess by 12%. The presence of carbonyl C was in-dicated by a broad peak of weak intensity in the 190to 215-ppm region.
There were almost no differences between the spec-tra of HA of the fresh and composted materials. Theonly changes that were observed were the relativebroadening of some peaks of the spectrum of the HAextracted from a 147-d-old compost, compared withthe HA extracted from the fresh OM (Fig. 3). Anotherchange was the slight increase in carboxyl content (Fig.4). This increase (12%) is in agreement with the in-crease in the carboxyl content measured by chemicalmethods (Table 3).
IllOz<DOrrOm
Days
147
_L _L _L _L4000 3500 3000 2500 2000 1500 1000
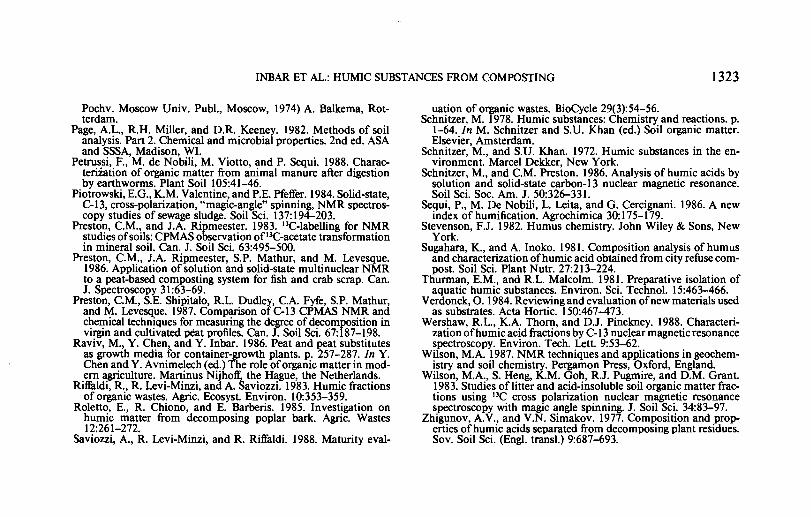
W A V E N U M B E R , cm'1Fig. 5. Fourier-transform infrared spectra of humic acids extracted
from separated cattle manure at three stages during a 147-d com-posting process.
The spectra of the CSM HA resembled those shownfor lignins (Haw et al., 1984; Wilson, 1987) in theintensity of the peaks in the spectral region from 110to 160 ppm (aromatic ring C of lignin) and the signalat 58 ppm (methoxy C). The spectra of lignins areusually devoid of carboxyl groups and O-alkyl C fea-tures, which is not the case for the CSM HA. Most ofthe O-alkyl groups observed in the CSM HA spectrawere probably not present as free carbohydrates. It ismore likely that they were incorporated into structuressuch as hydrolyzable tannins (Wershaw et al., 1988)or lignin.
The lignin content of the CSM HA samples wasestimated from the NMR spectra (Table 3) followinga procedure suggested by Haw et al. (1984). Accordingto this procedure, the lignin content of wood and woodpulps is calculated directly from integrated NMR sig-nal intensities. Calculations applied to the CSM HAsamples revealed that the lignin content of HA ex-tracted from freshly separated manure was 51.6%,whereas that of HA extracted from mature compostwas 61.5%. Direct measurement of the lignin contentin compost-derived HA by crude-fiber analyses re-sulted in values of 51.6 and 65.0% for HA extractedfrom fresh and composted CSM, respectively. Itseems, therefore, that the NMR data were in very goodagreement with those of the crude-fiber analyses. Sim-ilar observations were made on bulk CSM samples inan earlier study (Inbar et al., 1989). We conclude thatlignin-like structures are an important structural com-ponent of the CSM HA, and that, during the humi-fication process, the major chemical structural com-ponents of the precursor plant material were retainedin the HA.
Fourier-Transform Infrared SpectroscopySpectra by FTIR of HA, representing several stages
during the composting of CSM, exhibited similar IRfeatures, regardless of the composting time (Fig. 5).The main absorbance bands were: a broad band at3400 to 3300 cm-' (H-bonded OH groups); a slightshoulder at 3085 cm-' (aromatic C-H stretch); a sharppeak at 2930 cm-1 and a slight shoulder at 2850 cm-1
(aliphatic C-H stretch); a slight shoulder at 1730 to1715 cm-1 (C=O of CO2H, C=O ofketonic carbonyl);a pronounced peak at 1655 cm-1 (aromatic C=C,COO-, hydrogen-bonded C=O); a peak at 1600 cm-1
(aromatic C=C); sharp peaks at 1510 cm"1 (C=C ofaromatic rings), 1460 cm-1 (aliphatic C-H), and 1420cm-1 (aromatic ring stretch; COO"); broad peaks at1400 to 1300 cm-1 (aliphatic C-H groups); a broadpeak at the 1290 to 1200 cm-1 region (-C-O- stretchof OH-deformation of CO2H); a sharp peak at 1125cm-1 (symmetric bonding of aliphatic CH2, OH, or C-O stretch of various groups); and a peak around 1100to 1020 cm-1 (C-O stretch of polysaccharides). Inter-pretations of the IR spectra are based on Schnitzerand Khan (1972), Bellamy (1975), Stevenson (1982),and MacCarthy and Rice (1985).
The spectra of the CSM HA presented here are sim-ilar in their assigned functional groups to spectra ofHA extracted from sewage sludge (Gerasimowitcz andByler, 1985) and to K humates obtained from city

1322 SOIL SCI. SOC. AM. J., VOL. 54, SEPTEMBER-OCTOBER 1990
refuse compost (Sugahara and Inoko, 1981). However,in contrast to those spectra, there were no observedchanges among the different stages of decomposition.Kononova and Alexandrova (1973) reported that, inthe spectra of newly formed HA from plant residues,a variety of absorption bands that were not present insoil HA were observed.
The comparatively high aromaticity calculated fromthe NMR spectra (Table 3) was confirmed by the pro-nounced aromatic peaks detected in the FTIR spectraof the CSM HA. The relatively low free-carbohydratecontent found by the NMR was verified by a com-paratively small peak at the 1100 to 1020 cm-1 regionin the FTIR spectra. The low content of carboxyl-COOH groups that was measured chemically was con-firmed by the IR spectra. A distinct shoulder at 1720cnr1 (C=O, mainly in carboxyl groups) is character-istic of soil HA (Stevenson, 1982), while this band wasvery weak (as a slight shoulder) in the spectra of theCSM HA.
CONCLUSIONSLevels of HA extracted from CSM and the ratios
between various components of the HS changed sig-nificantly during the composting process. Extracted to-tal HS and HA approached constant values after ss90d of composting, whereas those of the low-molecular-weight components (NHF, FF, and FA) reached con-stant levels after 40 d. This indicates, as expected, thatlow-molecular-weight organics are decomposed at afaster rate than the high-molecular-weight HA. Ma-turity indexes can be derived from these time courses.The maturity indexes that were suggested were ex-ponentially and significantly correlated with com-posting time. However, chemical analyses, CPMAS13C-NMR, and FTIR spectra of the extracted HA re-vealed only slight compositional and structuralchanges. Extraction of fresh CSM with NaOH resultedin compounds resembling those extracted from com-posted CSM. The extracted HA resemble lignin, whichmay result from the selective action of the NaOHextraction. Lignin, which was a major organic con-stituent of the bulk material, was also the main com-ponent in the HA extracted from it. Comparison ofthe results on the HA extracted from separated manureto literature data revealed that these HA resemble peatHA and young forms of HA extracted from soils. TheCPMAS 13C-NMR spectra of the HA resembled thoseof lignin, although they were higher in O-alkyl C andcarboxyl groups and contained less aromatic C. TheCPMAS 13C-NMR spectra of the CSM HA indicatedthat they were composed of partially degraded chem-ical constituents of plant tissue, which still retainedtheir basic chemical structures. The major plant struc-tural components identified in the HA were lignin,carbohydrates, and long-chain aliphatic groups.
Fourier-transform infrared spectra measured on theextracted HA led, as did the 13C-NMR spectra, to theconclusion that the carbohydrate contents of the HAwas comparatively low and the materials exhibitedpronounced aromaticity along with relatively low car-boxyl contents, similar to young, poorly oxidized soilHA.
ACKNOWLEDGMENTSThis study was partially supported by a grant from the
Niedersachsishen Ministry of Science and Technology, W.Germany, and the Lady Davis Fellowship Trust.
We thank Dr. R.L. Malcolm, of the USGS, Arvada, CO,for his assistance in performing the I3C-NMR analyses.
INBAR ET AL: HUMIC SUBSTANCES FROM COMPOSTING 1323