human trampling as short-term disturbance on intertidal mudflats: effects on macrofauna biodiversity...
TRANSCRIPT
Mar Biol (2007) 151:2077–2090
DOI 10.1007/s00227-007-0641-0RESEARCH ARTICLE
Human trampling as short-term disturbance on intertidal mudXats: eVects on macrofauna biodiversity and population dynamics of bivalves
F. Rossi · R. M. Forster · F. Montserrat · M. Ponti ·A. Terlizzi · T. Ysebaert · J. J. Middelburg
Received: 7 August 2006 / Accepted: 1 February 2007 / Published online: 22 February 2007© Springer-Verlag 2007
Abstract The eVect of physical disturbance in theform of trampling on the benthic environment of anintertidal mudXat was investigated. Intense tram-pling was created as unintended side-eVect by ben-thic ecologists during Weld experiments in spring andsummer 2005, when a mid-shore area of 25 £ 25 mwas visited twice per month by on average Wveresearchers for a period of 8 months. At the puta-tively-impacted location (I) (25 £ 25 m) and twonearby control locations (Cs) (25 £ 25 m each), threesites (4 £ 4 m) were randomly selected and at eachsite, three plots (50 £ 50 cm) were sampled after 18and 40 days from the end of the disturbance.
Multivariate and univariate asymmetrical analysestested for changes in the macrofaunal assemblage,biomass of microphytobenthos and various sedimentproperties (grain-size, water content, NH4 and NO3concentrations in the pore water) between the twocontrol locations (Cs) and the putatively-impactedlocation (I). There were no detectable changes in thesediment properties and microphytobenthos bio-mass, but variability at small scale was observed.Microphytobenthos and NH4 were correlated at I tothe number of footprints, as estimated by the per-centage cover of physical depressions. This indicatedthat trampling could have an impact at small scales,but more investigation is needed. Trampling, instead,clearly modiWed the abundance and populationdynamics of the clam Macoma balthica (L.) and thecockle Cerastoderma edule (L.). There was a nega-tive impact on adults of both species, probablybecause footsteps directly killed or buried the ani-mals, provoking asphyxia. Conversely, tramplingindirectly enhanced recruitment rate of M. balthica,while small-sized C. edule did not react to the tram-pling. It was likely that small animals could recovermore quickly because trampling occurred during thegrowing season and there was a continuous supply oflarvae and juveniles. In addition, trampling mighthave weakened negative adult-juvenile interactionsbetween adult cockles and juvenile M. balthica, thusfacilitating the recruitment. Our Wndings indicatedthat human trampling is a relevant source of distur-bance for the conservation and management of mud-Xats. During the growing season recovery can be fast,but in the long-term it might lead towards the domi-nance of M. balthica to the cost of C. edule, therebyaVecting ecosystem functioning.
Communicated by O. Kinne.
F. Rossi (&) · F. Montserrat · T. Ysebaert · J. J. MiddelburgNetherlands Institute of Ecology (NIOO-KNAW), Centre for Estuarine and Marine Ecology, POB 140 4400, AC Yerseke, The Netherlandse-mail: [email protected]
R. M. ForsterCentre for Environment, Fisheries and Aquaculture Science (Cefas), PakeWeld Road, Lowestoft, SuVollk, NR33 OHT, UK
M. PontiCentro Interdipartimentale di Ricerca per le Scienze Ambientali in Ravenna, CIRSA, University of Bologna, Via S. Alberto 163, 48100 Ravenna, Italy
A. TerlizziLaboratorio Zoologia e Biologia Marina, Dipartimento Scienze e Tecnologie Biologiche ed Ambientali, Università di Lecce, CoNISMa,73100 Lecce, Italy
123
2078 Mar Biol (2007) 151:2077–2090
Introduction
Coastal environments are exposed to several anthropo-genic disturbances, which can aVect organisms at sev-eral biological scales, ranging from biogeochemistryand physiology up to the community level. Taxa thatare sensitive to the disturbance can be killed or dis-placed, while the survival and proliferation of resistanttaxa might be facilitated. As a result, there can bechanges in populations and assemblages and a shift inthe ecological processes shaping the communities with,often, a decrease of biodiversity (Underwood andPeterson 1988).
Marine beaches and other intertidal and subtidalhabitats are the centres of outdoor leisure activities,which can have a strong impact on the ecology of thesehabitats. Tourist activities such as sun-bathing, collec-tion of animals as baits or food and scuba-diving candisturb the ecosystem through a variety of ways,including their repeated trampling on the substratum(Keough and Quinn 1998, Davenport and Davenport2006). EVects of trampling have been demonstrated tobe detrimental for terrestrial plants and for organismsinhabiting sand-dunes (Liddle 1991; Sun and Walsh1998 and references herein). Similarly, relatively recentresearch has demonstrated that trampling can be harm-ful also for seaweeds and seagrasses as well as for theirassociated fauna in the marine environment (Hawkinsand Roberts 1993; Keough and Quinn 1998; Schiel andTaylor 1999; Brown and Taylor 1999; Eckrich andHolmquist 2000; Milazzo et al. 2004).
The eVect of human trampling has been measuredfor populations and assemblages in marine rockyshores, coral reefs and recreational beaches, but less sofor mudXats, which is partly explainable by the factthat tourist activities are lower on this type of habitats.On mudXats, the eVect of trampling has been mainlyconsidered as a side-eVect due to the harvestingof baits or commercially important bivalves, whichincludes the disturbance due to animal removal andto the method of capture (bait-pumps or digging)(Peterson 1977; Wynberg and Branch 1997; Contessaand Bird 2004). However, there can be other relevanttype of anthropogenic disturbance, in the form of tram-pling, such as leisure mud-walks that are now becom-ing a popular tourist attraction. Benthic ecologists canalso be a further, unintended source of disturbancewhen they repeatedly walk on the mudXats to collectsamples for monitoring programs or for extensivemanipulative experiments. To our knowledge, the solepublished work to have studied directly the eVect ofhuman footsteps on macrofauna was done on a foot-path used by pilgrims visiting the Holy Island in the
Lindisfarne National Natural Reserve (UK) (Chandra-sekara and Frid 1996).
On hard substrata, trampling can aVect marineorganisms in a variety of ways: directly, by removingand crushing organisms or indirectly by displacingother species that interact through competition, preda-tion or habitat provision (Brosnan and Crumrine1994). For example, trampling often reduces cover ofcoral colonies and erected macroalgae directly, whichhas consequences on other species and assemblagesbecause of habitat loss and niche reduction (Hawkinsand Roberts 1993; Keough and Quinn 1998; Schiel andTaylor 1999; Brown and Taylor 1999; Eckrich andHolmquist 2000; Milazzo et al. 2004). Similarly, in sea-grass meadows, physical action removes plants and rhi-zomes directly and, in turn, alters the habitat for theassociated species (Eckrich and Holmquist 2000). Cor-respondingly, on mudXats, the mechanical disturbanceof trampling can bury the animals living on the surfaceand bring deep burrowers to the surface, where theywill die if not allowed to return quickly to depth. Foot-steps can also disrupt the benthic bioWlm and destroyanimal burrows. This might vary the strength of biolog-ical interactions and have consequences on otherorganisms (Peterson 1977; Wynberg and Branch 1997;Contessa and Bird 2004 and references therein). OnmudXats, trampling can also alter topographic com-plexity, which can indirectly aVect recruitment and spa-tial distribution of microalgae (Wynberg and Branch1994) and macrofauna (Rossi and Chapman 2003;Cruz-Motta et al. 2003). Furthermore, compaction ofthe sediment might alter the exchange of nutrients andoxygen between the sediment and the overlying water,change sediment accumulation rate and, again, modifypopulation dynamics and distribution of animals in themudXat (Contessa and Bird 2004).
This study aims at quantifying the eVect of humantrampling on biological and environmental variables inan intertidal mudXat, where marine ecologists had useda walking path during an extensive and prolonged Weldcampaign in 2005. In particular, we focused this studyon (1) the abundance and species composition of mac-rofauna, considering the population dynamics of themost abundant species of bivalves, on (2) benthic mic-roalgal biomass and (3) sediment properties, includinggrain-size composition and concentration of the dis-solved inorganic nitrogen (NH4 and NO3) in the porewater as an indicator for changes in the biogeochemis-try of the sediment. Since trampling occurred on a sin-gle location and it was not possible to sample the areabefore the impact, we used an asymmetrical design,with data collected only after the disturbance (Glasby1997). This approach falls within the so-called beyond
123
Mar Biol (2007) 151:2077–2090 2079
BACI designs (Before-After-Control-Impact), whichcompares changes in single response variables at theputatively impacted location(s) to multiple controls,thereby taking into account natural patterns of vari-ability and variability-induced by the source of distur-bance under investigation (Underwood 1992, 1994).Recent developments have provided useful tools toextend the analytical framework of beyond-BACIdesigns into a multivariate context (Terlizzi et al.2005). In this study we deWned an impact as a diVer-ence between disturbed and control locations in thestructure of macrofauna assemblages or in any otherrelevant ecological variable that may have beenimpacted by trampling.
Material and methods
Study area and sampling design
The study was done on the intertidal mudXat of Pau-lina Polder (51°21� 23� N, 3°42� 49� E; Westerschelde,The Netherlands) in autumn 2005.
The Paulina Polder is a typically WesterscheldemudXat—salt marsh ecosystem, characterised by anextended mudXat with a rich benthic community domi-nated by polychaetes (Heteromastus Wliformis, Areni-cola marina, Pygospio elegans) and molluscs (Macomabalthica, Cerastoderma edule, Hydrobia ulvae). ThemudXat covers an area of approximately 1.0 km2 andhas a mean tidal range of 3.9 m, with a semidiurnalregime. Its surface is mostly level because there are fewminor drainage channels and major bedforms. The sed-iment is in general muddy with an average mud content(% < 63 �m) of 50%.
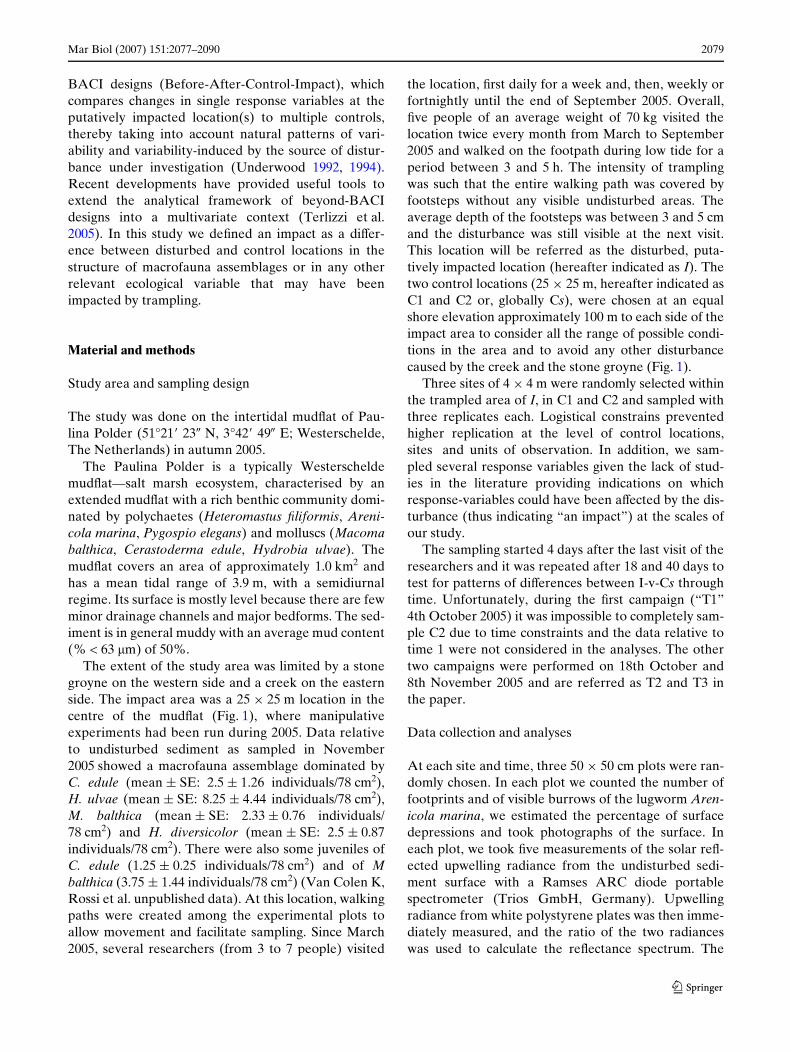
The extent of the study area was limited by a stonegroyne on the western side and a creek on the easternside. The impact area was a 25 £ 25 m location in thecentre of the mudXat (Fig. 1), where manipulativeexperiments had been run during 2005. Data relativeto undisturbed sediment as sampled in November2005 showed a macrofauna assemblage dominated byC. edule (mean § SE: 2.5 § 1.26 individuals/78 cm2),H. ulvae (mean § SE: 8.25 § 4.44 individuals/78 cm2),M. balthica (mean § SE: 2.33 § 0.76 individuals/78 cm2) and H. diversicolor (mean § SE: 2.5 § 0.87individuals/78 cm2). There were also some juveniles ofC. edule (1.25 § 0.25 individuals/78 cm2) and of Mbalthica (3.75 § 1.44 individuals/78 cm2) (Van Colen K,Rossi et al. unpublished data). At this location, walkingpaths were created among the experimental plots toallow movement and facilitate sampling. Since March2005, several researchers (from 3 to 7 people) visited
the location, Wrst daily for a week and, then, weekly orfortnightly until the end of September 2005. Overall,Wve people of an average weight of 70 kg visited thelocation twice every month from March to September2005 and walked on the footpath during low tide for aperiod between 3 and 5 h. The intensity of tramplingwas such that the entire walking path was covered byfootsteps without any visible undisturbed areas. Theaverage depth of the footsteps was between 3 and 5 cmand the disturbance was still visible at the next visit.This location will be referred as the disturbed, puta-tively impacted location (hereafter indicated as I). Thetwo control locations (25 £ 25 m, hereafter indicated asC1 and C2 or, globally Cs), were chosen at an equalshore elevation approximately 100 m to each side of theimpact area to consider all the range of possible condi-tions in the area and to avoid any other disturbancecaused by the creek and the stone groyne (Fig. 1).
Three sites of 4 £ 4 m were randomly selected withinthe trampled area of I, in C1 and C2 and sampled withthree replicates each. Logistical constrains preventedhigher replication at the level of control locations,sites and units of observation. In addition, we sam-pled several response variables given the lack of stud-ies in the literature providing indications on whichresponse-variables could have been aVected by the dis-turbance (thus indicating “an impact”) at the scales ofour study.
The sampling started 4 days after the last visit of theresearchers and it was repeated after 18 and 40 days totest for patterns of diVerences between I-v-Cs throughtime. Unfortunately, during the Wrst campaign (“T1”4th October 2005) it was impossible to completely sam-ple C2 due to time constraints and the data relative totime 1 were not considered in the analyses. The othertwo campaigns were performed on 18th October and8th November 2005 and are referred as T2 and T3 inthe paper.
Data collection and analyses
At each site and time, three 50 £ 50 cm plots were ran-domly chosen. In each plot we counted the number offootprints and of visible burrows of the lugworm Aren-icola marina, we estimated the percentage of surfacedepressions and took photographs of the surface. Ineach plot, we took Wve measurements of the solar reX-ected upwelling radiance from the undisturbed sedi-ment surface with a Ramses ARC diode portablespectrometer (Trios GmbH, Germany). Upwellingradiance from white polystyrene plates was then imme-diately measured, and the ratio of the two radianceswas used to calculate the reXectance spectrum. The
123
2080 Mar Biol (2007) 151:2077–2090
normalised diVerence vegetation index, NDVI basedon a two wavelength algorithm ((750–675)/(750 + 675))was calculated from reXectance values and used to esti-mate the surface chlorophyll a concentration (Kromk-amp et al. 2006), which is a proxy for microalgalbiomass. In each plot, one core (11 cm inner diameter,30 cm depth) was taken to estimate the abundance ofmacrofauna. Two smaller cores (3 cm i.d.) were used tosample water content and grain-size at both 1 and10 cm depth. The sediment from the two cores was,then, pooled to obtain one measure at each plot anddepth. The analyses showed no diVerences between thetop centimetre and the deep layers and only the resultsfrom the top centimetre are shown here for briefness.Finally, three additional cores (2 cm i.d.) were takenfrom the surface and pooled to estimate NH4 and NO3in the pore water. All cores used represent standardsizes for macrofauna and sediment samples in moststudies of intertidal sediments.
In the laboratory, samples for macrofauna weresieved at 1 mm, sorted alive, classiWed to species leveland counted. Sieving at 1 mm and sorting alive excludedthe collection of small polychaetes, which can, instead,be retained by a sieve of 0.5 mm. However, this proce-dure allowed us to process samples rapidly and the onlycommon species not retained were Heteromastus Wlifor-mis and Pygospio elegans (Rossi et al., unpublished).The specimens of the clam Macoma balthica and thecockle Cerastoderma edule were subdivided into size-classes. The shell of the cockle was measured to thenearest millimetre and animals were separated into two
size-classes (I: < 12 mm and II: > 12 mm) based on thebi-modal size-class distribution in the area (RossiF, unpublished). The distribution was probably due tothe fact that cockles were at the end of their recruitingand growing season. M. balthica was directly separatedinto size-classes according to its population dynamics,since individuals smaller than 10 mm are those thatrecruited during the year, while large individuals areolder than 1 year. Very small animals (<5 mm) repre-sent new recruits (Rossi et al. 2004). Thus, we consid-ered three size-classes of M. balthica: I: < 5 mm (newrecruits); II: between 5 and 10 mm (juveniles) andIII: > 10 mm (adults).
Water content was measured by weighting sedimentbefore and after desiccation by freeze-drying. The driedsamples were resuspended in a buVer medium andshaken before grain size analyses using a Malvern Mas-tersizer 2000 laser diVraction analyser (Sperazza et al.2004). Grain-size distribution were analysed in term ofmedian grain-size in phi value (D50) and percentages ofvery Wne sand (<125 �m) and silt and clay (<63 �m).
Porewater for DIN was extracted by centrifugation(2,000 rpm, 15 min) and the supernatant Wltered (Milli-pore 45 �m). Samples were stored at ¡20°C and analy-sed within 3 weeks using automated colorimetrictechniques.
Statistical analyses
Asymmetrical analyses of variance (Underwood 1992;Glasby 1997) were used to compare at I-v-Cs the
Fig. 1 Map of the study mud-Xat and position of the three sites in each of the three loca-tions: the impacted location (I) and the two controls, C1 and C2
123
Mar Biol (2007) 151:2077–2090 2081
following response variables: Arenicola marina burrows,porewater DIN and the abundance of the most abun-dant taxa. The model consisted of three factors: Loca-tion (L, one disturbed and two controls), Site (S(L)three levels, random, nested in location) and Time (T,2 levels, random and crossed with L), with three repli-cates. For the analyses of NDVI, we included an addi-tional source of variation, Plots (P, 5 levels nested inT £ S(L) interaction).
For analyses, the Location was partitioned into twoportions: I-v-Cs and the variability among Cs. TheTime £ Location (T £ L) interaction was similarlydivided into T £ I-v-Cs and T £ Cs portions. Theterms S(L) and T £ S(L) were similarly divided intoS(Cs) and S(I), and T £ S(Cs) and T £ S(I). Analo-gously, when applicable, the term P (T £ S(L)) wasdivided into the portion relative to the control loca-tions, P(T £ S (Cs)) and P(T £ S(I)). Finally, the resid-ual variation was divided into the residual variabilityfor observations within Cs and within I (i.e. Res Cs andRes I).
Denominators for F ratios were identiWed followingthe logic of beyond-BACI design (Underwood 1992)and the modiWcation given in Terlizzi et al. (2005). Thehomogeneity of variances was tested using Cochran’s Ctest and data were transformed when variances wereheterogeneous. Transformed data are indicated in theresults.
Permutational multivariate analyses of variance(PERMANOVA, Anderson 2001, 2005) based onBray-Curtis dissimilarities on square-root transformeddata was used to estimate variation in the multivariateassemblages between I-v-Cs. The analyses tested thesame hypotheses described for univariate asymmetricalANOVA but in a multivariate context (Terlizzi et al.2005). Each term in the analyses was tested using 4999random permutations of the appropriate units (Ander-son and ter Braak 2003). Where the number of permu-tation units was not enough to get a reasonable test bypermutation, a P value was obtained using a Monte-Carlo random sample for asymptotic permutation dis-tribution (Anderson and Robinson 2003). The analyseswere done using the computer programs DISTLM.exeand PERMANOVA.exe (Anderson 2004).
Multivariate patterns were visualised by non-metricmulti-dimensional scaling (nMDS) ordinations of site’scentroids on the basis of a Bray-Curtis dissimilaritymatrix on square-root transformed data. Centroidsand distances among them in Bray-Curtis spacewere obtained using the computer program PCO.exe(Anderson 2003); nMDS plots of distance matricesamong centroids were then generated with PRIMER 6software (Clarke and Gorley 2001). Species responsi-
ble for the multivariate patterns were identiWed withSIMPER routine available in PRIMER.
Results
Abiotic variables
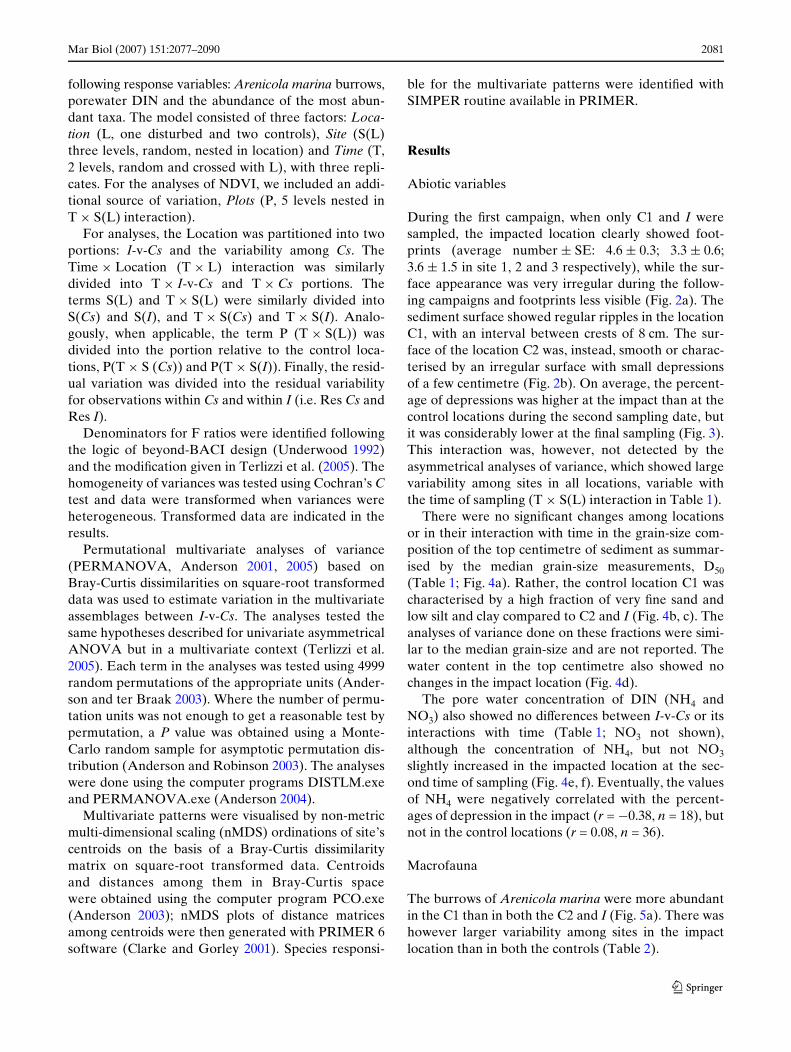
During the Wrst campaign, when only C1 and I weresampled, the impacted location clearly showed foot-prints (average number § SE: 4.6 § 0.3; 3.3 § 0.6;3.6 § 1.5 in site 1, 2 and 3 respectively), while the sur-face appearance was very irregular during the follow-ing campaigns and footprints less visible (Fig. 2a). Thesediment surface showed regular ripples in the locationC1, with an interval between crests of 8 cm. The sur-face of the location C2 was, instead, smooth or charac-terised by an irregular surface with small depressionsof a few centimetre (Fig. 2b). On average, the percent-age of depressions was higher at the impact than at thecontrol locations during the second sampling date, butit was considerably lower at the Wnal sampling (Fig. 3).This interaction was, however, not detected by theasymmetrical analyses of variance, which showed largevariability among sites in all locations, variable withthe time of sampling (T £ S(L) interaction in Table 1).
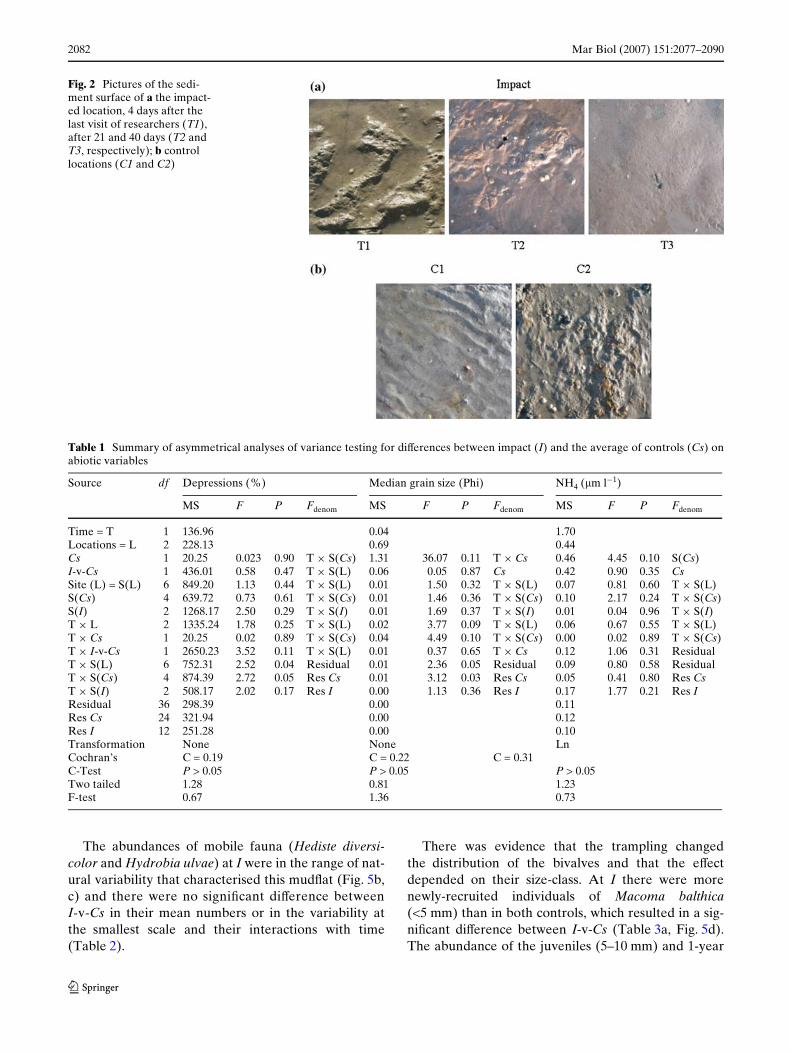
There were no signiWcant changes among locationsor in their interaction with time in the grain-size com-position of the top centimetre of sediment as summar-ised by the median grain-size measurements, D50(Table 1; Fig. 4a). Rather, the control location C1 wascharacterised by a high fraction of very Wne sand andlow silt and clay compared to C2 and I (Fig. 4b, c). Theanalyses of variance done on these fractions were simi-lar to the median grain-size and are not reported. Thewater content in the top centimetre also showed nochanges in the impact location (Fig. 4d).
The pore water concentration of DIN (NH4 andNO3) also showed no diVerences between I-v-Cs or itsinteractions with time (Table 1; NO3 not shown),although the concentration of NH4, but not NO3slightly increased in the impacted location at the sec-ond time of sampling (Fig. 4e, f). Eventually, the valuesof NH4 were negatively correlated with the percent-ages of depression in the impact (r = ¡0.38, n = 18), butnot in the control locations (r = 0.08, n = 36).
Macrofauna
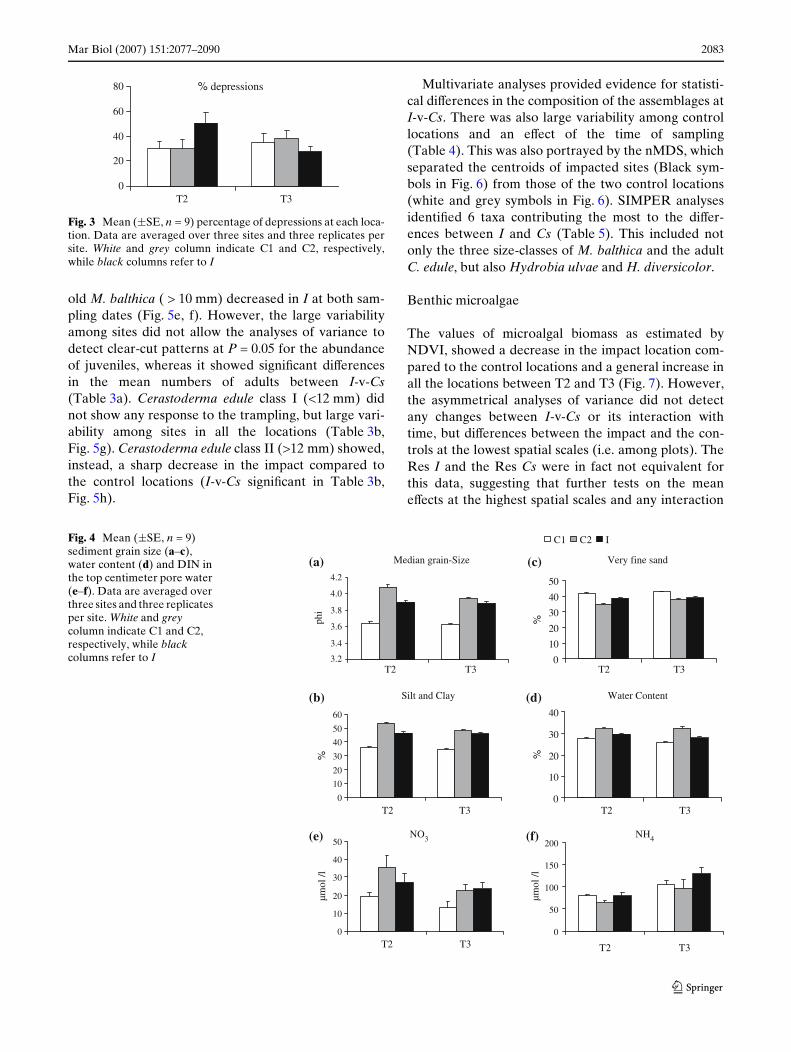
The burrows of Arenicola marina were more abundantin the C1 than in both the C2 and I (Fig. 5a). There washowever larger variability among sites in the impactlocation than in both the controls (Table 2).
123
2082 Mar Biol (2007) 151:2077–2090
The abundances of mobile fauna (Hediste diversi-color and Hydrobia ulvae) at I were in the range of nat-ural variability that characterised this mudXat (Fig. 5b,c) and there were no signiWcant diVerence betweenI-v-Cs in their mean numbers or in the variability atthe smallest scale and their interactions with time(Table 2).
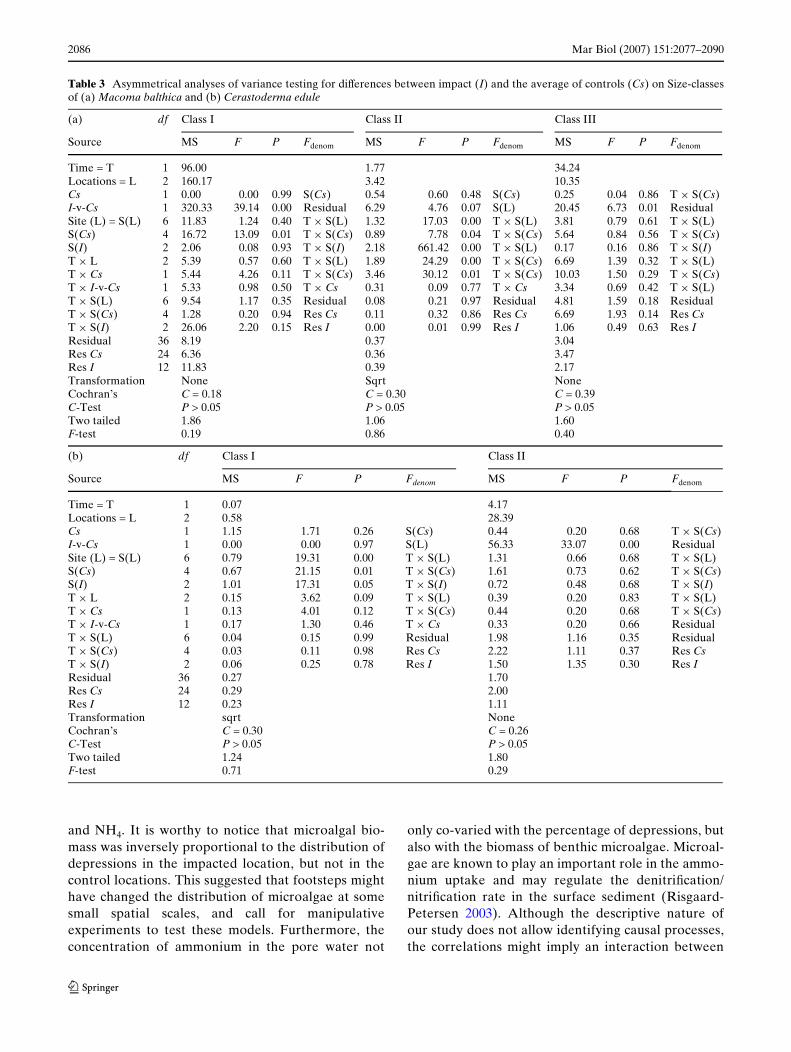
There was evidence that the trampling changedthe distribution of the bivalves and that the eVectdepended on their size-class. At I there were morenewly-recruited individuals of Macoma balthica(<5 mm) than in both controls, which resulted in a sig-niWcant diVerence between I-v-Cs (Table 3a, Fig. 5d).The abundance of the juveniles (5–10 mm) and 1-year
Fig. 2 Pictures of the sedi-ment surface of a the impact-ed location, 4 days after the last visit of researchers (T1), after 21 and 40 days (T2 and T3, respectively); b control locations (C1 and C2)
Table 1 Summary of asymmetrical analyses of variance testing for diVerences between impact (I) and the average of controls (Cs) onabiotic variables
Source df Depressions (%) Median grain size (Phi) NH4 (�m l¡1)
MS F P Fdenom MS F P Fdenom MS F P Fdenom
Time = T 1 136.96 0.04 1.70Locations = L 2 228.13 0.69 0.44Cs 1 20.25 0.023 0.90 T £ S(Cs) 1.31 36.07 0.11 T £ Cs 0.46 4.45 0.10 S(Cs)I-v-Cs 1 436.01 0.58 0.47 T £ S(L) 0.06 0.05 0.87 Cs 0.42 0.90 0.35 CsSite (L) = S(L) 6 849.20 1.13 0.44 T £ S(L) 0.01 1.50 0.32 T £ S(L) 0.07 0.81 0.60 T £ S(L)S(Cs) 4 639.72 0.73 0.61 T £ S(Cs) 0.01 1.46 0.36 T £ S(Cs) 0.10 2.17 0.24 T £ S(Cs)S(I) 2 1268.17 2.50 0.29 T £ S(I) 0.01 1.69 0.37 T £ S(I) 0.01 0.04 0.96 T £ S(I)T £ L 2 1335.24 1.78 0.25 T £ S(L) 0.02 3.77 0.09 T £ S(L) 0.06 0.67 0.55 T £ S(L)T £ Cs 1 20.25 0.02 0.89 T £ S(Cs) 0.04 4.49 0.10 T £ S(Cs) 0.00 0.02 0.89 T £ S(Cs)T £ I-v-Cs 1 2650.23 3.52 0.11 T £ S(L) 0.01 0.37 0.65 T £ Cs 0.12 1.06 0.31 ResidualT £ S(L) 6 752.31 2.52 0.04 Residual 0.01 2.36 0.05 Residual 0.09 0.80 0.58 ResidualT £ S(Cs) 4 874.39 2.72 0.05 Res Cs 0.01 3.12 0.03 Res Cs 0.05 0.41 0.80 Res CsT £ S(I) 2 508.17 2.02 0.17 Res I 0.00 1.13 0.36 Res I 0.17 1.77 0.21 Res IResidual 36 298.39 0.00 0.11Res Cs 24 321.94 0.00 0.12Res I 12 251.28 0.00 0.10Transformation None None LnCochran’s C = 0.19 C = 0.22 C = 0.31C-Test P > 0.05 P > 0.05 P > 0.05Two tailed 1.28 0.81 1.23F-test 0.67 1.36 0.73
123
Mar Biol (2007) 151:2077–2090 2083
old M. balthica ( > 10 mm) decreased in I at both sam-pling dates (Fig. 5e, f). However, the large variabilityamong sites did not allow the analyses of variance todetect clear-cut patterns at P = 0.05 for the abundanceof juveniles, whereas it showed signiWcant diVerencesin the mean numbers of adults between I-v-Cs(Table 3a). Cerastoderma edule class I (<12 mm) didnot show any response to the trampling, but large vari-ability among sites in all the locations (Table 3b,Fig. 5g). Cerastoderma edule class II (>12 mm) showed,instead, a sharp decrease in the impact compared tothe control locations (I-v-Cs signiWcant in Table 3b,Fig. 5h).
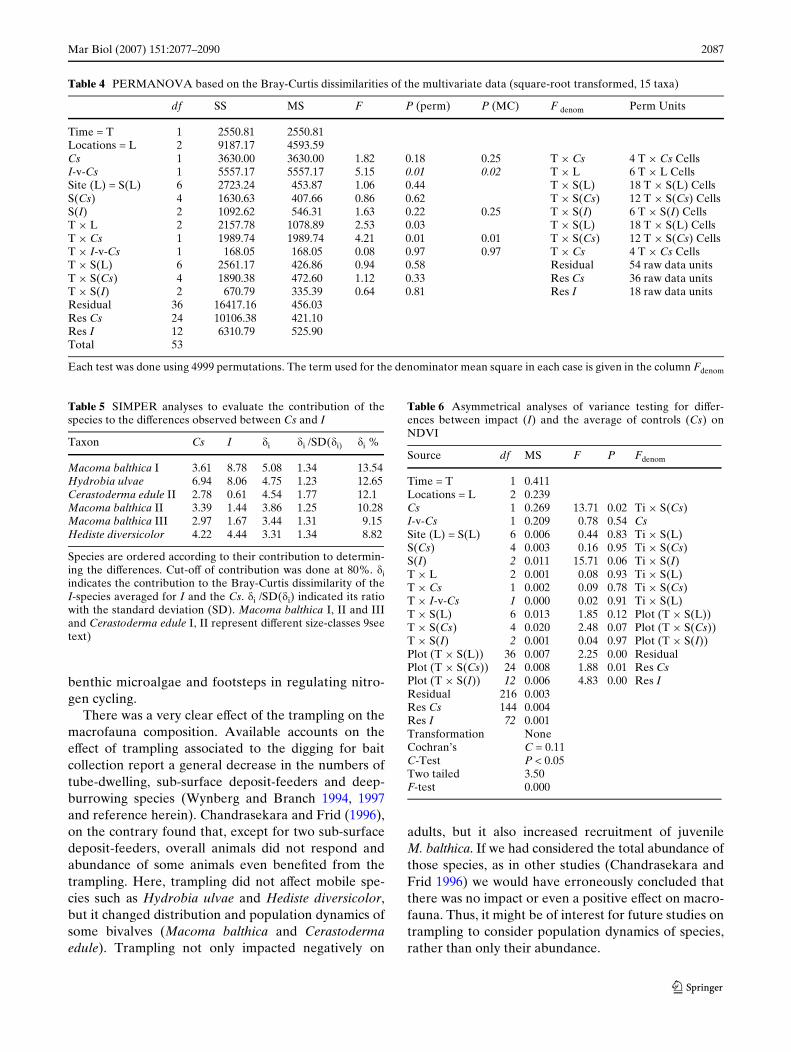
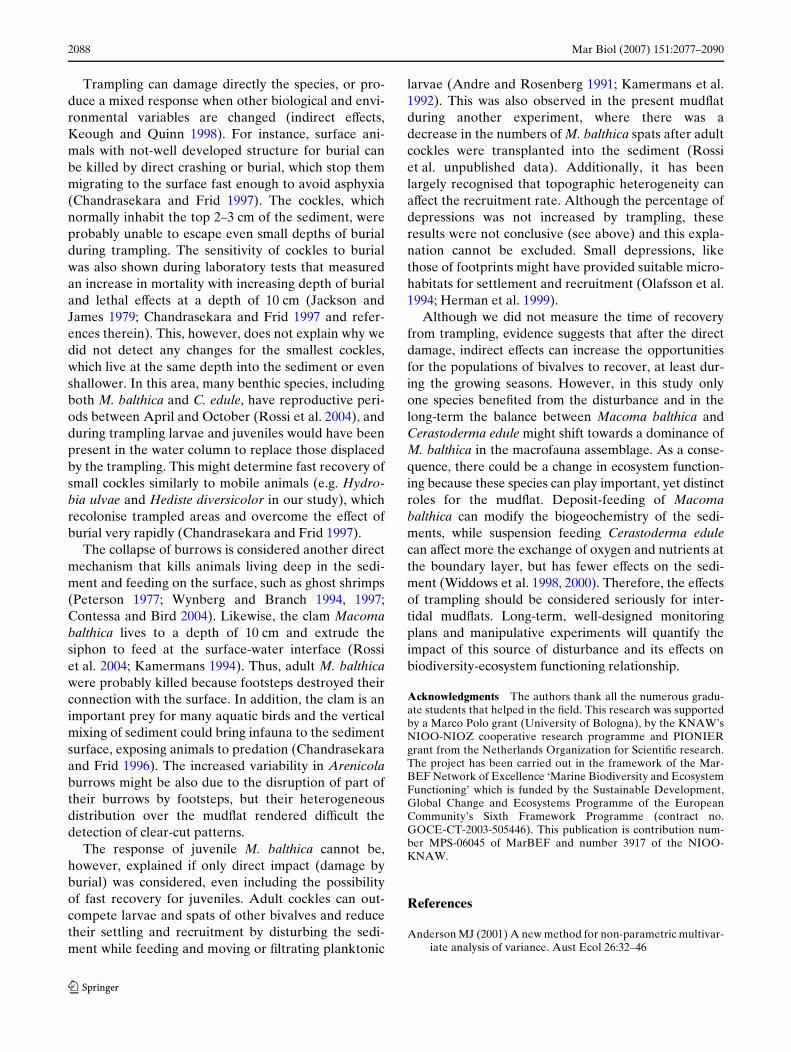
Multivariate analyses provided evidence for statisti-cal diVerences in the composition of the assemblages atI-v-Cs. There was also large variability among controllocations and an eVect of the time of sampling(Table 4). This was also portrayed by the nMDS, whichseparated the centroids of impacted sites (Black sym-bols in Fig. 6) from those of the two control locations(white and grey symbols in Fig. 6). SIMPER analysesidentiWed 6 taxa contributing the most to the diVer-ences between I and Cs (Table 5). This included notonly the three size-classes of M. balthica and the adultC. edule, but also Hydrobia ulvae and H. diversicolor.
Benthic microalgae
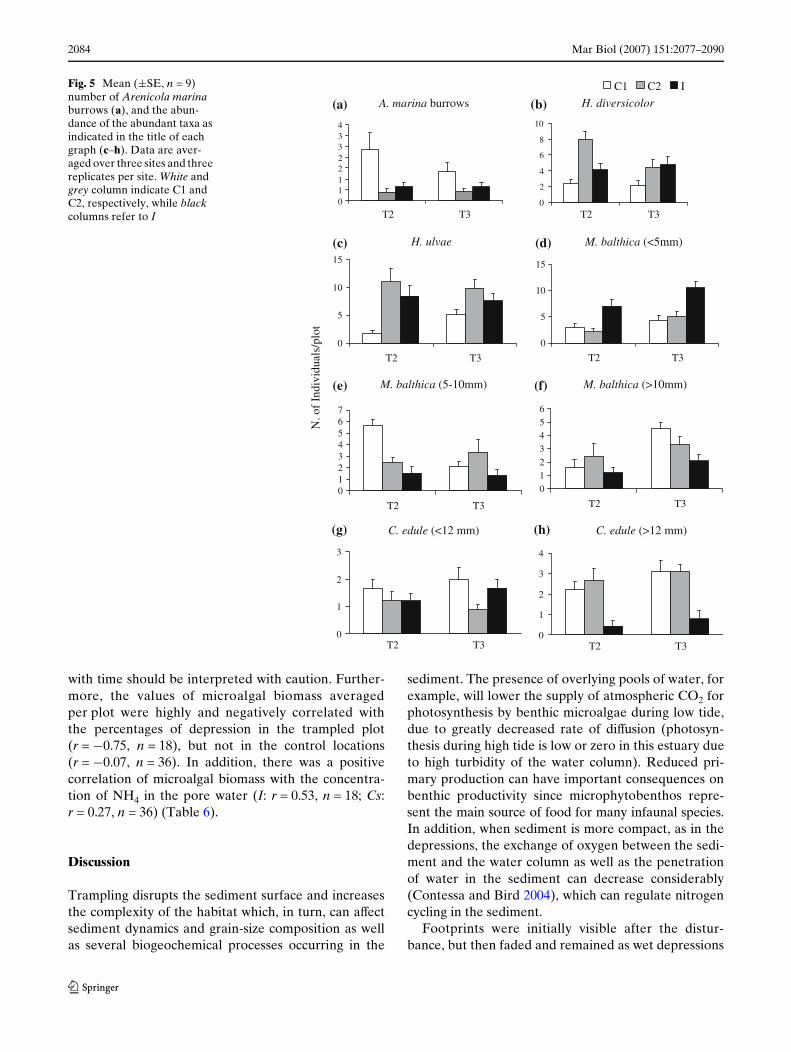
The values of microalgal biomass as estimated byNDVI, showed a decrease in the impact location com-pared to the control locations and a general increase inall the locations between T2 and T3 (Fig. 7). However,the asymmetrical analyses of variance did not detectany changes between I-v-Cs or its interaction withtime, but diVerences between the impact and the con-trols at the lowest spatial scales (i.e. among plots). TheRes I and the Res Cs were in fact not equivalent forthis data, suggesting that further tests on the meaneVects at the highest spatial scales and any interaction
Fig. 4 Mean (§SE, n = 9) sediment grain size (a–c), water content (d) and DIN in the top centimeter pore water (e–f). Data are averaged over three sites and three replicates per site. White and grey column indicate C1 and C2, respectively, while black columns refer to I
Silt and Clay
0
10
20
30
40
50
60
T2 T3
%
(b)
Median grain-Size
3.2
3.4
3.6
3.8
4.0
4.2
T2 T3
phi
C1 C2 I
(a) Very fine sand
0
10
20
30
40
50
T2 T3
%
(c)
NH4
0
50
100
150
200
T2 T3
(f)NO3
0
10
20
30
40
50
T2 T3
µmol
/l
µmol
/l
(e)
Water Content
0
10
20
30
40
T2 T3
%
(d)
Fig. 3 Mean (§SE, n = 9) percentage of depressions at each loca-tion. Data are averaged over three sites and three replicates persite. White and grey column indicate C1 and C2, respectively,while black columns refer to I
% depressions
0
20
40
60
80
T2 T3
123
2084 Mar Biol (2007) 151:2077–2090
with time should be interpreted with caution. Further-more, the values of microalgal biomass averagedper plot were highly and negatively correlated withthe percentages of depression in the trampled plot(r = ¡0.75, n = 18), but not in the control locations(r = ¡0.07, n = 36). In addition, there was a positivecorrelation of microalgal biomass with the concentra-tion of NH4 in the pore water (I: r = 0.53, n = 18; Cs:r = 0.27, n = 36) (Table 6).
Discussion
Trampling disrupts the sediment surface and increasesthe complexity of the habitat which, in turn, can aVectsediment dynamics and grain-size composition as wellas several biogeochemical processes occurring in the
sediment. The presence of overlying pools of water, forexample, will lower the supply of atmospheric CO2 forphotosynthesis by benthic microalgae during low tide,due to greatly decreased rate of diVusion (photosyn-thesis during high tide is low or zero in this estuary dueto high turbidity of the water column). Reduced pri-mary production can have important consequences onbenthic productivity since microphytobenthos repre-sent the main source of food for many infaunal species.In addition, when sediment is more compact, as in thedepressions, the exchange of oxygen between the sedi-ment and the water column as well as the penetrationof water in the sediment can decrease considerably(Contessa and Bird 2004), which can regulate nitrogencycling in the sediment.
Footprints were initially visible after the distur-bance, but then faded and remained as wet depressions
Fig. 5 Mean (§SE, n = 9) number of Arenicola marina burrows (a), and the abun-dance of the abundant taxa as indicated in the title of each graph (c–h). Data are aver-aged over three sites and three replicates per site. White and grey column indicate C1 and C2, respectively, while black columns refer to I
H. ulvae
0
5
10
15
T2 T3
(c) (d)
(e)
(g) (h)
(f)
H. diversicolor
0
2
4
6
8
10
T2 T3
C1 C2 I
(b)
M. balthica (<5mm)
0
5
10
15
T2 T3
M. balthica (5-10mm)
01234567
T2 T3
M. balthica (>10mm)
0123456
T2 T3
C. edule (<12 mm)
0
1
2
3
T2 T3
C. edule (>12 mm)
0
1
2
3
4
T2 T3
N. o
f In
divi
dual
s/pl
ot
A. marina burrows
01122334
T2 T3
(a)
123
Mar Biol (2007) 151:2077–2090 2085
(Fig. 2). However, the percentage of substratumdepressed in the impacted area did not diVer consis-tently from the control locations. Rather, it showedvariability among plots. Variability at small scales wasalso observed for grain-size and water content, NH4in the pore water and for benthic microalgae, but,again, they did not show any clear response to the dis-turbance. However, with three replicates per site, andconsidering that biogeochemical processes can varyover very small scales, sample size was probably not
enough to detect clear-cut patterns. More sampleswould be needed to increase the power of the analy-ses for these response variables. Therefore in thiscase, our failure to accept the alternative hypothesesshould not be taken as an acceptance of the nullhypotheses of no diVerences between the impactedand the control locations. Rather, we consider theresults of the analyses uncertain with more resourceto be invested in future investigations. There are,however, no published data on how trampling aVectsbiogeochemistry of the sediment and our Wnding canbe of great help for determining the sample size, thealternative hypotheses and the eVect size needed tocalculate the statistical power of future experiments.This could be especially true for benthic microalgae
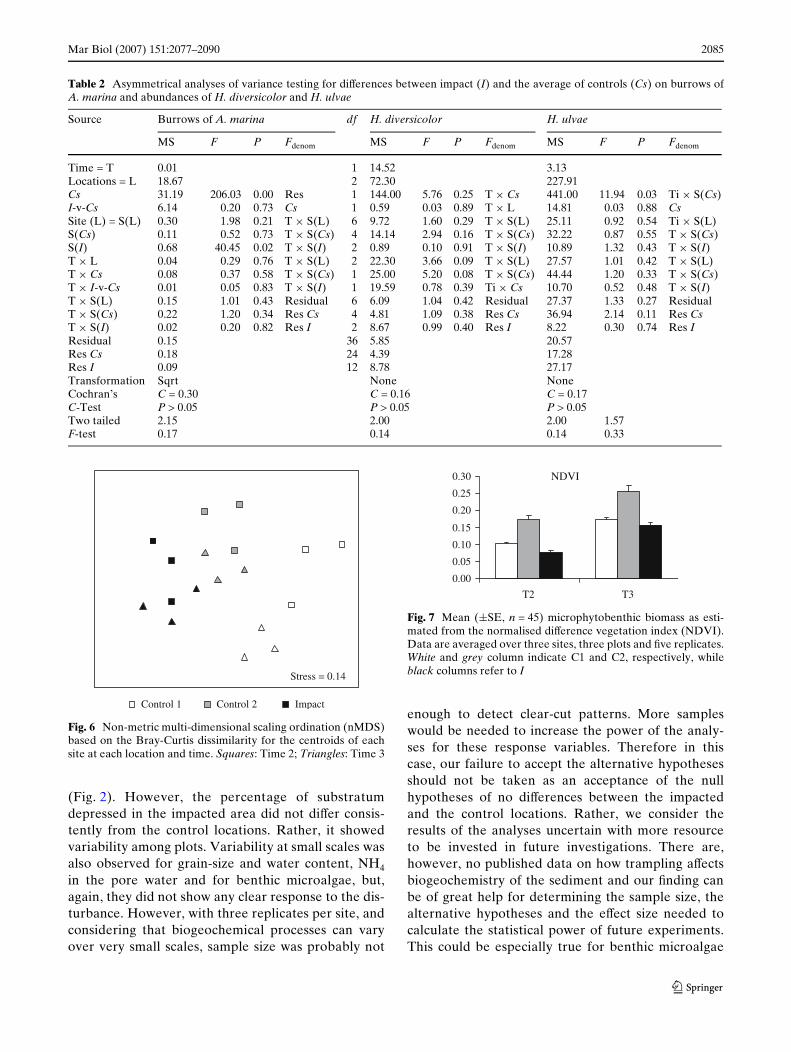
Table 2 Asymmetrical analyses of variance testing for diVerences between impact (I) and the average of controls (Cs) on burrows ofA. marina and abundances of H. diversicolor and H. ulvae
Source Burrows of A. marina df H. diversicolor H. ulvae
MS F P Fdenom MS F P Fdenom MS F P Fdenom
Time = T 0.01 1 14.52 3.13Locations = L 18.67 2 72.30 227.91Cs 31.19 206.03 0.00 Res 1 144.00 5.76 0.25 T £ Cs 441.00 11.94 0.03 Ti £ S(Cs)I-v-Cs 6.14 0.20 0.73 Cs 1 0.59 0.03 0.89 T £ L 14.81 0.03 0.88 CsSite (L) = S(L) 0.30 1.98 0.21 T £ S(L) 6 9.72 1.60 0.29 T £ S(L) 25.11 0.92 0.54 Ti £ S(L)S(Cs) 0.11 0.52 0.73 T £ S(Cs) 4 14.14 2.94 0.16 T £ S(Cs) 32.22 0.87 0.55 T £ S(Cs)S(I) 0.68 40.45 0.02 T £ S(I) 2 0.89 0.10 0.91 T £ S(I) 10.89 1.32 0.43 T £ S(I)T £ L 0.04 0.29 0.76 T £ S(L) 2 22.30 3.66 0.09 T £ S(L) 27.57 1.01 0.42 T £ S(L)T £ Cs 0.08 0.37 0.58 T £ S(Cs) 1 25.00 5.20 0.08 T £ S(Cs) 44.44 1.20 0.33 T £ S(Cs)T £ I-v-Cs 0.01 0.05 0.83 T £ S(I) 1 19.59 0.78 0.39 Ti £ Cs 10.70 0.52 0.48 T £ S(I)T £ S(L) 0.15 1.01 0.43 Residual 6 6.09 1.04 0.42 Residual 27.37 1.33 0.27 ResidualT £ S(Cs) 0.22 1.20 0.34 Res Cs 4 4.81 1.09 0.38 Res Cs 36.94 2.14 0.11 Res CsT £ S(I) 0.02 0.20 0.82 Res I 2 8.67 0.99 0.40 Res I 8.22 0.30 0.74 Res IResidual 0.15 36 5.85 20.57Res Cs 0.18 24 4.39 17.28Res I 0.09 12 8.78 27.17Transformation Sqrt None NoneCochran’s C = 0.30 C = 0.16 C = 0.17C-Test P > 0.05 P > 0.05 P > 0.05Two tailed 2.15 2.00 2.00 1.57F-test 0.17 0.14 0.14 0.33
Fig. 6 Non-metric multi-dimensional scaling ordination (nMDS)based on the Bray-Curtis dissimilarity for the centroids of eachsite at each location and time. Squares: Time 2; Triangles: Time 3
Control 1 Control 2 Impact
Stress = 0.14
Fig. 7 Mean (§SE, n = 45) microphytobenthic biomass as esti-mated from the normalised diVerence vegetation index (NDVI).Data are averaged over three sites, three plots and Wve replicates.White and grey column indicate C1 and C2, respectively, whileblack columns refer to I
NDVI
0.00
0.05
0.10
0.15
0.20
0.25
0.30
T2 T3
123
2086 Mar Biol (2007) 151:2077–2090
and NH4. It is worthy to notice that microalgal bio-mass was inversely proportional to the distribution ofdepressions in the impacted location, but not in thecontrol locations. This suggested that footsteps mighthave changed the distribution of microalgae at somesmall spatial scales, and call for manipulativeexperiments to test these models. Furthermore, theconcentration of ammonium in the pore water not
only co-varied with the percentage of depressions, butalso with the biomass of benthic microalgae. Microal-gae are known to play an important role in the ammo-nium uptake and may regulate the denitriWcation/nitriWcation rate in the surface sediment (Risgaard-Petersen 2003). Although the descriptive nature ofour study does not allow identifying causal processes,the correlations might imply an interaction between
Table 3 Asymmetrical analyses of variance testing for diVerences between impact (I) and the average of controls (Cs) on Size-classesof (a) Macoma balthica and (b) Cerastoderma edule
(a) df Class I Class II Class III
Source MS F P Fdenom MS F P Fdenom MS F P Fdenom
Time = T 1 96.00 1.77 34.24Locations = L 2 160.17 3.42 10.35Cs 1 0.00 0.00 0.99 S(Cs) 0.54 0.60 0.48 S(Cs) 0.25 0.04 0.86 T £ S(Cs)I-v-Cs 1 320.33 39.14 0.00 Residual 6.29 4.76 0.07 S(L) 20.45 6.73 0.01 ResidualSite (L) = S(L) 6 11.83 1.24 0.40 T £ S(L) 1.32 17.03 0.00 T £ S(L) 3.81 0.79 0.61 T £ S(L)S(Cs) 4 16.72 13.09 0.01 T £ S(Cs) 0.89 7.78 0.04 T £ S(Cs) 5.64 0.84 0.56 T £ S(Cs)S(I) 2 2.06 0.08 0.93 T £ S(I) 2.18 661.42 0.00 T £ S(L) 0.17 0.16 0.86 T £ S(I)T £ L 2 5.39 0.57 0.60 T £ S(L) 1.89 24.29 0.00 T £ S(Cs) 6.69 1.39 0.32 T £ S(L)T £ Cs 1 5.44 4.26 0.11 T £ S(Cs) 3.46 30.12 0.01 T £ S(Cs) 10.03 1.50 0.29 T £ S(Cs)T £ I-v-Cs 1 5.33 0.98 0.50 T £ Cs 0.31 0.09 0.77 T £ Cs 3.34 0.69 0.42 T £ S(L)T £ S(L) 6 9.54 1.17 0.35 Residual 0.08 0.21 0.97 Residual 4.81 1.59 0.18 ResidualT £ S(Cs) 4 1.28 0.20 0.94 Res Cs 0.11 0.32 0.86 Res Cs 6.69 1.93 0.14 Res CsT £ S(I) 2 26.06 2.20 0.15 Res I 0.00 0.01 0.99 Res I 1.06 0.49 0.63 Res IResidual 36 8.19 0.37 3.04Res Cs 24 6.36 0.36 3.47Res I 12 11.83 0.39 2.17Transformation None Sqrt NoneCochran’s C = 0.18 C = 0.30 C = 0.39C-Test P > 0.05 P > 0.05 P > 0.05Two tailed 1.86 1.06 1.60F-test 0.19 0.86 0.40
(b) df Class I Class II
Source MS F P Fdenom MS F P Fdenom
Time = T 1 0.07 4.17Locations = L 2 0.58 28.39Cs 1 1.15 1.71 0.26 S(Cs) 0.44 0.20 0.68 T £ S(Cs)I-v-Cs 1 0.00 0.00 0.97 S(L) 56.33 33.07 0.00 ResidualSite (L) = S(L) 6 0.79 19.31 0.00 T £ S(L) 1.31 0.66 0.68 T £ S(L)S(Cs) 4 0.67 21.15 0.01 T £ S(Cs) 1.61 0.73 0.62 T £ S(Cs)S(I) 2 1.01 17.31 0.05 T £ S(I) 0.72 0.48 0.68 T £ S(I)T £ L 2 0.15 3.62 0.09 T £ S(L) 0.39 0.20 0.83 T £ S(L)T £ Cs 1 0.13 4.01 0.12 T £ S(Cs) 0.44 0.20 0.68 T £ S(Cs)T £ I-v-Cs 1 0.17 1.30 0.46 T £ Cs 0.33 0.20 0.66 ResidualT £ S(L) 6 0.04 0.15 0.99 Residual 1.98 1.16 0.35 ResidualT £ S(Cs) 4 0.03 0.11 0.98 Res Cs 2.22 1.11 0.37 Res CsT £ S(I) 2 0.06 0.25 0.78 Res I 1.50 1.35 0.30 Res IResidual 36 0.27 1.70Res Cs 24 0.29 2.00Res I 12 0.23 1.11Transformation sqrt NoneCochran’s C = 0.30 C = 0.26C-Test P > 0.05 P > 0.05Two tailed 1.24 1.80F-test 0.71 0.29
123
Mar Biol (2007) 151:2077–2090 2087
benthic microalgae and footsteps in regulating nitro-gen cycling.
There was a very clear eVect of the trampling on themacrofauna composition. Available accounts on theeVect of trampling associated to the digging for baitcollection report a general decrease in the numbers oftube-dwelling, sub-surface deposit-feeders and deep-burrowing species (Wynberg and Branch 1994, 1997and reference herein). Chandrasekara and Frid (1996),on the contrary found that, except for two sub-surfacedeposit-feeders, overall animals did not respond andabundance of some animals even beneWted from thetrampling. Here, trampling did not aVect mobile spe-cies such as Hydrobia ulvae and Hediste diversicolor,but it changed distribution and population dynamics ofsome bivalves (Macoma balthica and Cerastodermaedule). Trampling not only impacted negatively on
adults, but it also increased recruitment of juvenileM. balthica. If we had considered the total abundance ofthose species, as in other studies (Chandrasekara andFrid 1996) we would have erroneously concluded thatthere was no impact or even a positive eVect on macro-fauna. Thus, it might be of interest for future studies ontrampling to consider population dynamics of species,rather than only their abundance.
Table 4 PERMANOVA based on the Bray-Curtis dissimilarities of the multivariate data (square-root transformed, 15 taxa)
Each test was done using 4999 permutations. The term used for the denominator mean square in each case is given in the column Fdenom
df SS MS F P (perm) P (MC) F denom Perm Units
Time = T 1 2550.81 2550.81Locations = L 2 9187.17 4593.59Cs 1 3630.00 3630.00 1.82 0.18 0.25 T £ Cs 4 T £ Cs CellsI-v-Cs 1 5557.17 5557.17 5.15 0.01 0.02 T £ L 6 T £ L CellsSite (L) = S(L) 6 2723.24 453.87 1.06 0.44 T £ S(L) 18 T £ S(L) CellsS(Cs) 4 1630.63 407.66 0.86 0.62 T £ S(Cs) 12 T £ S(Cs) CellsS(I) 2 1092.62 546.31 1.63 0.22 0.25 T £ S(I) 6 T £ S(I) CellsT £ L 2 2157.78 1078.89 2.53 0.03 T £ S(L) 18 T £ S(L) CellsT £ Cs 1 1989.74 1989.74 4.21 0.01 0.01 T £ S(Cs) 12 T £ S(Cs) CellsT £ I-v-Cs 1 168.05 168.05 0.08 0.97 0.97 T £ Cs 4 T £ Cs CellsT £ S(L) 6 2561.17 426.86 0.94 0.58 Residual 54 raw data unitsT £ S(Cs) 4 1890.38 472.60 1.12 0.33 Res Cs 36 raw data unitsT £ S(I) 2 670.79 335.39 0.64 0.81 Res I 18 raw data unitsResidual 36 16417.16 456.03Res Cs 24 10106.38 421.10Res I 12 6310.79 525.90Total 53
Table 5 SIMPER analyses to evaluate the contribution of thespecies to the diVerences observed between Cs and I
Species are ordered according to their contribution to determin-ing the diVerences. Cut-oV of contribution was done at 80%. �iindicates the contribution to the Bray-Curtis dissimilarity of theI-species averaged for I and the Cs. �i /SD(�i) indicated its ratiowith the standard deviation (SD). Macoma balthica I, II and IIIand Cerastoderma edule I, II represent diVerent size-classes 9seetext)
Taxon Cs I �i �i /SD(�i) �i %
Macoma balthica I 3.61 8.78 5.08 1.34 13.54Hydrobia ulvae 6.94 8.06 4.75 1.23 12.65Cerastoderma edule II 2.78 0.61 4.54 1.77 12.1Macoma balthica II 3.39 1.44 3.86 1.25 10.28Macoma balthica III 2.97 1.67 3.44 1.31 9.15Hediste diversicolor 4.22 4.44 3.31 1.34 8.82
Table 6 Asymmetrical analyses of variance testing for diVer-ences between impact (I) and the average of controls (Cs) onNDVI
Source df MS F P Fdenom
Time = T 1 0.411Locations = L 2 0.239Cs 1 0.269 13.71 0.02 Ti £ S(Cs)I-v-Cs 1 0.209 0.78 0.54 CsSite (L) = S(L) 6 0.006 0.44 0.83 Ti £ S(L)S(Cs) 4 0.003 0.16 0.95 Ti £ S(Cs)S(I) 2 0.011 15.71 0.06 Ti £ S(I)T £ L 2 0.001 0.08 0.93 Ti £ S(L)T £ Cs 1 0.002 0.09 0.78 Ti £ S(Cs)T £ I-v-Cs 1 0.000 0.02 0.91 Ti £ S(L)T £ S(L) 6 0.013 1.85 0.12 Plot (T £ S(L))T £ S(Cs) 4 0.020 2.48 0.07 Plot (T £ S(Cs)) T £ S(I) 2 0.001 0.04 0.97 Plot (T £ S(I))Plot (T £ S(L)) 36 0.007 2.25 0.00 ResidualPlot (T £ S(Cs)) 24 0.008 1.88 0.01 Res CsPlot (T £ S(I)) 12 0.006 4.83 0.00 Res IResidual 216 0.003Res Cs 144 0.004Res I 72 0.001Transformation NoneCochran’s C = 0.11C-Test P < 0.05Two tailed 3.50F-test 0.000
123
2088 Mar Biol (2007) 151:2077–2090
Trampling can damage directly the species, or pro-duce a mixed response when other biological and envi-ronmental variables are changed (indirect eVects,Keough and Quinn 1998). For instance, surface ani-mals with not-well developed structure for burial canbe killed by direct crashing or burial, which stop themmigrating to the surface fast enough to avoid asphyxia(Chandrasekara and Frid 1997). The cockles, whichnormally inhabit the top 2–3 cm of the sediment, wereprobably unable to escape even small depths of burialduring trampling. The sensitivity of cockles to burialwas also shown during laboratory tests that measuredan increase in mortality with increasing depth of burialand lethal eVects at a depth of 10 cm (Jackson andJames 1979; Chandrasekara and Frid 1997 and refer-ences therein). This, however, does not explain why wedid not detect any changes for the smallest cockles,which live at the same depth into the sediment or evenshallower. In this area, many benthic species, includingboth M. balthica and C. edule, have reproductive peri-ods between April and October (Rossi et al. 2004), andduring trampling larvae and juveniles would have beenpresent in the water column to replace those displacedby the trampling. This might determine fast recovery ofsmall cockles similarly to mobile animals (e.g. Hydro-bia ulvae and Hediste diversicolor in our study), whichrecolonise trampled areas and overcome the eVect ofburial very rapidly (Chandrasekara and Frid 1997).
The collapse of burrows is considered another directmechanism that kills animals living deep in the sedi-ment and feeding on the surface, such as ghost shrimps(Peterson 1977; Wynberg and Branch 1994, 1997;Contessa and Bird 2004). Likewise, the clam Macomabalthica lives to a depth of 10 cm and extrude thesiphon to feed at the surface-water interface (Rossiet al. 2004; Kamermans 1994). Thus, adult M. balthicawere probably killed because footsteps destroyed theirconnection with the surface. In addition, the clam is animportant prey for many aquatic birds and the verticalmixing of sediment could bring infauna to the sedimentsurface, exposing animals to predation (Chandrasekaraand Frid 1996). The increased variability in Arenicolaburrows might be also due to the disruption of part oftheir burrows by footsteps, but their heterogeneousdistribution over the mudXat rendered diYcult thedetection of clear-cut patterns.
The response of juvenile M. balthica cannot be,however, explained if only direct impact (damage byburial) was considered, even including the possibilityof fast recovery for juveniles. Adult cockles can out-compete larvae and spats of other bivalves and reducetheir settling and recruitment by disturbing the sedi-ment while feeding and moving or Wltrating planktonic
larvae (Andre and Rosenberg 1991; Kamermans et al.1992). This was also observed in the present mudXatduring another experiment, where there was adecrease in the numbers of M. balthica spats after adultcockles were transplanted into the sediment (Rossiet al. unpublished data). Additionally, it has beenlargely recognised that topographic heterogeneity canaVect the recruitment rate. Although the percentage ofdepressions was not increased by trampling, theseresults were not conclusive (see above) and this expla-nation cannot be excluded. Small depressions, likethose of footprints might have provided suitable micro-habitats for settlement and recruitment (Olafsson et al.1994; Herman et al. 1999).
Although we did not measure the time of recoveryfrom trampling, evidence suggests that after the directdamage, indirect eVects can increase the opportunitiesfor the populations of bivalves to recover, at least dur-ing the growing seasons. However, in this study onlyone species beneWted from the disturbance and in thelong-term the balance between Macoma balthica andCerastoderma edule might shift towards a dominance ofM. balthica in the macrofauna assemblage. As a conse-quence, there could be a change in ecosystem function-ing because these species can play important, yet distinctroles for the mudXat. Deposit-feeding of Macomabalthica can modify the biogeochemistry of the sedi-ments, while suspension feeding Cerastoderma edulecan aVect more the exchange of oxygen and nutrients atthe boundary layer, but has fewer eVects on the sedi-ment (Widdows et al. 1998, 2000). Therefore, the eVectsof trampling should be considered seriously for inter-tidal mudXats. Long-term, well-designed monitoringplans and manipulative experiments will quantify theimpact of this source of disturbance and its eVects onbiodiversity-ecosystem functioning relationship.
Acknowledgments The authors thank all the numerous gradu-ate students that helped in the Weld. This research was supportedby a Marco Polo grant (University of Bologna), by the KNAW’sNIOO-NIOZ cooperative research programme and PIONIERgrant from the Netherlands Organization for ScientiWc research.The project has been carried out in the framework of the Mar-BEF Network of Excellence ‘Marine Biodiversity and EcosystemFunctioning’ which is funded by the Sustainable Development,Global Change and Ecosystems Programme of the EuropeanCommunity’s Sixth Framework Programme (contract no.GOCE-CT-2003-505446). This publication is contribution num-ber MPS-06045 of MarBEF and number 3917 of the NIOO-KNAW.
References
Anderson MJ (2001) A new method for non-parametric multivar-iate analysis of variance. Aust Ecol 26:32–46
123
Mar Biol (2007) 151:2077–2090 2089
Anderson MJ (2003) PCO, principal coordinate analyses: a com-puter program. Department of Statistics, University ofAuckland, Auckland. Available at: http://www.stat.auckland.ac.nz/»mja/programs.htm
Anderson MJ (2004) DISTLM v.5: a FORTRAN computer pro-gram to calculate a distance-based multivariate analysis for alinear model. Department of Statistics, University of Auck-land, Auckland. Available at: http://www.stat.auckland.ac.nz/»mja/programs.htm
Anderson MJ (2005) PERMANOVA. Permutational multivari-ate analysis of variance. Department of Statistics, Universityof Auckland, Auckland. Available at: http://www.stat.auck-land.ac.nz/»mja/programs.htm
Andre C, Rosenberg R (1991) Adult-larval interactions in thesuspension-feeding bivalves Cerastoderma edule and Myaarenaria. Mar Ecol Prog Ser 71:227–234
Anderson MJ, ter Braak CJF (2003) Permutation tests formulti-factorial analysis of variance. J Statist Comp Sim73:85–113
Anderson MJ, Robinson J (2003) Generalized discriminant anal-ysis based on distances. Aust New Zeal J Stat 45:301–318
Brosnan DM, Crumrine LL (1994) EVects of human trampling onmarine rocky shore communities. J Exp Mar Biol Ecol177:79–97
Brown PJ, Taylor RB (1999) EVects of trampling by humans onanimals inhabiting coralline algal turf in the rocky intertidal.J Exp Mar Biol Ecol 235:45–53
Chandrasekara WU, Frid CLJ (1996) EVects of human tramplingon tidal Xat infauna. Aquat Conserv-Mar Freshw Ecosyst6:299–311
Chandrasekara WU, Frid CLJ (1997) A laboratory assessment ofthe survival and vertical movement of two epibenthic gastro-pod species, Hydrobia ulvae (Pennant) and Littorina littorea(Linnaeus), after burial in sediment. J Exp Mar Biol Ecol221:191–207
Clarke KR, Gorley N (2001) Primer v5: User manual/TutorialPRIMER-E, Plymouth
Contessa L, Bird FL (2004) The impact of bait-pumping on pop-ulations of the ghost shrimp Trypaea australiensis Dana(Decapoda: Callianassidae) and the sediment environment.J Exp Mar Biol Ecol 304:75–97
Cruz-Motta JJ, Underwood AJ, Chapman MG, Rossi F (2003)Benthic assemblages in sediments associated with intertidalboulder-Welds. J Exp Mar Biol Ecol 285:383–401
Davenport J, Davenport JL (2006) The impact of tourism andpersonal leisure transport on coastal environments: a review.Estuar Coast Shelf Sci 67:280–292
Eckrich CE, Holmquist JG (2000) Trampling in a seagrass assem-blage: direct eVects, response of associated fauna, and therole of substrate characteristics. Mar Ecol Prog Ser 201:199–209
Glasby TM (1997) Analysing data from post-impact studies usingasymmetrical analyses of variance: a case study of epibiotaon marinas. Aust J Ecol 22:448–459
Hawkins JP, Roberts CM (1993) EVects of recreational scuba div-ing on coral reefs- trampling on reef-Xat communities. J ApplEcol 30:25–30
Herman PMJ, Middelburg JJ, Van de Koppel JJ, Heip CHR(1999) Ecology of estuarine macrobenthos. Adv Ecol Res29:195–240
Jackson MJ, James R (1979) InXuence of bait digging on cockle,Cerastoderma edule, populations in North Norfolk. J ApplEcol 16:671–679
Kamermans P (1994) Similarity in food source and timing of feed-ing in deposit- and suspension-feeding bivalves. Mar EcolProg Ser 104:63–75
Kamermans P, Vanderveer HW, Karczmarski L, Doeglas GW(1992) Competition in deposit-feeding and suspension-feed-ing bivalves - experiments in controlled outdoor environ-ments. J Exp Mar Biol Ecol 162:113–135
Keough MJ, Quinn GP (1998) EVects of periodic disturbancesfrom trampling on rocky intertidal algal beds. Ecol Appl8:141–161
Kromkamp JC, Morris EP, Forster RM, Honeywill C, HagertheyS, Paterson DM (2006) Relationship of intertidal surfacesediment chlorophyll concentration to hyperspectral reXec-tance and chlorophyll Xuorescence. Estuaries Coasts29(2):183–196
Liddle MJ (1991) Recreation ecology - eVects of trampling onplants and corals. Trends Ecol Evol 6:13–17
Milazzo M, Badalamenti F, Riggio S, Chemello R (2004) Patternsof algal recovery and small-scale eVects of canopy removal asa result of human trampling on a Mediterranean rocky shal-low community. Biol Conserv 117:191–202
Olafsson E, Peterson C, Ambrose WJ (1994) Does recruitmentlimitation structure populations and communities of macro-invertebrates in marine soft sediments: the relative signiW-cance of pre- and post-settlement processes. Oceanog MarBiol Annu Rev 32:65–109
Peterson CH (1977) Competitive organization of soft-bottommacrobenthic communities of Southern-California lagoons.Mar Biol 43:343–359
Risgaard-Petersen N (2003) Coupled nitriWcation-denitriWcationin autotrophic and heterotrophic estuarine sediments: on theinXuence of benthic microalgae. Limnol Oceanog 48:93–105
Rossi F, Chapman MG (2003) InXuence of sediment on burrow-ing by the soldier crab Mictyris longicarpus Latreille. J ExpMar Biol Ecol 289:181–195
Rossi F, Herman PMJ, Middelburg JJ (2004) InterspeciWc andintraspeciWc variation of delta C-13 and delta N-15 in depos-it- and suspension-feeding bivalves (Macoma balthica andCerastoderma edule): evidence of ontogenetic changes infeeding mode of Macoma balthica. Limnol Oceanog 49:408–414
Schiel DR, Taylor DI (1999) EVects of trampling on a rocky inter-tidal algal assemblage in southern New Zealand. J Exp MarBiol Ecol 235:213–235
Sperazza M, Moore JN, Hendrix MS (2004) High-resolution par-ticle size analysis of naturally occurring very Wne-grainedsediment through laser diVractometry. J Sediment Res74:736–743
Sun D, Walsh D (1998) Review of studies on environmentalimpacts of recreation and tourism in Australia. J EnvironManage 53:323–338
Terlizzi A, Benedetti-Cecchi L, Bevilacqua S, Fraschetti S, Guid-etti P, Anderson MJ (2005) Multivariate and univariateasymmetrical analyses in environmental impact assessment:a case study of Mediterranean subtidal sessile assemblages.Mar Ecol Prog Ser 289:27–42
Underwood AJ (1992) Beyond BACI: the detection of environ-mental impacts on populations in the real, but variable,world. J Exp Mar Biol Ecol 161:145–178
Underwood AJ (1994) On Beyond BACI: sampling designs thatmight reliably detect environmental disturbances. Ecol Appl4:3–15
Underwood AJ, Peterson CH (1988) Towards an ecologicalframework for investigating pollution. Mar Ecol Prog Ser46:227–234
Widdows J, Brinsley MD, Salkeld PN, Elliott M (1998) Use ofannular Xumes to determine the inXuence of current velocityand bivalves on material Xux at the sediment-water interface.Estuaries 21:552–559
123

2090 Mar Biol (2007) 151:2077–2090
Widdows J, Brown S, Brinsley MD, Salkeld PN, Elliott M (2000)Temporal changes in intertidal sediment erodability: inXu-ence of biological and climatic factors. Cont Shelf Res20:1275–1289
Wynberg RP, Branch GM (1994) Disturbance associated withbait collection for Sandprawns (Callianassa kraussi) and
Mudprawns (Upogebia africana). Long-term eVects on thebiota of intertidal sandXats. J Mar Res 52:523–558
Wynberg RP, Branch GM (1997) Trampling associated with bait-collection for sandprawns Callianassa kraussi Stebbing:eVects on the biota of an intertidal sandXat. Environ Conserv24:139–148
123