human populations. geography 178: conservation of the environment preservation?preservation?...
TRANSCRIPT
Human Human PopulationsPopulations
Geography 178: Geography 178: Conservation of the EnvironmentConservation of the Environment
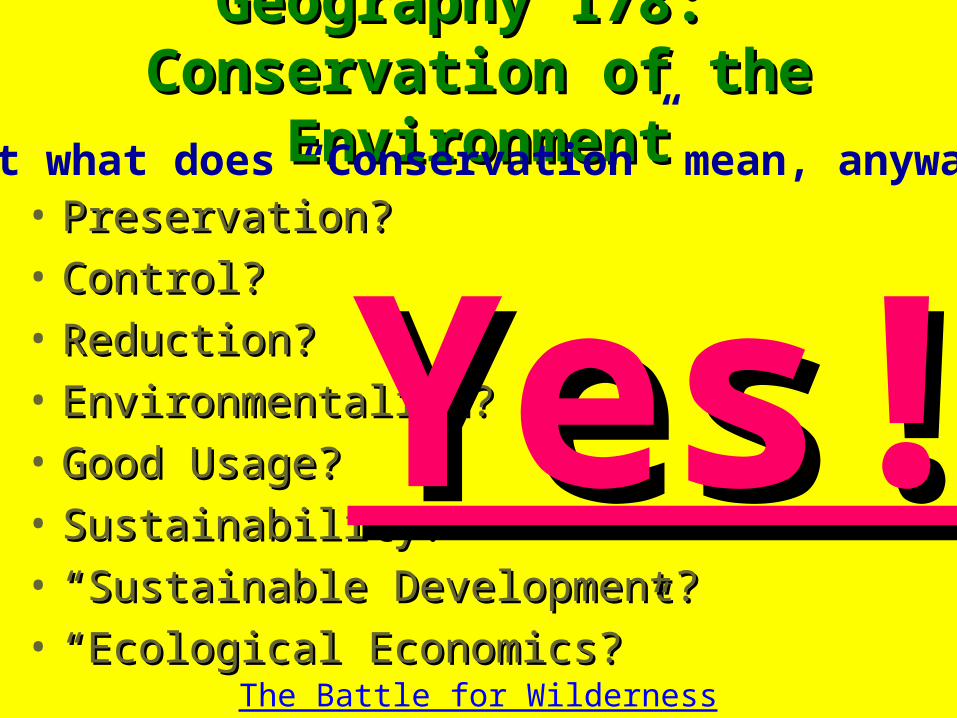
• Preservation?Preservation?
• Control?Control?
• Reduction?Reduction?
• Environmentalism?Environmentalism?
• Good Usage?Good Usage?
• Sustainability?Sustainability?
• ““Sustainable Development?”Sustainable Development?”
• ““Ecological Economics?”Ecological Economics?”
But what does “Conservation” mean, anyway?
Yes!Yes!The Battle for Wilderness
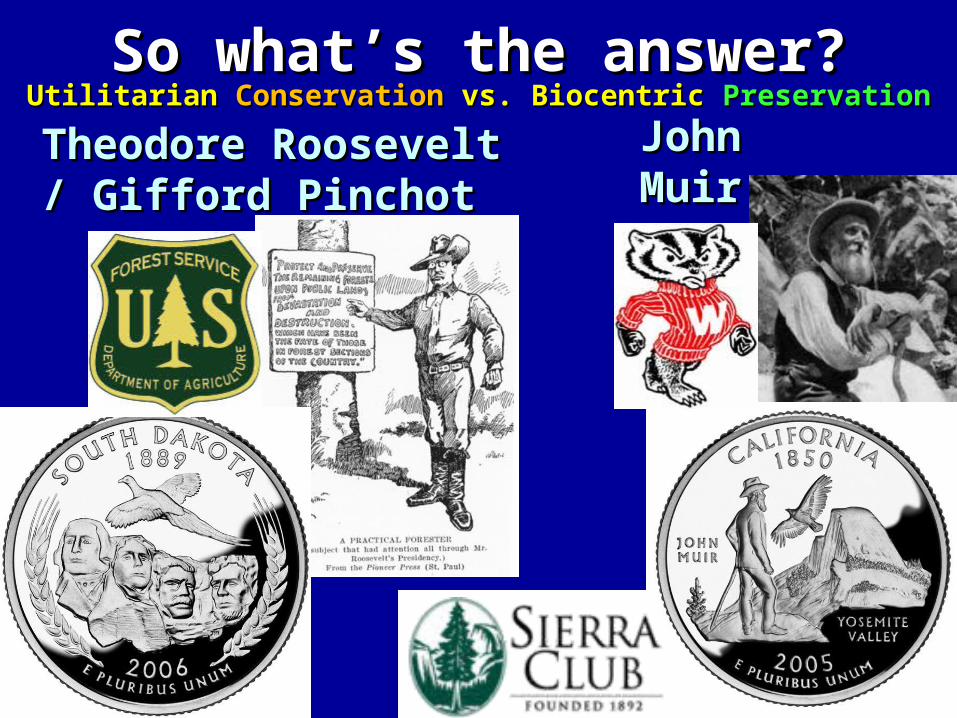
So what’s the answer?So what’s the answer?Utilitarian Utilitarian ConservationConservation vs. Biocentric vs. Biocentric PreservationPreservationTheodore Roosevelt / Theodore Roosevelt / Gifford PinchotGifford Pinchot
John John MuirMuir
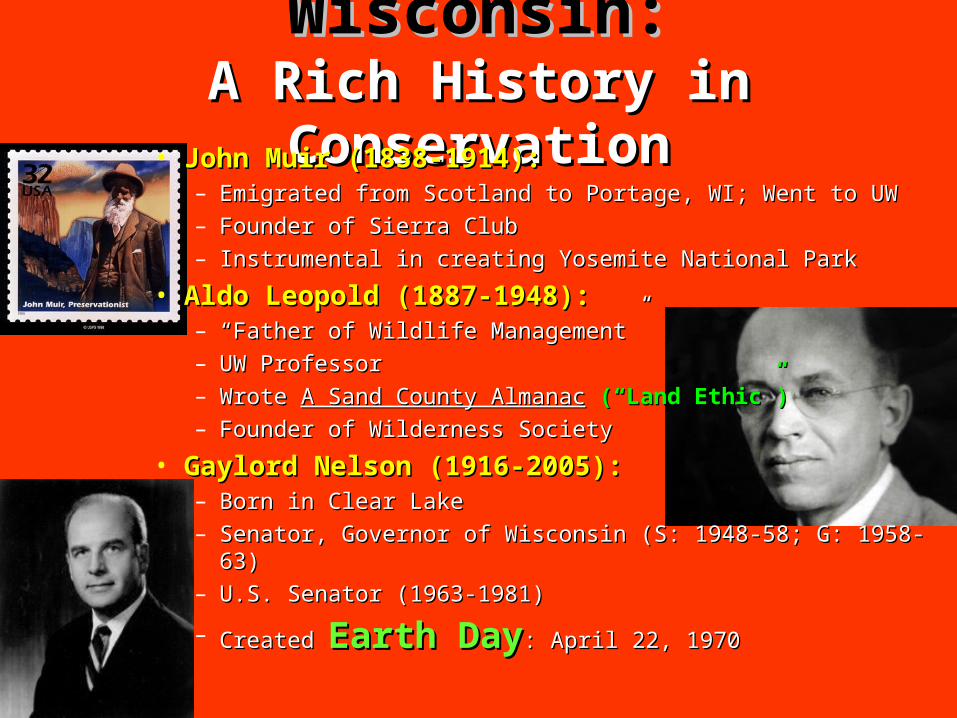
Wisconsin:Wisconsin:A Rich History in ConservationA Rich History in Conservation
• John Muir (1838-1914):John Muir (1838-1914):– Emigrated from Scotland to Portage, WI; Went to UWEmigrated from Scotland to Portage, WI; Went to UW– Founder of Sierra ClubFounder of Sierra Club– Instrumental in creating Yosemite National ParkInstrumental in creating Yosemite National Park
• Aldo Leopold (1887-1948): Aldo Leopold (1887-1948): – ““Father of Wildlife Management”Father of Wildlife Management”– UW ProfessorUW Professor– Wrote Wrote A Sand County AlmanacA Sand County Almanac (“Land Ethic”)(“Land Ethic”)– Founder of Wilderness SocietyFounder of Wilderness Society
• Gaylord Nelson (1916-2005): Gaylord Nelson (1916-2005): – Born in Clear LakeBorn in Clear Lake– Senator, Governor of Wisconsin (S: 1948-58; G: 1958-63)Senator, Governor of Wisconsin (S: 1948-58; G: 1958-63)– U.S. Senator (1963-1981)U.S. Senator (1963-1981)
– Created Created Earth DayEarth Day: April 22, 1970: April 22, 1970
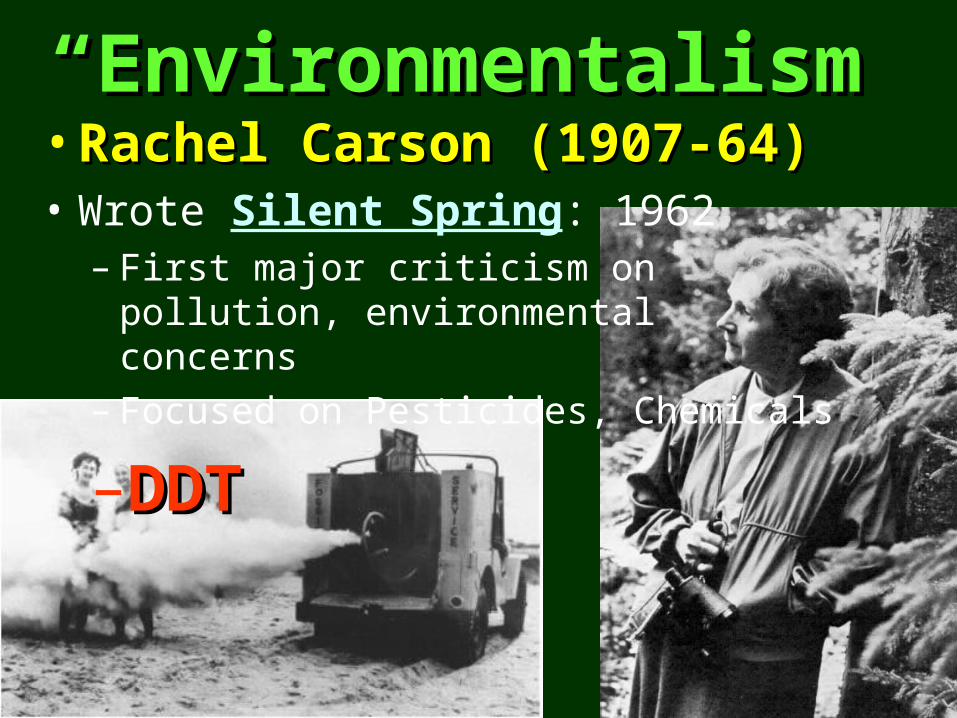
““Environmentalism”Environmentalism”• Rachel Carson (1907-64)Rachel Carson (1907-64) • Wrote Silent Spring: 1962
– First major criticism on pollution, environmental concerns
– Focused on Pesticides, Chemicals
–DDTDDT
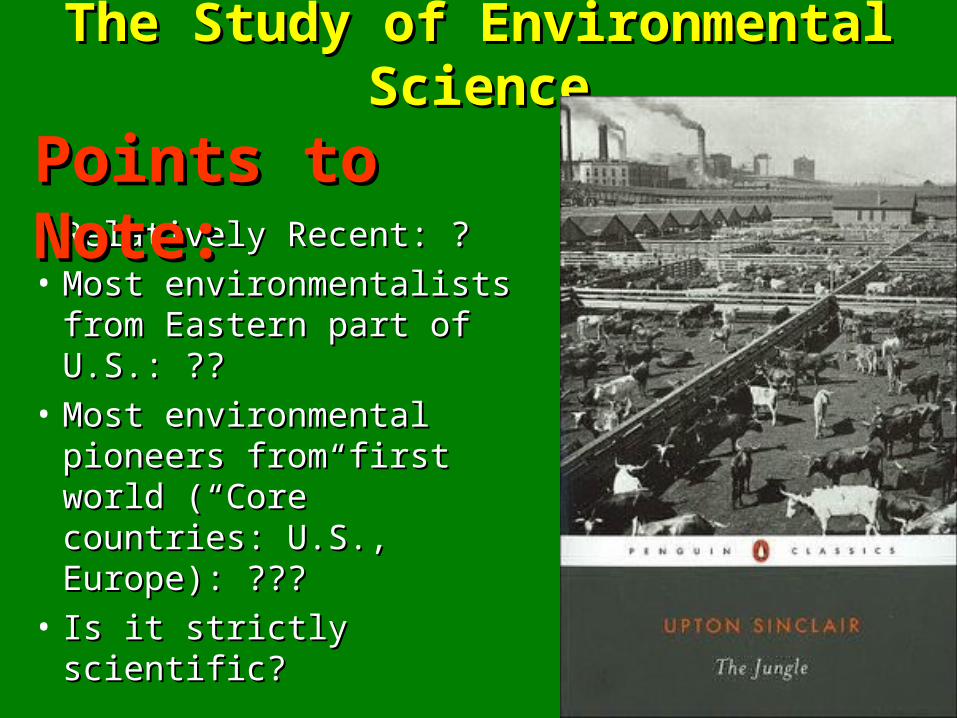
The Study of Environmental ScienceThe Study of Environmental Science
• Relatively Recent: ?Relatively Recent: ?
• Most environmentalists Most environmentalists from Eastern part of from Eastern part of U.S.: ??U.S.: ??
• Most environmental Most environmental pioneers from first world pioneers from first world (“Core” countries: U.S., (“Core” countries: U.S., Europe): ???Europe): ???
• Is it strictly scientific?Is it strictly scientific?
Points to Note:Points to Note:

Galileo
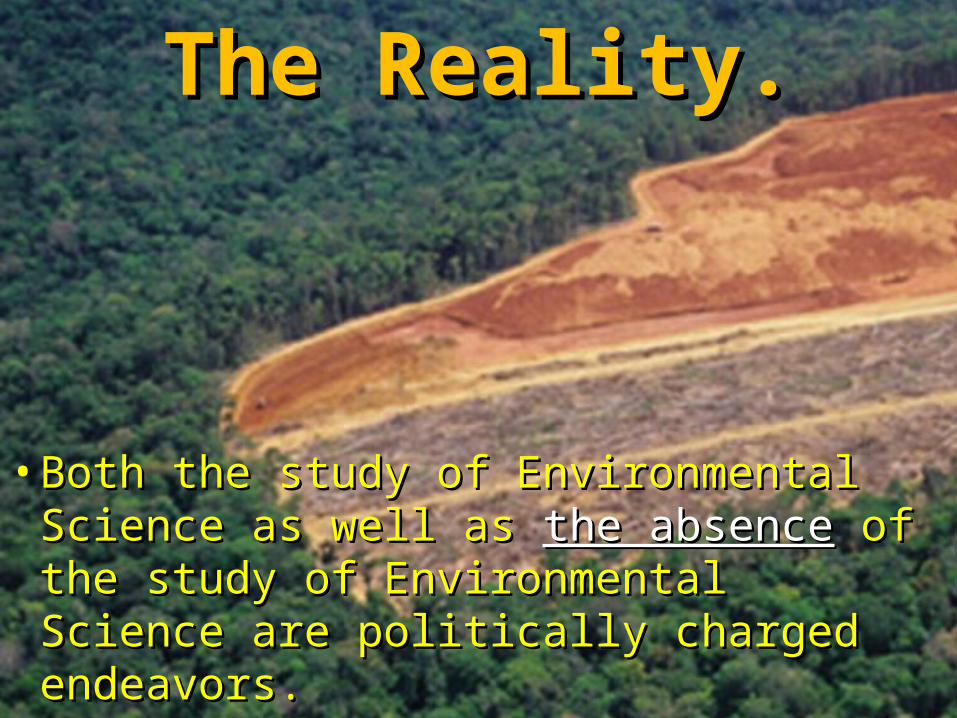
The Reality.The Reality.
• Both the study of Environmental Both the study of Environmental Science as well as Science as well as the absencethe absence of of the study of Environmental Science the study of Environmental Science are politically charged endeavors.are politically charged endeavors.
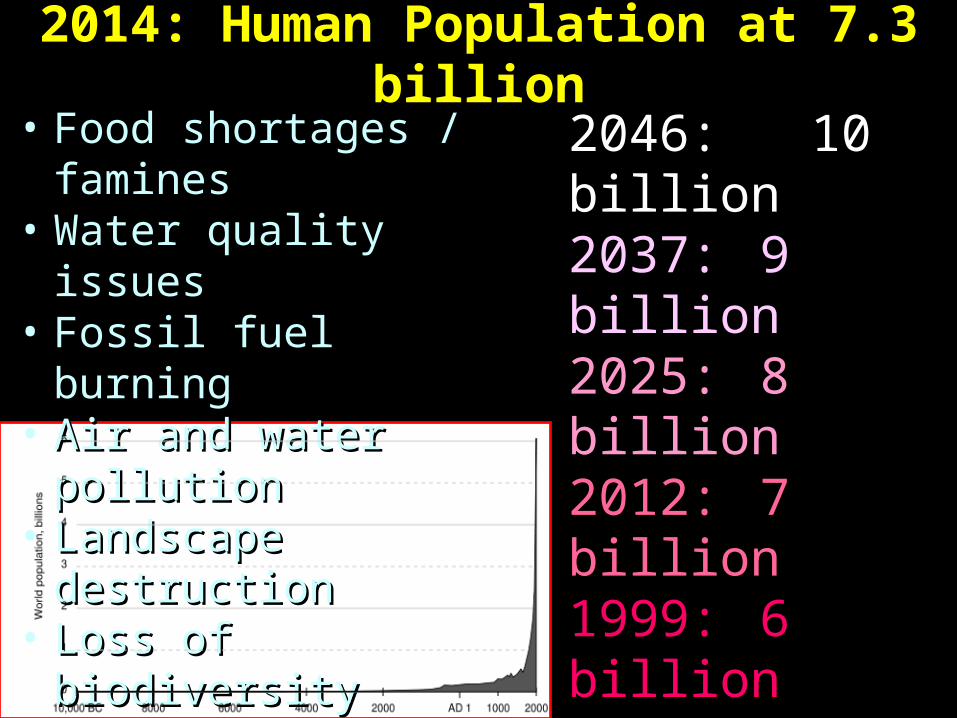
2014: Human Population at 7.3 billion2014: Human Population at 7.3 billion• Food shortages / Food shortages /
faminesfamines• Water quality issuesWater quality issues• Fossil fuel burningFossil fuel burning• Air and water pollutionAir and water pollution• Landscape destructionLandscape destruction• Loss of biodiversityLoss of biodiversity
2046: 10 billion2046: 10 billion2037:2037: 9 billion9 billion2025:2025: 8 billion8 billion2012:2012: 7 billion7 billion1999:1999: 6 billion6 billion 1987:1987: 5 billion5 billion 1974:1974: 4 billion4 billion 1960:1960: 3 billion3 billion1928:1928: 2 billion2 billion 1825:1825: 1 billion1 billion
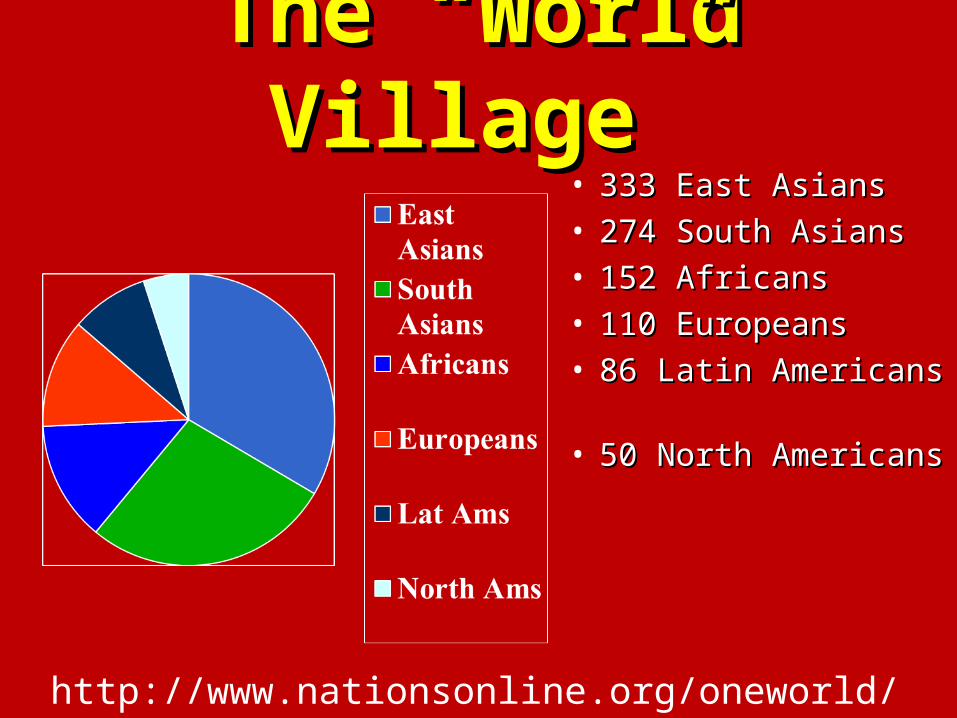
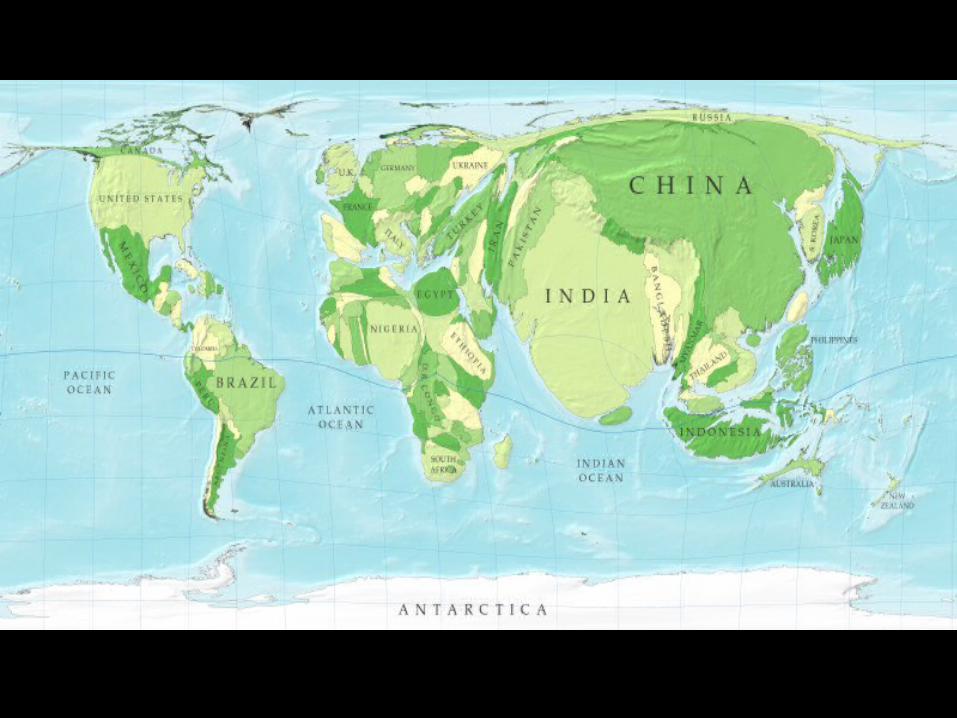
The “World Village”The “World Village”• 333 East Asians333 East Asians• 274 South Asians274 South Asians• 152 Africans152 Africans• 110 Europeans110 Europeans• 86 Latin Americans 86 Latin Americans • 50 North Americans50 North Americans
http://www.nationsonline.org/oneworld/global-village.htm
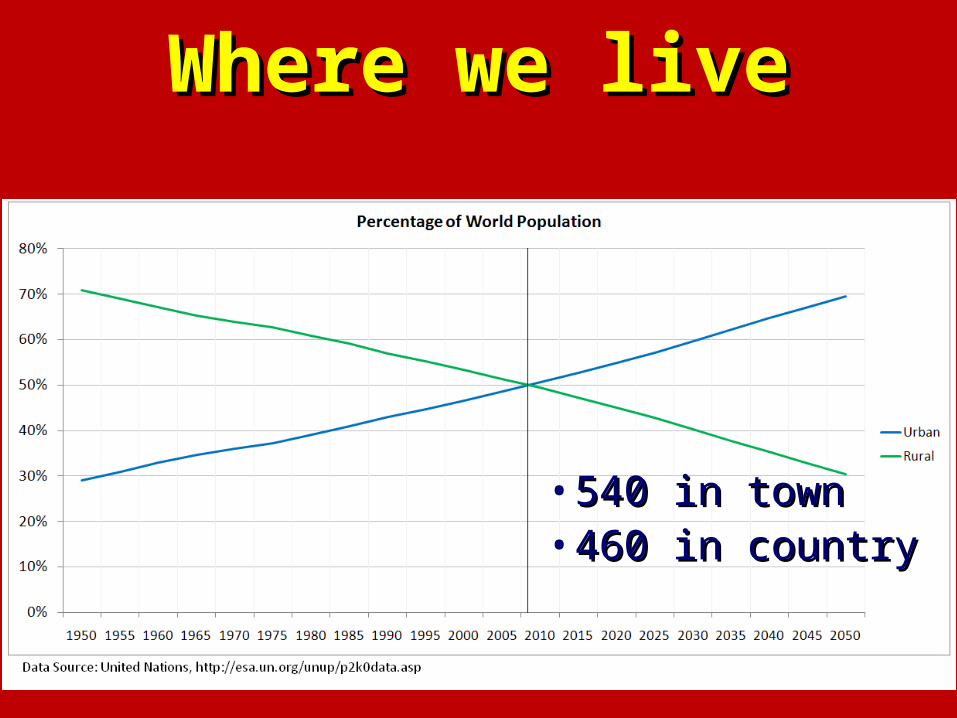
Where we liveWhere we live
• 540 in town540 in town• 460 in country460 in country
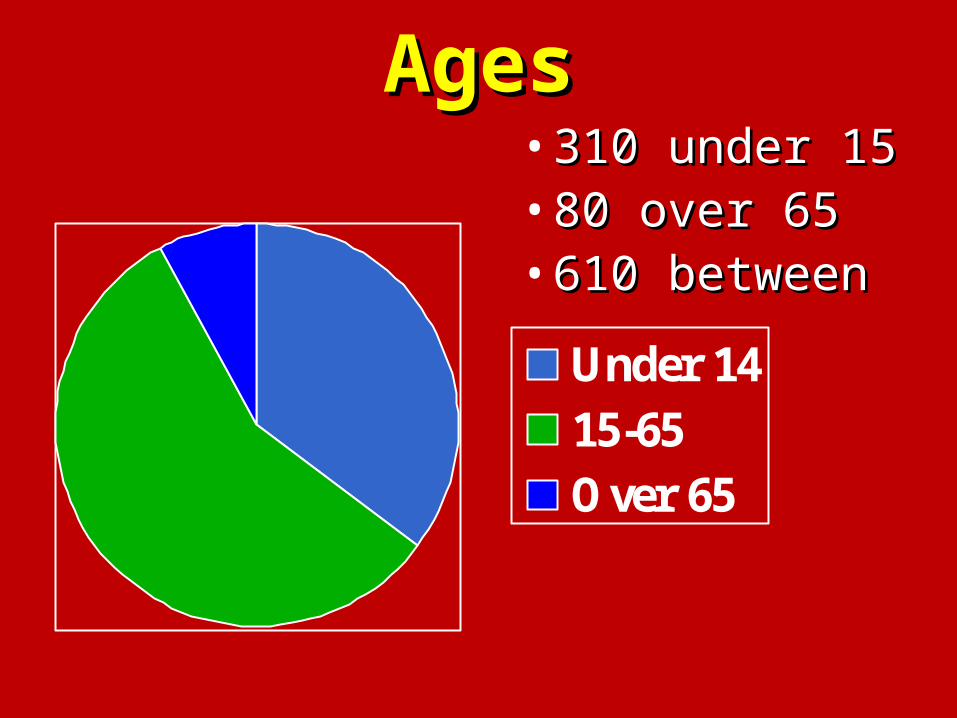
AgesAges
Under 1415-65Over 65
• 310 under 15310 under 15• 80 over 6580 over 65• 610 between610 between
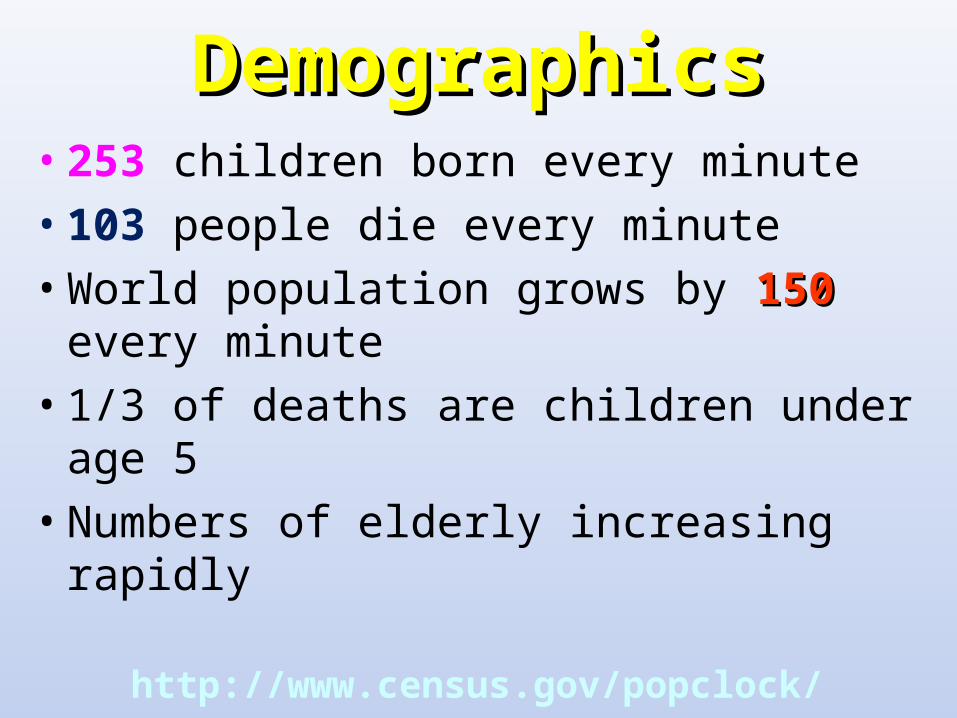
DemographicsDemographics• 253 children born every minute
• 103 people die every minute
• World population grows by 150150 every minute
• 1/3 of deaths are children under age 5
• Numbers of elderly increasing rapidly
http://www.census.gov/popclock/

Household IncomeHousehold Income
• 510 live in “poverty”510 live in “poverty”• 290 marginal290 marginal• 180 well-off180 well-off
Average annual Average annual income: income: $5,440$5,440
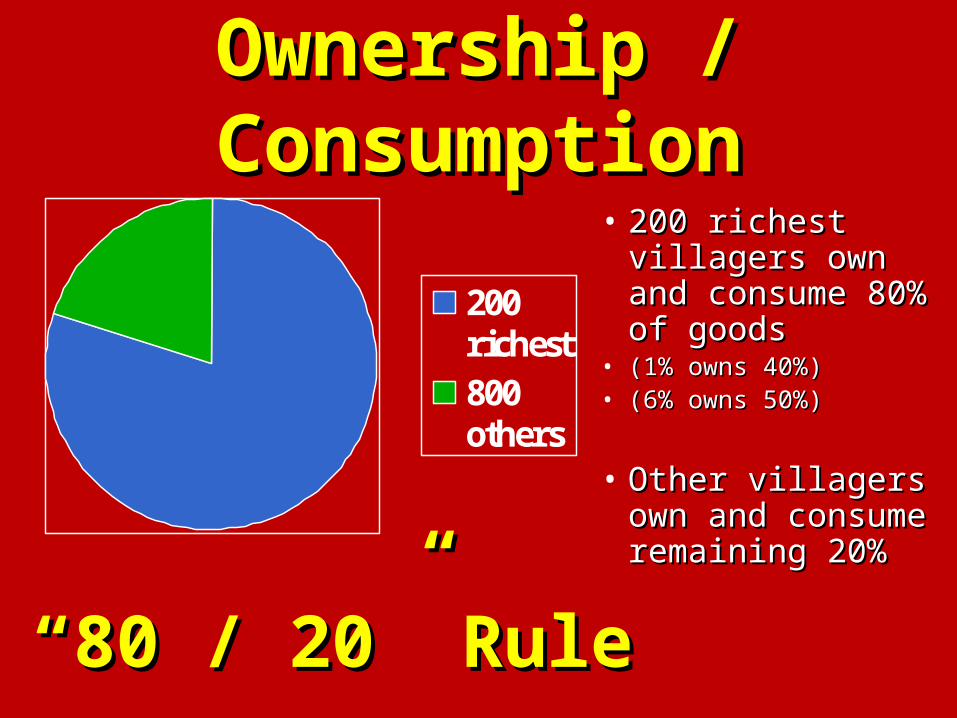
Ownership / Ownership / ConsumptionConsumption
200richest800others
• 200 richest 200 richest villagers own and villagers own and consume 80% of consume 80% of goodsgoods
• (1% owns 40%)(1% owns 40%)• (6% owns 50%) (6% owns 50%)
• Other villagers own Other villagers own and consume and consume remaining 20%remaining 20%
““80 / 20” Rule80 / 20” Rule
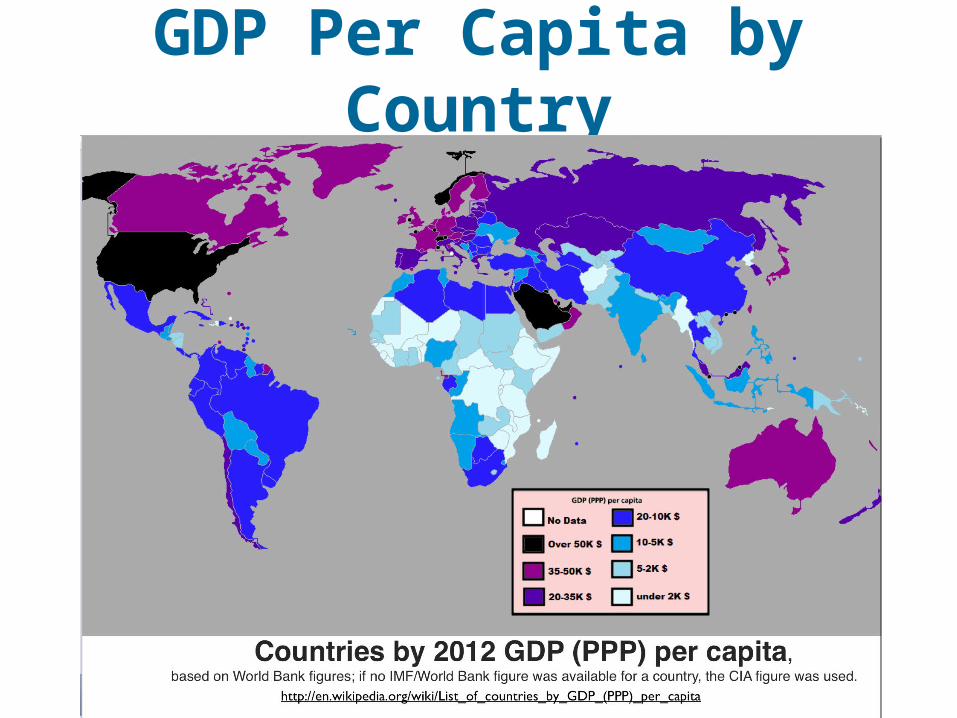
GDP Per Capita by Country
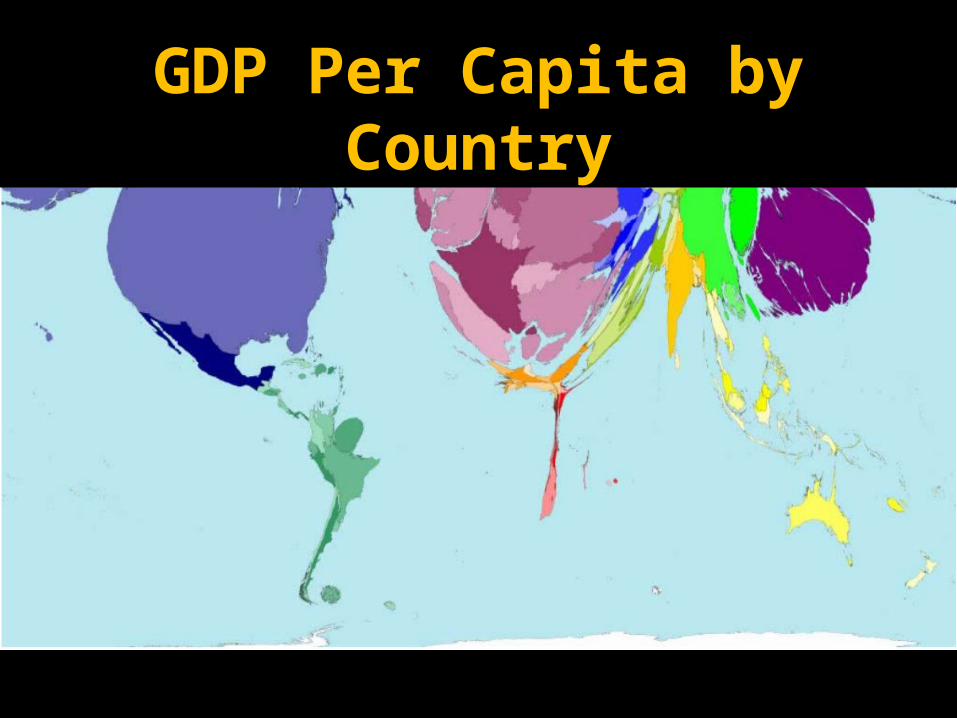
GDP Per Capita by Country
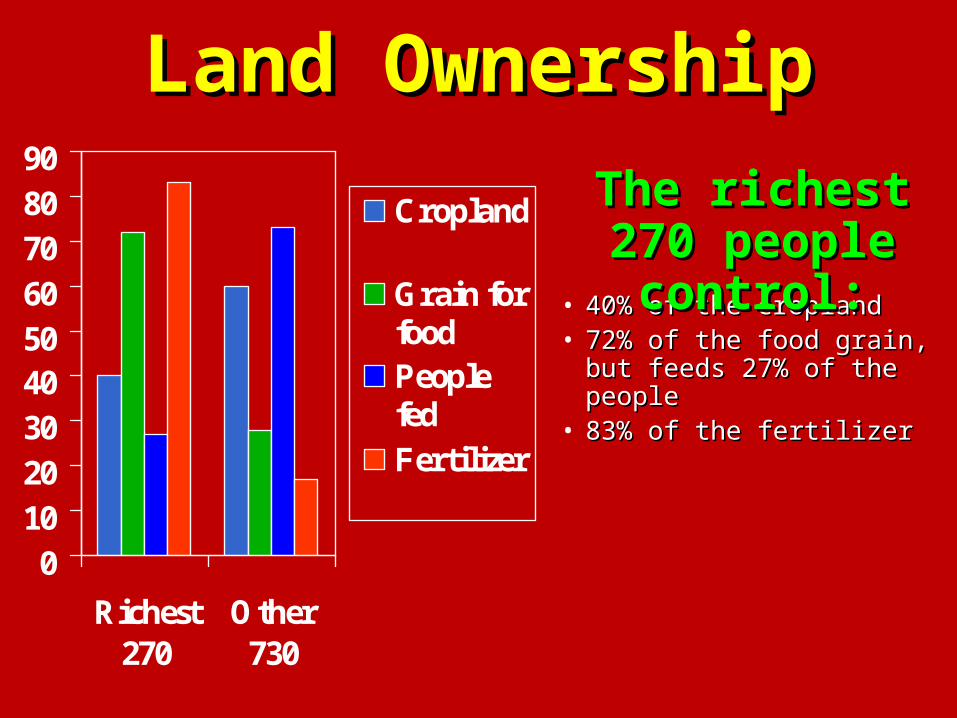
Land OwnershipLand Ownership
0102030405060708090
Richest270
Other730
Cropland
Grain forfoodPeoplefedFertilizer
• 40% of the cropland40% of the cropland• 72% of the food grain, but 72% of the food grain, but
feeds 27% of the peoplefeeds 27% of the people• 83% of the fertilizer83% of the fertilizer
The richest 270 The richest 270 people control:people control:
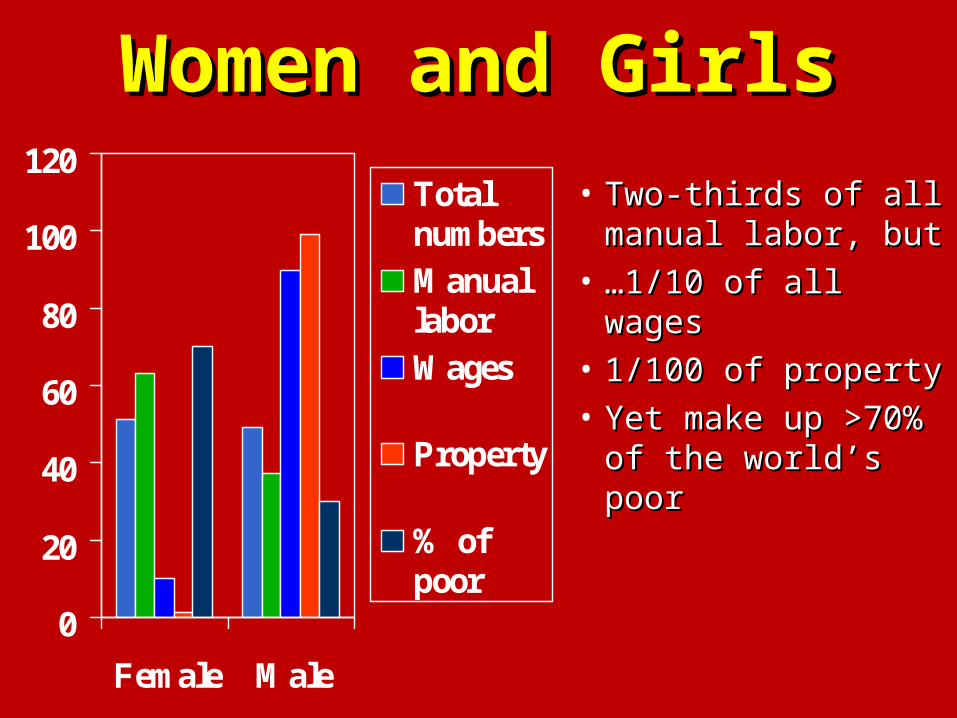
Women and GirlsWomen and Girls
0
20
40
60
80
100
120
Female Male
TotalnumbersManuallaborWages
Property
% ofpoor
• Two-thirds of all Two-thirds of all manual labor, butmanual labor, but
• ……1/10 of all 1/10 of all wageswages
• 1/100 of property1/100 of property• Yet make up Yet make up
>70% of the >70% of the world’s poorworld’s poor
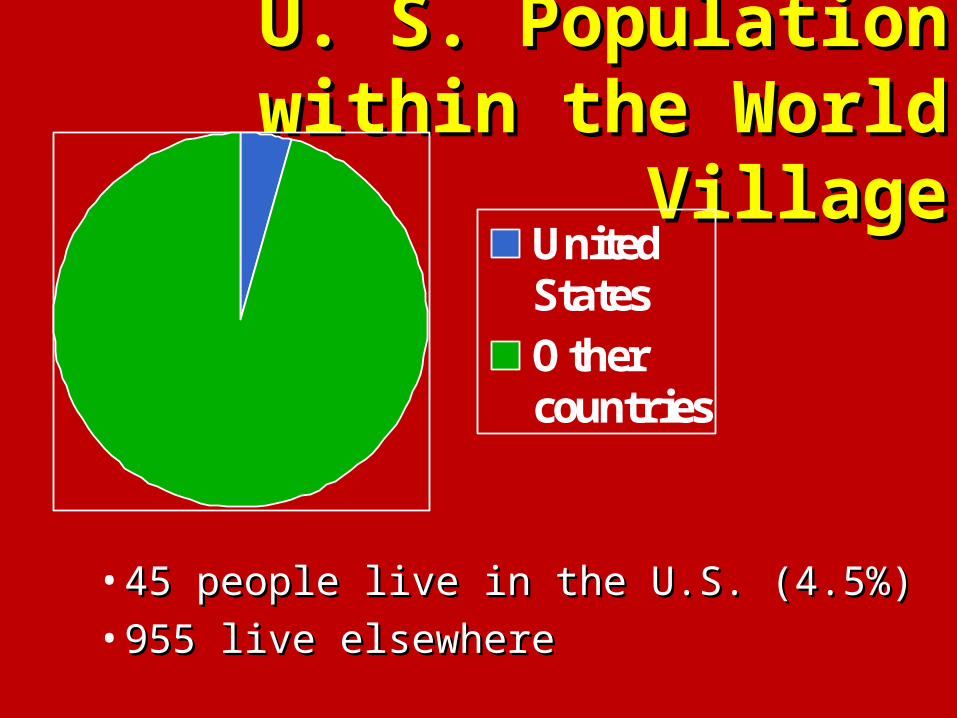
U. S. Population within the U. S. Population within the World VillageWorld Village
UnitedStatesOthercountries
• 45 people live in the U.S. (4.5%)45 people live in the U.S. (4.5%)• 955 live elsewhere955 live elsewhere
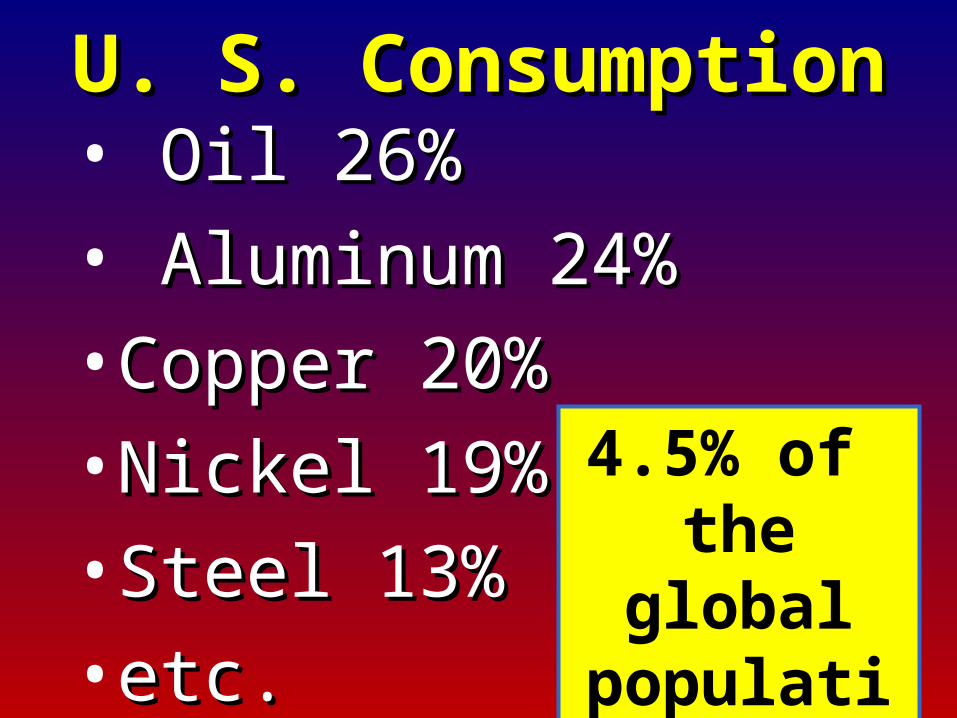
U. S. ConsumptionU. S. Consumption• Oil 26%Oil 26%
• Aluminum 24%Aluminum 24%
• Copper 20%Copper 20%
• Nickel 19%Nickel 19%
• Steel 13%Steel 13%
• etc.etc.
4.5% of the global population
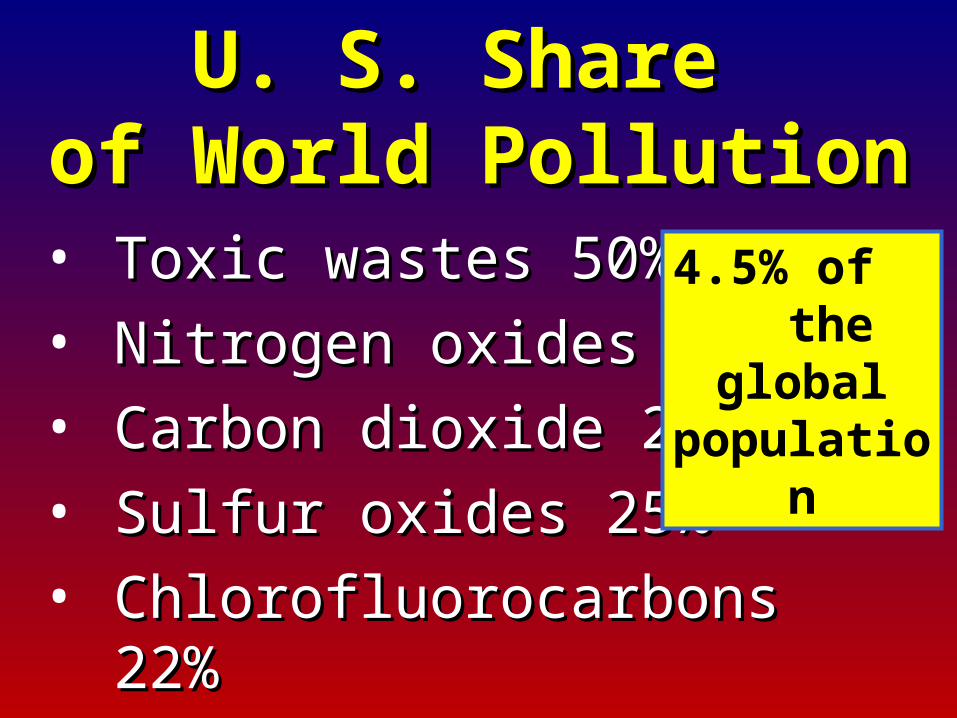
U. S. Share U. S. Share of World Pollutionof World Pollution
• Toxic wastes 50%Toxic wastes 50%
• Nitrogen oxides 26%Nitrogen oxides 26%
• Carbon dioxide 26%Carbon dioxide 26%
• Sulfur oxides 25%Sulfur oxides 25%
• Chlorofluorocarbons 22%Chlorofluorocarbons 22%
4.5% of the global population
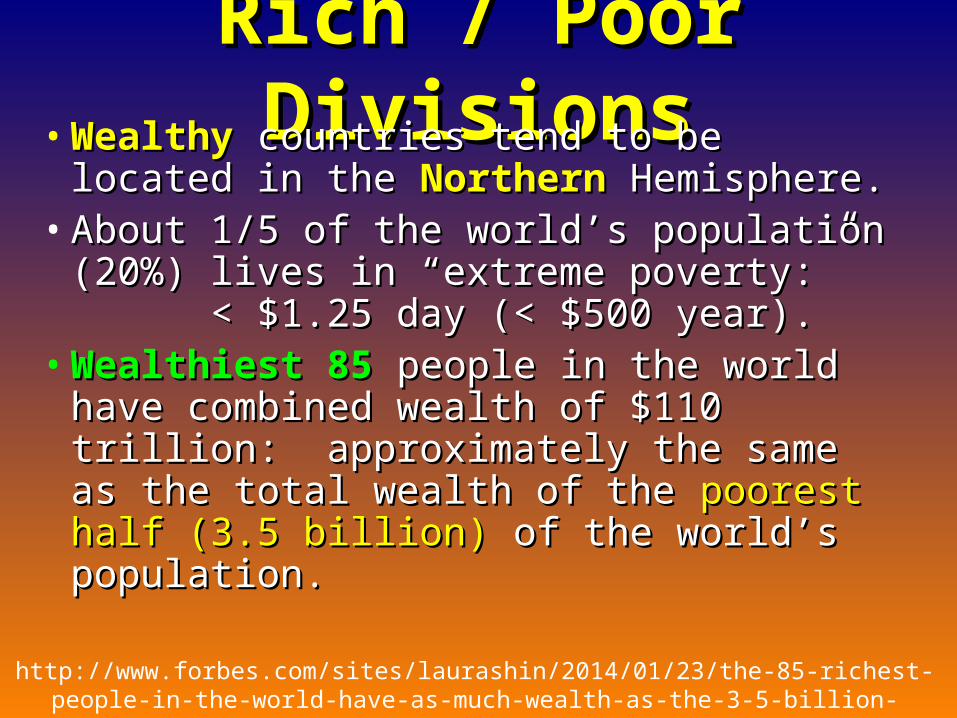
Rich / Poor DivisionsRich / Poor Divisions• WealthyWealthy countries tend to be located countries tend to be located
in the in the NorthernNorthern Hemisphere. Hemisphere.• About 1/5 of the world’s population About 1/5 of the world’s population
(20%) lives in “extreme poverty:” (20%) lives in “extreme poverty:” < $1.25 day (< $500 year).< $1.25 day (< $500 year).
• Wealthiest 85Wealthiest 85 people in the world people in the world have combined wealth of $110 trillion: have combined wealth of $110 trillion: approximately the same as the total approximately the same as the total wealth of the wealth of the poorest half (3.5 billion)poorest half (3.5 billion) of the world’s population.of the world’s population.
http://www.forbes.com/sites/laurashin/2014/01/23/the-85-richest-people-in-the-world-have-as-much-wealth-as-the-3-5-billion-poorest/
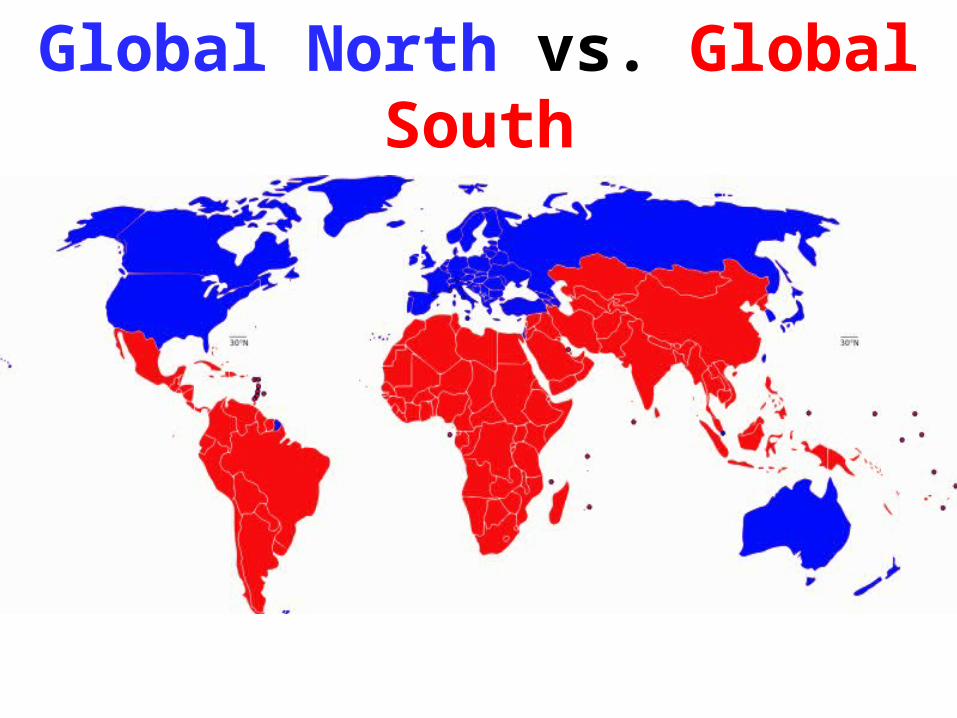
Global North vs. Global South
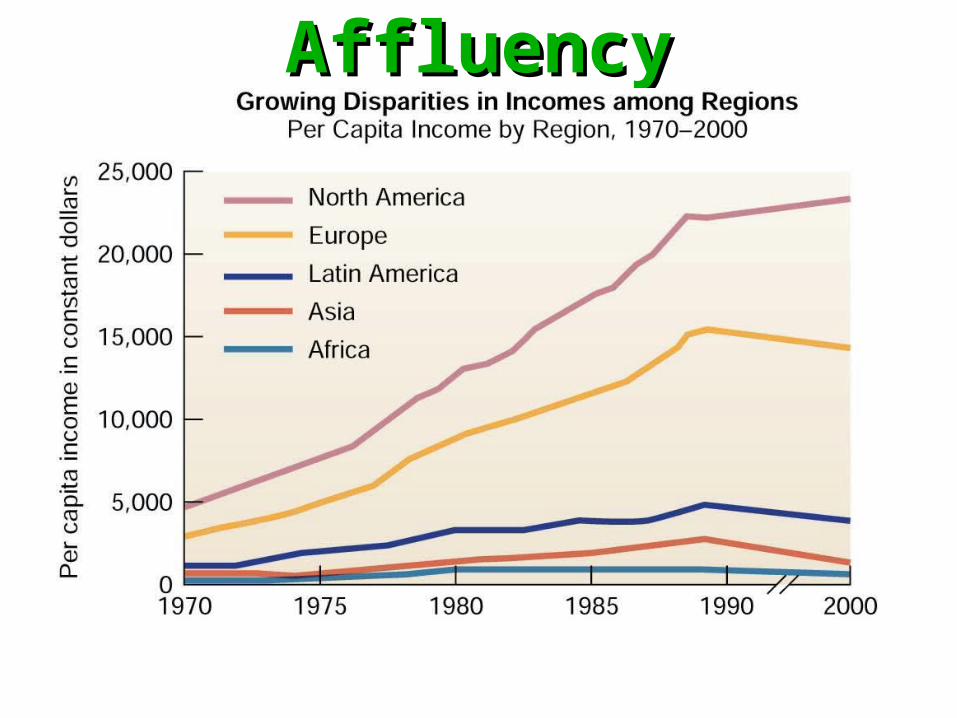
AffluencyAffluency

World divisions:World divisions:Late 20th century
• First World (“North”)First World (“North”) - Industrialized capitalist - Industrialized capitalist countries of Western Europe, North America.countries of Western Europe, North America.
• Second World Second World - Centrally-planned “socialist” - Centrally-planned “socialist” countries such as former Soviet Union.countries such as former Soviet Union.
• Third World (“South”)Third World (“South”) - Ex-colonial nations such - Ex-colonial nations such as India, Malaysia, Iran, Brazil, Congo, etc.as India, Malaysia, Iran, Brazil, Congo, etc.
• Fourth World (“South”)Fourth World (“South”) - Poorest nations - Poorest nations including indigenous communitiesincluding indigenous communities
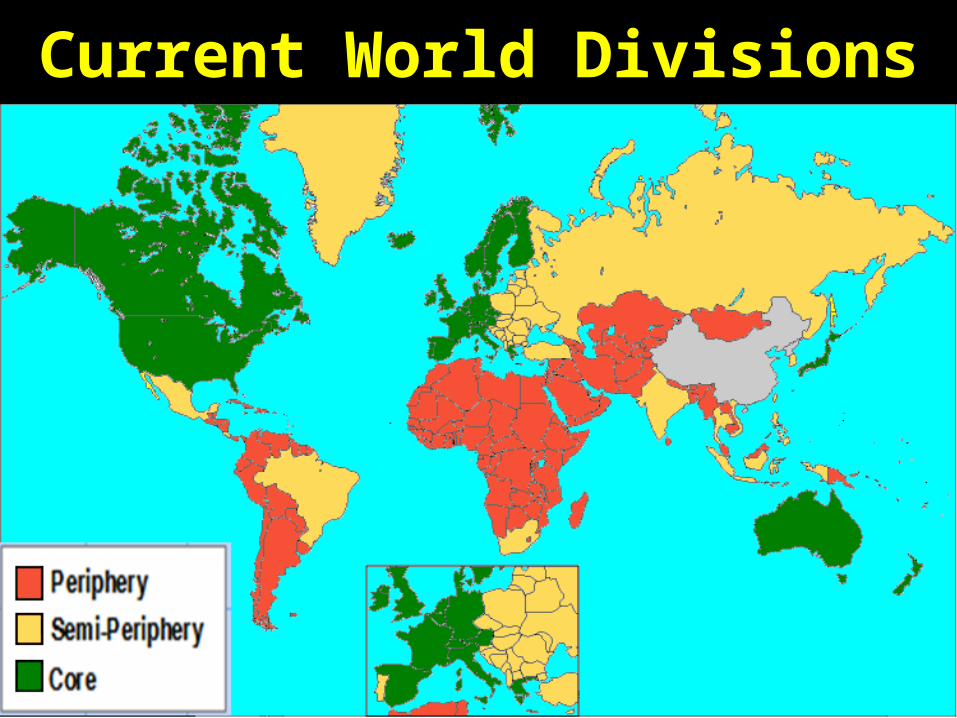
Current World DivisionsCurrent World Divisions
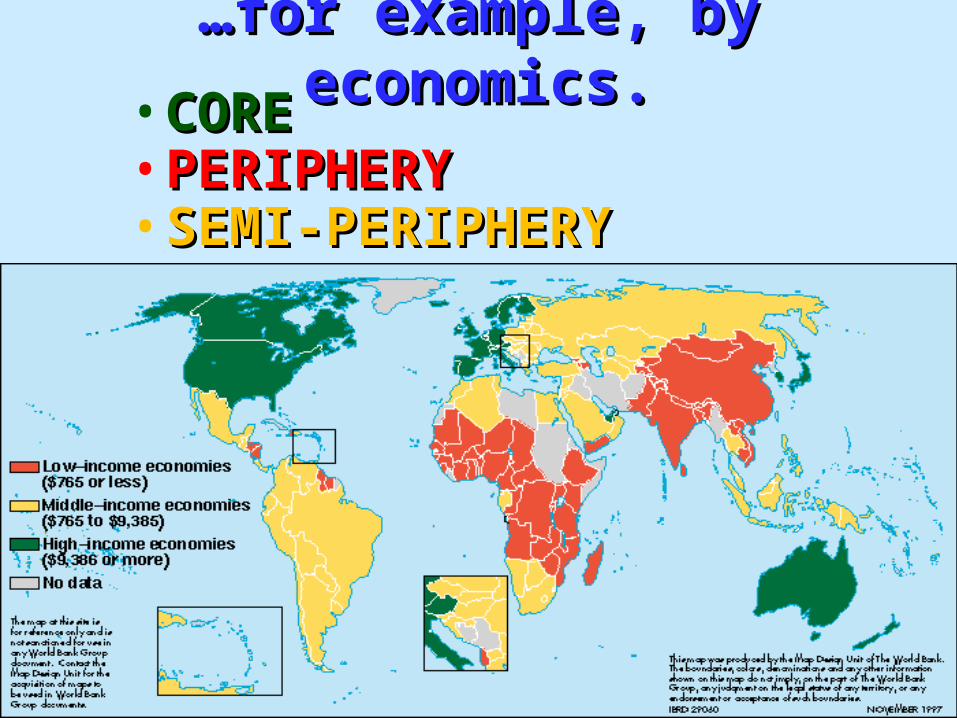
……for example, by economics.for example, by economics.• CORECORE• PERIPHERY PERIPHERY • SEMI-PERIPHERYSEMI-PERIPHERY
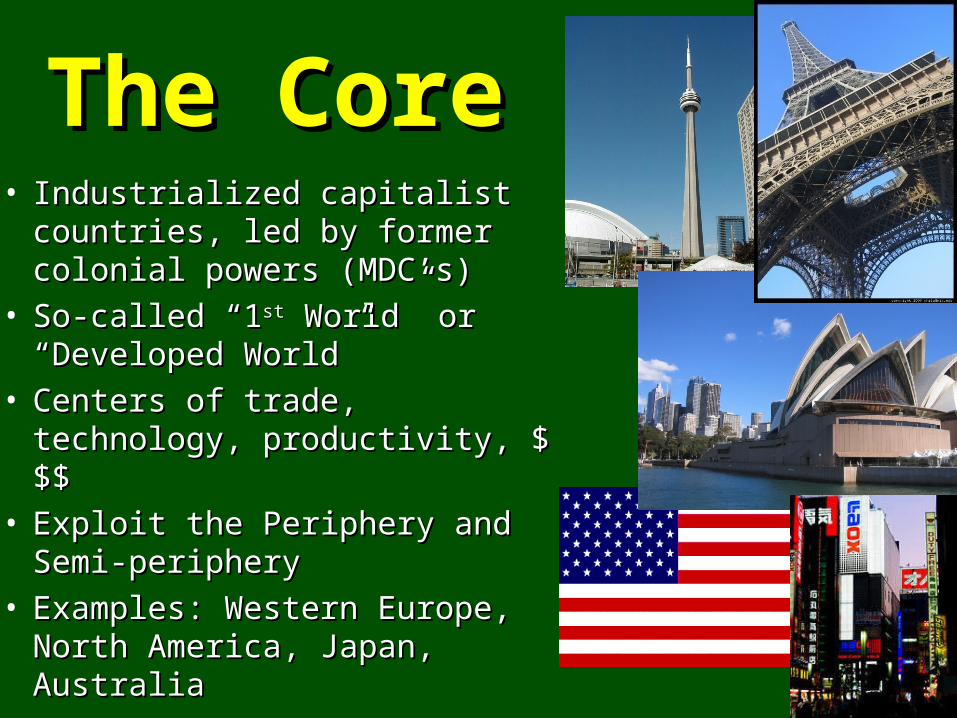
The CoreThe Core• Industrialized capitalist Industrialized capitalist
countries, led by former colonial countries, led by former colonial powers (MDC’s)powers (MDC’s)
• So-called “1So-called “1stst World” or World” or “Developed World”“Developed World”
• Centers of trade, technology, Centers of trade, technology, productivity, $$$ productivity, $$$
• Exploit the Periphery and Semi-Exploit the Periphery and Semi-periphery periphery
• Examples: Western Europe, Examples: Western Europe, North America, Japan, AustraliaNorth America, Japan, Australia
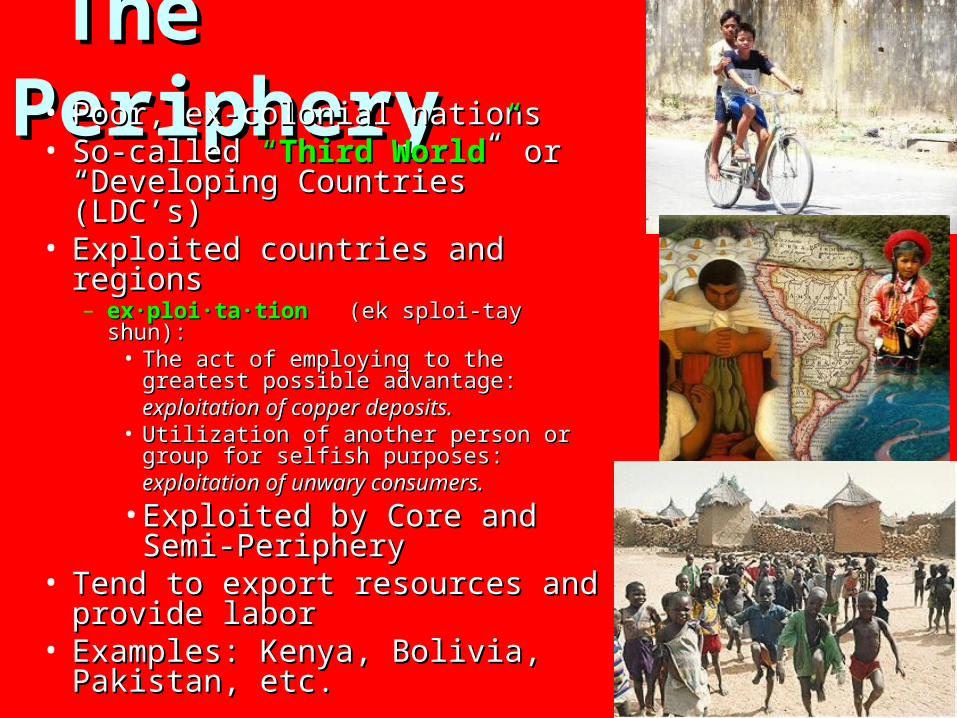
The PeripheryThe Periphery• Poor, ex-colonial nationsPoor, ex-colonial nations• So-called So-called ““Third WorldThird World” ” or or
“Developing Countries” (LDC’s)“Developing Countries” (LDC’s)• Exploited countries and regionsExploited countries and regions
– ex·ploi·ta·tion ex·ploi·ta·tion (ek sploi-tay shun): (ek sploi-tay shun): • The act of employing to the greatest The act of employing to the greatest
possible advantage: possible advantage: exploitation of copper deposits.exploitation of copper deposits.
• Utilization of another person or group Utilization of another person or group for selfish purposes: for selfish purposes: exploitation of unwary consumers.exploitation of unwary consumers.
• Exploited by Core and Exploited by Core and Semi-PeripherySemi-Periphery
• Tend to export resources and Tend to export resources and provide laborprovide labor
• Examples: Kenya, Bolivia, Examples: Kenya, Bolivia, Pakistan, etc.Pakistan, etc.
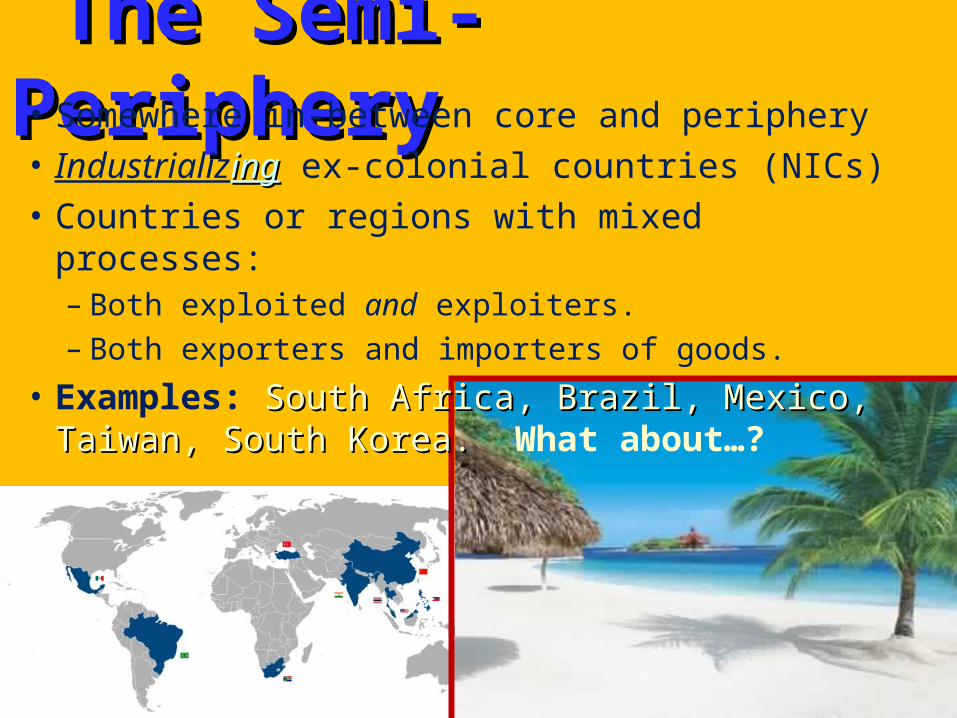
The Semi-PeripheryThe Semi-Periphery• Somewhere in-between core and periphery
• Industrializinging ex-colonial countries (NICs)
• Countries or regions with mixed processes:– Both exploited and exploiters.– Both exporters and importers of goods.
• Examples: South Africa, Brazil, Mexico, South Africa, Brazil, Mexico, Taiwan, South Korea.Taiwan, South Korea. What about…?
Environmental ChallengesEnvironmental Challenges• Core countries Core countries exploitexploit natural resources (including natural resources (including
labor) in poor countries (often through multinational labor) in poor countries (often through multinational corporations and governmental agreements).corporations and governmental agreements).
• Elites in periphery countries Elites in periphery countries often cooperate withoften cooperate with wealthy countries and the interests of the wealthy.wealthy countries and the interests of the wealthy.
• Poor Poor exploitexploit natural resources, because socio- natural resources, because socio-economic conditions (dictated by rich countries and economic conditions (dictated by rich countries and domestic elites) create a struggle for survival.domestic elites) create a struggle for survival.
• ““Golden Rule”Golden Rule” Economics / Environmental Policies Economics / Environmental Policies
Population StatisticsPopulation Statistics (Demographics)(Demographics)
• PopulationsPopulations
• Characteristics of PopulationsCharacteristics of Populations
• Distribution of PopulationsDistribution of Populations
• Categorizing of PopulationsCategorizing of Populations
• And a Whole Lot More!!And a Whole Lot More!!
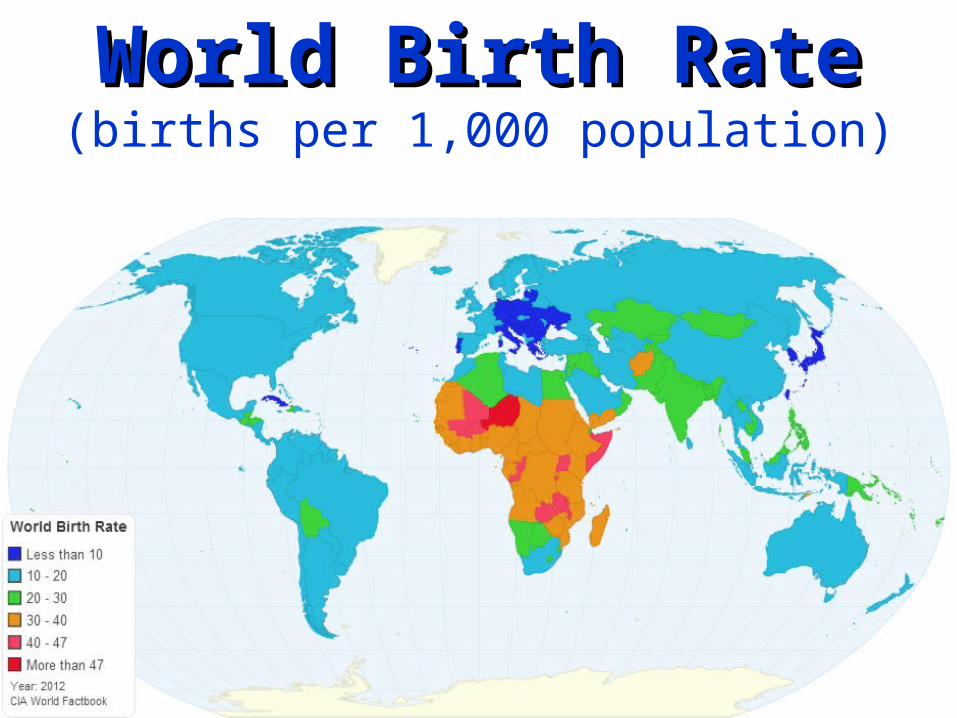
World Birth RateWorld Birth Rate(births per 1,000 population)
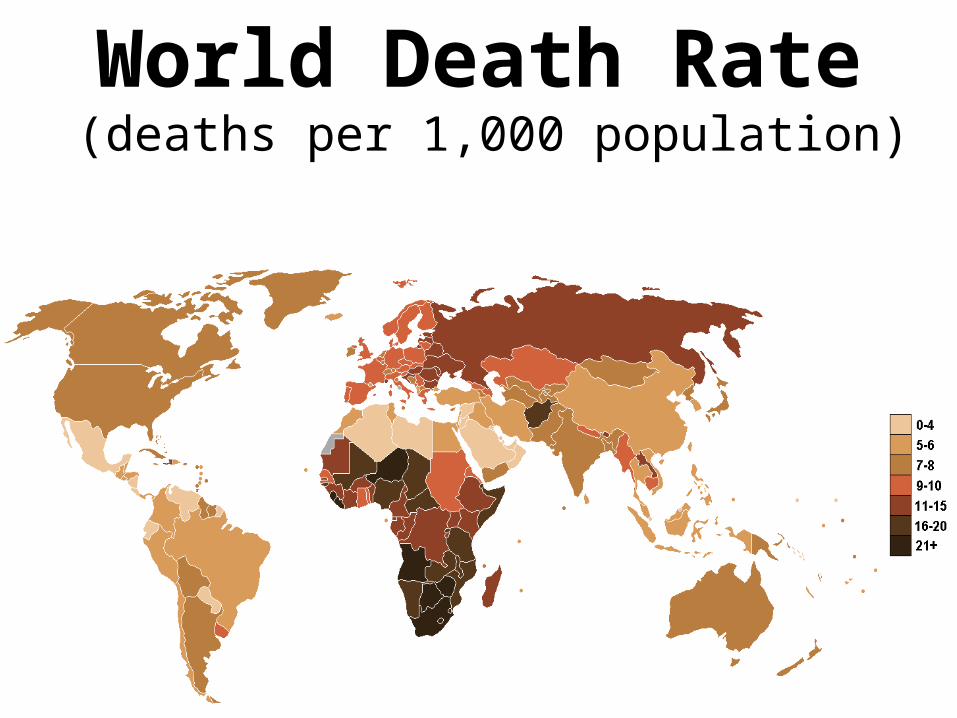
World Death Rate (deaths per 1,000 population)
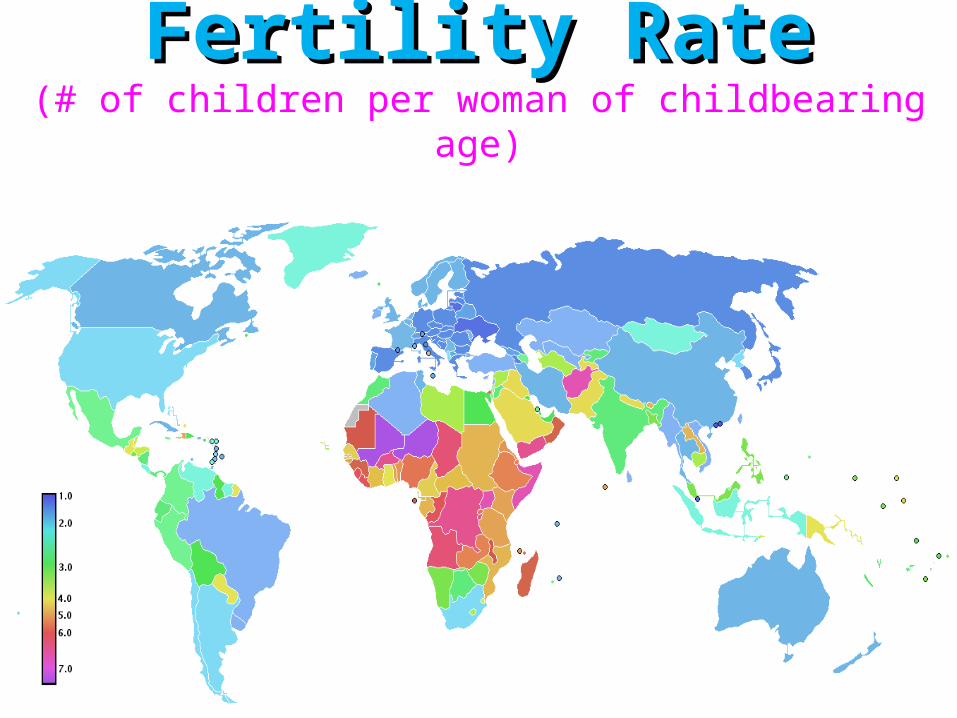
Fertility RateFertility Rate(# of children per woman of childbearing age)
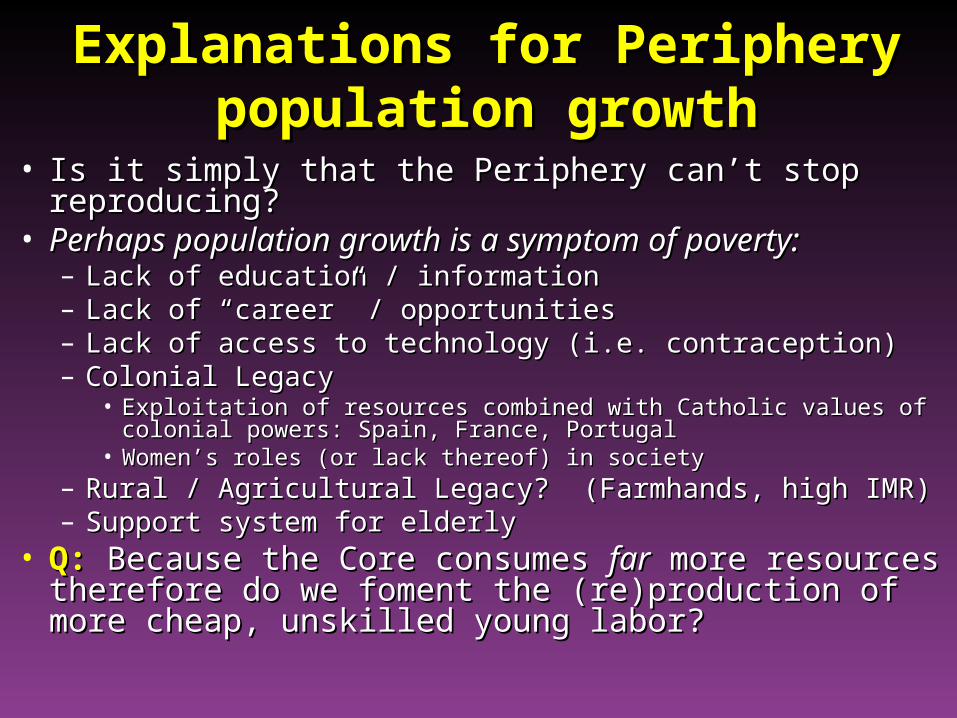
Explanations for Periphery Explanations for Periphery population growthpopulation growth
• Is it simply that the Periphery can’t stop reproducing?Is it simply that the Periphery can’t stop reproducing?• Perhaps population growth is a symptom of poverty:Perhaps population growth is a symptom of poverty:
– Lack of education / informationLack of education / information– Lack of “career” / opportunities Lack of “career” / opportunities – Lack of access to technology (i.e. contraception)Lack of access to technology (i.e. contraception)– Colonial Legacy Colonial Legacy
• Exploitation of resources combined with Catholic values of colonial Exploitation of resources combined with Catholic values of colonial powers: Spain, France, Portugalpowers: Spain, France, Portugal
• Women’s roles (or lack thereof) in societyWomen’s roles (or lack thereof) in society– Rural / Agricultural Legacy? (Farmhands, high IMR)Rural / Agricultural Legacy? (Farmhands, high IMR)– Support system for elderlySupport system for elderly
• Q:Q: Because the Core consumes Because the Core consumes farfar more resources more resources therefore do we foment the (re)production of more therefore do we foment the (re)production of more cheap, unskilled young labor?cheap, unskilled young labor?
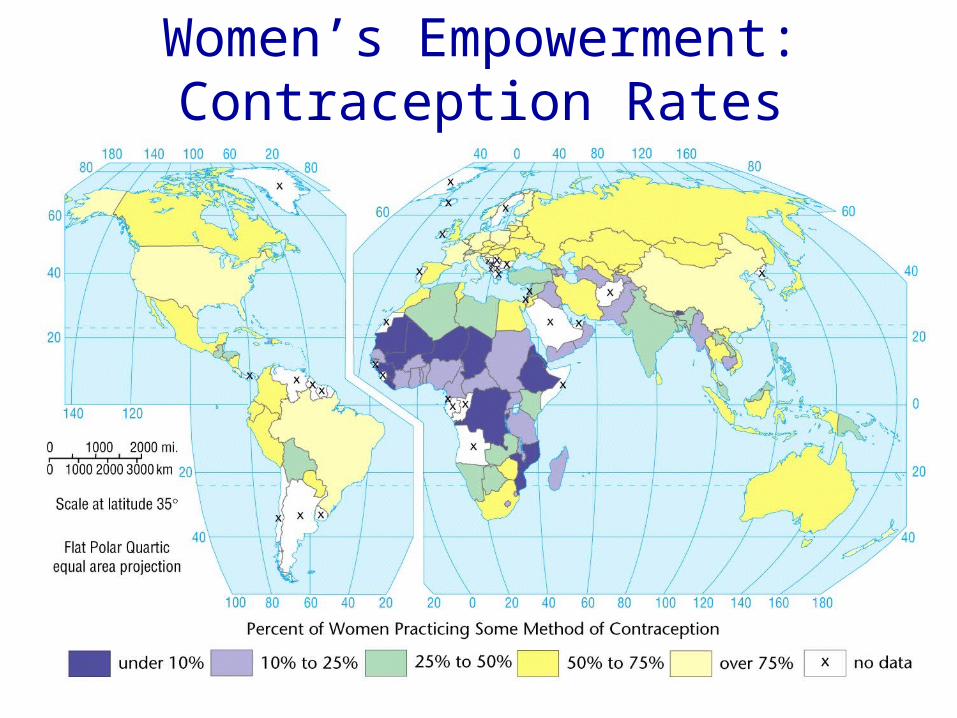
Women’s Empowerment:Contraception Rates
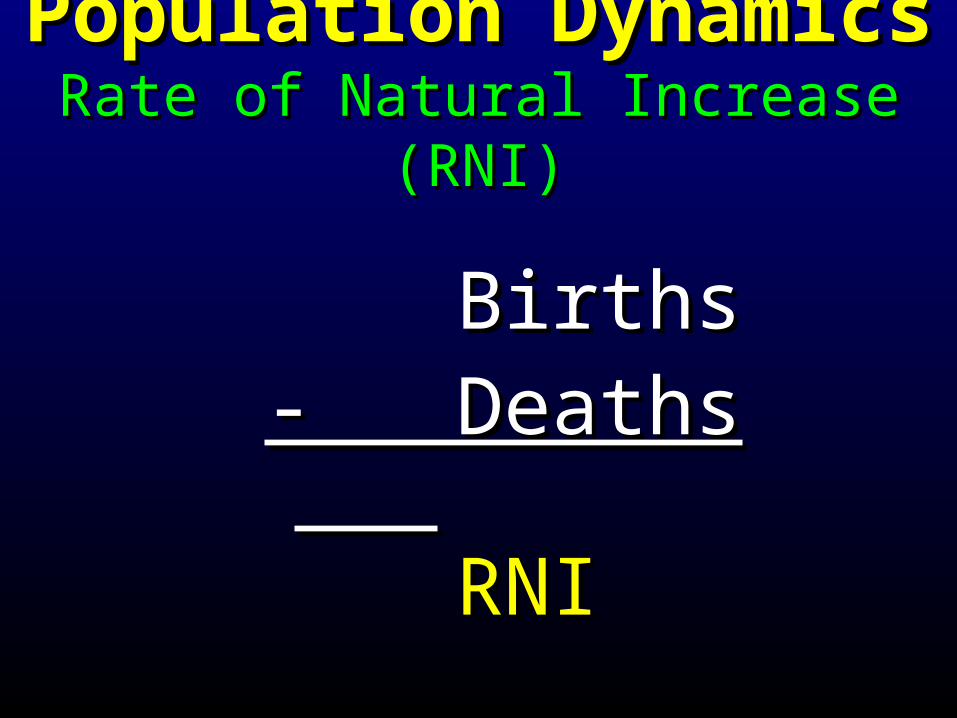
Population DynamicsPopulation DynamicsRate of Natural Increase (RNI)Rate of Natural Increase (RNI)
Births Births - Deaths - Deaths RNIRNI
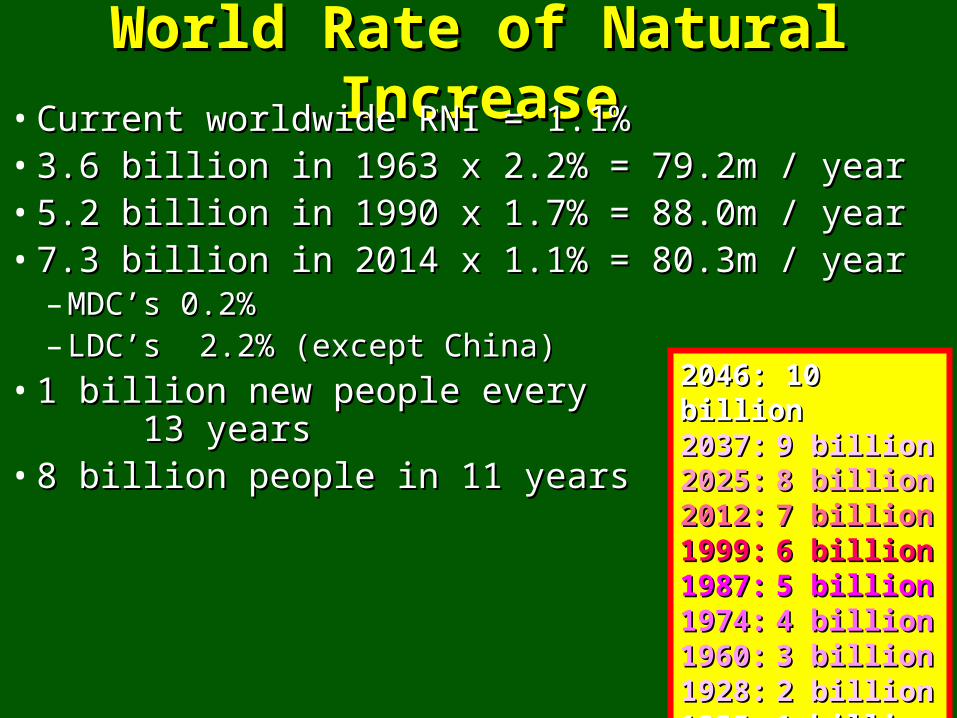
World Rate of Natural IncreaseWorld Rate of Natural Increase• Current worldwide RNI = 1.1%Current worldwide RNI = 1.1%• 3.6 billion in 1963 x 2.2% = 79.2m / year3.6 billion in 1963 x 2.2% = 79.2m / year• 5.2 billion in 1990 x 1.7% = 88.0m / year5.2 billion in 1990 x 1.7% = 88.0m / year• 7.3 billion in 2014 x 1.1% = 80.3m / year7.3 billion in 2014 x 1.1% = 80.3m / year
– MDC’s 0.2%MDC’s 0.2%– LDC’s 2.2% (except China)LDC’s 2.2% (except China)
• 1 billion new people every 13 years1 billion new people every 13 years• 8 billion people in 11 years8 billion people in 11 years
2046: 10 billion2046: 10 billion2037:2037: 9 billion9 billion2025:2025: 8 billion8 billion2012:2012: 7 billion7 billion1999:1999: 6 billion6 billion1987:1987: 5 billion5 billion1974:1974: 4 billion4 billion 1960:1960: 3 billion3 billion1928:1928: 2 billion2 billion 1825:1825: 1 billion1 billion
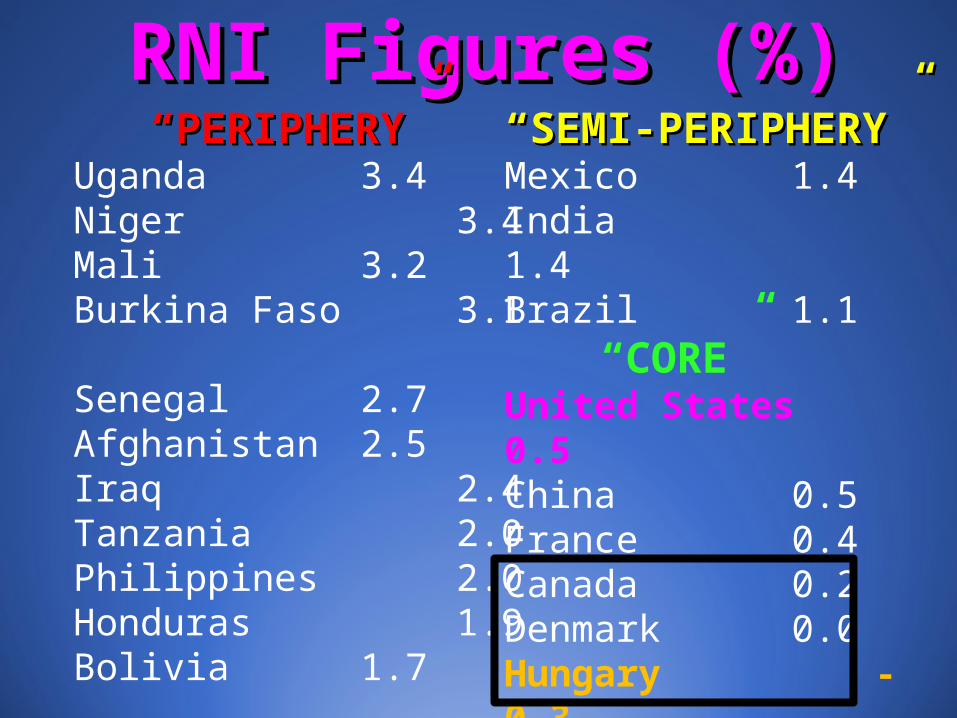
RNI Figures (%)RNI Figures (%) ““PERIPHERY”PERIPHERY”Uganda 3.4Niger 3.4Mali 3.2Burkina Faso 3.1
Senegal 2.7Afghanistan 2.5Iraq 2.4Tanzania 2.0Philippines 2.0Honduras 1.9Bolivia 1.7
““SEMI-PERIPHERY”SEMI-PERIPHERY”Mexico 1.4India 1.4Brazil 1.1
“CORE”United States 0.5China 0.5France 0.4Canada 0.2 Denmark 0.0Hungary -0.3Serbia -0.5Ukraine -0.6
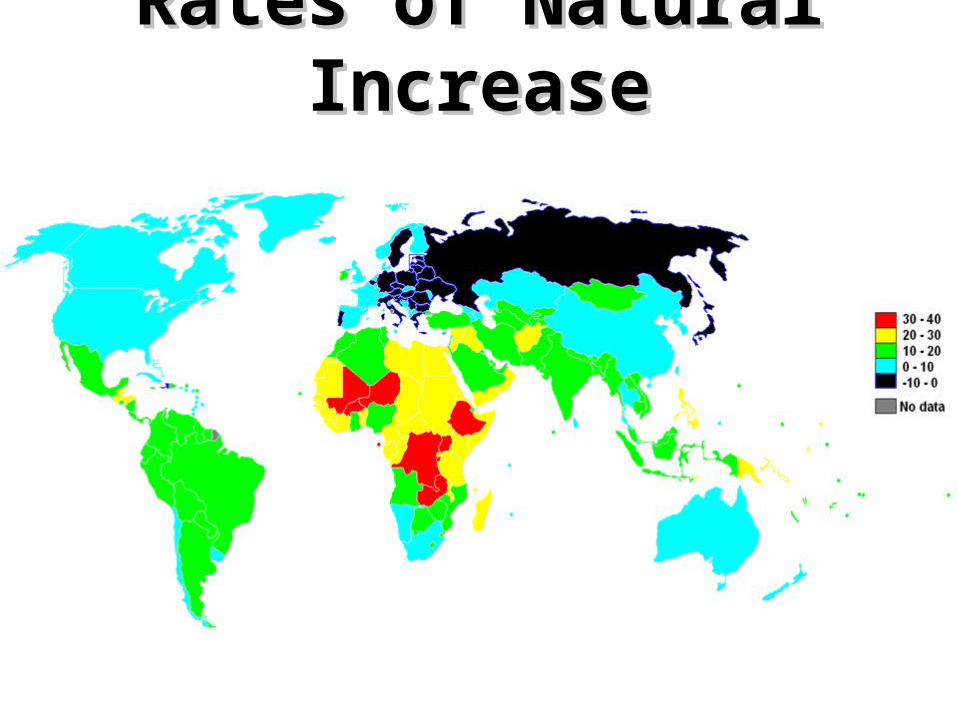
Rates of Natural IncreaseRates of Natural Increase(Birth Rate - Death Rate)
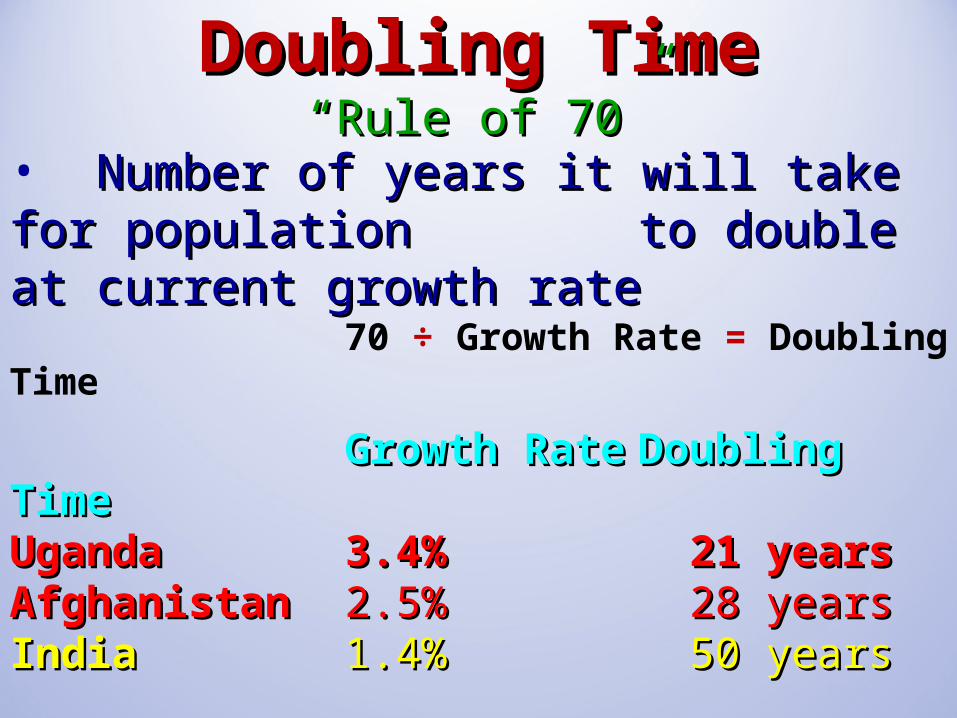
Doubling TimeDoubling Time“Rule of 70”“Rule of 70”
• Number of years it will take for population Number of years it will take for population to double at current growth rate to double at current growth rate
70 ÷ Growth Rate = Doubling Time
Growth RateGrowth Rate Doubling TimeDoubling TimeUgandaUganda 3.4%3.4% 21 years21 yearsAfghanistanAfghanistan 2.5%2.5% 28 years 28 yearsIndiaIndia 1.4%1.4% 50 years 50 yearsUnited StatesUnited States .5% .5% 140 years140 yearsDenmarkDenmark 0.0%0.0% -- --UkraineUkraine -0.6% -0.6% 117 years* (1/2) 117 years* (1/2)
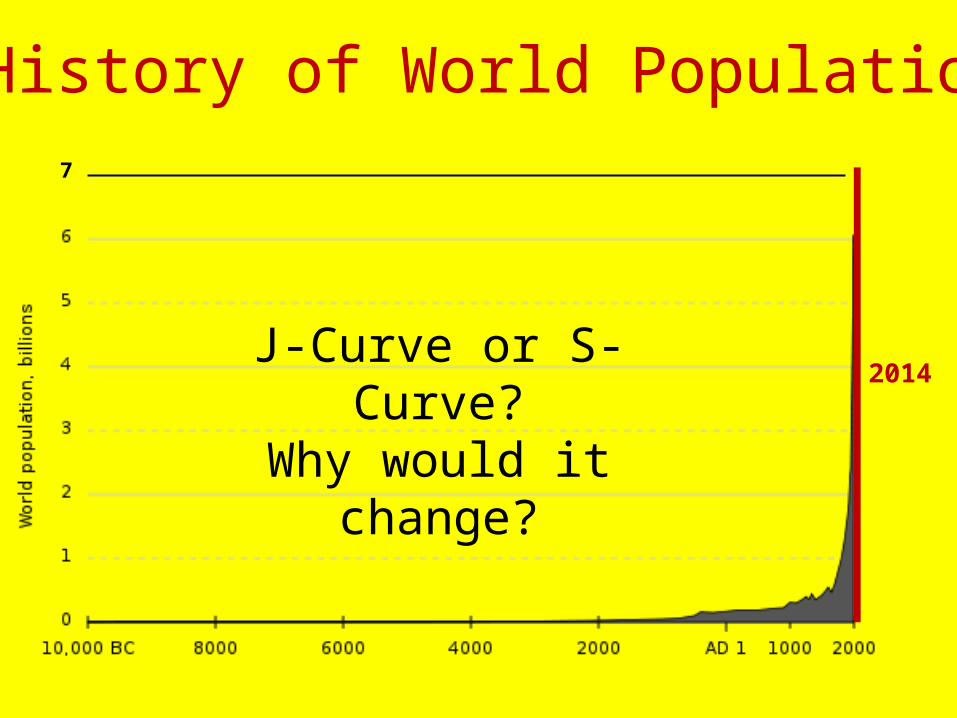
History of World Population
2014
7
J-Curve or S-Curve?Why would it change?
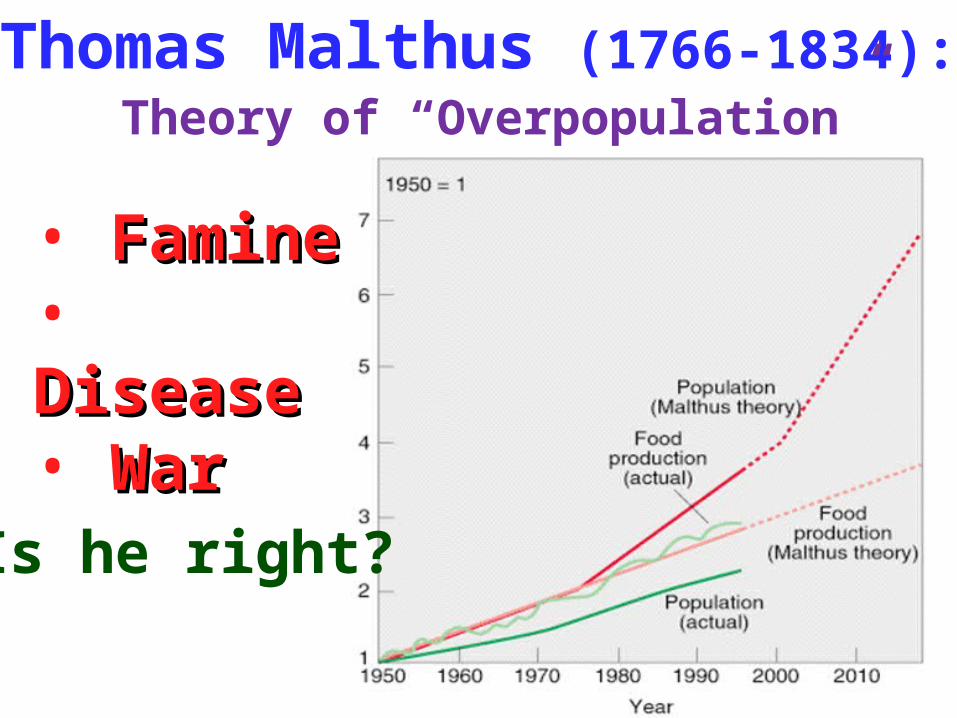
Thomas Malthus (1766-1834): Theory of “Overpopulation”
• FamineFamine• DiseaseDisease• WarWar
Is he right?
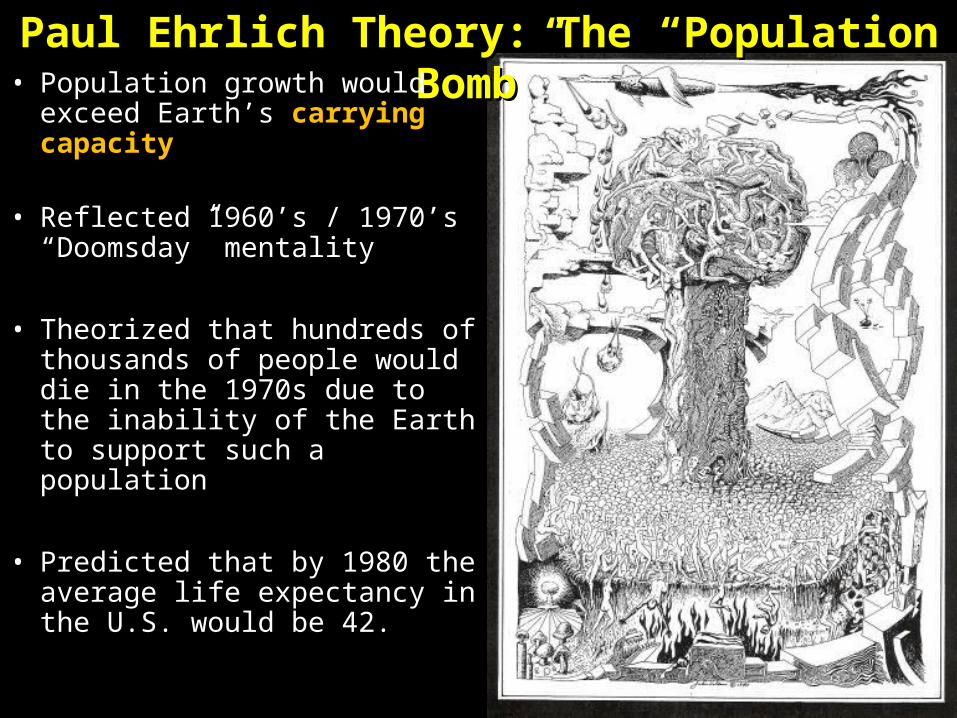
Paul Ehrlich Theory: The “Population Bomb”Paul Ehrlich Theory: The “Population Bomb”• Population growth would
exceed Earth’s carrying capacity
• Reflected 1960’s / 1970’s “Doomsday” mentality
• Theorized that hundreds of thousands of people would die in the 1970s due to the inability of the Earth to support such a population
• Predicted that by 1980 the average life expectancy in the U.S. would be 42.
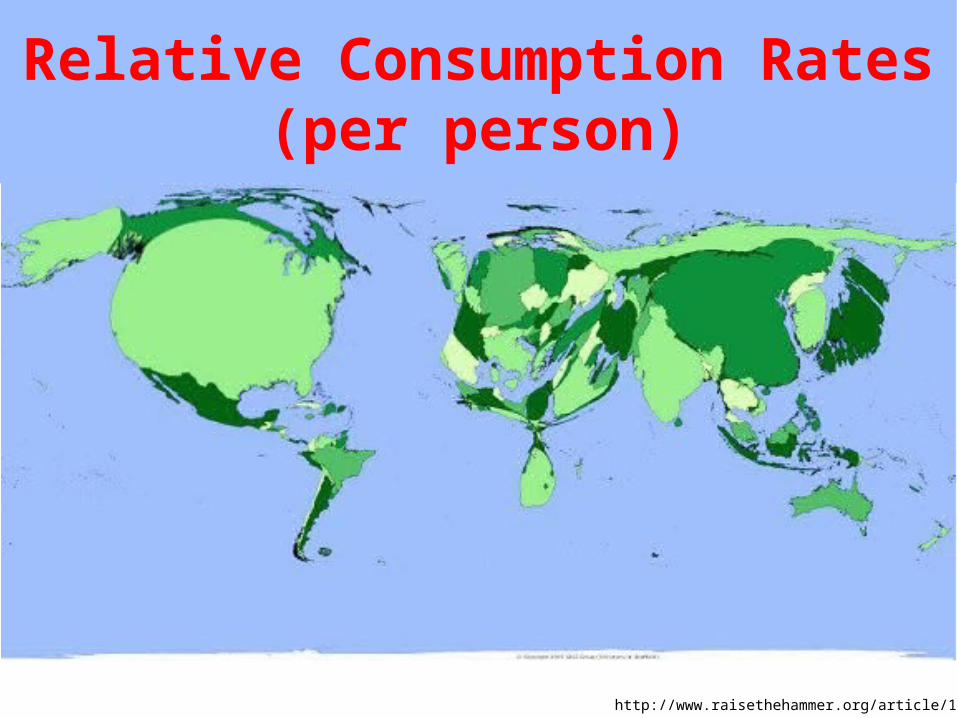
Relative Consumption Rates(per person)
http://www.raisethehammer.org/article/1350/

Environmental ScienceEnvironmental Science• Not just about nature, trees, “tree-
hugging” or “environmentalism.”• It’s about the interaction between and
impacts of humans on the environment.• It is undeniable that humans have made
an impact on the environment and continue to do so every single day.
• The question is, of course, what about that impact? Is it significant? Is it good, bad, or neutral? And how can we tell?
• Stay tuned…