human papilloma virus - a cause of malignant melanoma.vixra.org/pdf/1710.0311v3.pdf · human...
TRANSCRIPT
http://vixra.org/author/ilija_barukcic
Human papilloma virus - A cause of malignant melanoma.
Ilija Barukčić
Internist: Horandstrasse, DE-26441 Jever, Germany. Email: [email protected]
How to cite this paper: Ilija Barukčić
(2017) Human papilloma virus - A cause of
malignant melanoma. viXra-org, pp. 1-13. http://vixra.org/abs/1710.0311
Received: 28.10.2017
Accepted: 28.10.2017 Published: 28.10.2017
Copyright © 2017 by Ilija Barukčić, Jever, Germany. All rights reserved
Abstract
Background: The aim of this study is to evaluate the possible relationship between hu-
man papillomavirus (HPV) and malignant melanoma.
Objectives: In this systematic review we re-analysed the study of Roussaki-Schulze et
al. and the study of La Placa et al. so that some new inferences can be drawn.
Materials and methods: Roussaki-Schulze et al. obtained data from 28 human mela-
noma biopsy specimens and from 6 healthy individuals. La Placa et al. investigated 51
primary melanoma (PM) and in 20 control skin samples. The HPV DNA was determined
by polymerase chain reaction (PCR).
Statistical Analysis: The method of the conditio per quam relationship was used to proof
the hypothesis whether the presence of human papillomavirus (HPV) guarantees the
presence of malignant melanoma. In other words, if human papillomavirus (HPV) is pre-
sent, then malignant melanoma is present too. The mathematical formula of the causal
relationship k was used to proof the hypothesis, whether there is a cause effect relation-
ship between human papillomavirus (HPV) and malignant melanoma. Significance was
indicated by a p-value of less than 0.05.
Results: Based on the data as published by Roussaki-Schulze et al. and the data of La
Placa et al. the presence of human papillomavirus (HPV) guarantees the presence of ma-
lignant melanoma. In other words, human papillomavirus (HPV) is a conditio per quam
of malignant melanoma. In contrast to the study of La Placa et al. and contrary to expec-
tation, the study of Roussaki-Schulze et al. which is based on a very small sample size
failed to provide evidence of a significant cause effect relationship between human pap-
illomavirus (HPV) and malignant melanoma.
Conclusions: Human papillomavirus (HPV) is a necessary condition of malignant mel-
anoma. Human papillomavirus (HPV) is a cause of malignant melanoma.
Keywords
Human papilloma virus, Malignant melanoma, Causality
Open Access
Ilija Barukčić
2 http://vixra.org/author/ilija_barukcic
1. Introduction
Melanoma is a rare form of skin cancer and most common in adults. Still, sometimes mel-
anoma is found in adolescents and children too. Melanoma can occur anywhere on the skin
and even at locations which are not exposed [1] extensively to ultraviolet (UV) radiation.
The incidence and mortality rates of melanoma have risen for many decades while the
etiology of melanoma remains unclear. In recent years there has been a dramatic increase
[2] in incidence especially in people over the age of 60. Meanwhile, some risk factors for
melanoma including exposure to ultraviolet (UV) radiation, high numbers of common
naevi, large congenital naevi, multiple and/or atypical (Bauer) naevi (dysplastic naevi) [3]
et cetera have been discussed. Thus far, an increased exposure to ultraviolet (UV) radiation
[4] is generally considered to be the major environments cause of melanoma. Still, mela-
noma appears to be an immunogenic tumor too since especially immunosuppressed [5]
patients seem to have a higher risk of developing this neoplasm. The primary treatment of
melanoma is a surgical excision, sometimes radiotherapy is indicated. Under some specific
circumstances a chemotherapy (Decarbazine, Temozolomide, Paclitaxel, Cisplatin, Car-
boplatin), or an immunotherapy including Interferon (IFN)-Alpha or anti-CTLA-4 anti-
body ipilimumab or the use of of BRAF/MEK inhibitors (vemurafenib, dabrafenib, tramet-
inib) is offered to patients. The PD-1 antibodies pembrolizumab and nivolumab are ap-
proved for therapy of unresectable metastatic melanoma. Melanoma is able to metastasis
to the brain with the consequence that patients with brain metastases have a life expectancy
of only 3 to 5 months. One of the main causes of death in melanoma patients is widespread
metastases. Even if new melanoma therapies are being developed rapidly, a cure of this
many times deadly disease is still not in sight.
2. Material and methods
2.1. Study design of Roussaki-Schulze et al.
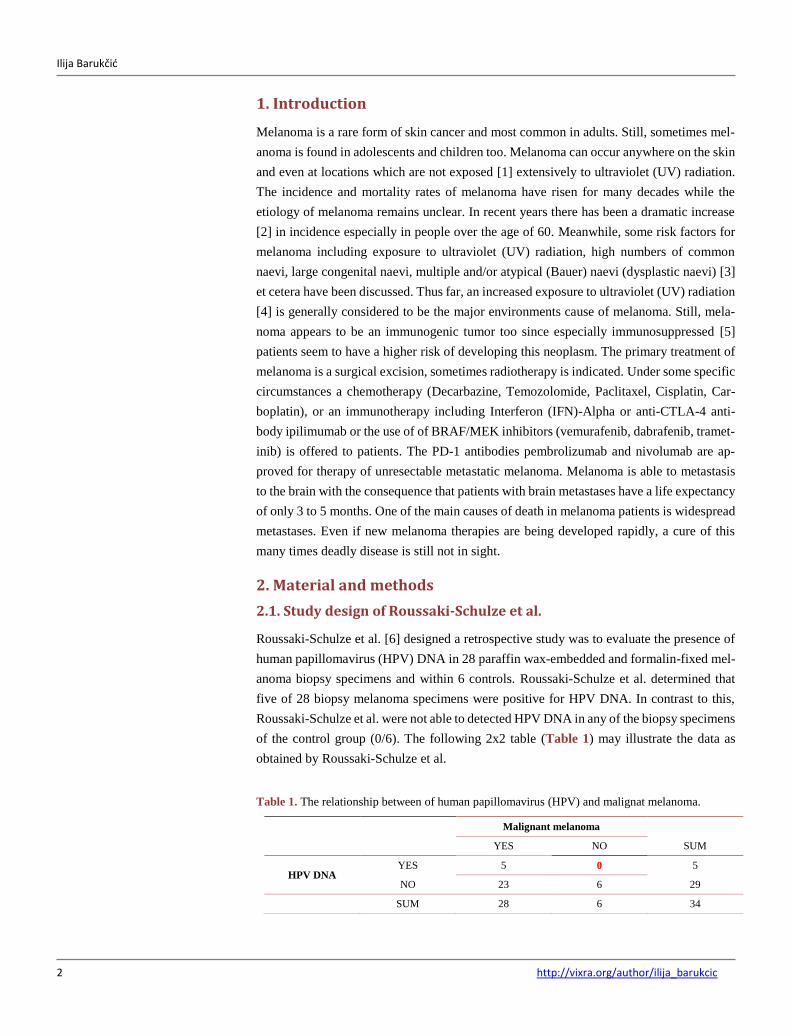
Roussaki-Schulze et al. [6] designed a retrospective study was to evaluate the presence of
human papillomavirus (HPV) DNA in 28 paraffin wax-embedded and formalin-fixed mel-
anoma biopsy specimens and within 6 controls. Roussaki-Schulze et al. determined that
five of 28 biopsy melanoma specimens were positive for HPV DNA. In contrast to this,
Roussaki-Schulze et al. were not able to detected HPV DNA in any of the biopsy specimens
of the control group (0/6). The following 2x2 table (Table 1) may illustrate the data as
obtained by Roussaki-Schulze et al.
Table 1. The relationship between of human papillomavirus (HPV) and malignat melanoma.
Malignant melanoma
YES NO SUM
HPV DNA YES 5 0 5
NO 23 6 29
SUM 28 6 34
Ilija Barukčić
http://vixra.org/author/ilija_barukcic 3
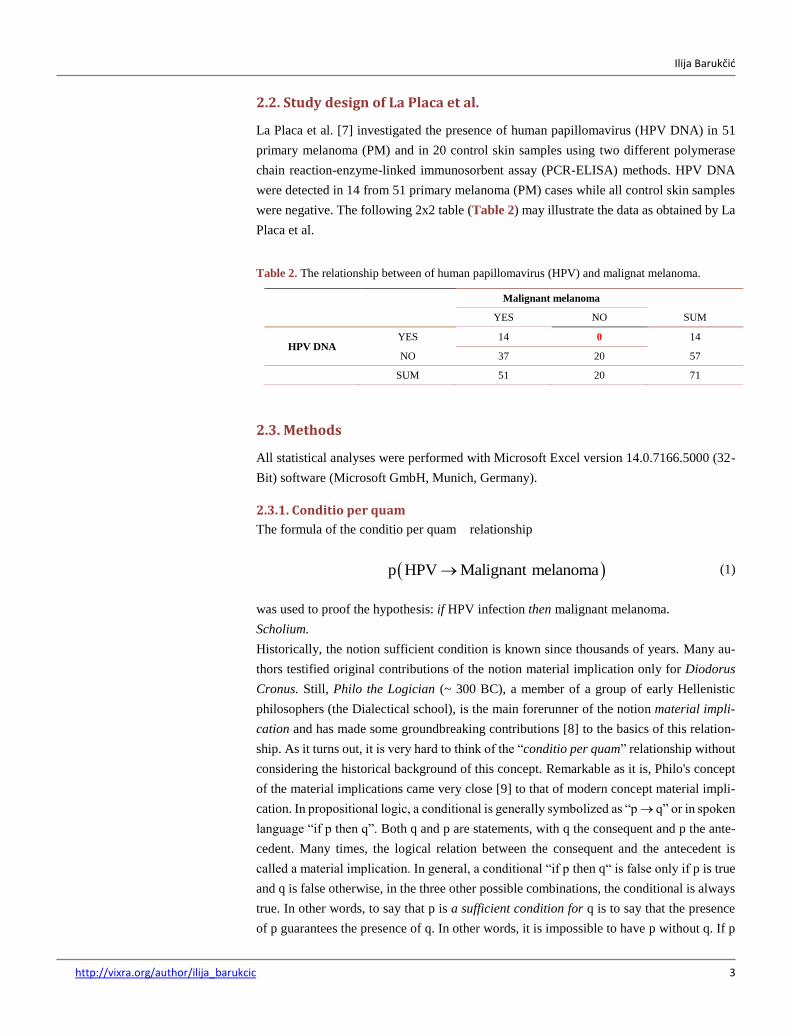
2.2. Study design of La Placa et al.
La Placa et al. [7] investigated the presence of human papillomavirus (HPV DNA) in 51
primary melanoma (PM) and in 20 control skin samples using two different polymerase
chain reaction-enzyme-linked immunosorbent assay (PCR-ELISA) methods. HPV DNA
were detected in 14 from 51 primary melanoma (PM) cases while all control skin samples
were negative. The following 2x2 table (Table 2) may illustrate the data as obtained by La
Placa et al.
Table 2. The relationship between of human papillomavirus (HPV) and malignat melanoma.
Malignant melanoma
YES NO SUM
HPV DNA YES 14 0 14
NO 37 20 57
SUM 51 20 71
2.3. Methods
All statistical analyses were performed with Microsoft Excel version 14.0.7166.5000 (32-
Bit) software (Microsoft GmbH, Munich, Germany).
2.3.1. Conditio per quam
The formula of the conditio per quam relationship
(1)
was used to proof the hypothesis: if HPV infection then malignant melanoma.
Scholium.
Historically, the notion sufficient condition is known since thousands of years. Many au-
thors testified original contributions of the notion material implication only for Diodorus
Cronus. Still, Philo the Logician (~ 300 BC), a member of a group of early Hellenistic
philosophers (the Dialectical school), is the main forerunner of the notion material impli-
cation and has made some groundbreaking contributions [8] to the basics of this relation-
ship. As it turns out, it is very hard to think of the “conditio per quam” relationship without
considering the historical background of this concept. Remarkable as it is, Philo's concept
of the material implications came very close [9] to that of modern concept material impli-
cation. In propositional logic, a conditional is generally symbolized as “p q” or in spoken
language “if p then q”. Both q and p are statements, with q the consequent and p the ante-
cedent. Many times, the logical relation between the consequent and the antecedent is
called a material implication. In general, a conditional “if p then q“ is false only if p is true
and q is false otherwise, in the three other possible combinations, the conditional is always
true. In other words, to say that p is a sufficient condition for q is to say that the presence
of p guarantees the presence of q. In other words, it is impossible to have p without q. If p
p HPV Malignant melanoma
Ilija Barukčić
4 http://vixra.org/author/ilija_barukcic
is present, then q must also be present. To show that p is not sufficient for q, we come up
with cases where p is present but q is not. It is well-known that the notion of a necessary
condition can be used in defining what a sufficient condition is (and vice versa). In general,
p is a necessary condition for q if it is impossible to have q without p. In fact, the absence
of p guarantees the absence of q. A necessary condition is sometimes also called “an es-
sential condition” or a conditio sine qua non. To show that p is not a necessary condition
for q, it is necessary to find an event or circumstances where q is present but p is not.
Especially, necessary and sufficient conditions are converses of each other. Thus far, there
is a straightforward way to give a precise and comprehensive account of the meaning of
the term necessary (or sufficient) condition itself. On any view, logic has as one of its goals
to characterize the most basic, the most simple and the most general laws of objective re-
ality. Especially, in logic, these notions are defined and meanwhile transferred into Bio-
statistics [10] too. What, then, is a sufficient (or a necessary) condition from the standpoint
of (Bio-) statistics? (Bio-) statistics generalizes the notions of a sufficient or a necessary
condition from one single Bernoulli trial to N Bernoulli trials [11].
2.3.2. Rule of three
In general, describing properties of data (descriptive statistics) or drawing conclusions
about a population of interest based on a sample drawn from that population (inferential
statistics) is of key importance in empirical scientific research. Many times, the relation
between empirical data and hypotheses is based on a set of measurements of individuals (a
sample, a subset of a population) from a certain population (a set of objects which are of
interest in a statistical study). The distinction between a sample together with its statistics
and a population together with its parameters is of fundamental importance, since every
scientific research rests on it. A sample either selected at random or at least representative
is used to make inferences about a population from which the same sample was drawn.
Generally, the quality of the data is only as good as the sample that produced it. From the
sample data various statistics can be calculated. And yet, it is worth noting that despite a
long history of progress in statistics, an estimate can be distorted or biased and depends not
only on the size of a sample. One such statistics is the key idea of the construction of the i.
e. 95% confidence interval. These confidence intervals itself are constructed entirely from
the sample data. Confidence intervals for proportions or a population mean of random var-
iables which are not normally distributed in the population can be constructed while relying
on the central limit theorem as long as the sample sizes and counts are big enough (i. e. a
sample size of n=30 and more). A formula, justified by the central limit theorem, is
(2)
where pCalc is the proportion of successes in a Bernoulli trial process with N trials yielding
X successes and N-X failures and z is the 1 – (Alpha/2) quantile of a standard normal
distribution corresponding to the significance level alpha. For example, for a 95% confi-
dence level alpha = 0.05 and z is z = 1.96. The Agresti-Coull [12] interval is also another
2Crit Calc Alpha/2 Calc Calc
1p p z p 1 p
N
Ilija Barukčić
http://vixra.org/author/ilija_barukcic 5
method for calculating binomial confidence intervals. But it is worth noting that another
very common technique for calculating binomial confidence intervals was published by
Clopper-Pearson [13] too. A faster and an alternative way to determine the lower and upper
“exact” confidence interval for pCalc is justified by the F distribution [14]. In this study, we
will use the rule of three [15] to calculate the confidence interval for pCalc. Briefly sketched,
the rule of three can be derived [16] from the binomial model. The rule of three defines
that 3/N is an upper 95% confidence bound for a binomial probability pCalc when in N
independent trials no events occur [17]. Under conditions where a certain event did not
occur [18] in a sample with N subjects (i. e. pCalc = 0) the interval from 0 to 3/n is called a
95% classical confidence interval for the binomial parameter for the rate of occurrences in
the population. According to the rule of the three the same interval is calculated for a sam-
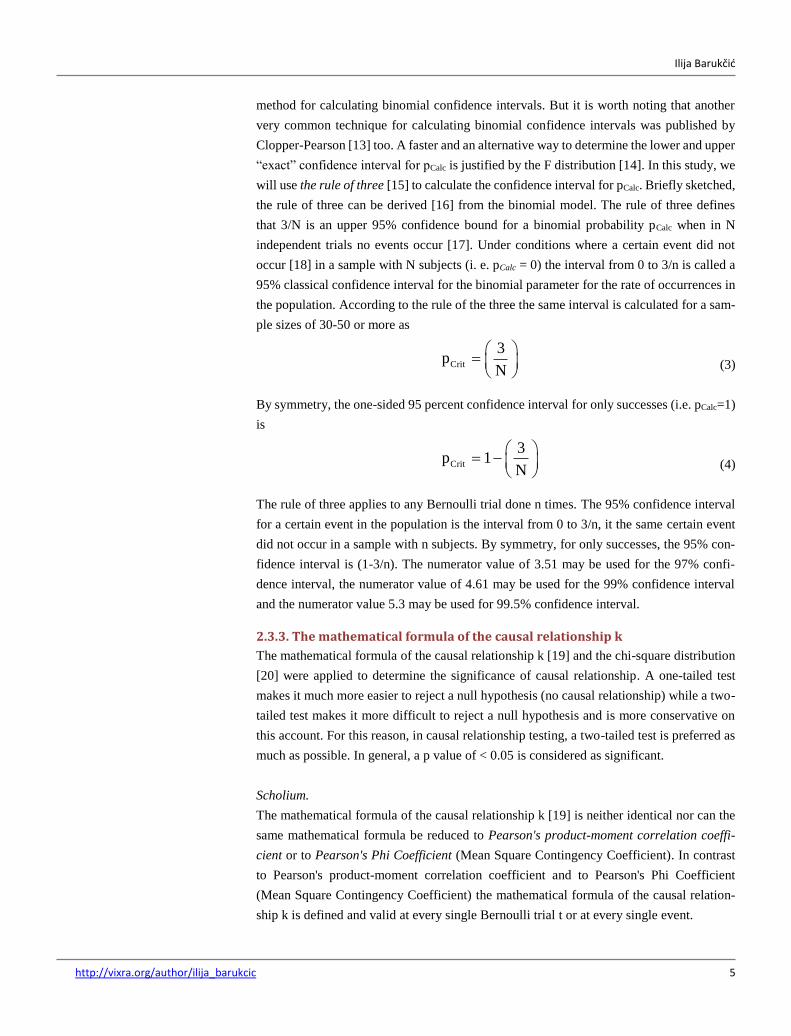
ple sizes of 30-50 or more as
(3)
By symmetry, the one-sided 95 percent confidence interval for only successes (i.e. pCalc=1)
is
(4)
The rule of three applies to any Bernoulli trial done n times. The 95% confidence interval
for a certain event in the population is the interval from 0 to 3/n, it the same certain event
did not occur in a sample with n subjects. By symmetry, for only successes, the 95% con-
fidence interval is (1-3/n). The numerator value of 3.51 may be used for the 97% confi-
dence interval, the numerator value of 4.61 may be used for the 99% confidence interval
and the numerator value 5.3 may be used for 99.5% confidence interval.
2.3.3. The mathematical formula of the causal relationship k
The mathematical formula of the causal relationship k [19] and the chi-square distribution
[20] were applied to determine the significance of causal relationship. A one-tailed test
makes it much more easier to reject a null hypothesis (no causal relationship) while a two-
tailed test makes it more difficult to reject a null hypothesis and is more conservative on
this account. For this reason, in causal relationship testing, a two-tailed test is preferred as
much as possible. In general, a p value of < 0.05 is considered as significant.
Scholium.
The mathematical formula of the causal relationship k [19] is neither identical nor can the
same mathematical formula be reduced to Pearson's product-moment correlation coeffi-
cient or to Pearson's Phi Coefficient (Mean Square Contingency Coefficient). In contrast
to Pearson's product-moment correlation coefficient and to Pearson's Phi Coefficient
(Mean Square Contingency Coefficient) the mathematical formula of the causal relation-
ship k is defined and valid at every single Bernoulli trial t or at every single event.
Crit
3p 1
N
Crit
3p
N
Ilija Barukčić
6 http://vixra.org/author/ilija_barukcic
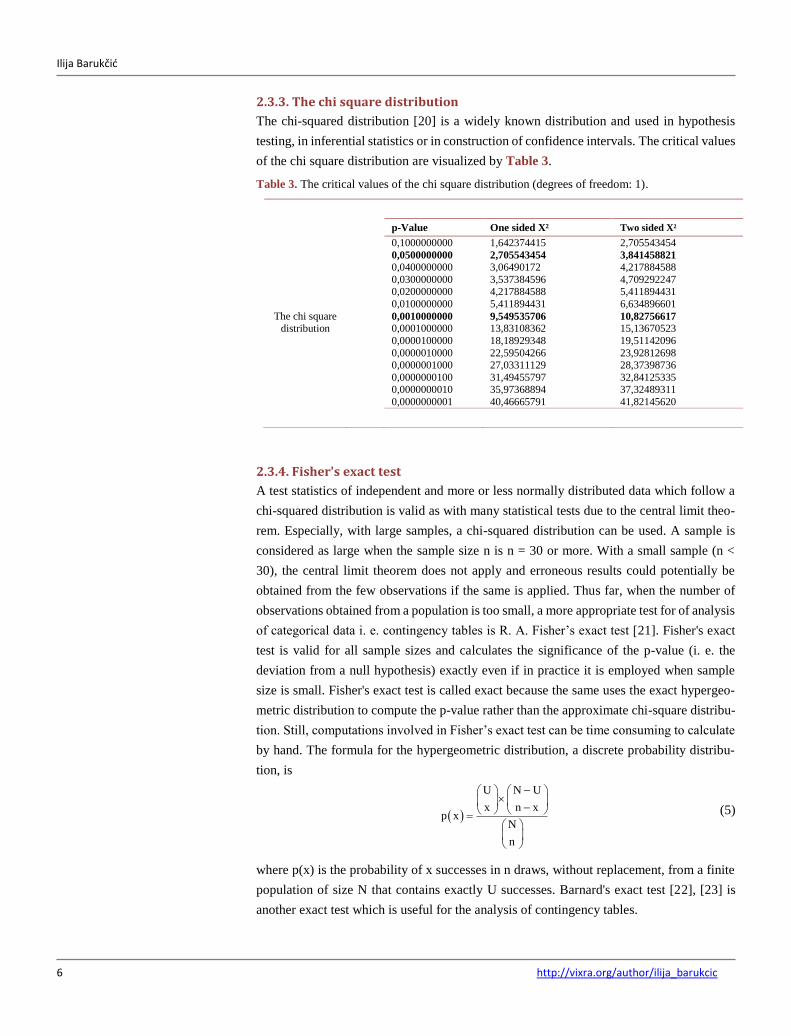
2.3.3. The chi square distribution
The chi-squared distribution [20] is a widely known distribution and used in hypothesis
testing, in inferential statistics or in construction of confidence intervals. The critical values
of the chi square distribution are visualized by Table 3.
Table 3. The critical values of the chi square distribution (degrees of freedom: 1).
p-Value One sided X² Two sided X²
The chi square
distribution
0,1000000000
0,0500000000
0,0400000000
0,0300000000 0,0200000000
0,0100000000
0,0010000000
0,0001000000
0,0000100000
0,0000010000 0,0000001000
0,0000000100 0,0000000010
0,0000000001
1,642374415
2,705543454
3,06490172
3,537384596 4,217884588
5,411894431
9,549535706
13,83108362
18,18929348
22,59504266 27,03311129
31,49455797 35,97368894
40,46665791
2,705543454
3,841458821
4,217884588
4,709292247 5,411894431
6,634896601
10,82756617
15,13670523
19,51142096
23,92812698 28,37398736
32,84125335 37,32489311
41,82145620
2.3.4. Fisher's exact test
A test statistics of independent and more or less normally distributed data which follow a
chi-squared distribution is valid as with many statistical tests due to the central limit theo-
rem. Especially, with large samples, a chi-squared distribution can be used. A sample is
considered as large when the sample size n is n = 30 or more. With a small sample (n <
30), the central limit theorem does not apply and erroneous results could potentially be
obtained from the few observations if the same is applied. Thus far, when the number of
observations obtained from a population is too small, a more appropriate test for of analysis
of categorical data i. e. contingency tables is R. A. Fisher’s exact test [21]. Fisher's exact
test is valid for all sample sizes and calculates the significance of the p-value (i. e. the
deviation from a null hypothesis) exactly even if in practice it is employed when sample
size is small. Fisher's exact test is called exact because the same uses the exact hypergeo-
metric distribution to compute the p-value rather than the approximate chi-square distribu-
tion. Still, computations involved in Fisher’s exact test can be time consuming to calculate
by hand. The formula for the hypergeometric distribution, a discrete probability distribu-
tion, is
(5)
where p(x) is the probability of x successes in n draws, without replacement, from a finite
population of size N that contains exactly U successes. Barnard's exact test [22], [23] is
another exact test which is useful for the analysis of contingency tables.
U N U
x n xp x
N
n
Ilija Barukčić
http://vixra.org/author/ilija_barukcic 7
3. Results
3.1. Human papillomavirus is a conditio per quam of human malignant melanoma due to Roussaki-Schulze et al.
Claims.
Null hypothesis:
The presence of human papillomavirus (HPV) guarantees the presence of malignant mela-
noma.
(pCalc > pCrit).
Alternative hypothesis:
The presence of human papillomavirus (HPV) does not guarantee the presence of malignant
melanoma.
(pCalc < pCrit).
Significance level (Alpha) below which the null hypothesis will be rejected: 0.05.
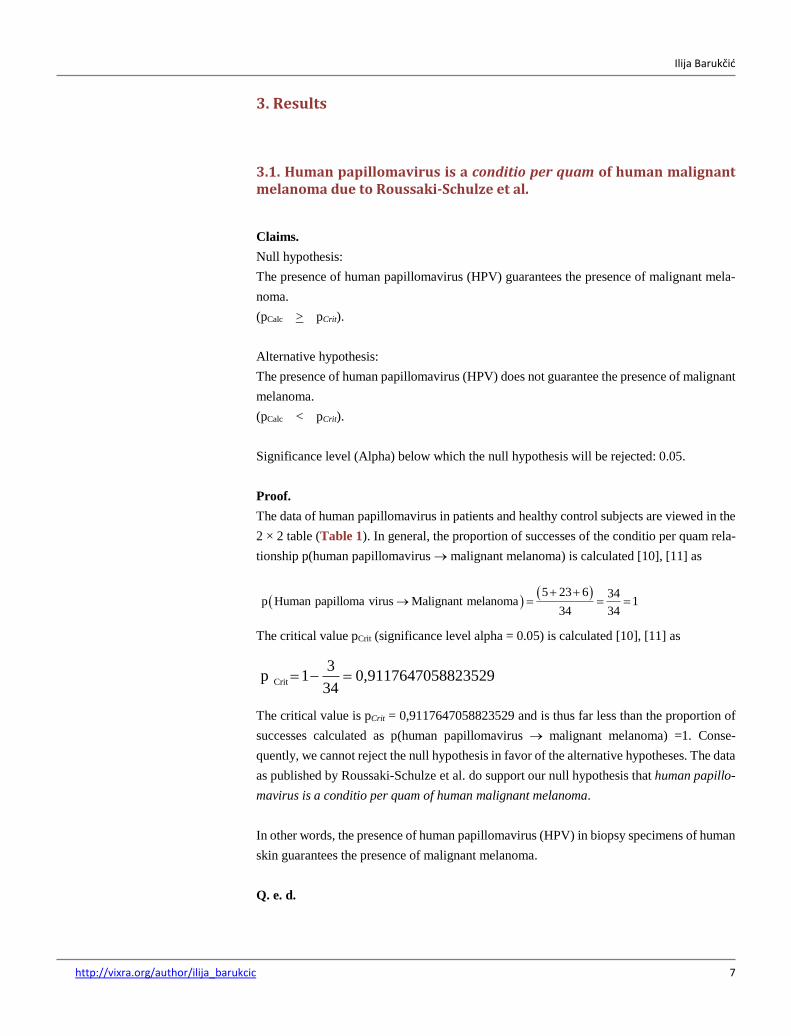
Proof.
The data of human papillomavirus in patients and healthy control subjects are viewed in the
2 × 2 table (Table 1). In general, the proportion of successes of the conditio per quam rela-
tionship p(human papillomavirus malignant melanoma) is calculated [10], [11] as
The critical value pCrit (significance level alpha = 0.05) is calculated [10], [11] as
The critical value is pCrit = 0,9117647058823529 and is thus far less than the proportion of
successes calculated as p(human papillomavirus malignant melanoma) =1. Conse-
quently, we cannot reject the null hypothesis in favor of the alternative hypotheses. The data
as published by Roussaki-Schulze et al. do support our null hypothesis that human papillo-
mavirus is a conditio per quam of human malignant melanoma.
In other words, the presence of human papillomavirus (HPV) in biopsy specimens of human
skin guarantees the presence of malignant melanoma.
Q. e. d.
5 23 6 34
p Human papilloma virus Malignant melanoma 134 34
Crit
3p 1 0,9117647058823529
34
Ilija Barukčić
8 http://vixra.org/author/ilija_barukcic
3.2. Human papillomavirus is a conditio per quam of human malignant melanoma due to La Placa et al.
Claims.
Null hypothesis:
The presence of human papillomavirus (HPV) guarantees the presence of malignant mela-
noma.
(pCalc > pCrit).
Alternative hypothesis:
The presence of human papillomavirus (HPV) does not guarantee the presence of malignant
melanoma.
(pCalc < pCrit).
Significance level (Alpha) below which the null hypothesis will be rejected: 0.05.
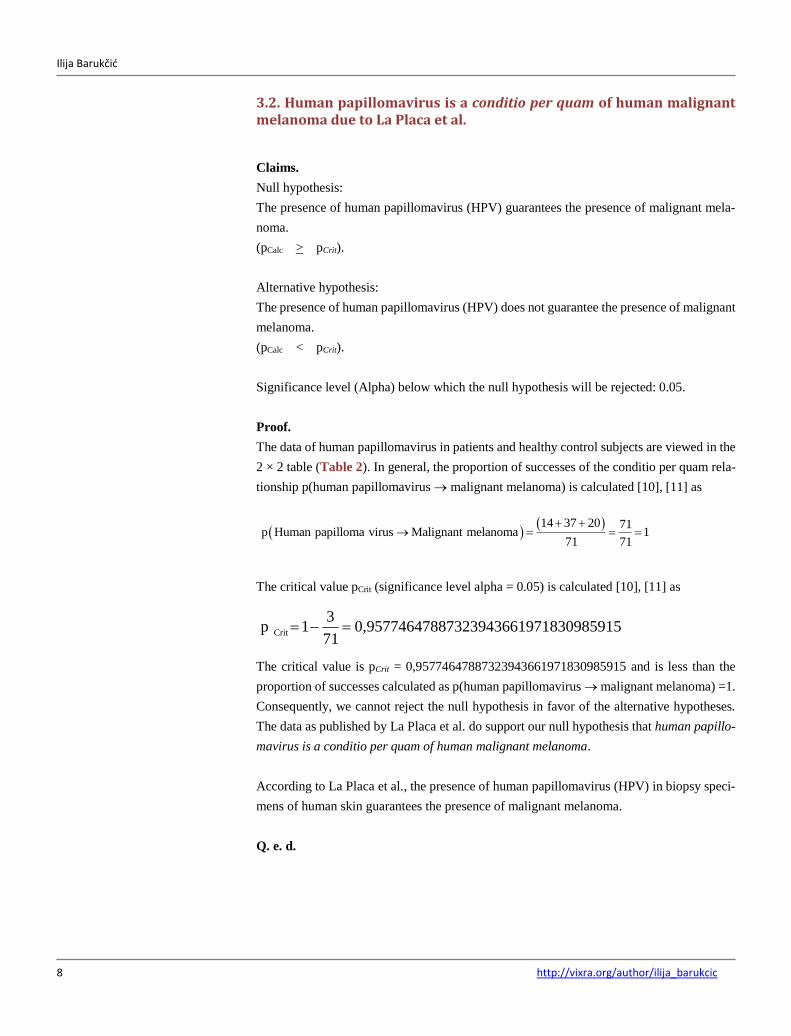
Proof.
The data of human papillomavirus in patients and healthy control subjects are viewed in the
2 × 2 table (Table 2). In general, the proportion of successes of the conditio per quam rela-
tionship p(human papillomavirus malignant melanoma) is calculated [10], [11] as
The critical value pCrit (significance level alpha = 0.05) is calculated [10], [11] as
The critical value is pCrit = 0,95774647887323943661971830985915 and is less than the
proportion of successes calculated as p(human papillomavirus malignant melanoma) =1.
Consequently, we cannot reject the null hypothesis in favor of the alternative hypotheses.
The data as published by La Placa et al. do support our null hypothesis that human papillo-
mavirus is a conditio per quam of human malignant melanoma.
According to La Placa et al., the presence of human papillomavirus (HPV) in biopsy speci-
mens of human skin guarantees the presence of malignant melanoma.
Q. e. d.
14 37 20 71
p Human papilloma virus Malignant melanoma 171 71
Crit
3p 1 0,95774647887323943661971830985915
71
Ilija Barukčić
http://vixra.org/author/ilija_barukcic 9
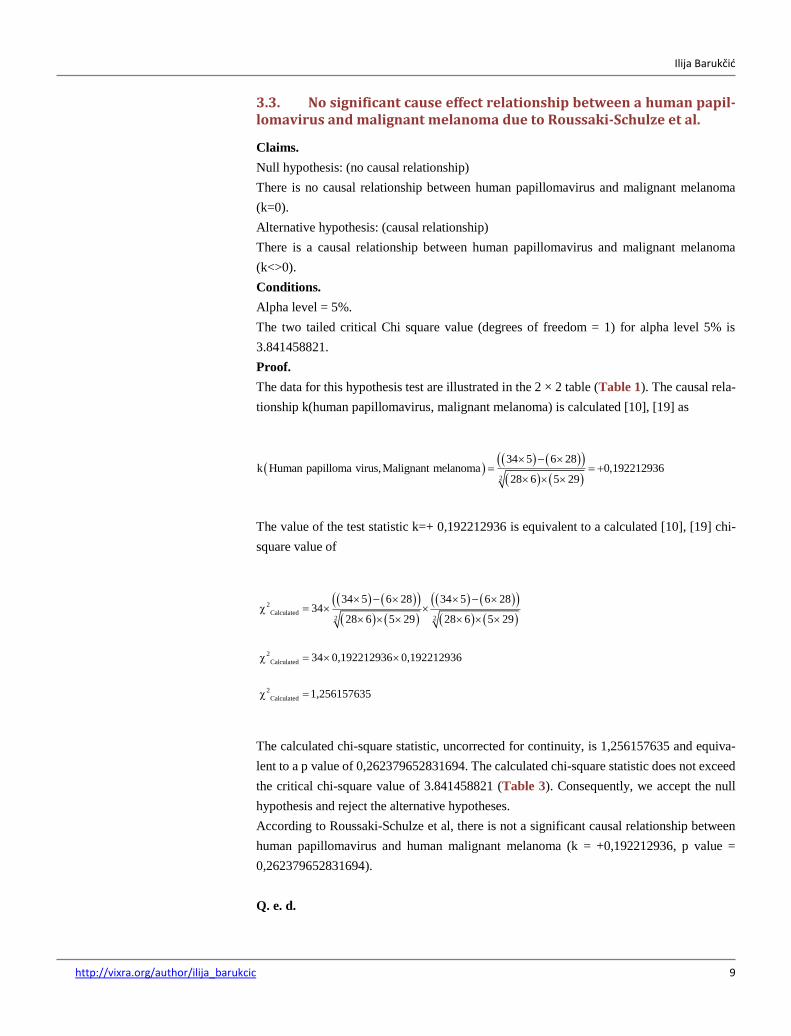
3.3. No significant cause effect relationship between a human papil-lomavirus and malignant melanoma due to Roussaki-Schulze et al.
Claims.
Null hypothesis: (no causal relationship)
There is no causal relationship between human papillomavirus and malignant melanoma
(k=0).
Alternative hypothesis: (causal relationship)
There is a causal relationship between human papillomavirus and malignant melanoma
(k<>0).
Conditions.
Alpha level = 5%.
The two tailed critical Chi square value (degrees of freedom = 1) for alpha level 5% is
3.841458821.
Proof.
The data for this hypothesis test are illustrated in the 2 × 2 table (Table 1). The causal rela-
tionship k(human papillomavirus, malignant melanoma) is calculated [10], [19] as
The value of the test statistic k=+ 0,192212936 is equivalent to a calculated [10], [19] chi-
square value of
The calculated chi-square statistic, uncorrected for continuity, is 1,256157635 and equiva-
lent to a p value of 0,262379652831694. The calculated chi-square statistic does not exceed
the critical chi-square value of 3.841458821 (Table 3). Consequently, we accept the null
hypothesis and reject the alternative hypotheses.
According to Roussaki-Schulze et al, there is not a significant causal relationship between
human papillomavirus and human malignant melanoma (k = +0,192212936, p value =
0,262379652831694).
Q. e. d.
2
34 5 6 28k Human papilloma virus,Malignant melanoma
28 6 5 290,192212936
2
Calculated2 2
2
Calculated
2
Calculated
34 5 6 28 34 5 6 2834
28 6 5 29 28 6 5 29
34 0,192212936 0,192212936
1,256157635
Ilija Barukčić
10 http://vixra.org/author/ilija_barukcic
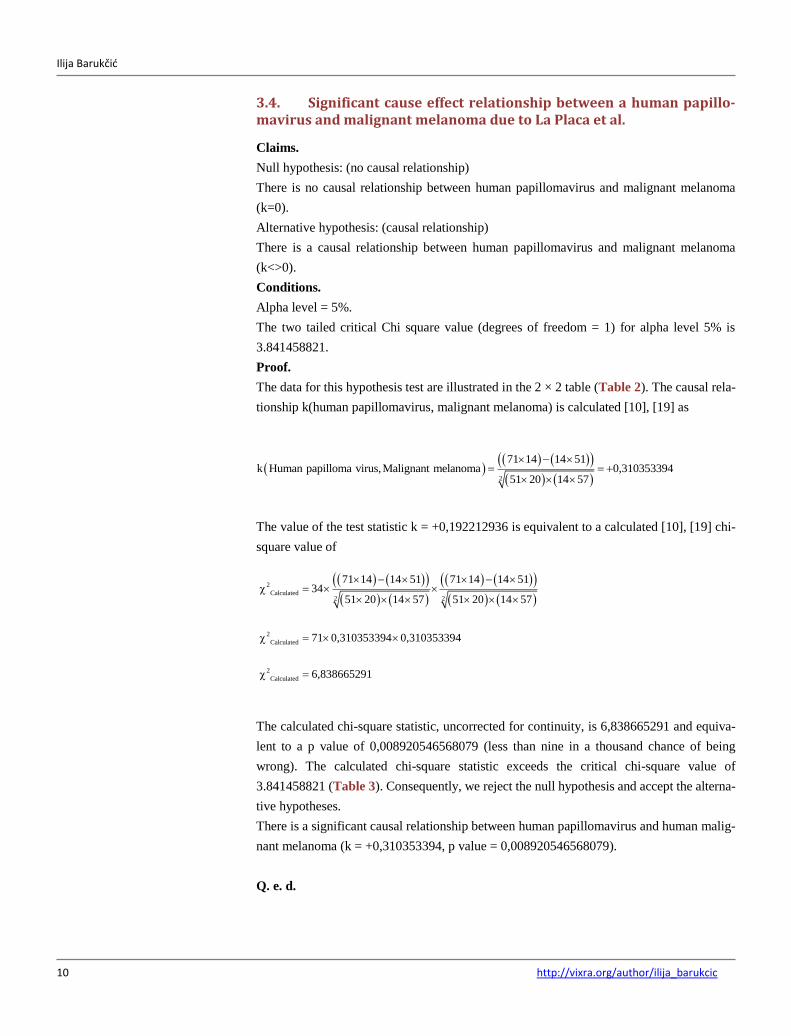
3.4. Significant cause effect relationship between a human papillo-mavirus and malignant melanoma due to La Placa et al.
Claims.
Null hypothesis: (no causal relationship)
There is no causal relationship between human papillomavirus and malignant melanoma
(k=0).
Alternative hypothesis: (causal relationship)
There is a causal relationship between human papillomavirus and malignant melanoma
(k<>0).
Conditions.
Alpha level = 5%.
The two tailed critical Chi square value (degrees of freedom = 1) for alpha level 5% is
3.841458821.
Proof.
The data for this hypothesis test are illustrated in the 2 × 2 table (Table 2). The causal rela-
tionship k(human papillomavirus, malignant melanoma) is calculated [10], [19] as
The value of the test statistic k = +0,192212936 is equivalent to a calculated [10], [19] chi-
square value of
The calculated chi-square statistic, uncorrected for continuity, is 6,838665291 and equiva-
lent to a p value of 0,008920546568079 (less than nine in a thousand chance of being
wrong). The calculated chi-square statistic exceeds the critical chi-square value of
3.841458821 (Table 3). Consequently, we reject the null hypothesis and accept the alterna-
tive hypotheses.
There is a significant causal relationship between human papillomavirus and human malig-
nant melanoma (k = +0,310353394, p value = 0,008920546568079).
Q. e. d.
2
71 14 14 51k Human papilloma virus,Malignant melanoma 0,310353394
51 20 14 57
2
Calculated2 2
2
Calculated
2
Calculated
71 14 14 51 71 14 14 5134
51 20 14 57 51 20 14 57
71 0,310353394 0,310353394
6,838665291
Ilija Barukčić
http://vixra.org/author/ilija_barukcic 11
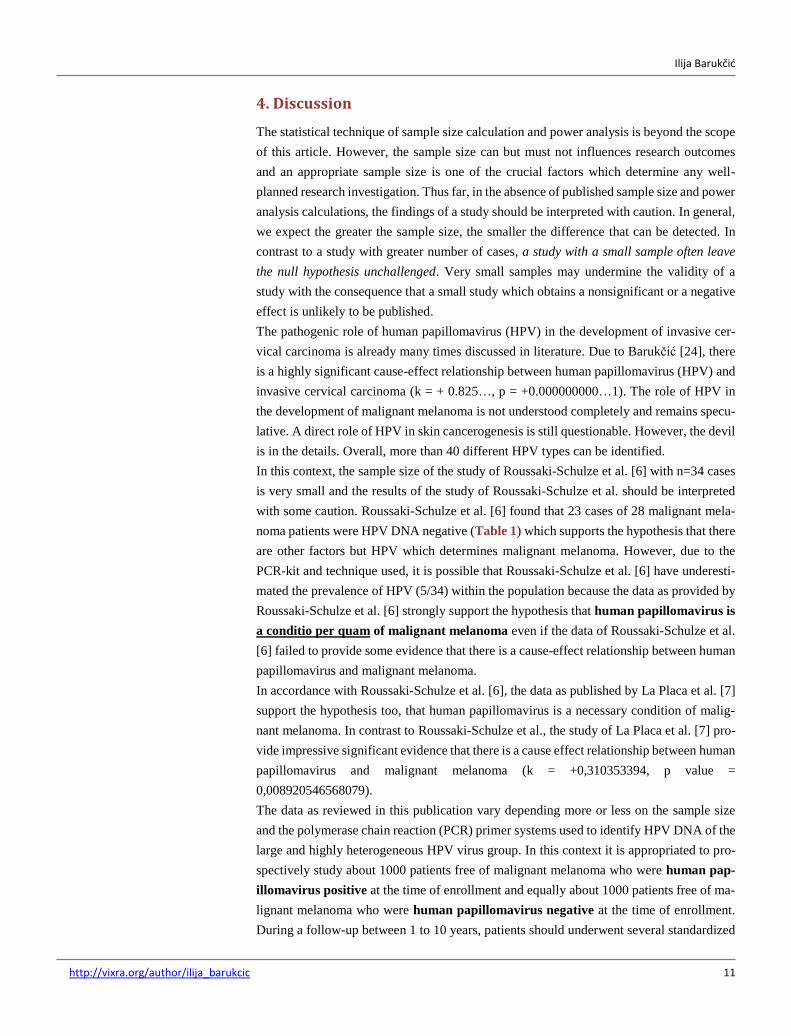
4. Discussion
The statistical technique of sample size calculation and power analysis is beyond the scope
of this article. However, the sample size can but must not influences research outcomes
and an appropriate sample size is one of the crucial factors which determine any well-
planned research investigation. Thus far, in the absence of published sample size and power
analysis calculations, the findings of a study should be interpreted with caution. In general,
we expect the greater the sample size, the smaller the difference that can be detected. In
contrast to a study with greater number of cases, a study with a small sample often leave
the null hypothesis unchallenged. Very small samples may undermine the validity of a
study with the consequence that a small study which obtains a nonsignificant or a negative
effect is unlikely to be published.
The pathogenic role of human papillomavirus (HPV) in the development of invasive cer-
vical carcinoma is already many times discussed in literature. Due to Barukčić [24], there
is a highly significant cause-effect relationship between human papillomavirus (HPV) and
invasive cervical carcinoma (k = + 0.825…, p = +0.000000000…1). The role of HPV in
the development of malignant melanoma is not understood completely and remains specu-
lative. A direct role of HPV in skin cancerogenesis is still questionable. However, the devil
is in the details. Overall, more than 40 different HPV types can be identified.
In this context, the sample size of the study of Roussaki-Schulze et al. [6] with n=34 cases
is very small and the results of the study of Roussaki-Schulze et al. should be interpreted
with some caution. Roussaki-Schulze et al. [6] found that 23 cases of 28 malignant mela-
noma patients were HPV DNA negative (Table 1) which supports the hypothesis that there
are other factors but HPV which determines malignant melanoma. However, due to the
PCR-kit and technique used, it is possible that Roussaki-Schulze et al. [6] have underesti-
mated the prevalence of HPV (5/34) within the population because the data as provided by
Roussaki-Schulze et al. [6] strongly support the hypothesis that human papillomavirus is
a conditio per quam of malignant melanoma even if the data of Roussaki-Schulze et al.
[6] failed to provide some evidence that there is a cause-effect relationship between human
papillomavirus and malignant melanoma.
In accordance with Roussaki-Schulze et al. [6], the data as published by La Placa et al. [7]
support the hypothesis too, that human papillomavirus is a necessary condition of malig-
nant melanoma. In contrast to Roussaki-Schulze et al., the study of La Placa et al. [7] pro-
vide impressive significant evidence that there is a cause effect relationship between human
papillomavirus and malignant melanoma (k = +0,310353394, p value =
0,008920546568079).
The data as reviewed in this publication vary depending more or less on the sample size
and the polymerase chain reaction (PCR) primer systems used to identify HPV DNA of the
large and highly heterogeneous HPV virus group. In this context it is appropriated to pro-
spectively study about 1000 patients free of malignant melanoma who were human pap-
illomavirus positive at the time of enrollment and equally about 1000 patients free of ma-
lignant melanoma who were human papillomavirus negative at the time of enrollment.
During a follow-up between 1 to 10 years, patients should underwent several standardized

Ilija Barukčić
12 http://vixra.org/author/ilija_barukcic
and reproduceable investigations to search for malignant melanoma including histologic
examination (if melanoma positive), serologic testing, DNA PCR and DNA in situ hybrid-
ization et cetera.
5. Conclusion
The result of this investigation does not justify the position to ignore a possible cause-effect
relationship between human papillomavirus and malignant melanoma. A more systemati-
cal study with a greater sample size is justified to prove the possible cause effect relation-
ship between human papillomavirus and malignant melanoma. Human papillomavirus is a
necessary condition of malignant melanoma. According to the study of La Placa et al.,
human papillomavirus is a cause of malignant melanoma (k = +0,310353394, p value =
0,008920546568079).
Acknowledgements
None.
References
[1] Yuan G., Wu L., Li B., An J. (2017) Primary malignant melanoma of the cervix: Report of 14
cases and review of literature. Oncotarget, 8, 73162-73167.
https://doi.org/10.18632/oncotarget.17183
[2] Whiteman D. C., Green A. C., Olsen C. M. (2016) The growing burden of invasive melanoma:
projections of incidence rates and numbers of new cases in six susceptible populations to 2031.
J. Invest. Dermatol., 136, 1161-1171.
http://dx.doi.org/10.1016/j.jid.2016.01.035
[3] Bauer J., Garbe C. (2003). Acquired melanocytic nevi as risk factor for melanoma develop-
ment. A comprehensive review of epidemiological data, Pigment. Cell. Res., 16, 297-306.
https://doi.org/10.1034/j.1600-0749.2003.00047.x
[4] Holland, F. L. and Harvey I. (2002) Adult vs Childhood Susceptibility to Melanoma: Is There
a Difference? Arch Dermatol., 138,1234-1235. https://doi.org/10.1001/archderm.138.9.1234
[5] Wang S. Q,, Setlow R., Berwick M., Polsky D., Marghoob A. A., Kopf A. W., Bart R. S.,
(2001) Ultraviolet A and melanoma: a review. J. Am. Acad. Dermatol., 44,837-846.
https://doi.org//10.1067/mjd.2001.114594
[6] Roussaki-Schulze A. V., Kouskoukis C., Rammos C, Rallis E., Kontos F., Zafiriou E., Gross
G. (2005) Identification of human papillomavirus DNA in melanoma biopsy specimens of
Greek population. International Journal of Clinical Pharmacology Research, 25, 145-150.
Ilija Barukčić
http://vixra.org/author/ilija_barukcic 13
[7] La Placa M., Ambretti S., Bonvicini F., Venturoli S., Bianchi T., Varotti C., Zerbini M.,
Musiani M. (2005) Presence of high-risk mucosal human papillomavirus genotypes in primary
melanoma and in acquired dysplastic melanocytic naevi. British Journal of Dermatology,152,
909-914. https://doi.org/10.1111/j.1365-2133.2005.06344.x
[8] Astorga M. L. (2015). Diodorus Cronus and Philo of Megara: Two Accounts of the Conditional.
Rupkatha Journal on Interdisciplinary Studies in Humanities, 7, 9-16.
[9] Bochenski, J. M., (1961). A history of formal logic, Translated and edited by Ivo Thomas.
Notre Dame: University of Notre Dame Press. pp. 14/15.
[10] Barukčić, I. (1989). Die Kausalität, Hamburg: Wissenschaftsverlag, pp 218.
[11] Barukčić, K. and Barukčić, I. (2016) Epstein Barr Virus - The Cause of Multiple Sclerosis.
Journal of Applied Mathematics and Physics, 4, 1042-1053.
http://dx.doi.org/10.4236/jamp.2016.46109
[12] Agresti, A. and Coull, B. A. (1998) Approximate is better than “exact” for interval estimation
of binomial proportions. The American Statistician, 52, 119–126.
http://dx.doi.org/10.2307/2685469
[13] Clopper, C. and Pearson, E. S. (1934) The use of confidence or fiducial limits illustrated in the
case of the binomial. Biometrika, 26, 404–413. http://dx.doi.org/10.1093/biomet/26.4.404
[14] Leemis, L. M. and Trivedi, K. S. (1996) A Comparison of Approximate Interval Estimators for
the Bernoulli Parameter. The American Statistician, 50, 63-68.
http://dx.doi.org/10.2307/2685046
[15] Rumke C. L. (1975) Implications of the Statement: No Side Effects Were Observed. N Engl J
Med, 292, 372-373. http://dx.doi.org/10.1056/NEJM197502132920723
[16] Hanley, J. A. and Lippman-Hand, A. (1983) If Nothing Goes Wrong, Is Everything All Right?
The Journal of the American Medical Assn., 249, 1743-1745.
http://dx.doi.org/10.1001/jama.1983.03330370053031
[17] Jovanovic, B. D. and Levy, P.S. (1997) A Look at the Rule of Three. The American Statistician,
51, 137-139. http://dx.doi.org/10.1080/00031305.1997.10473947
[18] Louis, T. A. (1981) Confidence Intervals for a Binomial Parameter After Observing No Suc-
cesses. The American Statistician, 35, 154.
http://dx.doi.org/10.1080/00031305.1981.10479337
[19] Barukčić, I. (2016) The Mathematical Formula of the Causal Relationship k. International
Journal of Applied Physics and Mathematics, 6, 45-65.
http://dx.doi.org/10.17706/ijapm.2016.6.2.45-65
[20] Pearson, K. (1900) On the Criterion That a Given System of Deviations from the Probable in
the Case of a Correlated System of Variables Is Such That It Can Be Reasonably Supposed to
Have Arisen from Random Sampling. Philosophical Magazine Series, 5, 157-175.
http://dx.doi.org/10.1080/14786440009463897
[21] Fisher, R. A. (1922). On the interpretation of X² from contingency tables, and the calculation
of P. Journal of the Royal Statistical Society, 85, 87–94. http://dx.doi.org/10.2307/2340521
[22] Barnard G.A. (1945). A New Test for 2 × 2 Tables. Nature, 156, 783-784.
http://dx.doi.org/10.1038/156783b0
[23] Barnard G.A. (1947). Significance Tests for 2 × 2 Tables. Biometrika, 34, 123-138.
https://dx.doi.org/10.1093/biomet/34.1-2.123
[24] Barukčić, I. (2017). Theoriae causalitatis principia mathematica. Hamburg: Books on De-
mand, pp. 175-176. https://www.bod.de/buchshop/theoriae-causalitatis-principia-mathemat-
ica-ilija-barukcic-9783744815932