human development policy and local opportunities evidence from brazilian municipalities ursula...
TRANSCRIPT
Human development policy and local opportunities:
evidence from Brazilian municipalitiesUrsula Mattioli Mello
This paper is part of my bachelor thesis developed under the
supervision of Professor Ana Maria Hermeto (CEDEPLAR/UFMG)
Brasília
July 2013
• Motivation
• Literature review
– Anti-poverty policy
– Brazilian scenario
– Local social policy
• Descriptive analysis
– Opportunity index
– Municipal expenditure
• Regression model
• Concluding remarks
AGENDA
AGENDA
• Motivation
• Literature review
– Anti-poverty policy
– Brazilian scenario
– Local social policy
• Descriptive analysis
– Opportunity index
– Municipal expenditure
• Regression model
• Concluding remarks
AGENDA
AGENDA
• Deep social transformation in Brazil
• “Poverty reduction without economic growth”(Ferreira,
Leite & Ravallion, 2007)
• The role of social policy
• New clusters for policy
• Human development policy
MOTIVATION
MOTIVATION
• Motivation
• Literature review
– Anti-poverty policy
– Brazilian scenario
– Local social policy
• Descriptive analysis
– Opportunity index
– Municipal expenditure
• Regression model
• Concluding remarks
AGENDA
AGENDA
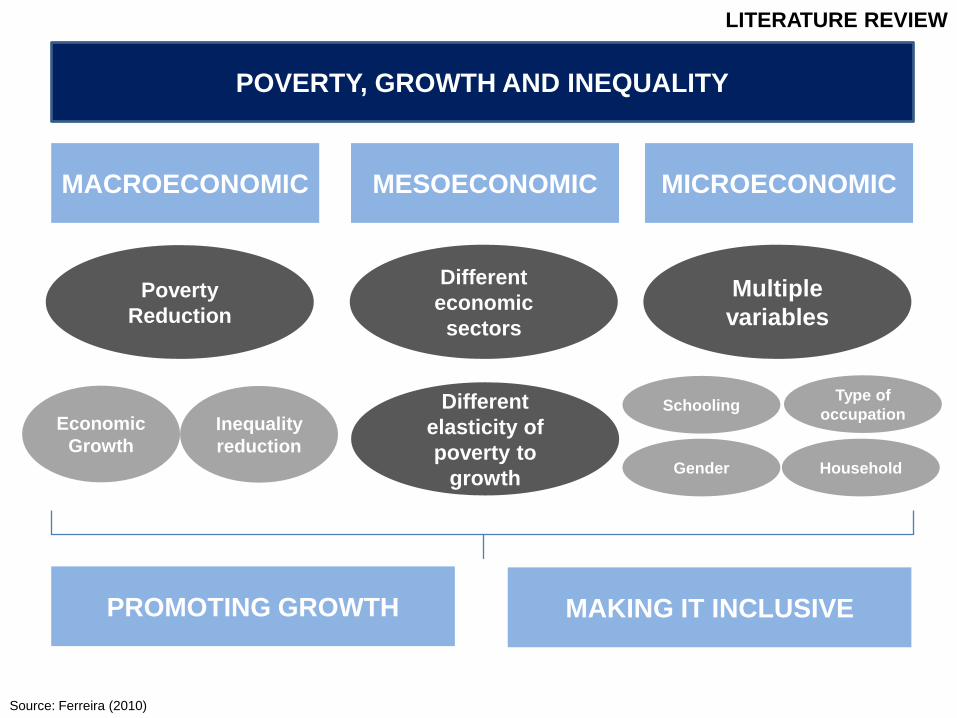
POVERTY, GROWTH AND INEQUALITY
LITERATURE REVIEW
MACROECONOMIC MESOECONOMIC MICROECONOMIC
PROMOTING GROWTH MAKING IT INCLUSIVE
Poverty
Reduction
Inequality
reduction
Schooling
Different
economic
sectors
Multiple
variables
Different
elasticity of
poverty to
growth
Type of
occupation
Gender Household
Source: Ferreira (2010)
Economic
Growth
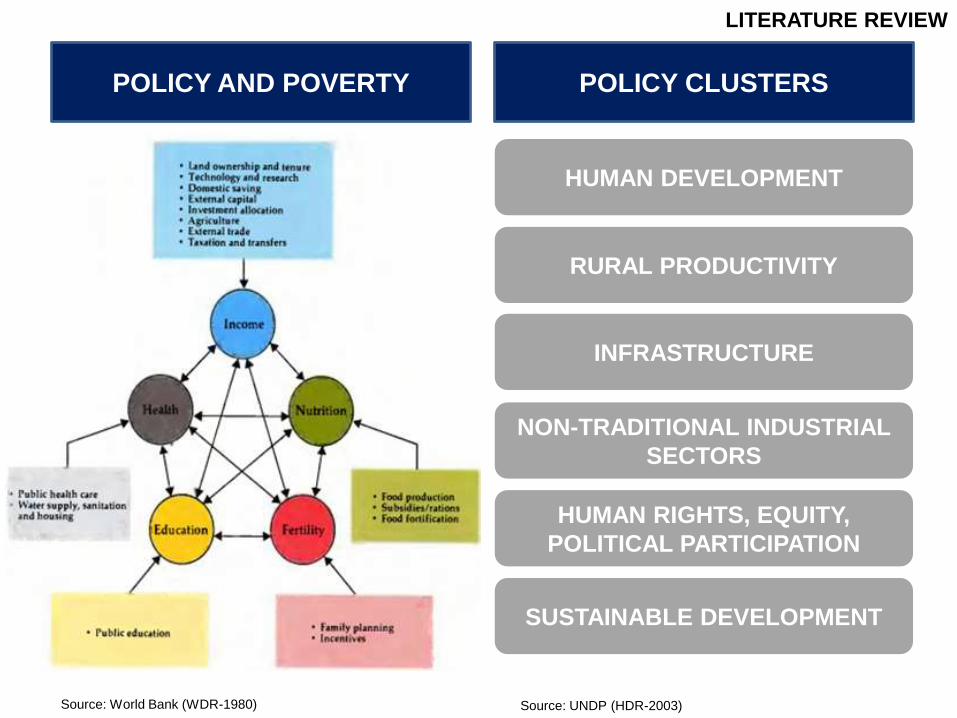
POLICY AND POVERTY
LITERATURE REVIEW
POLICY CLUSTERS
Source: World Bank (WDR-1980) Source: UNDP (HDR-2003)
HUMAN DEVELOPMENT
RURAL PRODUCTIVITY
INFRASTRUCTURE
NON-TRADITIONAL INDUSTRIAL
SECTORS
HUMAN RIGHTS, EQUITY,
POLITICAL PARTICIPATION
SUSTAINABLE DEVELOPMENT
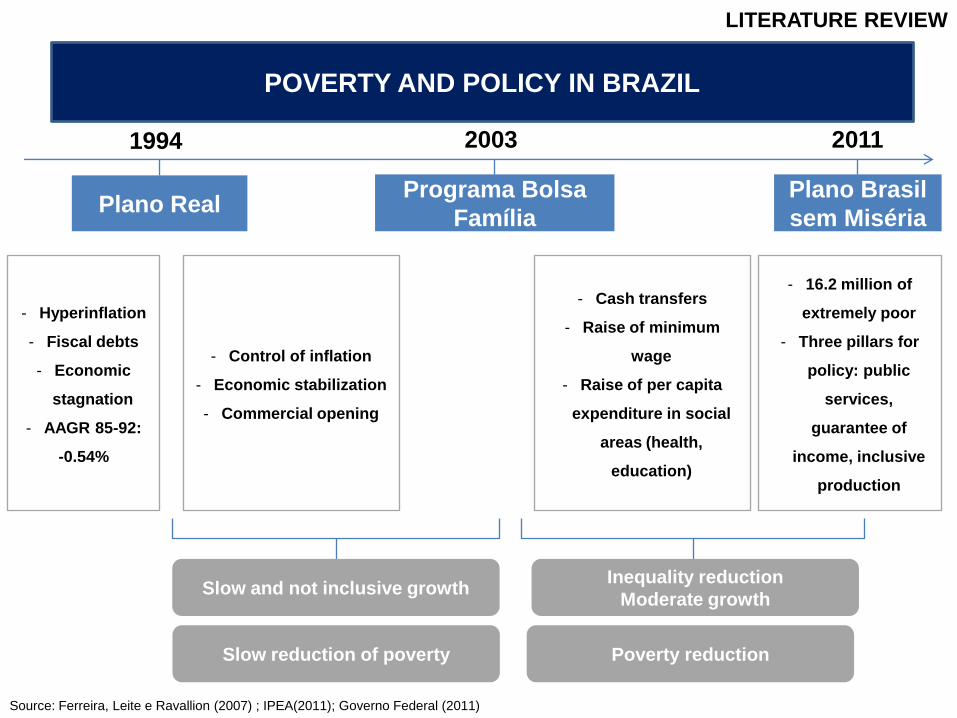
POVERTY AND POLICY IN BRAZIL
Plano Brasil
sem Miséria
Programa Bolsa
FamíliaPlano Real
- Hyperinflation
- Fiscal debts
- Economic
stagnation
- AAGR 85-92:
-0.54%
1994 2003 2011
- Control of inflation
- Economic stabilization
- Commercial opening
- Cash transfers
- Raise of minimum
wage
- Raise of per capita
expenditure in social
areas (health,
education)
- 16.2 million of
extremely poor
- Three pillars for
policy: public
services,
guarantee of
income, inclusive
production
Slow and not inclusive growthInequality reduction
Moderate growth
Slow reduction of poverty Poverty reduction
Source: Ferreira, Leite e Ravallion (2007) ; IPEA(2011); Governo Federal (2011)
LITERATURE REVIEW
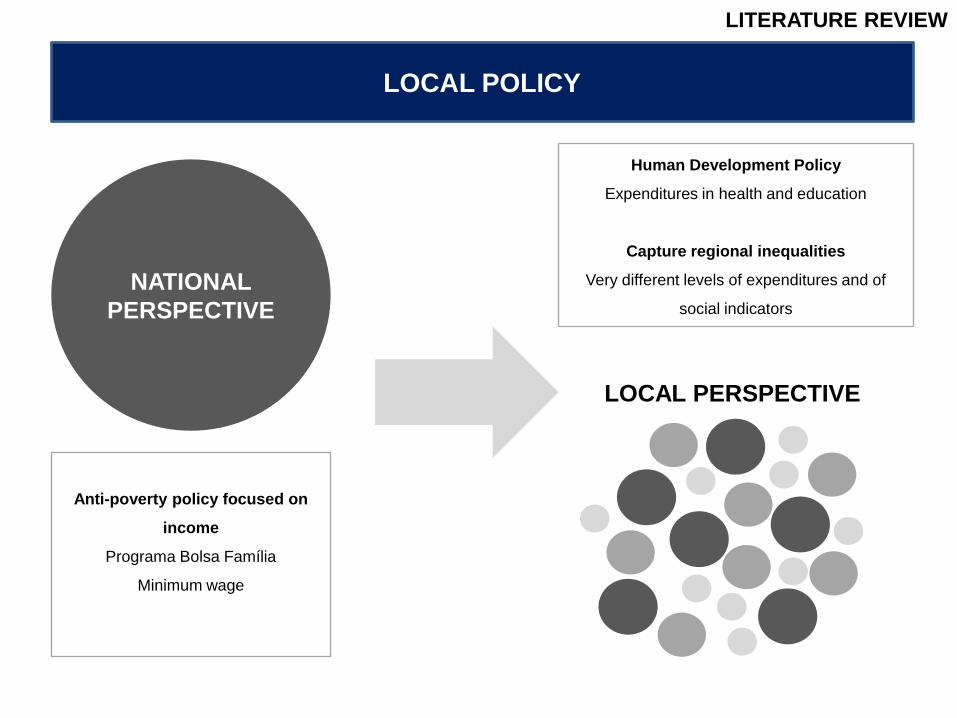
LOCAL POLICY
LITERATURE REVIEW
NATIONAL
PERSPECTIVE
LOCAL PERSPECTIVE
Anti-poverty policy focused on
income
Programa Bolsa Família
Minimum wage
Human Development Policy
Expenditures in health and education
Capture regional inequalities
Very different levels of expenditures and of
social indicators

• Motivation
• Literature review
– Anti-poverty policy
– Brazilian scenario
– Local social policy
• Descriptive analysis
– Opportunity index
– Municipal expenditure
• Regression model
• Concluding remarks
AGENDA
AGENDA
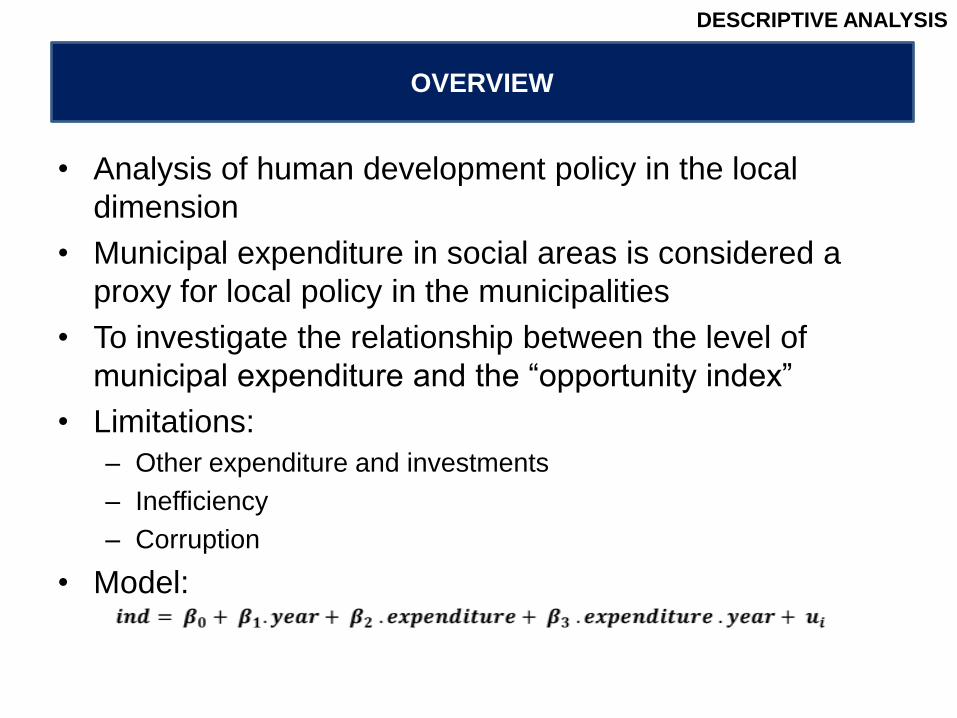
OVERVIEW
DESCRIPTIVE ANALYSIS
• Analysis of human development policy in the local
dimension
• Municipal expenditure in social areas is considered a
proxy for local policy in the municipalities
• To investigate the relationship between the level of
municipal expenditure and the “opportunity index”
• Limitations:
– Other expenditure and investments
– Inefficiency
– Corruption
• Model:
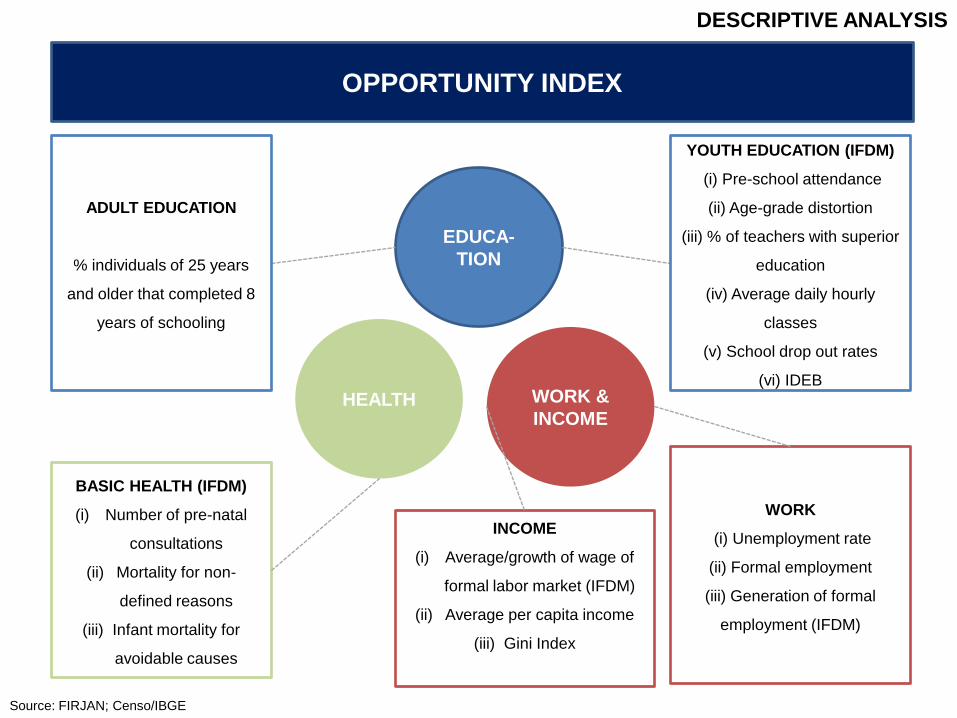
OPPORTUNITY INDEX
DESCRIPTIVE ANALYSIS
EDUCA-
TION
WORK &
INCOMEHEALTH
YOUTH EDUCATION (IFDM)
(i) Pre-school attendance
(ii) Age-grade distortion
(iii) % of teachers with superior
education
(iv) Average daily hourly
classes
(v) School drop out rates
(vi) IDEB
ADULT EDUCATION
% individuals of 25 years
and older that completed 8
years of schooling
BASIC HEALTH (IFDM)
(i) Number of pre-natal
consultations
(ii) Mortality for non-
defined reasons
(iii) Infant mortality for
avoidable causes
Source: FIRJAN; Censo/IBGE
WORK
(i) Unemployment rate
(ii) Formal employment
(iii) Generation of formal
employment (IFDM)
INCOME
(i) Average/growth of wage of
formal labor market (IFDM)
(ii) Average per capita income
(iii) Gini Index
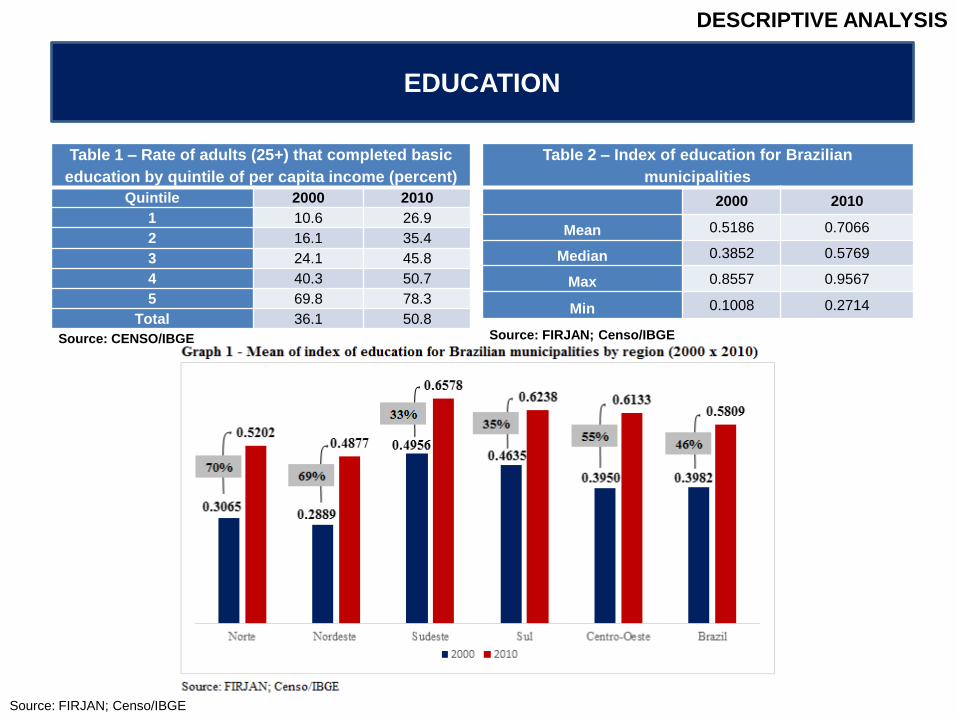
EDUCATION
DESCRIPTIVE ANALYSIS
Source: FIRJAN; Censo/IBGE
Table 1 – Rate of adults (25+) that completed basic
education by quintile of per capita income (percent)
Quintile 2000 2010
1 10.6 26.9
2 16.1 35.4
3 24.1 45.8
4 40.3 50.7
5 69.8 78.3
Total 36.1 50.8
Source: CENSO/IBGE
Table 2 – Index of education for Brazilian
municipalities
2000 2010
Mean 0.5186 0.7066
Median 0.3852 0.5769
Max 0.8557 0.9567
Min 0.1008 0.2714
Source: FIRJAN; Censo/IBGE
HEALTH
DESCRIPTIVE ANALYSIS
Source: FIRJAN; Censo/IBGE
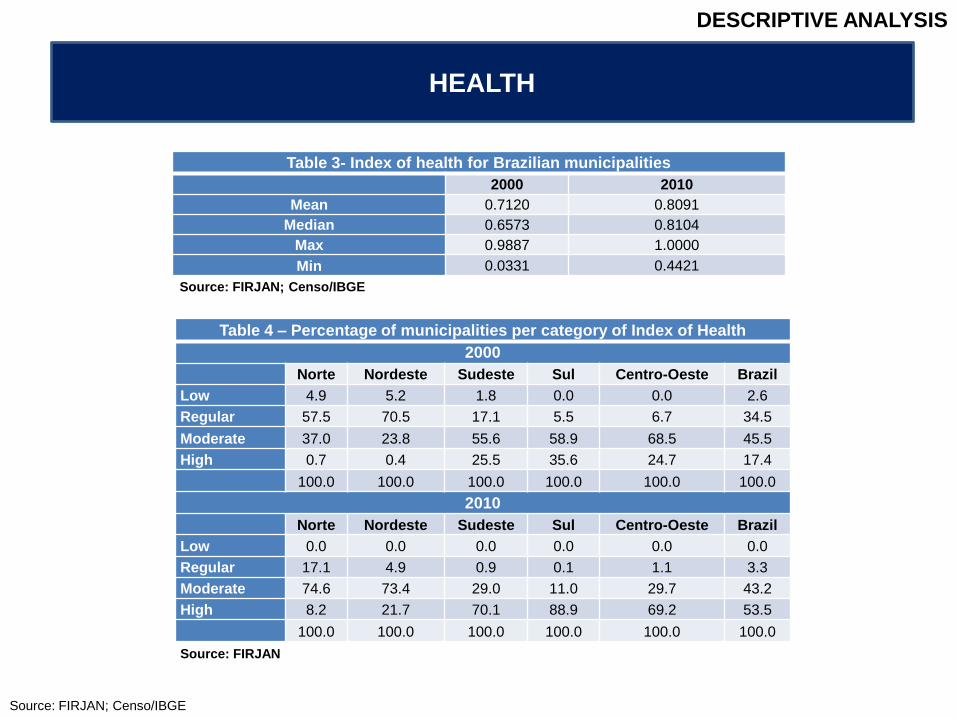
Table 3- Index of health for Brazilian municipalities
2000 2010
Mean 0.7120 0.8091
Median 0.6573 0.8104
Max 0.9887 1.0000
Min 0.0331 0.4421
Source: FIRJAN; Censo/IBGE
Table 4 – Percentage of municipalities per category of Index of Health
2000
Norte Nordeste Sudeste Sul Centro-Oeste Brazil
Low 4.9 5.2 1.8 0.0 0.0 2.6
Regular 57.5 70.5 17.1 5.5 6.7 34.5
Moderate 37.0 23.8 55.6 58.9 68.5 45.5
High 0.7 0.4 25.5 35.6 24.7 17.4
100.0 100.0 100.0 100.0 100.0 100.0
2010
Norte Nordeste Sudeste Sul Centro-Oeste Brazil
Low 0.0 0.0 0.0 0.0 0.0 0.0
Regular 17.1 4.9 0.9 0.1 1.1 3.3
Moderate 74.6 73.4 29.0 11.0 29.7 43.2
High 8.2 21.7 70.1 88.9 69.2 53.5
100.0 100.0 100.0 100.0 100.0 100.0
Source: FIRJAN
WORK & INCOME
DESCRIPTIVE ANALYSIS
Source: FIRJAN; Censo/IBGE
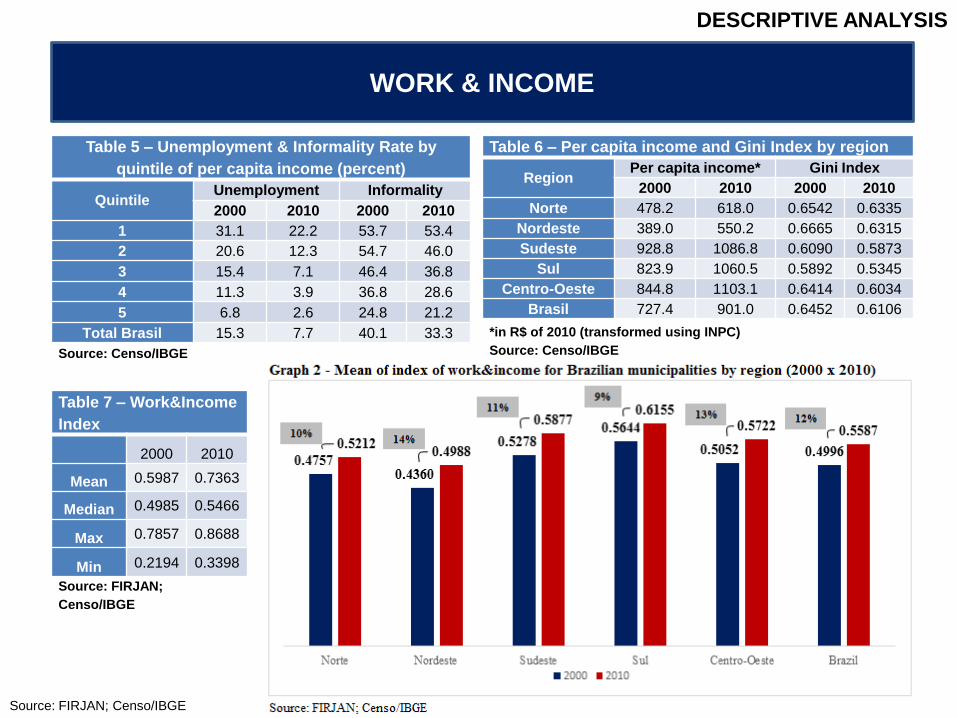
Table 5 – Unemployment & Informality Rate by
quintile of per capita income (percent)
QuintileUnemployment Informality
2000 2010 2000 2010
1 31.1 22.2 53.7 53.4
2 20.6 12.3 54.7 46.0
3 15.4 7.1 46.4 36.8
4 11.3 3.9 36.8 28.6
5 6.8 2.6 24.8 21.2
Total Brasil 15.3 7.7 40.1 33.3
Source: Censo/IBGE
Table 6 – Per capita income and Gini Index by region
RegionPer capita income* Gini Index
2000 2010 2000 2010
Norte 478.2 618.0 0.6542 0.6335
Nordeste 389.0 550.2 0.6665 0.6315
Sudeste 928.8 1086.8 0.6090 0.5873
Sul 823.9 1060.5 0.5892 0.5345
Centro-Oeste 844.8 1103.1 0.6414 0.6034
Brasil 727.4 901.0 0.6452 0.6106
*in R$ of 2010 (transformed using INPC)
Source: Censo/IBGE
Table 7 – Work&Income
Index
2000 2010
Mean 0.5987 0.7363
Median 0.4985 0.5466
Max 0.7857 0.8688
Min 0.2194 0.3398
Source: FIRJAN;
Censo/IBGE
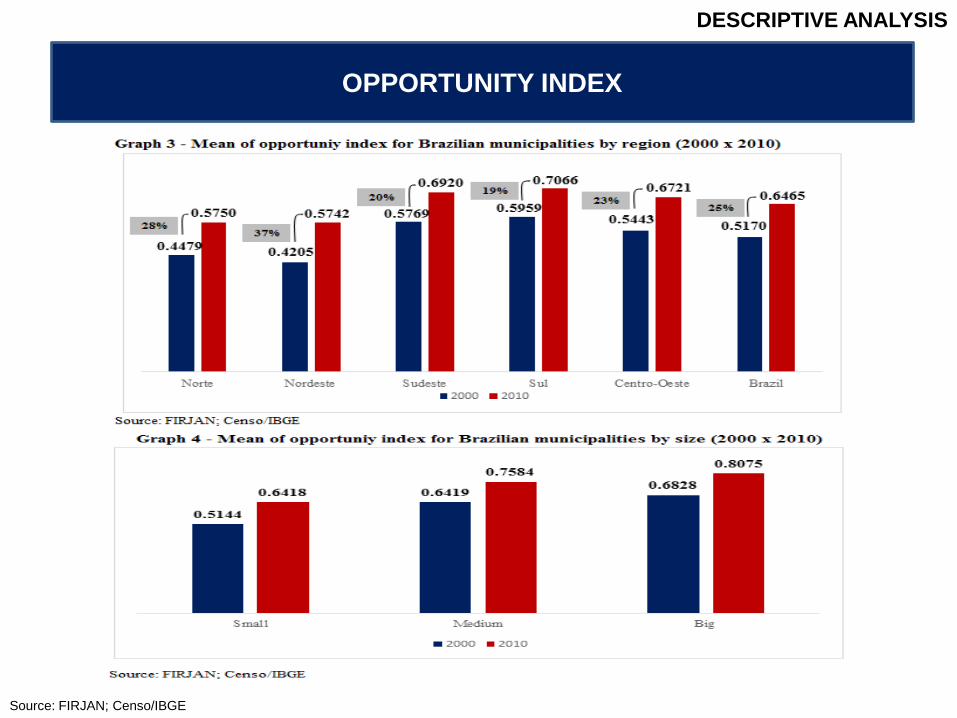
OPPORTUNITY INDEX
DESCRIPTIVE ANALYSIS
Source: FIRJAN; Censo/IBGE
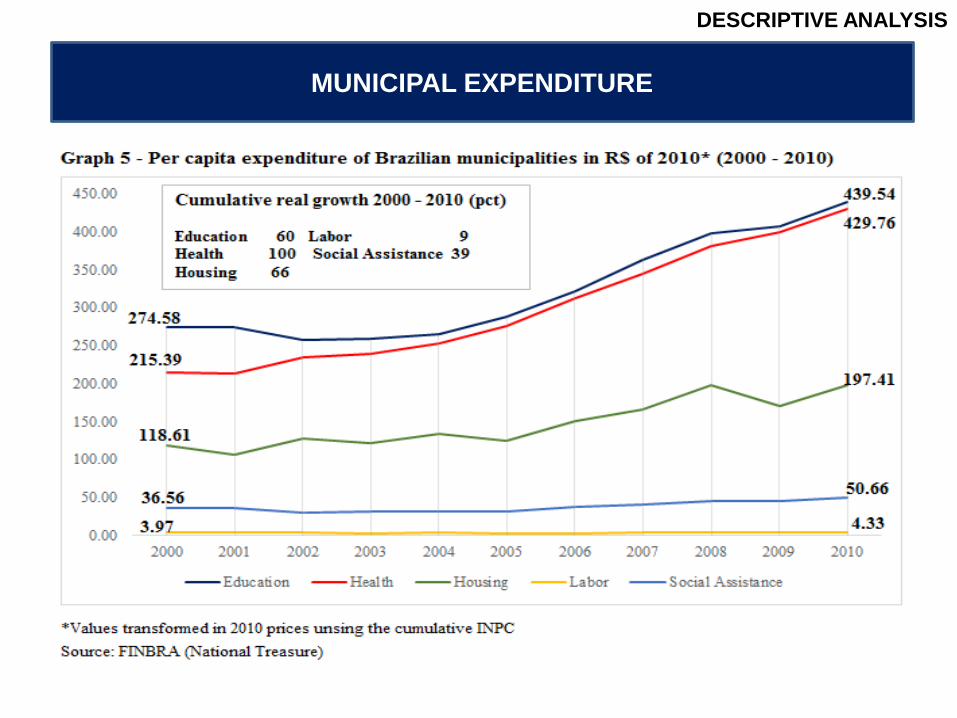
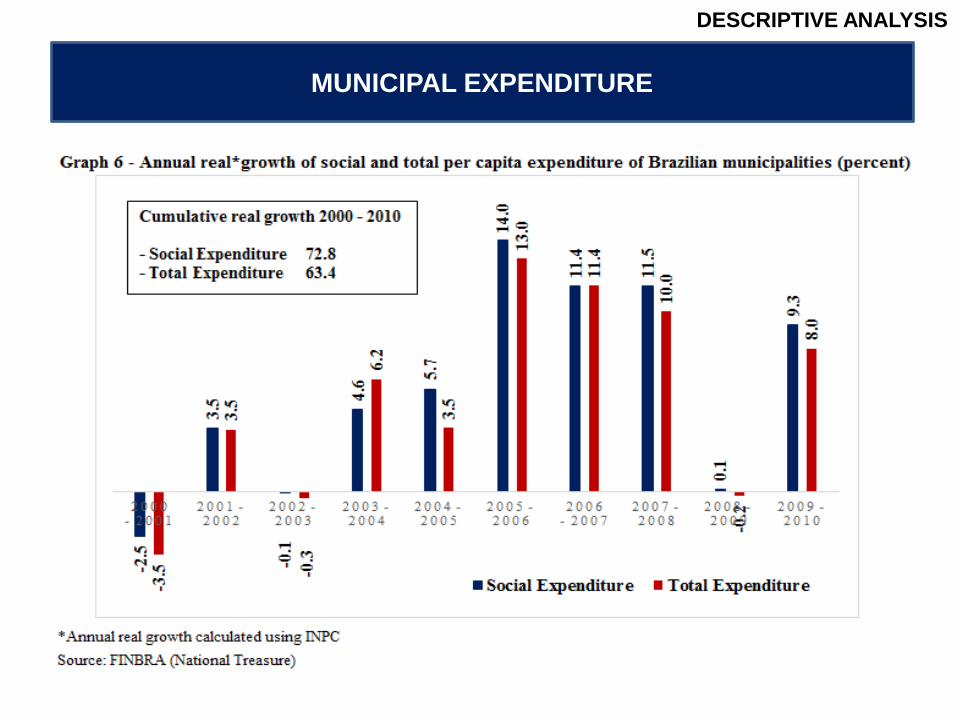
MUNICIPAL EXPENDITURE
DESCRIPTIVE ANALYSIS
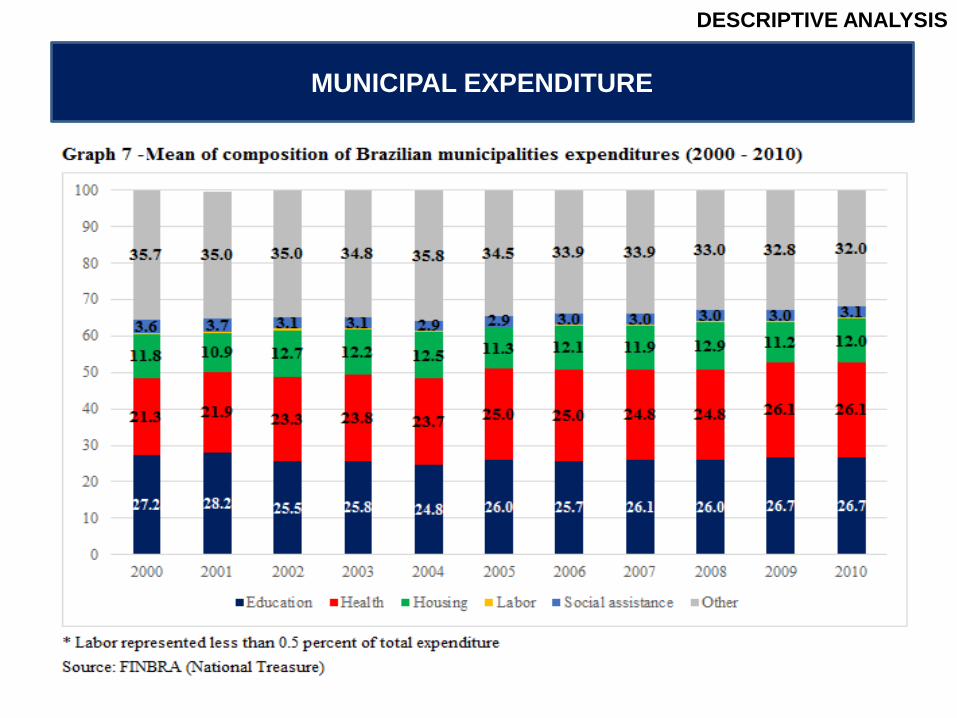
MUNICIPAL EXPENDITURE
DESCRIPTIVE ANALYSIS
MUNICIPAL EXPENDITURE
DESCRIPTIVE ANALYSIS
• Motivation
• Literature review
– Anti-poverty policy
– Brazilian scenario
– Local social policy
• Descriptive analysis
– Opportunity index
– Municipal expenditure
• Regression model
• Concluding remarks
AGENDA
AGENDA
• Motivation
• Literature review
– Human development
– Poverty
– Policy
– Brazilian scenario
• Descriptive analysis
– Opportunity index
– Municipal expenditure
• Regression model
• Concluding remarks
AGENDA
AGENDA
CONCLUDING REMARKS
CONCLUDING REMARKS
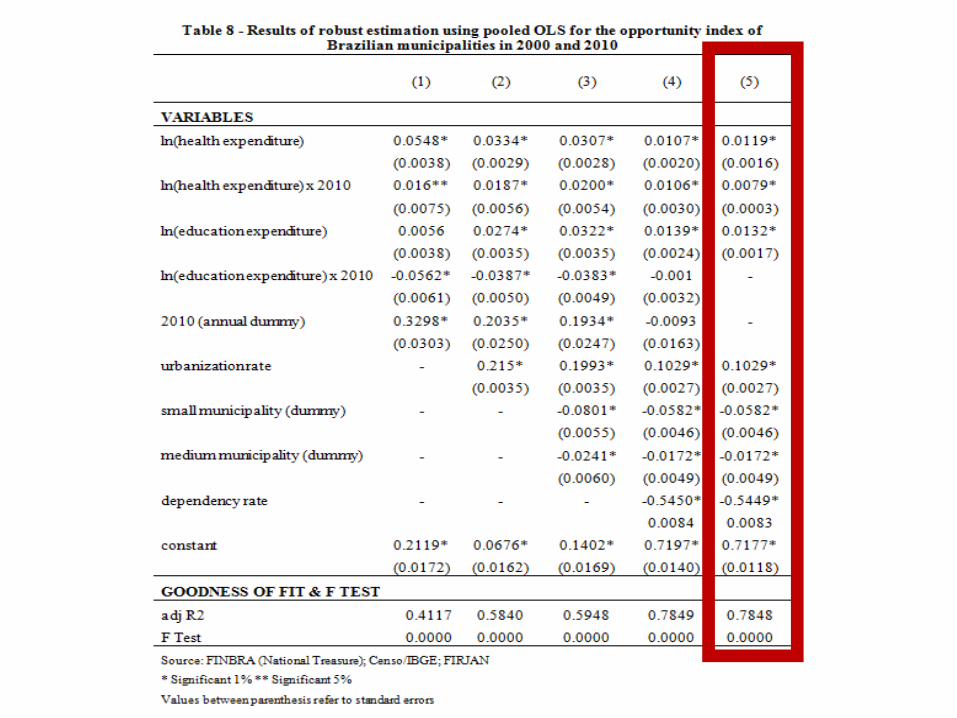
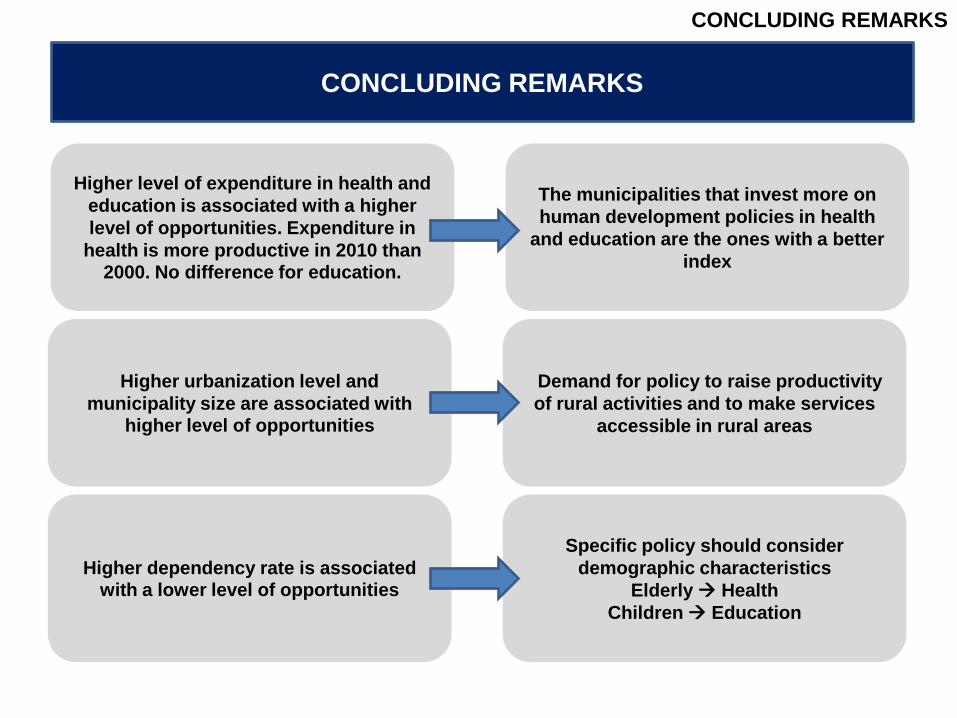
Higher level of expenditure in health and
education is associated with a higher
level of opportunities. Expenditure in
health is more productive in 2010 than 2000. No difference for education.
Higher urbanization level and
municipality size are associated with higher level of opportunities
Higher dependency rate is associated with a lower level of opportunities
The municipalities that invest more on
human development policies in health
and education are the ones with a better
index
Demand for policy to raise productivity
of rural activities and to make services
accessible in rural areas
Specific policy should consider
demographic characteristics
Elderly Health
Children Education

Thank you!