hsm vol. 3 (part c) module hsm predictive method...
TRANSCRIPT
Module 4b: Spreadsheets
Module 4b ‐ 1HSM Training
MODULE 4B. HSM PREDICTIVE METHOD SPREADSHEET TOOLS AND EXAMPLES
HSM Vol. 3 (Part C)
1
Module 4b: Spreadsheets
Module 4b ‐ 2HSM Training
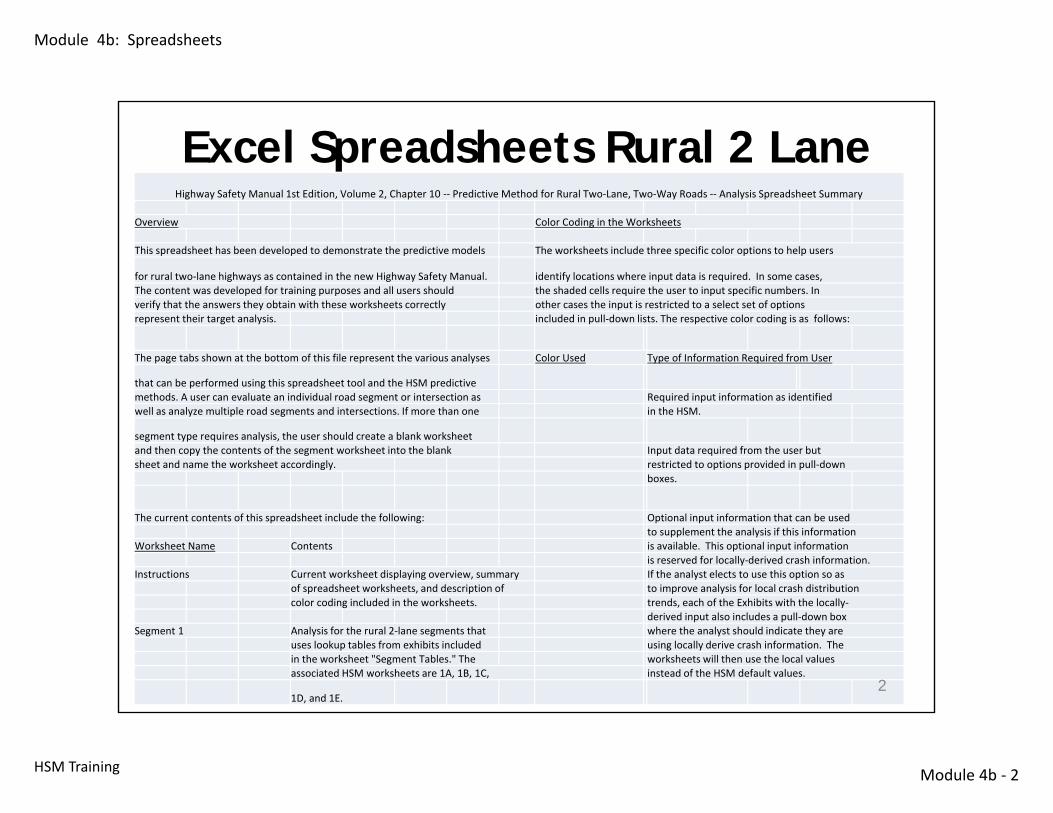
Excel Spreadsheets Rural 2 LaneHighway Safety Manual 1st Edition, Volume 2, Chapter 10 ‐‐ Predictive Method for Rural Two‐Lane, Two‐Way Roads ‐‐ Analysis Spreadsheet Summary
Overview Color Coding in the Worksheets
This spreadsheet has been developed to demonstrate the predictive models The worksheets include three specific color options to help users
for rural two‐lane highways as contained in the new Highway Safety Manual. identify locations where input data is required. In some cases,The content was developed for training purposes and all users should the shaded cells require the user to input specific numbers. Inverify that the answers they obtain with these worksheets correctly other cases the input is restricted to a select set of optionsrepresent their target analysis. included in pull‐down lists. The respective color coding is as follows:
The page tabs shown at the bottom of this file represent the various analyses Color Used Type of Information Required from User
that can be performed using this spreadsheet tool and the HSM predictivemethods. A user can evaluate an individual road segment or intersection as Required input information as identifiedwell as analyze multiple road segments and intersections. If more than one in the HSM.
segment type requires analysis, the user should create a blank worksheetand then copy the contents of the segment worksheet into the blank Input data required from the user but sheet and name the worksheet accordingly. restricted to options provided in pull‐down
boxes.
The current contents of this spreadsheet include the following: Optional input information that can be usedto supplement the analysis if this information
Worksheet Name Contents is available. This optional input informationis reserved for locally‐derived crash information.
Instructions Current worksheet displaying overview, summary If the analyst elects to use this option so asof spreadsheet worksheets, and description of to improve analysis for local crash distributioncolor coding included in the worksheets. trends, each of the Exhibits with the locally‐
derived input also includes a pull‐down boxSegment 1 Analysis for the rural 2‐lane segments that where the analyst should indicate they are
uses lookup tables from exhibits included using locally derive crash information. Thein the worksheet "Segment Tables." The worksheets will then use the local valuesassociated HSM worksheets are 1A, 1B, 1C, instead of the HSM default values.
1D, and 1E.2
Module 4b: Spreadsheets
Module 4b ‐ 3HSM Training
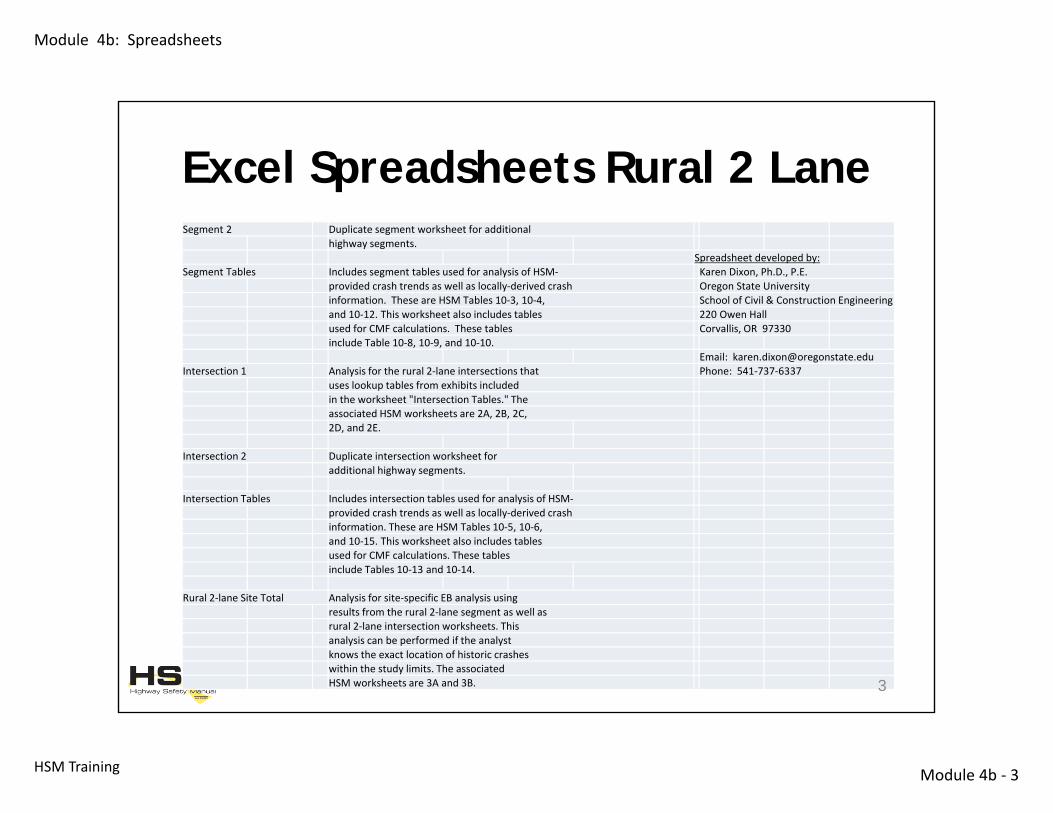
Segment 2 Duplicate segment worksheet for additionalhighway segments.
Spreadsheet developed by:Segment Tables Includes segment tables used for analysis of HSM‐ Karen Dixon, Ph.D., P.E.
provided crash trends as well as locally‐derived crash Oregon State Universityinformation. These are HSM Tables 10‐3, 10‐4, School of Civil & Construction Engineeringand 10‐12. This worksheet also includes tables 220 Owen Hallused for CMF calculations. These tables Corvallis, OR 97330include Table 10‐8, 10‐9, and 10‐10.
Email: [email protected] 1 Analysis for the rural 2‐lane intersections that Phone: 541‐737‐6337
uses lookup tables from exhibits includedin the worksheet "Intersection Tables." Theassociated HSM worksheets are 2A, 2B, 2C,2D, and 2E.
Intersection 2 Duplicate intersection worksheet foradditional highway segments.
Intersection Tables Includes intersection tables used for analysis of HSM‐provided crash trends as well as locally‐derived crashinformation. These are HSM Tables 10‐5, 10‐6,and 10‐15. This worksheet also includes tablesused for CMF calculations. These tablesinclude Tables 10‐13 and 10‐14.
Rural 2‐lane Site Total Analysis for site‐specific EB analysis usingresults from the rural 2‐lane segment as well asrural 2‐lane intersection worksheets. Thisanalysis can be performed if the analystknows the exact location of historic crasheswithin the study limits. The associatedHSM worksheets are 3A and 3B.
Excel Spreadsheets Rural 2 Lane
3
Module 4b: Spreadsheets
Module 4b ‐ 4HSM Training
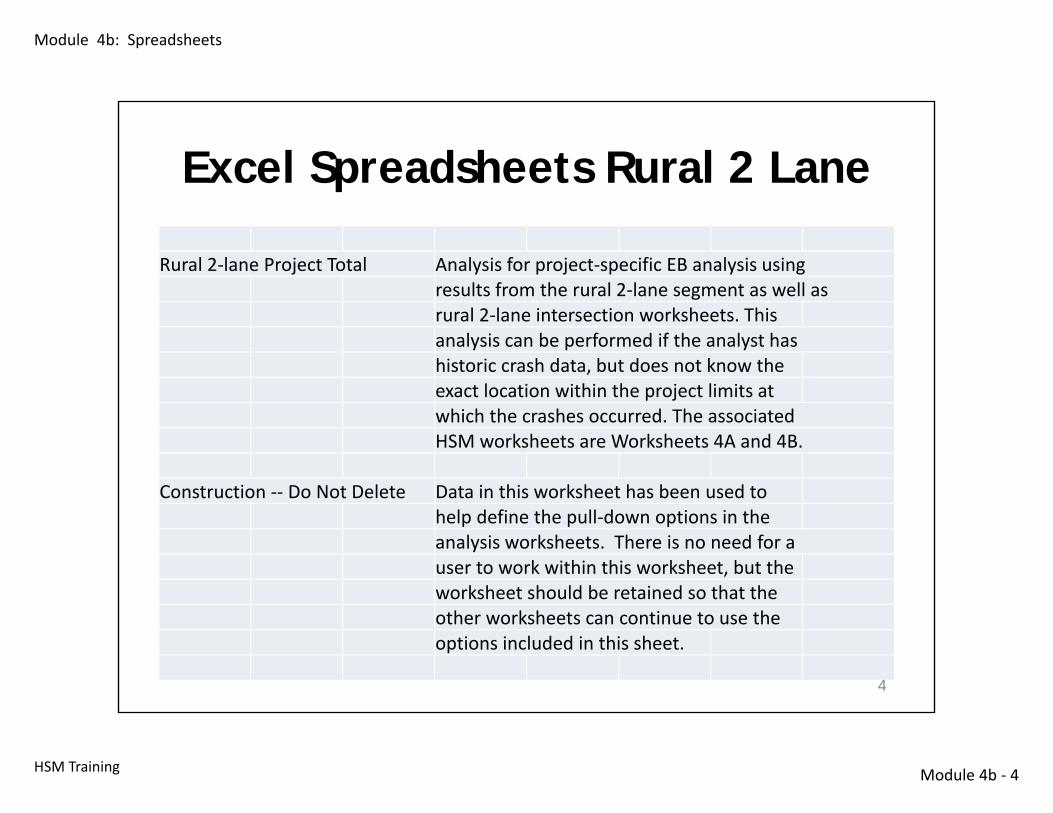
Rural 2‐lane Project Total Analysis for project‐specific EB analysis using results from the rural 2‐lane segment as well asrural 2‐lane intersection worksheets. Thisanalysis can be performed if the analyst hashistoric crash data, but does not know theexact location within the project limits atwhich the crashes occurred. The associatedHSM worksheets are Worksheets 4A and 4B.
Construction ‐‐ Do Not Delete Data in this worksheet has been used tohelp define the pull‐down options in theanalysis worksheets. There is no need for auser to work within this worksheet, but theworksheet should be retained so that theother worksheets can continue to use theoptions included in this sheet.
Excel Spreadsheets Rural 2 Lane
4
Module 4b: Spreadsheets
Module 4b ‐ 5HSM Training
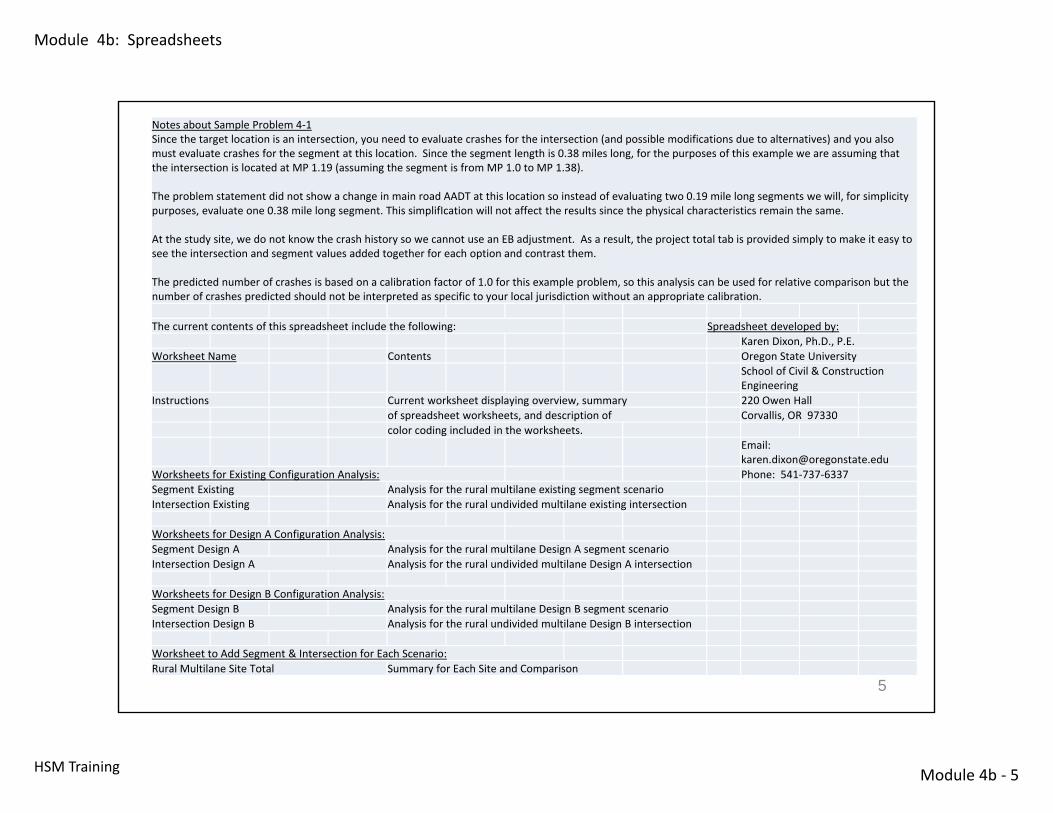
Notes about Sample Problem 4‐1Since the target location is an intersection, you need to evaluate crashes for the intersection (and possible modifications due to alternatives) and you also must evaluate crashes for the segment at this location. Since the segment length is 0.38 miles long, for the purposes of this example we are assuming that the intersection is located at MP 1.19 (assuming the segment is from MP 1.0 to MP 1.38).
The problem statement did not show a change in main road AADT at this location so instead of evaluating two 0.19 mile long segments we will, for simplicity purposes, evaluate one 0.38 mile long segment. This simplifIcation will not affect the results since the physical characteristics remain the same.
At the study site, we do not know the crash history so we cannot use an EB adjustment. As a result, the project total tab is provided simply to make it easy to see the intersection and segment values added together for each option and contrast them.
The predicted number of crashes is based on a calibration factor of 1.0 for this example problem, so this analysis can be used for relative comparison but the number of crashes predicted should not be interpreted as specific to your local jurisdiction without an appropriate calibration.
The current contents of this spreadsheet include the following: Spreadsheet developed by:Karen Dixon, Ph.D., P.E.
Worksheet Name Contents Oregon State UniversitySchool of Civil & Construction Engineering
Instructions Current worksheet displaying overview, summary 220 Owen Hallof spreadsheet worksheets, and description of Corvallis, OR 97330color coding included in the worksheets.
Email: [email protected]
Worksheets for Existing Configuration Analysis: Phone: 541‐737‐6337Segment Existing Analysis for the rural multilane existing segment scenarioIntersection Existing Analysis for the rural undivided multilane existing intersection
Worksheets for Design A Configuration Analysis:Segment Design A Analysis for the rural multilane Design A segment scenarioIntersection Design A Analysis for the rural undivided multilane Design A intersection
Worksheets for Design B Configuration Analysis:Segment Design B Analysis for the rural multilane Design B segment scenarioIntersection Design B Analysis for the rural undivided multilane Design B intersection
Worksheet to Add Segment & Intersection for Each Scenario:Rural Multilane Site Total Summary for Each Site and Comparison
5
Module 4b: Spreadsheets
Module 4b ‐ 6HSM Training
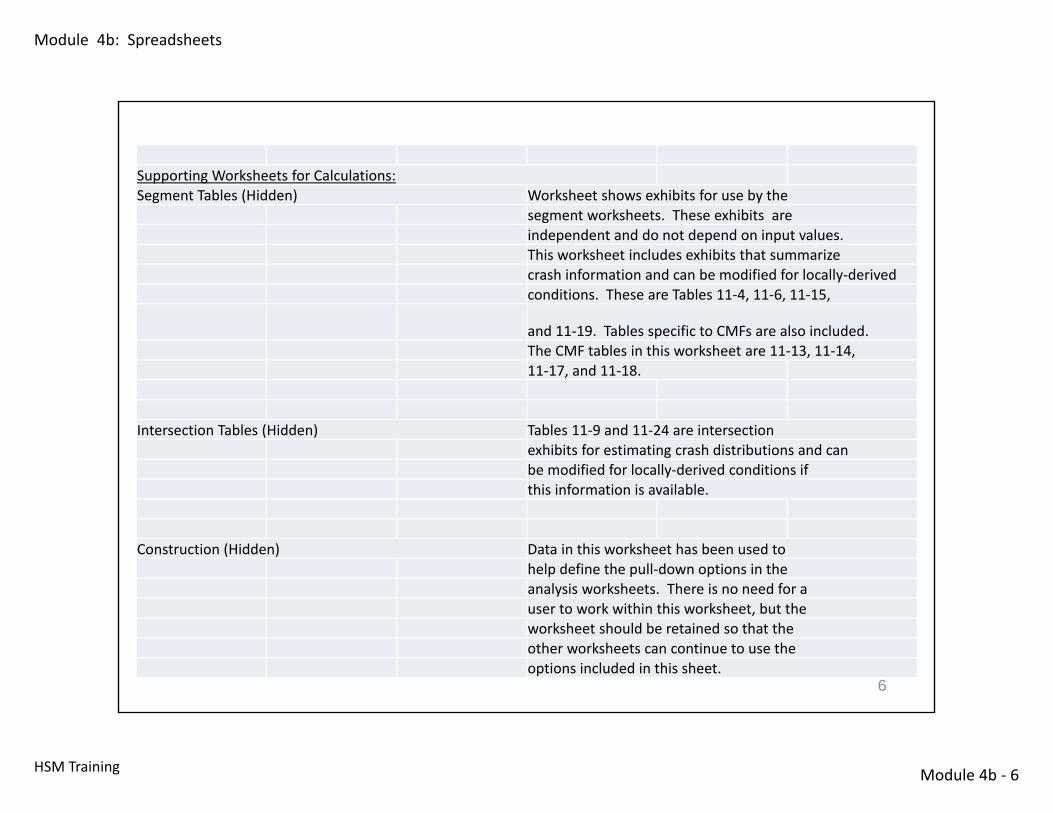
Supporting Worksheets for Calculations:Segment Tables (Hidden) Worksheet shows exhibits for use by the
segment worksheets. These exhibits areindependent and do not depend on input values.This worksheet includes exhibits that summarize crash information and can be modified for locally‐derivedconditions. These are Tables 11‐4, 11‐6, 11‐15,
and 11‐19. Tables specific to CMFs are also included.The CMF tables in this worksheet are 11‐13, 11‐14,11‐17, and 11‐18.
Intersection Tables (Hidden) Tables 11‐9 and 11‐24 are intersectionexhibits for estimating crash distributions and canbe modified for locally‐derived conditions ifthis information is available.
Construction (Hidden) Data in this worksheet has been used tohelp define the pull‐down options in theanalysis worksheets. There is no need for auser to work within this worksheet, but theworksheet should be retained so that theother worksheets can continue to use theoptions included in this sheet.
6
Module 4b: Spreadsheets
Module 4b ‐ 7HSM Training
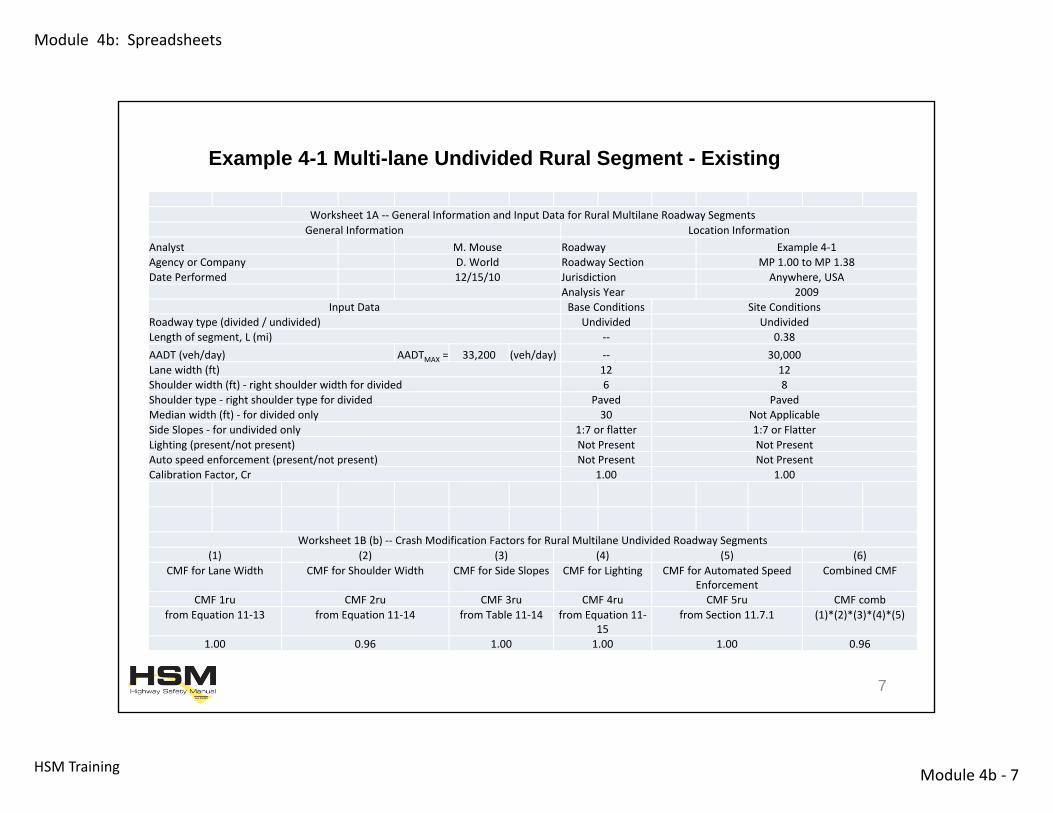
Worksheet 1A ‐‐ General Information and Input Data for Rural Multilane Roadway SegmentsGeneral Information Location Information
Analyst M. Mouse Roadway Example 4‐1Agency or Company D. World Roadway Section MP 1.00 to MP 1.38Date Performed 12/15/10 Jurisdiction Anywhere, USA
Analysis Year 2009Input Data Base Conditions Site Conditions
Roadway type (divided / undivided) Undivided UndividedLength of segment, L (mi) ‐‐ 0.38AADT (veh/day) AADTMAX = 33,200 (veh/day) ‐‐ 30,000Lane width (ft) 12 12Shoulder width (ft) ‐ right shoulder width for divided 6 8Shoulder type ‐ right shoulder type for divided Paved PavedMedian width (ft) ‐ for divided only 30 Not ApplicableSide Slopes ‐ for undivided only 1:7 or flatter 1:7 or FlatterLighting (present/not present) Not Present Not PresentAuto speed enforcement (present/not present) Not Present Not PresentCalibration Factor, Cr 1.00 1.00
Worksheet 1B (b) ‐‐ Crash Modification Factors for Rural Multilane Undivided Roadway Segments(1) (2) (3) (4) (5) (6)
CMF for Lane Width CMF for Shoulder Width CMF for Side Slopes CMF for Lighting CMF for Automated Speed Enforcement
Combined CMF
CMF 1ru CMF 2ru CMF 3ru CMF 4ru CMF 5ru CMF combfrom Equation 11‐13 from Equation 11‐14 from Table 11‐14 from Equation 11‐
15from Section 11.7.1 (1)*(2)*(3)*(4)*(5)
1.00 0.96 1.00 1.00 1.00 0.96
Example 4-1 Multi-lane Undivided Rural Segment - Existing
7
Module 4b: Spreadsheets
Module 4b ‐ 8HSM Training
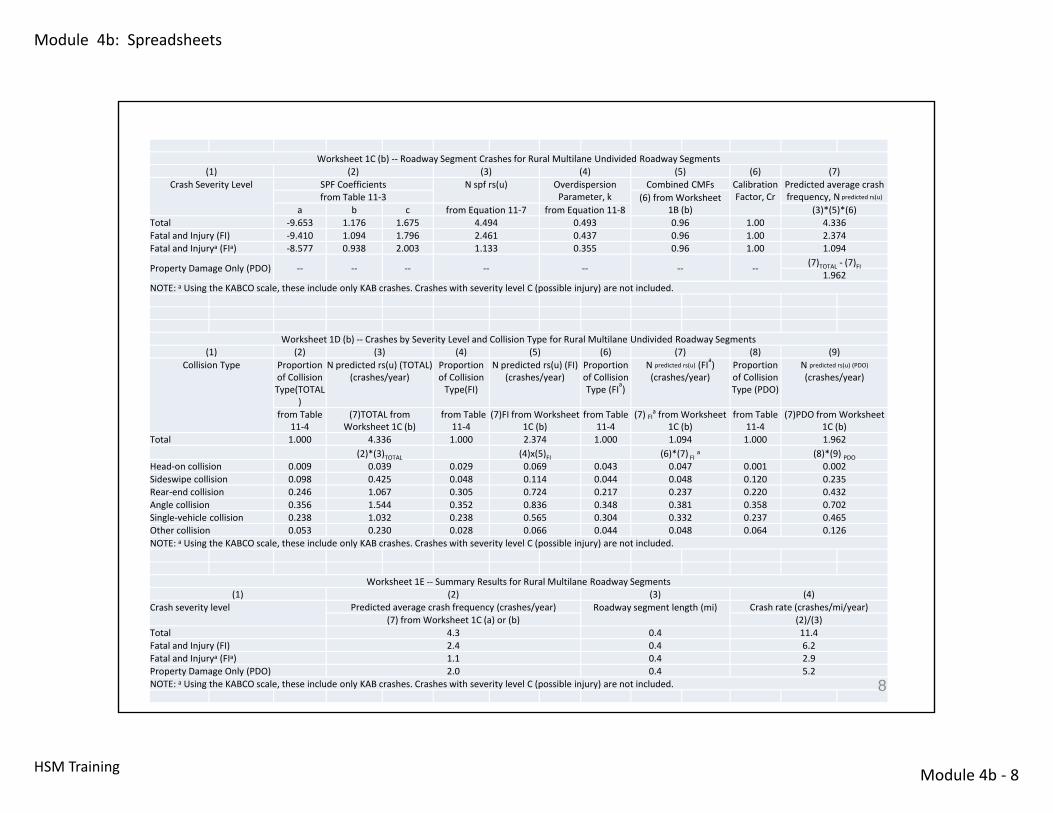
Worksheet 1C (b) ‐‐ Roadway Segment Crashes for Rural Multilane Undivided Roadway Segments(1) (2) (3) (4) (5) (6) (7)
Crash Severity Level SPF Coefficients N spf rs(u) Overdispersion Parameter, k
Combined CMFs Calibration Factor, Cr
Predicted average crash frequency, Npredicted rs(u)from Table 11‐3 (6) from Worksheet
1B (b)a b c from Equation 11‐7 from Equation 11‐8 (3)*(5)*(6)Total ‐9.653 1.176 1.675 4.494 0.493 0.96 1.00 4.336Fatal and Injury (FI) ‐9.410 1.094 1.796 2.461 0.437 0.96 1.00 2.374Fatal and Injurya (FIa) ‐8.577 0.938 2.003 1.133 0.355 0.96 1.00 1.094
Property Damage Only (PDO) ‐‐ ‐‐ ‐‐ ‐‐ ‐‐ ‐‐ ‐‐ (7)TOTAL ‐ (7)FI1.962
NOTE: a Using the KABCO scale, these include only KAB crashes. Crashes with severity level C (possible injury) are not included.
Worksheet 1D (b) ‐‐ Crashes by Severity Level and Collision Type for Rural Multilane Undivided Roadway Segments(1) (2) (3) (4) (5) (6) (7) (8) (9)
Collision Type Proportion of Collision Type(TOTAL
)
N predicted rs(u) (TOTAL) (crashes/year)
Proportion of Collision Type(FI)
N predicted rs(u) (FI) (crashes/year)
Proportion of Collision Type (FIa)
N predicted rs(u) (FIa) (crashes/year)
Proportion of Collision Type (PDO)
N predicted rs(u) (PDO) (crashes/year)
from Table 11‐4
(7)TOTAL from Worksheet 1C (b)
from Table 11‐4
(7)FI from Worksheet 1C (b)
from Table 11‐4
(7) FIa from Worksheet 1C (b)
from Table 11‐4
(7)PDO from Worksheet 1C (b)
Total 1.000 4.336 1.000 2.374 1.000 1.094 1.000 1.962(2)*(3)TOTAL (4)x(5)FI (6)*(7) FI a (8)*(9) PDO
Head‐on collision 0.009 0.039 0.029 0.069 0.043 0.047 0.001 0.002Sideswipe collision 0.098 0.425 0.048 0.114 0.044 0.048 0.120 0.235Rear‐end collision 0.246 1.067 0.305 0.724 0.217 0.237 0.220 0.432Angle collision 0.356 1.544 0.352 0.836 0.348 0.381 0.358 0.702Single‐vehicle collision 0.238 1.032 0.238 0.565 0.304 0.332 0.237 0.465Other collision 0.053 0.230 0.028 0.066 0.044 0.048 0.064 0.126NOTE: a Using the KABCO scale, these include only KAB crashes. Crashes with severity level C (possible injury) are not included.
Worksheet 1E ‐‐ Summary Results for Rural Multilane Roadway Segments(1) (2) (3) (4)
Crash severity level Predicted average crash frequency (crashes/year) Roadway segment length (mi) Crash rate (crashes/mi/year)(7) from Worksheet 1C (a) or (b) (2)/(3)
Total 4.3 0.4 11.4Fatal and Injury (FI) 2.4 0.4 6.2Fatal and Injurya (FIa) 1.1 0.4 2.9Property Damage Only (PDO) 2.0 0.4 5.2NOTE: a Using the KABCO scale, these include only KAB crashes. Crashes with severity level C (possible injury) are not included. 8
Module 4b: Spreadsheets
Module 4b ‐ 9HSM Training
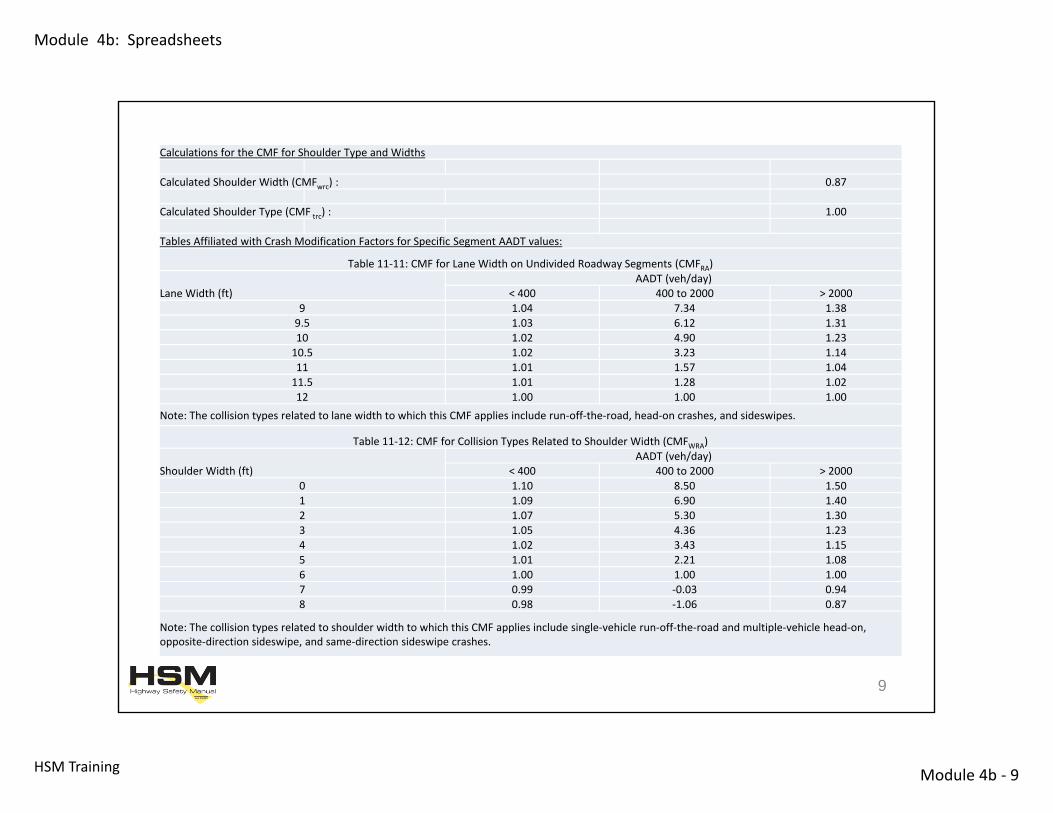
Calculations for the CMF for Shoulder Type and Widths
Calculated Shoulder Width (CMFwrc) : 0.87
Calculated Shoulder Type (CMF trc) : 1.00
Tables Affiliated with Crash Modification Factors for Specific Segment AADT values:
Table 11‐11: CMF for Lane Width on Undivided Roadway Segments (CMFRA)
Lane Width (ft)AADT (veh/day)
< 400 400 to 2000 > 20009 1.04 7.34 1.389.5 1.03 6.12 1.3110 1.02 4.90 1.2310.5 1.02 3.23 1.1411 1.01 1.57 1.0411.5 1.01 1.28 1.0212 1.00 1.00 1.00
Note: The collision types related to lane width to which this CMF applies include run‐off‐the‐road, head‐on crashes, and sideswipes.
Table 11‐12: CMF for Collision Types Related to Shoulder Width (CMFWRA)
Shoulder Width (ft)AADT (veh/day)
< 400 400 to 2000 > 20000 1.10 8.50 1.501 1.09 6.90 1.402 1.07 5.30 1.303 1.05 4.36 1.234 1.02 3.43 1.155 1.01 2.21 1.086 1.00 1.00 1.007 0.99 ‐0.03 0.948 0.98 ‐1.06 0.87
Note: The collision types related to shoulder width to which this CMF applies include single‐vehicle run‐off‐the‐road and multiple‐vehicle head‐on, opposite‐direction sideswipe, and same‐direction sideswipe crashes.
9
Module 4b: Spreadsheets
Module 4b ‐ 10HSM Training
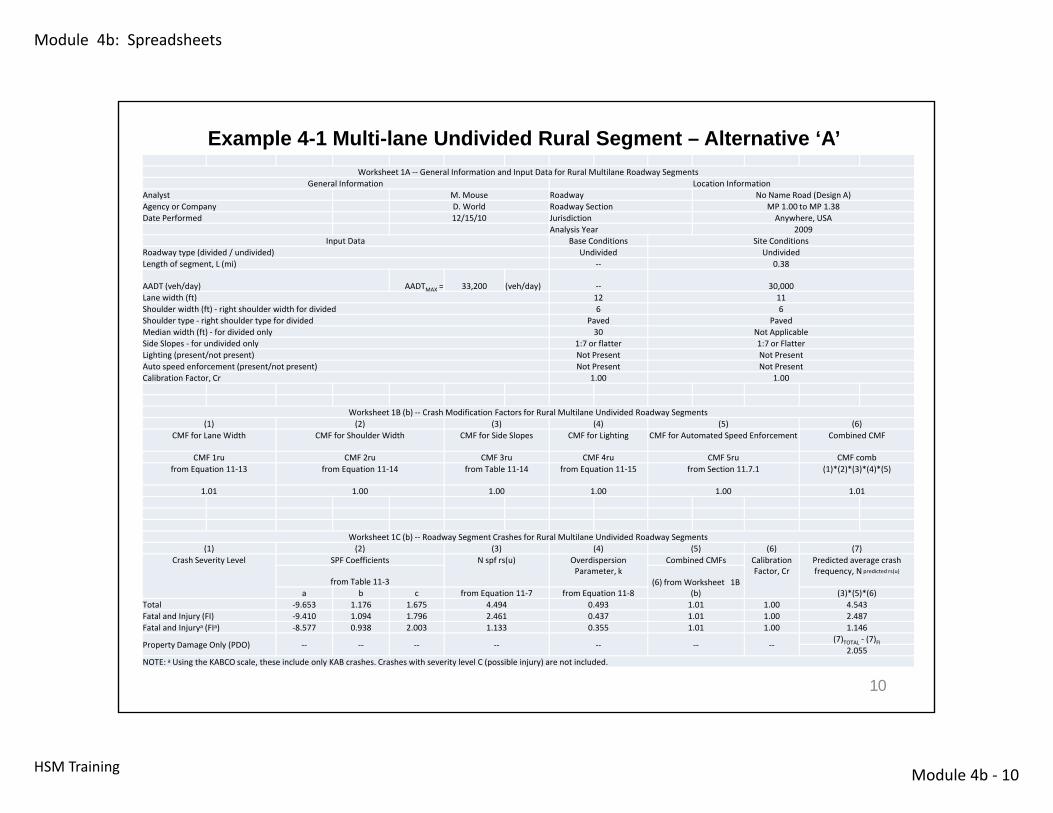
Example 4-1 Multi-lane Undivided Rural Segment – Alternative ‘A’Worksheet 1A ‐‐ General Information and Input Data for Rural Multilane Roadway Segments
General Information Location InformationAnalyst M. Mouse Roadway No Name Road (Design A)Agency or Company D. World Roadway Section MP 1.00 to MP 1.38Date Performed 12/15/10 Jurisdiction Anywhere, USA
Analysis Year 2009Input Data Base Conditions Site Conditions
Roadway type (divided / undivided) Undivided UndividedLength of segment, L (mi) ‐‐ 0.38
AADT (veh/day) AADTMAX = 33,200 (veh/day) ‐‐ 30,000Lane width (ft) 12 11Shoulder width (ft) ‐ right shoulder width for divided 6 6Shoulder type ‐ right shoulder type for divided Paved PavedMedian width (ft) ‐ for divided only 30 Not ApplicableSide Slopes ‐ for undivided only 1:7 or flatter 1:7 or FlatterLighting (present/not present) Not Present Not PresentAuto speed enforcement (present/not present) Not Present Not PresentCalibration Factor, Cr 1.00 1.00
Worksheet 1B (b) ‐‐ Crash Modification Factors for Rural Multilane Undivided Roadway Segments(1) (2) (3) (4) (5) (6)
CMF for Lane Width CMF for Shoulder Width CMF for Side Slopes CMF for Lighting CMF for Automated Speed Enforcement Combined CMF
CMF 1ru CMF 2ru CMF 3ru CMF 4ru CMF 5ru CMF combfrom Equation 11‐13 from Equation 11‐14 from Table 11‐14 from Equation 11‐15 from Section 11.7.1 (1)*(2)*(3)*(4)*(5)
1.01 1.00 1.00 1.00 1.00 1.01
Worksheet 1C (b) ‐‐ Roadway Segment Crashes for Rural Multilane Undivided Roadway Segments(1) (2) (3) (4) (5) (6) (7)
Crash Severity Level SPF Coefficients N spf rs(u) Overdispersion Parameter, k
Combined CMFs Calibration Factor, Cr
Predicted average crash frequency, Npredicted rs(u)
from Table 11‐3 (6) from Worksheet 1B (b)a b c from Equation 11‐7 from Equation 11‐8 (3)*(5)*(6)
Total ‐9.653 1.176 1.675 4.494 0.493 1.01 1.00 4.543Fatal and Injury (FI) ‐9.410 1.094 1.796 2.461 0.437 1.01 1.00 2.487Fatal and Injurya (FIa) ‐8.577 0.938 2.003 1.133 0.355 1.01 1.00 1.146
Property Damage Only (PDO) ‐‐ ‐‐ ‐‐ ‐‐ ‐‐ ‐‐ ‐‐(7)TOTAL ‐ (7)FI
2.055NOTE: a Using the KABCO scale, these include only KAB crashes. Crashes with severity level C (possible injury) are not included.
10
Module 4b: Spreadsheets
Module 4b ‐ 11HSM Training
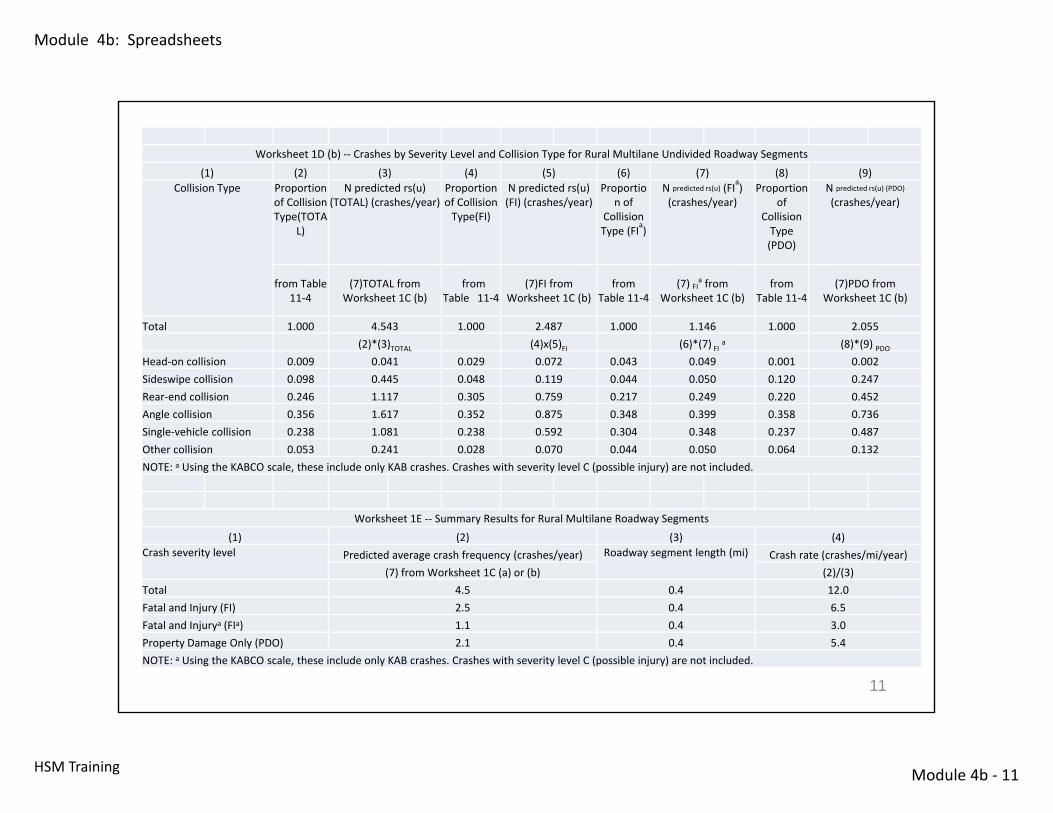
Worksheet 1D (b) ‐‐ Crashes by Severity Level and Collision Type for Rural Multilane Undivided Roadway Segments
(1) (2) (3) (4) (5) (6) (7) (8) (9)Collision Type Proportion
of Collision Type(TOTA
L)
N predicted rs(u) (TOTAL) (crashes/year)
Proportion of Collision Type(FI)
N predicted rs(u) (FI) (crashes/year)
Proportion of
Collision Type (FIa)
N predicted rs(u) (FIa) (crashes/year)
Proportion of
Collision Type (PDO)
N predicted rs(u) (PDO) (crashes/year)
from Table 11‐4
(7)TOTAL from Worksheet 1C (b)
from Table 11‐4
(7)FI from Worksheet 1C (b)
from Table 11‐4
(7) FIa from Worksheet 1C (b)
from Table 11‐4
(7)PDO from Worksheet 1C (b)
Total 1.000 4.543 1.000 2.487 1.000 1.146 1.000 2.055(2)*(3)TOTAL (4)x(5)FI (6)*(7) FI a (8)*(9) PDO
Head‐on collision 0.009 0.041 0.029 0.072 0.043 0.049 0.001 0.002Sideswipe collision 0.098 0.445 0.048 0.119 0.044 0.050 0.120 0.247Rear‐end collision 0.246 1.117 0.305 0.759 0.217 0.249 0.220 0.452Angle collision 0.356 1.617 0.352 0.875 0.348 0.399 0.358 0.736Single‐vehicle collision 0.238 1.081 0.238 0.592 0.304 0.348 0.237 0.487Other collision 0.053 0.241 0.028 0.070 0.044 0.050 0.064 0.132NOTE: a Using the KABCO scale, these include only KAB crashes. Crashes with severity level C (possible injury) are not included.
Worksheet 1E ‐‐ Summary Results for Rural Multilane Roadway Segments
(1) (2) (3) (4)Crash severity level Predicted average crash frequency (crashes/year) Roadway segment length (mi) Crash rate (crashes/mi/year)
(7) from Worksheet 1C (a) or (b) (2)/(3)Total 4.5 0.4 12.0Fatal and Injury (FI) 2.5 0.4 6.5Fatal and Injurya (FIa) 1.1 0.4 3.0Property Damage Only (PDO) 2.1 0.4 5.4NOTE: a Using the KABCO scale, these include only KAB crashes. Crashes with severity level C (possible injury) are not included.
11
Module 4b: Spreadsheets
Module 4b ‐ 12HSM Training
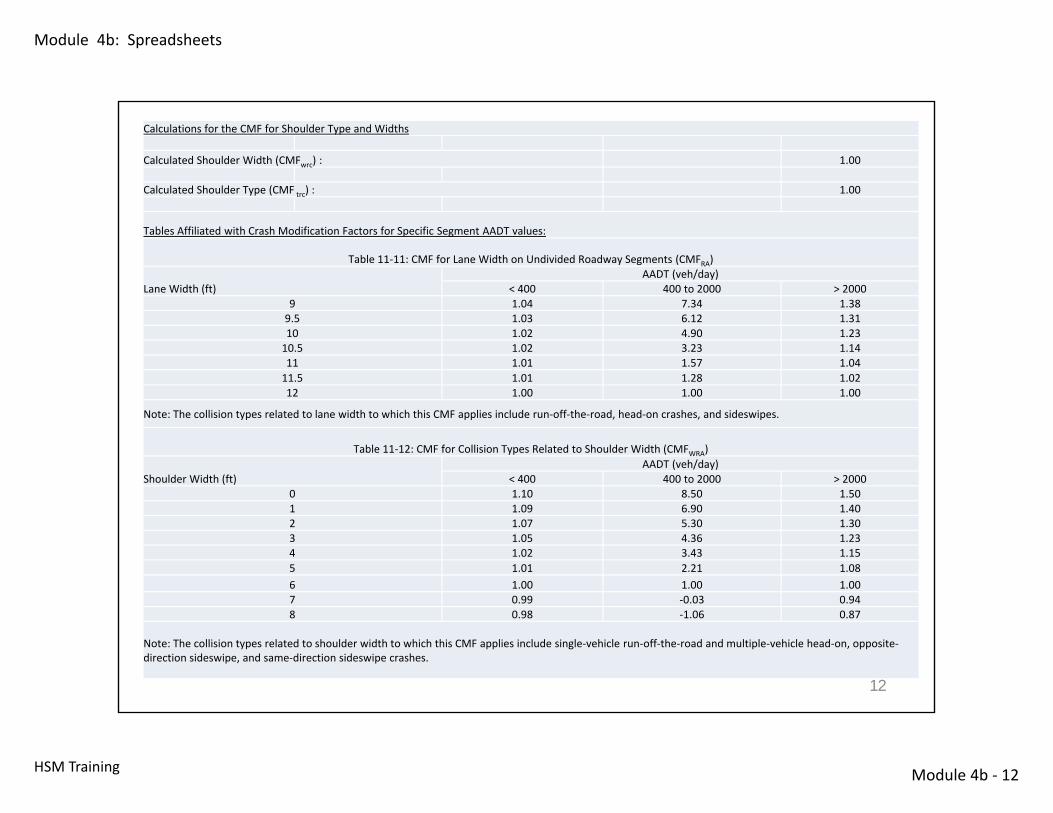
Calculations for the CMF for Shoulder Type and Widths
Calculated Shoulder Width (CMFwrc) : 1.00
Calculated Shoulder Type (CMF trc) : 1.00
Tables Affiliated with Crash Modification Factors for Specific Segment AADT values:
Table 11‐11: CMF for Lane Width on Undivided Roadway Segments (CMFRA)
Lane Width (ft)AADT (veh/day)
< 400 400 to 2000 > 20009 1.04 7.34 1.389.5 1.03 6.12 1.3110 1.02 4.90 1.2310.5 1.02 3.23 1.1411 1.01 1.57 1.0411.5 1.01 1.28 1.0212 1.00 1.00 1.00
Note: The collision types related to lane width to which this CMF applies include run‐off‐the‐road, head‐on crashes, and sideswipes.
Table 11‐12: CMF for Collision Types Related to Shoulder Width (CMFWRA)
Shoulder Width (ft)AADT (veh/day)
< 400 400 to 2000 > 20000 1.10 8.50 1.501 1.09 6.90 1.402 1.07 5.30 1.303 1.05 4.36 1.234 1.02 3.43 1.155 1.01 2.21 1.086 1.00 1.00 1.007 0.99 ‐0.03 0.948 0.98 ‐1.06 0.87
Note: The collision types related to shoulder width to which this CMF applies include single‐vehicle run‐off‐the‐road and multiple‐vehicle head‐on, opposite‐direction sideswipe, and same‐direction sideswipe crashes.
12
Module 4b: Spreadsheets
Module 4b ‐ 13HSM Training
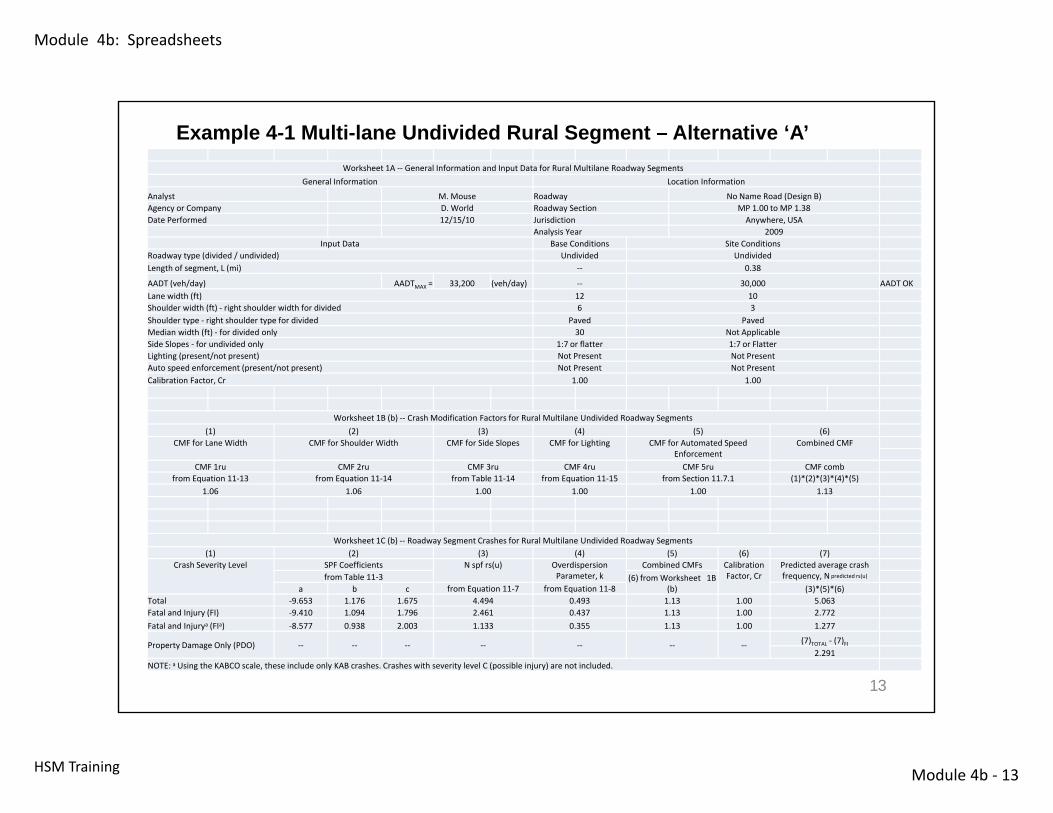
Example 4-1 Multi-lane Undivided Rural Segment – Alternative ‘A’Worksheet 1A ‐‐ General Information and Input Data for Rural Multilane Roadway Segments
General Information Location Information
Analyst M. Mouse Roadway No Name Road (Design B)Agency or Company D. World Roadway Section MP 1.00 to MP 1.38Date Performed 12/15/10 Jurisdiction Anywhere, USA
Analysis Year 2009Input Data Base Conditions Site Conditions
Roadway type (divided / undivided) Undivided UndividedLength of segment, L (mi) ‐‐ 0.38
AADT (veh/day) AADTMAX = 33,200 (veh/day) ‐‐ 30,000 AADT OKLane width (ft) 12 10Shoulder width (ft) ‐ right shoulder width for divided 6 3Shoulder type ‐ right shoulder type for divided Paved PavedMedian width (ft) ‐ for divided only 30 Not ApplicableSide Slopes ‐ for undivided only 1:7 or flatter 1:7 or FlatterLighting (present/not present) Not Present Not PresentAuto speed enforcement (present/not present) Not Present Not PresentCalibration Factor, Cr 1.00 1.00
Worksheet 1B (b) ‐‐ Crash Modification Factors for Rural Multilane Undivided Roadway Segments(1) (2) (3) (4) (5) (6)
CMF for Lane Width CMF for Shoulder Width CMF for Side Slopes CMF for Lighting CMF for Automated Speed Enforcement
Combined CMF
CMF 1ru CMF 2ru CMF 3ru CMF 4ru CMF 5ru CMF combfrom Equation 11‐13 from Equation 11‐14 from Table 11‐14 from Equation 11‐15 from Section 11.7.1 (1)*(2)*(3)*(4)*(5)
1.06 1.06 1.00 1.00 1.00 1.13
Worksheet 1C (b) ‐‐ Roadway Segment Crashes for Rural Multilane Undivided Roadway Segments(1) (2) (3) (4) (5) (6) (7)
Crash Severity Level SPF Coefficients N spf rs(u) OverdispersionParameter, k
Combined CMFs Calibration Factor, Cr
Predicted average crash frequency, Npredicted rs(u)from Table 11‐3 (6) from Worksheet 1B
(b)a b c from Equation 11‐7 from Equation 11‐8 (3)*(5)*(6)Total ‐9.653 1.176 1.675 4.494 0.493 1.13 1.00 5.063Fatal and Injury (FI) ‐9.410 1.094 1.796 2.461 0.437 1.13 1.00 2.772Fatal and Injurya (FIa) ‐8.577 0.938 2.003 1.133 0.355 1.13 1.00 1.277
Property Damage Only (PDO) ‐‐ ‐‐ ‐‐ ‐‐ ‐‐ ‐‐ ‐‐ (7)TOTAL ‐ (7)FI2.291
NOTE: a Using the KABCO scale, these include only KAB crashes. Crashes with severity level C (possible injury) are not included.
13
Module 4b: Spreadsheets
Module 4b ‐ 14HSM Training
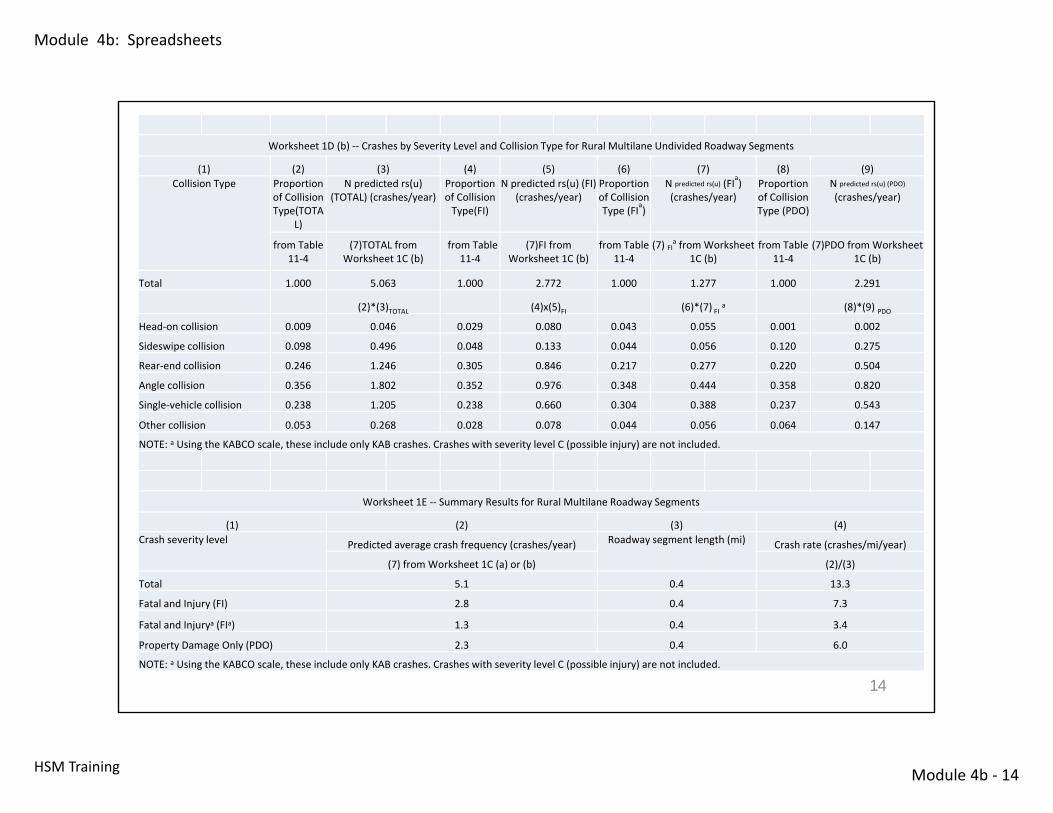
Worksheet 1D (b) ‐‐ Crashes by Severity Level and Collision Type for Rural Multilane Undivided Roadway Segments
(1) (2) (3) (4) (5) (6) (7) (8) (9)Collision Type Proportion
of Collision Type(TOTA
L)
N predicted rs(u) (TOTAL) (crashes/year)
Proportion of Collision Type(FI)
N predicted rs(u) (FI) (crashes/year)
Proportion of Collision Type (FIa)
N predicted rs(u) (FIa) (crashes/year)
Proportion of Collision Type (PDO)
N predicted rs(u) (PDO) (crashes/year)
from Table 11‐4
(7)TOTAL from Worksheet 1C (b)
from Table 11‐4
(7)FI from Worksheet 1C (b)
from Table 11‐4
(7) FIa from Worksheet 1C (b)
from Table 11‐4
(7)PDO from Worksheet 1C (b)
Total 1.000 5.063 1.000 2.772 1.000 1.277 1.000 2.291
(2)*(3)TOTAL (4)x(5)FI (6)*(7) FI a (8)*(9) PDOHead‐on collision 0.009 0.046 0.029 0.080 0.043 0.055 0.001 0.002
Sideswipe collision 0.098 0.496 0.048 0.133 0.044 0.056 0.120 0.275
Rear‐end collision 0.246 1.246 0.305 0.846 0.217 0.277 0.220 0.504
Angle collision 0.356 1.802 0.352 0.976 0.348 0.444 0.358 0.820
Single‐vehicle collision 0.238 1.205 0.238 0.660 0.304 0.388 0.237 0.543
Other collision 0.053 0.268 0.028 0.078 0.044 0.056 0.064 0.147
NOTE: a Using the KABCO scale, these include only KAB crashes. Crashes with severity level C (possible injury) are not included.
Worksheet 1E ‐‐ Summary Results for Rural Multilane Roadway Segments
(1) (2) (3) (4)Crash severity level Predicted average crash frequency (crashes/year) Roadway segment length (mi) Crash rate (crashes/mi/year)
(7) from Worksheet 1C (a) or (b) (2)/(3)
Total 5.1 0.4 13.3
Fatal and Injury (FI) 2.8 0.4 7.3
Fatal and Injurya (FIa) 1.3 0.4 3.4
Property Damage Only (PDO) 2.3 0.4 6.0
NOTE: a Using the KABCO scale, these include only KAB crashes. Crashes with severity level C (possible injury) are not included.
14
Module 4b: Spreadsheets
Module 4b ‐ 15HSM Training
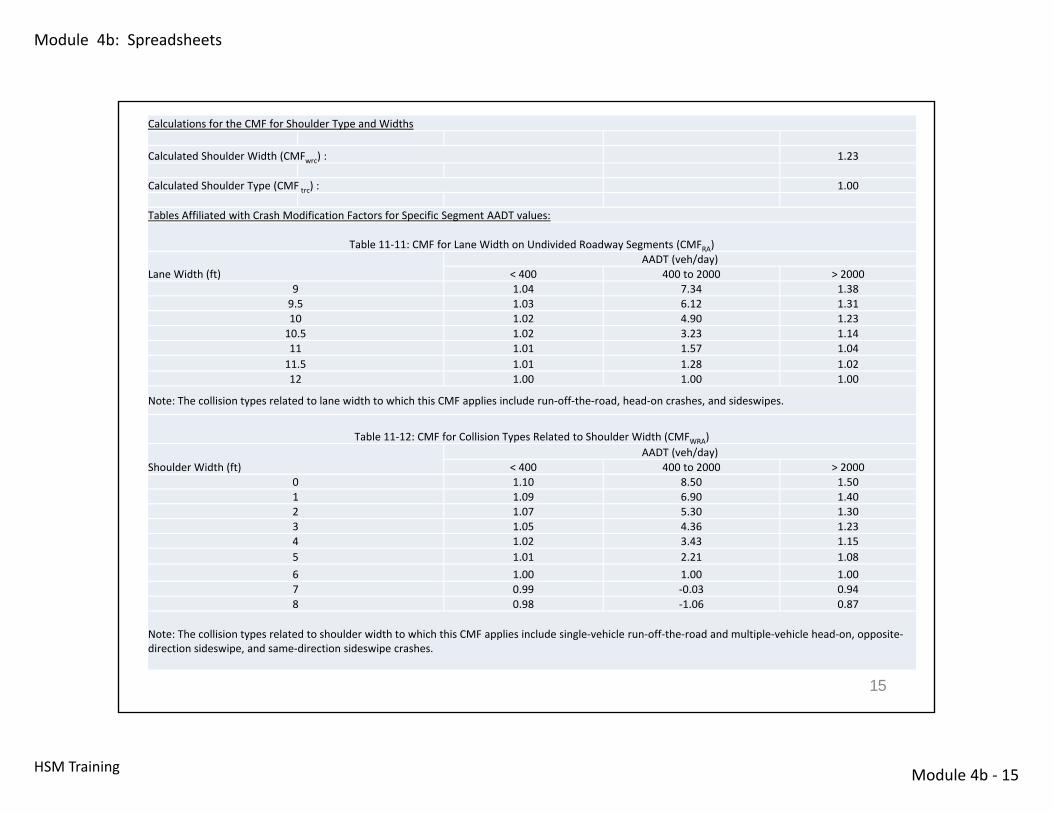
Calculations for the CMF for Shoulder Type and Widths
Calculated Shoulder Width (CMFwrc) : 1.23
Calculated Shoulder Type (CMF trc) : 1.00
Tables Affiliated with Crash Modification Factors for Specific Segment AADT values:
Table 11‐11: CMF for Lane Width on Undivided Roadway Segments (CMFRA)
Lane Width (ft)AADT (veh/day)
< 400 400 to 2000 > 20009 1.04 7.34 1.389.5 1.03 6.12 1.3110 1.02 4.90 1.2310.5 1.02 3.23 1.1411 1.01 1.57 1.0411.5 1.01 1.28 1.0212 1.00 1.00 1.00
Note: The collision types related to lane width to which this CMF applies include run‐off‐the‐road, head‐on crashes, and sideswipes.
Table 11‐12: CMF for Collision Types Related to Shoulder Width (CMFWRA)
Shoulder Width (ft)AADT (veh/day)
< 400 400 to 2000 > 20000 1.10 8.50 1.501 1.09 6.90 1.402 1.07 5.30 1.303 1.05 4.36 1.234 1.02 3.43 1.155 1.01 2.21 1.086 1.00 1.00 1.007 0.99 ‐0.03 0.948 0.98 ‐1.06 0.87
Note: The collision types related to shoulder width to which this CMF applies include single‐vehicle run‐off‐the‐road and multiple‐vehicle head‐on, opposite‐direction sideswipe, and same‐direction sideswipe crashes.
15

Module 4b: Spreadsheets
Module 4b ‐ 16HSM Training
Worksheet 2A ‐‐ General Information and Input Data for Rural Multilane Highway IntersectionsGeneral Information Location Information
Analyst M. Mouse Roadway No Name HighwayAgency or Company D. World Intersection No Name at Cross Street (Existing)Date Performed 12/15/10 Jurisdiction Anywhere, USA
Analysis Year 2009Input Data Base Conditions Site Conditions
Intersection type (3ST, 4ST, 4SG) ‐‐ 4STUnsignalized four‐leg (stop control on minor‐road approaches)
AADTmajor (veh/day)AADTMAX
= 78,300 (veh/day) ‐‐ 30,000 AADT OK
AADTminor (veh/day)AADTMAX
= 7,400 (veh/day) ‐‐ 5,000 AADT OKIntersection skew angle (degrees) 0 0 Skew Intersection:Number of non‐STOP‐controlled approaches with left‐turn lanes (0, 1, 2) 0 0Number of non‐STOP‐controlled approaches with right‐turn lanes (0, 1, 2, 3, or 4) 0 0Intersection lighting (present/not present) Not Present Not Present
Calibration Factor, Ci 1.00 1.00
Worksheet 2B ‐‐ Crash Modification Factors for Rural Multilane Highway Intersections(1) (2) (3) (4) (5) (6)
Crash Severity Level CMF for Intersection Skew Angle (CMF 1i )
CMF for Left‐Turn Lanes CMF for Right‐Turn Lanes CMF for Lighting
Combined CMF (CMFCOMB )
from Equations 11‐18 or 11‐20 and 11‐19 or 11‐21
(CMF 2i ) (CMF 3i ) (CMF 4i )from Table 11‐22 from Table 11‐23 from Equation 11‐22 (2)*(3)*(4)*(5)
Total 1.00 1.00 1.00 1.00 1.00Fatal and Injury (FI) 1.00 1.00 1.00 1.00 1.00Note: The 4‐leg Signalized Intersection (4SG) models do not have base conditions and so can only be used for estimation purposes. As a result, there are not CMFs provided for the 4SG condition.
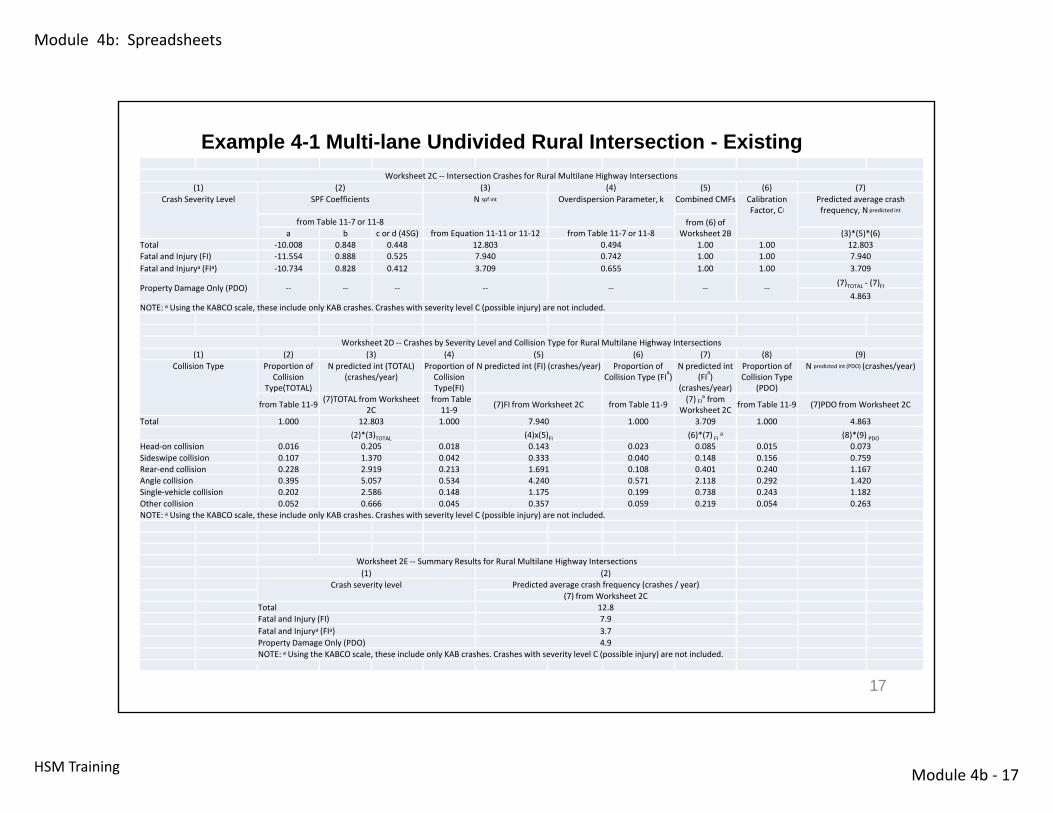
Worksheet 2C ‐‐ Intersection Crashes for Rural Multilane Highway Intersections(1) (2) (3) (4) (5) (6) (7)
Crash Severity Level SPF Coefficients N spf int Overdispersion Parameter, k
Combined CMFs
Calibration Factor, Ci
Predicted average crash frequency, N
predicted intfrom Table 11‐7 or 11‐8 from (6) of Worksheet
2Ba bc or d (4SG)
from Equation 11‐11 or 11‐12 from Table 11‐7 or 11‐8 (3)*(5)*(6)
Total ‐10.008 0.848 0.448 12.803 0.494 1.00 1.00 12.803Fatal and Injury (FI) ‐11.554 0.888 0.525 7.940 0.742 1.00 1.00 7.940Fatal and Injurya (FIa) ‐10.734 0.828 0.412 3.709 0.655 1.00 1.00 3.709
Property Damage Only (PDO) ‐‐ ‐‐ ‐‐ ‐‐ ‐‐ ‐‐ ‐‐ (7)TOTAL ‐ (7)FI
4.863NOTE: a Using the KABCO scale, these include only KAB crashes. Crashes with severity level C (possible injury) are not included.
Example 4-1 Multi-lane Undivided Rural Intersection - Existing
16
Module 4b: Spreadsheets
Module 4b ‐ 17HSM Training
Worksheet 2C ‐‐ Intersection Crashes for Rural Multilane Highway Intersections(1) (2) (3) (4) (5) (6) (7)
Crash Severity Level SPF Coefficients N spf int Overdispersion Parameter, k Combined CMFs Calibration Factor, Ci
Predicted average crash frequency, Npredicted int
from Table 11‐7 or 11‐8 from (6) of Worksheet 2Ba b c or d (4SG) from Equation 11‐11 or 11‐12 from Table 11‐7 or 11‐8 (3)*(5)*(6)
Total ‐10.008 0.848 0.448 12.803 0.494 1.00 1.00 12.803Fatal and Injury (FI) ‐11.554 0.888 0.525 7.940 0.742 1.00 1.00 7.940Fatal and Injurya (FIa) ‐10.734 0.828 0.412 3.709 0.655 1.00 1.00 3.709
Property Damage Only (PDO) ‐‐ ‐‐ ‐‐ ‐‐ ‐‐ ‐‐ ‐‐ (7)TOTAL ‐ (7)FI4.863
NOTE: a Using the KABCO scale, these include only KAB crashes. Crashes with severity level C (possible injury) are not included.
Worksheet 2D ‐‐ Crashes by Severity Level and Collision Type for Rural Multilane Highway Intersections(1) (2) (3) (4) (5) (6) (7) (8) (9)
Collision Type Proportion of Collision
Type(TOTAL)
N predicted int (TOTAL) (crashes/year)
Proportion of Collision Type(FI)
N predicted int (FI) (crashes/year) Proportion of Collision Type (FIa)
N predicted int (FIa)
(crashes/year)
Proportion of Collision Type
(PDO)
N predicted int (PDO) (crashes/year)
from Table 11‐9 (7)TOTAL from Worksheet 2C
from Table 11‐9 (7)FI from Worksheet 2C from Table 11‐9 (7) FIa from
Worksheet 2C from Table 11‐9 (7)PDO from Worksheet 2C
Total 1.000 12.803 1.000 7.940 1.000 3.709 1.000 4.863(2)*(3)TOTAL (4)x(5)FI (6)*(7) FI a (8)*(9) PDO
Head‐on collision 0.016 0.205 0.018 0.143 0.023 0.085 0.015 0.073Sideswipe collision 0.107 1.370 0.042 0.333 0.040 0.148 0.156 0.759Rear‐end collision 0.228 2.919 0.213 1.691 0.108 0.401 0.240 1.167Angle collision 0.395 5.057 0.534 4.240 0.571 2.118 0.292 1.420Single‐vehicle collision 0.202 2.586 0.148 1.175 0.199 0.738 0.243 1.182Other collision 0.052 0.666 0.045 0.357 0.059 0.219 0.054 0.263NOTE: a Using the KABCO scale, these include only KAB crashes. Crashes with severity level C (possible injury) are not included.
Worksheet 2E ‐‐ Summary Results for Rural Multilane Highway Intersections(1) (2)
Crash severity level Predicted average crash frequency (crashes / year)(7) from Worksheet 2C
Total 12.8Fatal and Injury (FI) 7.9Fatal and Injurya (FIa) 3.7Property Damage Only (PDO) 4.9NOTE: a Using the KABCO scale, these include only KAB crashes. Crashes with severity level C (possible injury) are not included.
Example 4-1 Multi-lane Undivided Rural Intersection - Existing
17
Module 4b: Spreadsheets
Module 4b ‐ 18HSM Training
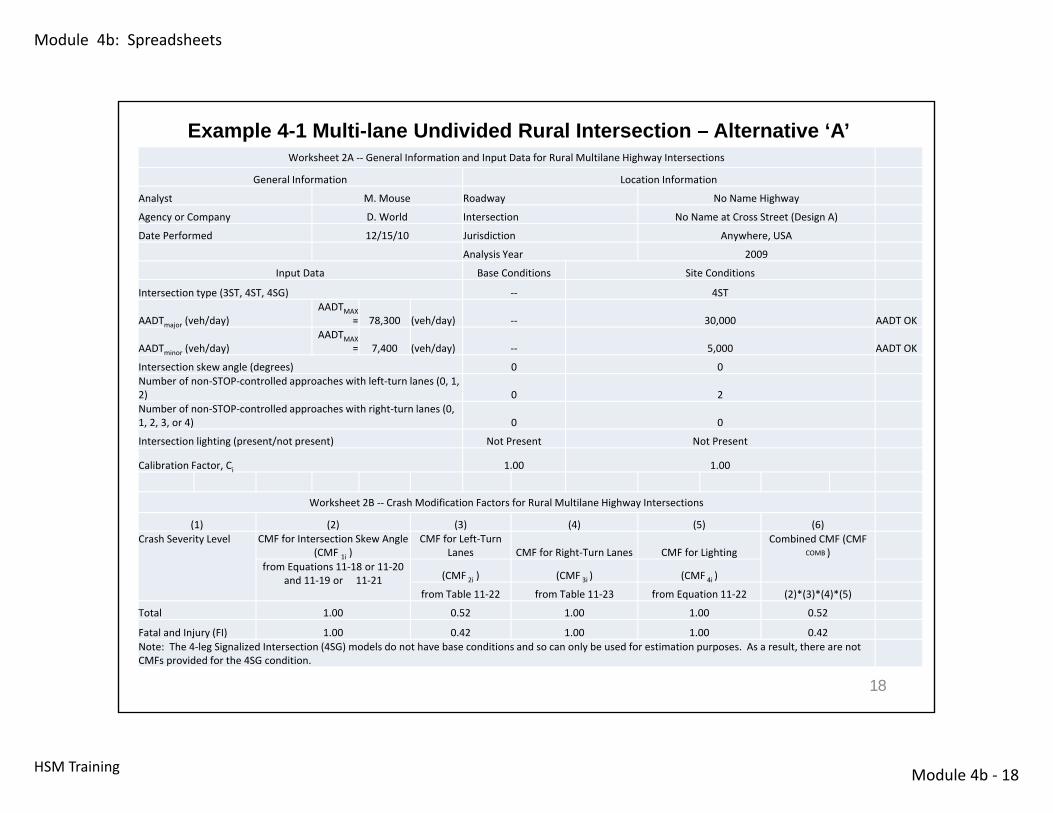
Example 4-1 Multi-lane Undivided Rural Intersection – Alternative ‘A’Worksheet 2A ‐‐ General Information and Input Data for Rural Multilane Highway Intersections
General Information Location Information
Analyst M. Mouse Roadway No Name Highway
Agency or Company D. World Intersection No Name at Cross Street (Design A)
Date Performed 12/15/10 Jurisdiction Anywhere, USA
Analysis Year 2009
Input Data Base Conditions Site Conditions
Intersection type (3ST, 4ST, 4SG) ‐‐ 4ST
AADTmajor (veh/day)AADTMAX
= 78,300 (veh/day) ‐‐ 30,000 AADT OK
AADTminor (veh/day)AADTMAX
= 7,400 (veh/day) ‐‐ 5,000 AADT OK
Intersection skew angle (degrees) 0 0Number of non‐STOP‐controlled approaches with left‐turn lanes (0, 1, 2) 0 2Number of non‐STOP‐controlled approaches with right‐turn lanes (0, 1, 2, 3, or 4) 0 0
Intersection lighting (present/not present) Not Present Not Present
Calibration Factor, Ci 1.00 1.00
Worksheet 2B ‐‐ Crash Modification Factors for Rural Multilane Highway Intersections
(1) (2) (3) (4) (5) (6)Crash Severity Level CMF for Intersection Skew Angle
(CMF 1i )CMF for Left‐Turn
Lanes CMF for Right‐Turn Lanes CMF for LightingCombined CMF (CMF
COMB )from Equations 11‐18 or 11‐20
and 11‐19 or 11‐21 (CMF 2i ) (CMF 3i ) (CMF 4i )
from Table 11‐22 from Table 11‐23 from Equation 11‐22 (2)*(3)*(4)*(5)
Total 1.00 0.52 1.00 1.00 0.52
Fatal and Injury (FI) 1.00 0.42 1.00 1.00 0.42Note: The 4‐leg Signalized Intersection (4SG) models do not have base conditions and so can only be used for estimation purposes. As a result, there are not CMFs provided for the 4SG condition.
18
Module 4b: Spreadsheets
Module 4b ‐ 19HSM Training
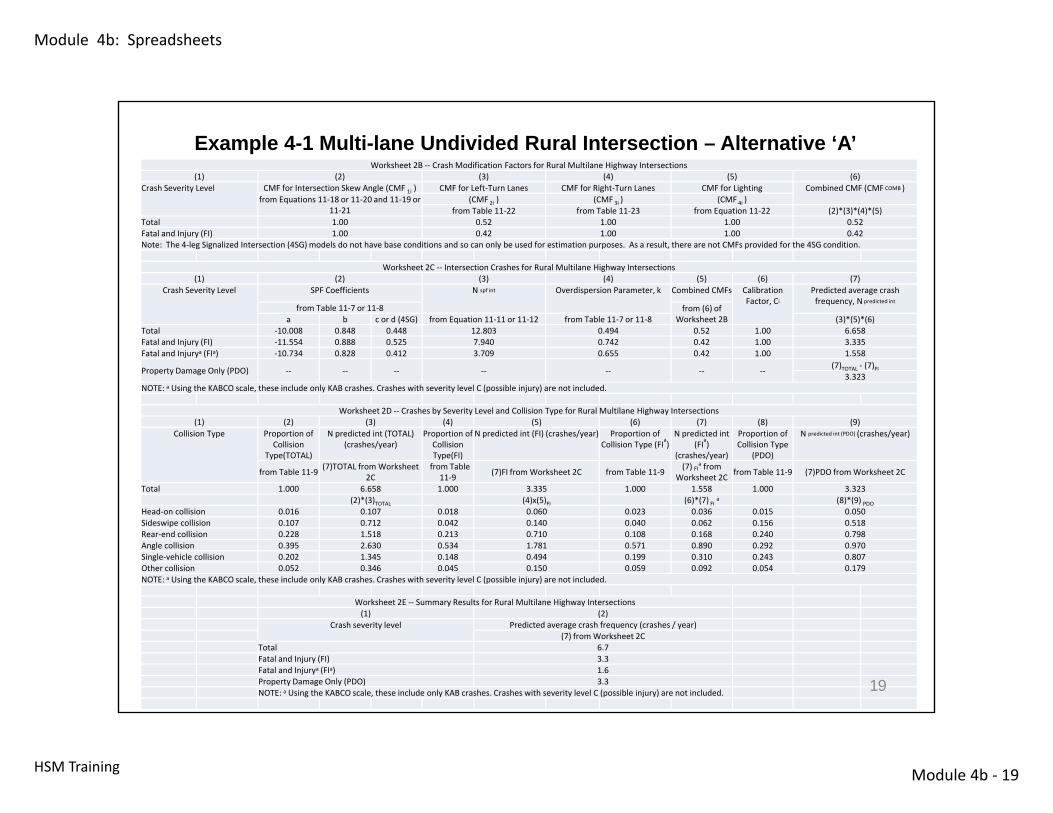
Worksheet 2B ‐‐ Crash Modification Factors for Rural Multilane Highway Intersections(1) (2) (3) (4) (5) (6)
Crash Severity Level CMF for Intersection Skew Angle (CMF 1i ) CMF for Left‐Turn Lanes CMF for Right‐Turn Lanes CMF for Lighting Combined CMF (CMF COMB )from Equations 11‐18 or 11‐20 and 11‐19 or
11‐21(CMF 2i ) (CMF 3i ) (CMF 4i )
from Table 11‐22 from Table 11‐23 from Equation 11‐22 (2)*(3)*(4)*(5)Total 1.00 0.52 1.00 1.00 0.52Fatal and Injury (FI) 1.00 0.42 1.00 1.00 0.42Note: The 4‐leg Signalized Intersection (4SG) models do not have base conditions and so can only be used for estimation purposes. As a result, there are not CMFs provided for the 4SG condition.
Worksheet 2C ‐‐ Intersection Crashes for Rural Multilane Highway Intersections(1) (2) (3) (4) (5) (6) (7)
Crash Severity Level SPF Coefficients N spf int Overdispersion Parameter, k Combined CMFs Calibration Factor, Ci
Predicted average crash frequency, Npredicted int
from Table 11‐7 or 11‐8 from (6) of Worksheet 2Ba b c or d (4SG) from Equation 11‐11 or 11‐12 from Table 11‐7 or 11‐8 (3)*(5)*(6)
Total ‐10.008 0.848 0.448 12.803 0.494 0.52 1.00 6.658Fatal and Injury (FI) ‐11.554 0.888 0.525 7.940 0.742 0.42 1.00 3.335Fatal and Injurya (FIa) ‐10.734 0.828 0.412 3.709 0.655 0.42 1.00 1.558
Property Damage Only (PDO) ‐‐ ‐‐ ‐‐ ‐‐ ‐‐ ‐‐ ‐‐ (7)TOTAL ‐ (7)FI3.323
NOTE: a Using the KABCO scale, these include only KAB crashes. Crashes with severity level C (possible injury) are not included.
Worksheet 2D ‐‐ Crashes by Severity Level and Collision Type for Rural Multilane Highway Intersections(1) (2) (3) (4) (5) (6) (7) (8) (9)
Collision Type Proportion of Collision
Type(TOTAL)
N predicted int (TOTAL) (crashes/year)
Proportion of Collision Type(FI)
N predicted int (FI) (crashes/year) Proportion of Collision Type (FIa)
N predicted int (FIa)
(crashes/year)
Proportion of Collision Type
(PDO)
N predicted int (PDO) (crashes/year)
from Table 11‐9 (7)TOTAL from Worksheet 2C
from Table 11‐9 (7)FI from Worksheet 2C from Table 11‐9 (7) FIa from
Worksheet 2C from Table 11‐9 (7)PDO from Worksheet 2C
Total 1.000 6.658 1.000 3.335 1.000 1.558 1.000 3.323(2)*(3)TOTAL (4)x(5)FI (6)*(7) FI a (8)*(9) PDO
Head‐on collision 0.016 0.107 0.018 0.060 0.023 0.036 0.015 0.050Sideswipe collision 0.107 0.712 0.042 0.140 0.040 0.062 0.156 0.518Rear‐end collision 0.228 1.518 0.213 0.710 0.108 0.168 0.240 0.798Angle collision 0.395 2.630 0.534 1.781 0.571 0.890 0.292 0.970Single‐vehicle collision 0.202 1.345 0.148 0.494 0.199 0.310 0.243 0.807Other collision 0.052 0.346 0.045 0.150 0.059 0.092 0.054 0.179NOTE: a Using the KABCO scale, these include only KAB crashes. Crashes with severity level C (possible injury) are not included.
Worksheet 2E ‐‐ Summary Results for Rural Multilane Highway Intersections(1) (2)
Crash severity level Predicted average crash frequency (crashes / year)(7) from Worksheet 2C
Total 6.7Fatal and Injury (FI) 3.3Fatal and Injurya (FIa) 1.6Property Damage Only (PDO) 3.3NOTE: a Using the KABCO scale, these include only KAB crashes. Crashes with severity level C (possible injury) are not included.
Example 4-1 Multi-lane Undivided Rural Intersection – Alternative ‘A’
19

Module 4b: Spreadsheets
Module 4b ‐ 20HSM Training
Example 4-1 Multi-lane Undivided Rural Intersection – Alternative ‘B’Worksheet 2A ‐‐ General Information and Input Data for Rural Multilane Highway Intersections
General Information Location InformationAnalyst M. Mouse Roadway No Name HighwayAgency or Company D. World Intersection No Name at Cross Street (Design B)Date Performed 12/15/10 Jurisdiction Anywhere, USA
Analysis Year 2009Input Data Base Conditions Site Conditions
Intersection type (3ST, 4ST, 4SG) ‐‐ 4ST
AADTmajor (veh/day) AADTMAX = 78,300 (veh/day) ‐‐ 30,000 AADT OK
AADTminor (veh/day) AADTMAX = 7,400 (veh/day) ‐‐ 5,000 AADT OKIntersection skew angle (degrees) 0 0Number of non‐STOP‐controlled approaches with left‐turn lanes (0, 1, 2) 0 2Number of non‐STOP‐controlled approaches with right‐turn lanes (0, 1, 2, 3, or 4) 0 2Intersection lighting (present/not present) Not Present Not Present
Calibration Factor, Ci 1.00 1.00
Worksheet 2B ‐‐ Crash Modification Factors for Rural Multilane Highway Intersections(1) (2) (3) (4) (5) (6)
Crash Severity Level CMF for Intersection Skew Angle (CMF 1i ) CMF for Left‐Turn Lanes CMF for Right‐Turn Lanes CMF for Lighting Combined CMF (CMF COMB )
from Equations 11‐18 or 11‐20 and 11‐19 or 11‐21
(CMF 2i ) (CMF 3i ) (CMF 4i )from Table 11‐22 from Table 11‐23 from Equation 11‐22 (2)*(3)*(4)*(5)
Total 1.00 0.52 0.74 1.00 0.38Fatal and Injury (FI) 1.00 0.42 0.59 1.00 0.25Note: The 4‐leg Signalized Intersection (4SG) models do not have base conditions and so can only be used for estimation purposes. As a result, there are not CMFs provided for the 4SG condition.
Worksheet 2C ‐‐ Intersection Crashes for Rural Multilane Highway Intersections(1) (2) (3) (4) (5) (6) (7)
Crash Severity Level SPF Coefficients N spf int Overdispersion Parameter, k Combined CMFs Calibration Factor, Ci
Predicted average crash frequency, Npredicted intfrom Table 11‐7 or 11‐8
from (6) of Worksheet 2Ba b c or d (4SG)
from Equation 11‐11 or 11‐12 from Table 11‐7 or 11‐8 (3)*(5)*(6)
Total ‐10.008 0.848 0.448 12.803 0.494 0.38 1.00 4.927Fatal and Injury (FI) ‐11.554 0.888 0.525 7.940 0.742 0.25 1.00 1.967Fatal and Injurya (FIa) ‐10.734 0.828 0.412 3.709 0.655 0.25 1.00 0.919
Property Damage Only (PDO) ‐‐ ‐‐ ‐‐ ‐‐ ‐‐ ‐‐ ‐‐ (7)TOTAL ‐ (7)FI2.959
NOTE: a Using the KABCO scale, these include only KAB crashes. Crashes with severity level C (possible injury) are not included.
20
Module 4b: Spreadsheets
Module 4b ‐ 21HSM Training
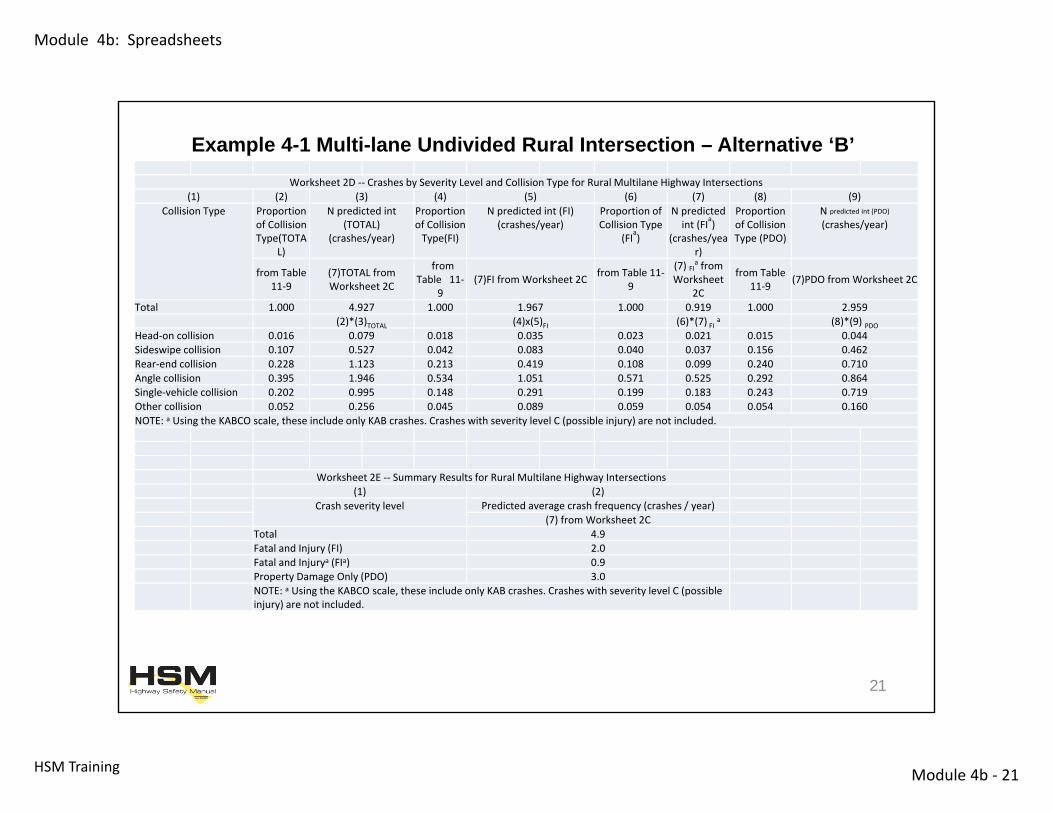
Worksheet 2D ‐‐ Crashes by Severity Level and Collision Type for Rural Multilane Highway Intersections(1) (2) (3) (4) (5) (6) (7) (8) (9)
Collision Type Proportion of Collision Type(TOTA
L)
N predicted int (TOTAL)
(crashes/year)
Proportion of Collision Type(FI)
N predicted int (FI) (crashes/year)
Proportion of Collision Type
(FIa)
N predicted int (FIa)
(crashes/year)
Proportion of Collision Type (PDO)
N predicted int (PDO) (crashes/year)
from Table 11‐9
(7)TOTAL from Worksheet 2C
from Table 11‐
9(7)FI from Worksheet 2C from Table 11‐
9
(7) FIa from Worksheet
2C
from Table 11‐9 (7)PDO from Worksheet 2C
Total 1.000 4.927 1.000 1.967 1.000 0.919 1.000 2.959(2)*(3)TOTAL (4)x(5)FI (6)*(7) FI a (8)*(9) PDO
Head‐on collision 0.016 0.079 0.018 0.035 0.023 0.021 0.015 0.044Sideswipe collision 0.107 0.527 0.042 0.083 0.040 0.037 0.156 0.462Rear‐end collision 0.228 1.123 0.213 0.419 0.108 0.099 0.240 0.710Angle collision 0.395 1.946 0.534 1.051 0.571 0.525 0.292 0.864Single‐vehicle collision 0.202 0.995 0.148 0.291 0.199 0.183 0.243 0.719Other collision 0.052 0.256 0.045 0.089 0.059 0.054 0.054 0.160NOTE: a Using the KABCO scale, these include only KAB crashes. Crashes with severity level C (possible injury) are not included.
Worksheet 2E ‐‐ Summary Results for Rural Multilane Highway Intersections(1) (2)
Crash severity level Predicted average crash frequency (crashes / year)(7) from Worksheet 2C
Total 4.9Fatal and Injury (FI) 2.0Fatal and Injurya (FIa) 0.9Property Damage Only (PDO) 3.0NOTE: a Using the KABCO scale, these include only KAB crashes. Crashes with severity level C (possible injury) are not included.
Example 4-1 Multi-lane Undivided Rural Intersection – Alternative ‘B’
21
Module 4b: Spreadsheets
Module 4b ‐ 22HSM Training
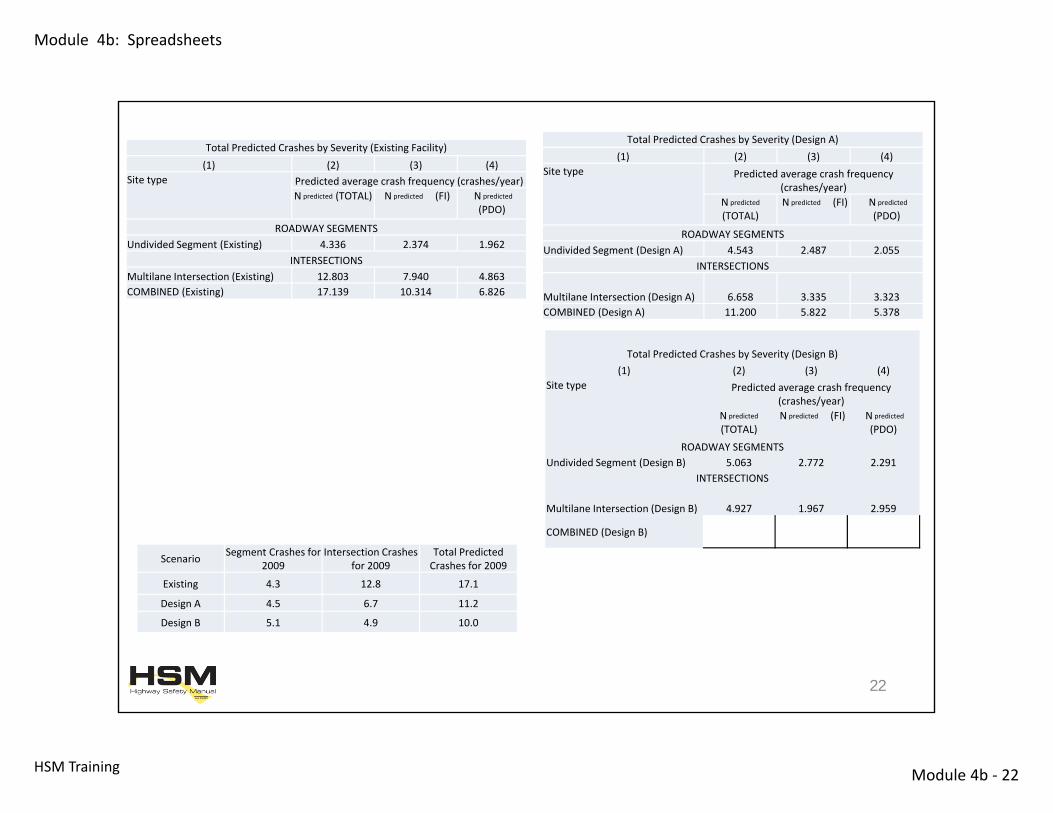
Total Predicted Crashes by Severity (Existing Facility)(1) (2) (3) (4)
Site type Predicted average crash frequency (crashes/year)N predicted (TOTAL) N predicted (FI) N predicted
(PDO)
ROADWAY SEGMENTSUndivided Segment (Existing) 4.336 2.374 1.962
INTERSECTIONSMultilane Intersection (Existing) 12.803 7.940 4.863COMBINED (Existing) 17.139 10.314 6.826
Total Predicted Crashes by Severity (Design A)(1) (2) (3) (4)
Site type Predicted average crash frequency (crashes/year)
N predicted
(TOTAL)N predicted (FI) N predicted
(PDO)
ROADWAY SEGMENTSUndivided Segment (Design A) 4.543 2.487 2.055
INTERSECTIONS
Multilane Intersection (Design A) 6.658 3.335 3.323COMBINED (Design A) 11.200 5.822 5.378
Total Predicted Crashes by Severity (Design B)(1) (2) (3) (4)
Site type Predicted average crash frequency (crashes/year)
N predicted
(TOTAL)N predicted (FI) N predicted
(PDO)
ROADWAY SEGMENTSUndivided Segment (Design B) 5.063 2.772 2.291
INTERSECTIONS
Multilane Intersection (Design B) 4.927 1.967 2.959
COMBINED (Design B)
Scenario Segment Crashes for 2009
Intersection Crashes for 2009
Total Predicted Crashes for 2009
Existing 4.3 12.8 17.1
Design A 4.5 6.7 11.2
Design B 5.1 4.9 10.0
22
Module 4b: Spreadsheets
Module 4b ‐ 23HSM Training
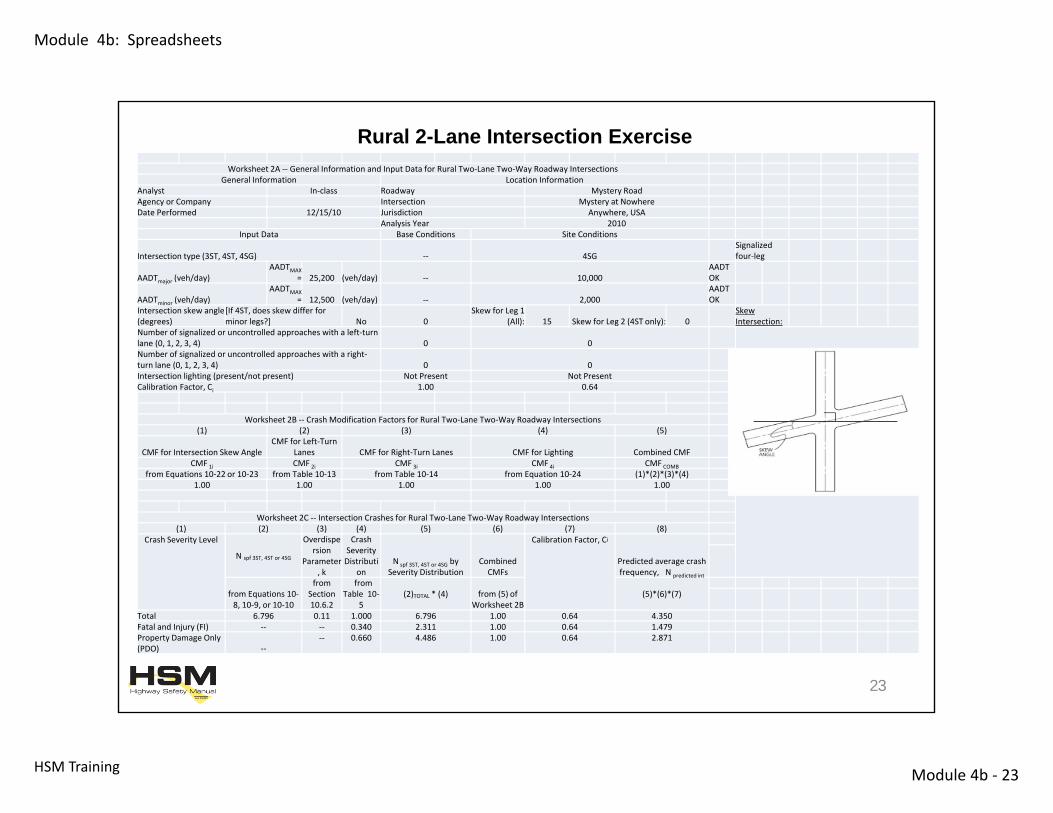
Worksheet 2A ‐‐ General Information and Input Data for Rural Two‐Lane Two‐Way Roadway IntersectionsGeneral Information Location Information
Analyst In‐class Roadway Mystery RoadAgency or Company Intersection Mystery at NowhereDate Performed 12/15/10 Jurisdiction Anywhere, USA
Analysis Year 2010Input Data Base Conditions Site Conditions
Intersection type (3ST, 4ST, 4SG) ‐‐ 4SGSignalized four‐leg
AADTmajor (veh/day)AADTMAX
= 25,200 (veh/day) ‐‐ 10,000AADT OK
AADTminor (veh/day)AADTMAX
= 12,500 (veh/day) ‐‐ 2,000AADT OK
Intersection skew angle (degrees)
[If 4ST, does skew differ for minor legs?] No 0
Skew for Leg 1 (All): 15 Skew for Leg 2 (4ST only): 0
Skew Intersection:
Number of signalized or uncontrolled approaches with a left‐turn lane (0, 1, 2, 3, 4) 0 0Number of signalized or uncontrolled approaches with a right‐turn lane (0, 1, 2, 3, 4) 0 0Intersection lighting (present/not present) Not Present Not PresentCalibration Factor, Ci 1.00 0.64
Worksheet 2B ‐‐ Crash Modification Factors for Rural Two‐Lane Two‐Way Roadway Intersections(1) (2) (3) (4) (5)
CMF for Intersection Skew AngleCMF for Left‐Turn
Lanes CMF for Right‐Turn Lanes CMF for Lighting Combined CMFCMF 1i CMF 2i CMF 3i CMF 4i CMF COMB
from Equations 10‐22 or 10‐23 from Table 10‐13 from Table 10‐14 from Equation 10‐24 (1)*(2)*(3)*(4)1.00 1.00 1.00 1.00 1.00
Worksheet 2C ‐‐ Intersection Crashes for Rural Two‐Lane Two‐Way Roadway Intersections(1) (2) (3) (4) (5) (6) (7) (8)
Crash Severity Level
N spf 3ST, 4ST or 4SG
Overdispersion
Parameter, k
Crash Severity Distributi
onN spf 3ST, 4ST or 4SG by
Severity DistributionCombined CMFs
Calibration Factor, Ci
Predicted average crash frequency, N predicted int
from Equations 10‐8, 10‐9, or 10‐10
from Section 10.6.2
from Table 10‐
5(2)TOTAL * (4) from (5) of
Worksheet 2B(5)*(6)*(7)
Total 6.796 0.11 1.000 6.796 1.00 0.64 4.350Fatal and Injury (FI) ‐‐ ‐‐ 0.340 2.311 1.00 0.64 1.479Property Damage Only (PDO) ‐‐
‐‐ 0.660 4.486 1.00 0.64 2.871
Rural 2-Lane Intersection Exercise
23
Module 4b: Spreadsheets
Module 4b ‐ 24HSM Training
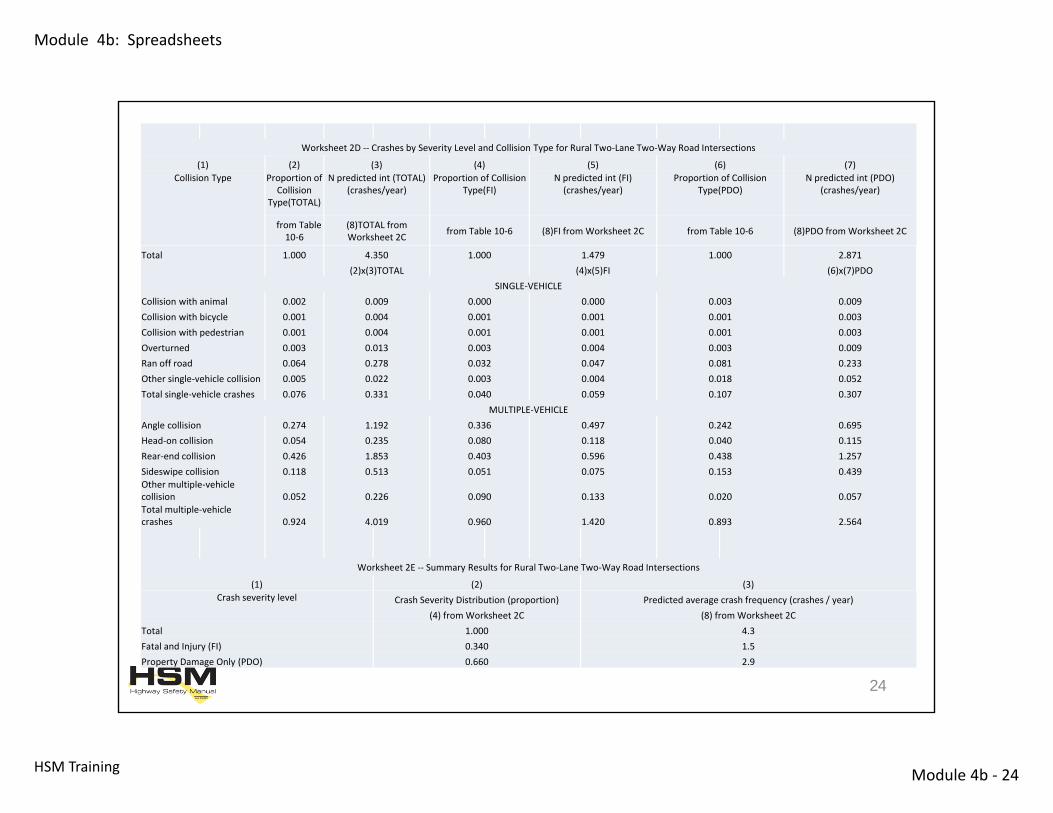
Worksheet 2D ‐‐ Crashes by Severity Level and Collision Type for Rural Two‐Lane Two‐Way Road Intersections
(1) (2) (3) (4) (5) (6) (7)Collision Type Proportion of
Collision Type(TOTAL)
N predicted int (TOTAL) (crashes/year)
Proportion of Collision Type(FI)
N predicted int (FI) (crashes/year)
Proportion of Collision Type(PDO)
N predicted int (PDO) (crashes/year)
from Table 10‐6
(8)TOTAL from Worksheet 2C from Table 10‐6 (8)FI from Worksheet 2C from Table 10‐6 (8)PDO from Worksheet 2C
Total 1.000 4.350 1.000 1.479 1.000 2.871(2)x(3)TOTAL (4)x(5)FI (6)x(7)PDO
SINGLE‐VEHICLECollision with animal 0.002 0.009 0.000 0.000 0.003 0.009Collision with bicycle 0.001 0.004 0.001 0.001 0.001 0.003Collision with pedestrian 0.001 0.004 0.001 0.001 0.001 0.003Overturned 0.003 0.013 0.003 0.004 0.003 0.009Ran off road 0.064 0.278 0.032 0.047 0.081 0.233Other single‐vehicle collision 0.005 0.022 0.003 0.004 0.018 0.052Total single‐vehicle crashes 0.076 0.331 0.040 0.059 0.107 0.307
MULTIPLE‐VEHICLEAngle collision 0.274 1.192 0.336 0.497 0.242 0.695Head‐on collision 0.054 0.235 0.080 0.118 0.040 0.115Rear‐end collision 0.426 1.853 0.403 0.596 0.438 1.257Sideswipe collision 0.118 0.513 0.051 0.075 0.153 0.439Other multiple‐vehicle collision 0.052 0.226 0.090 0.133 0.020 0.057Total multiple‐vehicle crashes 0.924 4.019 0.960 1.420 0.893 2.564
Worksheet 2E ‐‐ Summary Results for Rural Two‐Lane Two‐Way Road Intersections
(1) (2) (3)Crash severity level Crash Severity Distribution (proportion) Predicted average crash frequency (crashes / year)
(4) from Worksheet 2C (8) from Worksheet 2CTotal 1.000 4.3Fatal and Injury (FI) 0.340 1.5Property Damage Only (PDO) 0.660 2.9
24