hsbcc-ccy-wekly-cognitive dissonance and the usd
TRANSCRIPT

abcGlobal Research
Market focus pg 2
RORO is the default paradigm under which to analyse market moves and has been since
the crisis. However, it is the very strength of this paradigm which leads to such peculiar
behaviour of the market with respect to the USD. If the fiscal cliff occurs, we expect that
this will lead to a generic risk-off move. For equities and bonds the default risk-off
behaviour makes sense. However, buying the USD on such news is a contradictory
reaction to the news. One option is to wait for the dollar buying to abate and to then go
against the market. Alternatively one could side step the dollar entirely. Here one would
trade the cross rates and sell risk-on currencies and buy the risk-off ones.
Bank of Japan preview pg 4
The BoJ meet on Tuesday 30 October and an announcement some time between 4am and
6am London time is expected. We believe the market’s expectations of something “Big”
happening are over-stated. The recent weakness of the yen appears to have been generated
by the belief that the Bank of Japan (BoJ) will do something dramatic to weaken the yen.
We believe that once again the sense of drama has been overplayed. Various attempts by
the Japanese authorities to weaken the yen over the last 20 years have had little or no
success. So the market believes this time it’s different, we do not.
Quant indicators pg 9
Regular updates of our quantitative indicators. This includes an overview of the
correlations between all G10 exchange rates; a series of indicators that measure the
dominance of the ‘risk-on – risk-off’ phenomenon, including new emerging markets
RORO analysis; and indices that quantify the market’s appetite for risk.
29 October 2012
Currency Weekly
Cognitive dissonance and the USD
Macro Currency Strategy
David Bloom Strategist HSBC Bank plc +44 20 7991 5969 [email protected]
Paul Mackel Strategist The Hongkong and Shanghai Banking Corporation Limited +852 2996 6565 [email protected]
Daragh Maher Strategist HSBC Bank plc +44 20 7991 5968 [email protected]
Stacy Williams Strategist HSBC Bank plc +44 20 7991 5967 [email protected]
Mark McDonald Strategist HSBC Bank plc +44 20 7991 5966 [email protected]
Robert Lynch Strategist HSBC Securities (USA) Inc +1 212 525 3159 [email protected]
Mark Austin Consultant
View HSBC Global Research at: http://www.research.hsbc.com
Issuer of report: HSBC Bank plc
Disclaimer & Disclosures This report must be read with the disclosures and the analyst certifications in the Disclosure appendix, and with the Disclaimer, which forms part of it

2
Macro Currency Strategy 29 October 2012
abc
Cognitive dissonance and the USD Cognitive dissonance is the feeling of discomfort which results from holding two contradictory ideas at
the same time. This mental state is unpleasant, and we are then motivated to reduce or eliminate it, and
achieve consistency. Crucially, this often happens on a subconscious level – often leading to behaviour
which appears utterly irrational.
What we want to express is how the USD relationship with RORO is creating cognitive dissonance. This
is particularly important due to the upcoming possibility of a “fiscal cliff”.
USD dissonance
As a result of the dominance of the RORO factor the concept of the USD behaving as a safe haven is well
and truly embedded in the psyche of the market. As we can see in chart 1, the USD is currently the most
risk-off currency. As a result, whenever we are confronted with bad news people buy the USD.
However, the USD is about to provide the market with some serious cognitive dissonance. Since the intensity
of the Eurozone worries diminished, the clouds on the economic horizon are coming from the US. In any
rational world, a US-specific crisis would be bad news for the USD. However, people are now wedded to the
view that bad news = buy USD. The cognitive dissonance generated by the US-specific nature of the fiscal cliff
is likely to lead people to simply buy the USD as usual – at least as a knee-jerk reaction. Clearly we think that
this would a misguided reaction to the news. If this occurs we advise waiting for this reaction to run out of
steam and use it as an opportunity to sell the USD from higher levels.
1. USD the most risk-off currency
-1.00-0.75-0.50-0.25
0.000.250.500.751.00
S&PEuro Stoxx 50LatamR
ussell 2000CAC 40Dow
JonesDAXEM
EAFTSE 100N
ASDAQ
EURAsiaCopperCADNZDO
ilCottonG
oldCHFAUDSilverHeating oilW
heatNO
KSoybeanFra 10yr gov bondsN
atural gasG
BPJPYUK 10yr gov bondsG
er 10yr gov bondsBAA corp bondsVIXUSDC
an 10yr gov bondsAAA corp bondsU
S 10yr gov bonds
-1.00-0.75-0.50-0.25
0.000.250.500.751.00
Corre
latio
n wi
th R
isk O
n - R
isk
Off F
acto
r
Source: HSBC, Bloomberg
Market focus
3
Macro Currency Strategy 29 October 2012
abc
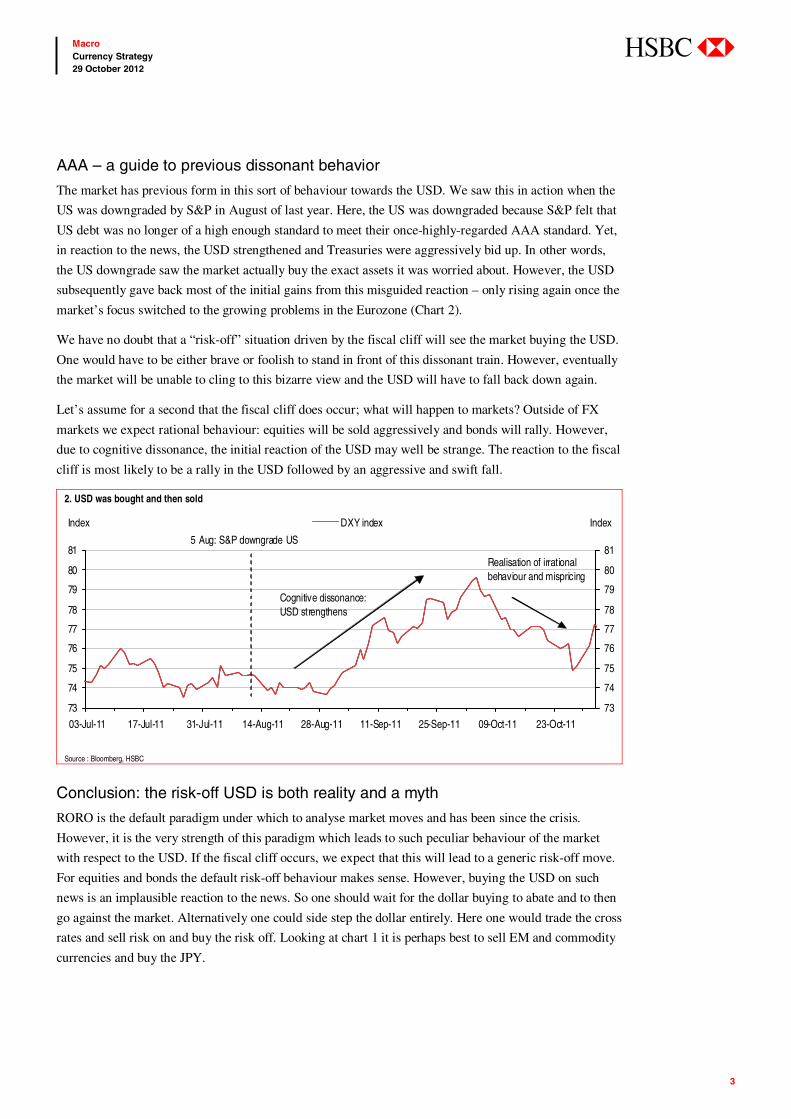
AAA – a guide to previous dissonant behavior
The market has previous form in this sort of behaviour towards the USD. We saw this in action when the
US was downgraded by S&P in August of last year. Here, the US was downgraded because S&P felt that
US debt was no longer of a high enough standard to meet their once-highly-regarded AAA standard. Yet,
in reaction to the news, the USD strengthened and Treasuries were aggressively bid up. In other words,
the US downgrade saw the market actually buy the exact assets it was worried about. However, the USD
subsequently gave back most of the initial gains from this misguided reaction – only rising again once the
market’s focus switched to the growing problems in the Eurozone (Chart 2).
We have no doubt that a “risk-off” situation driven by the fiscal cliff will see the market buying the USD.
One would have to be either brave or foolish to stand in front of this dissonant train. However, eventually
the market will be unable to cling to this bizarre view and the USD will have to fall back down again.
Let’s assume for a second that the fiscal cliff does occur; what will happen to markets? Outside of FX
markets we expect rational behaviour: equities will be sold aggressively and bonds will rally. However,
due to cognitive dissonance, the initial reaction of the USD may well be strange. The reaction to the fiscal
cliff is most likely to be a rally in the USD followed by an aggressive and swift fall.
2. USD was bought and then sold
73
74
75
76
77
78
79
80
81
03-Jul-11 17-Jul-11 31-Jul-11 14-Aug-11 28-Aug-11 11-Sep-11 25-Sep-11 09-Oct-11 23-Oct-11
73
74
75
76
77
78
79
80
81
DXY index
5 Aug: S&P downgrade US
Realisation of irrational behaviour and mispricing
Cognitive dissonance: USD strengthens
Index Index
Source : Bloomberg, HSBC
Conclusion: the risk-off USD is both reality and a myth
RORO is the default paradigm under which to analyse market moves and has been since the crisis.
However, it is the very strength of this paradigm which leads to such peculiar behaviour of the market
with respect to the USD. If the fiscal cliff occurs, we expect that this will lead to a generic risk-off move.
For equities and bonds the default risk-off behaviour makes sense. However, buying the USD on such
news is an implausible reaction to the news. So one should wait for the dollar buying to abate and to then
go against the market. Alternatively one could side step the dollar entirely. Here one would trade the cross
rates and sell risk on and buy the risk off. Looking at chart 1 it is perhaps best to sell EM and commodity
currencies and buy the JPY.

4
Macro Currency Strategy 29 October 2012
abc
JPY up the stairs down the elevator The JPY has been on the back foot in October and this is best seen by the rise in USD-JPY. The markets
once again think ‘this time is different’ and this could be yet another turning point for the JPY. The recent
weakness of the JPY appears to have been generated by the belief that the Bank of Japan (BoJ) will do
something dramatic to weaken the currency. We expect that once again the sense of drama has been
overplayed. We have seen various attempts by the Japanese authorities to weaken the JPY over the last 20
years with little or no success. So why does the market believe this time it’s different?
1. The reality 2. The excitement
7580859095
100105110115120125
Jun-07 Jun-08 Jun-09 Jun-10 Jun-11 Jun-12
7580859095100105110115120125
USD-JPY
01 Jun 2007 - 29 Oct 2012
77
77.5
78
78.5
79
79.5
80
80.5
81
01-Aug 15-Aug 29-Aug 12-Sep 26-Sep 10-Oct 24-Oct
77
77.5
78
78.5
79
79.5
80
80.5
81USD-JPY
01 Aug 2012 - 29 Oct 2012
Source: Bloomberg, HSBC Source: Bloomberg, HSBC
Chart 3 illustrates how the consensus perpetually expects USD-JPY to rise. The market seems to have a
similar prejudice. For example, following the additional JPY10trn of QE injected by the BoJ on 19
September the market jumped to the conclusion that the BoJ will begin more aggressive QE and would
actively attempt to weaken the JPY – this never materialised. Some of the ideas being discussed this time
around include the BoJ expanding its Asset Purchase Program, direct intervention in the FX markets and
even some were suggesting the radical idea of introducing a Swiss-style floor.
Past QE or direct intervention in the FX market, in the long run, has had very little success in preventing
Bank of Japan Preview
3. Consensus has consistently expected USD-JPY to rise
75
80
85
90
95
100
105
Jan 09 Jul 09 Jan 10 Jul 10 Jan 11 Jul 11 Jan 12 Jul 12 Jan 13 Jul 13
75
80
85
90
95
100
105
USD-JPY Consensus forecasts
Forecasts July 2011
Forecasts October 2012
Forecasts July 2010Forecasts July 2009
Source: Bloomberg, HSBC
5
Macro Currency Strategy 29 October 2012
abc
USD-JPY grinding lower and on this issue this time should be no different. We also find it very difficult
to believe the BoJ will implement a USD-JPY floor. It is time to end this bias and prejudice against the
JPY.
Asset Purchase Program
It is now expected that the BoJ will expand its APP program at its 30 October meeting. For any
discernible impact on the JPY this will need to supersede the JPY10trn already expected. Even then, this
alone would likely prove insufficient to undermine the JPY.
Conventional theory would suggest that QE would weaken the JPY because of the downward effect on
bond yields and the outward flow of capital that should follow. This has not worked in Japan for 20 years,
nor has this worked for the US or the UK. So why the market suddenly believes this will work to weaken
the JPY is quite difficult to fathom. We at HSBC actually believe the APP will be JPY positive. Table 4
shows the changes in USD-JPY following QE from the BoJ. The results highlight that the monetary
easing policy has not been very successful in weakening the JPY. When it has worked, the period of JPY
weakening has reversed itself aggressively.
4. USD-JPY levels after BoJ QE*
14-Mar 2011 04-Aug 2011 27-Oct 2011 14-Feb 2012 27-Apr 2012 19-Sep 2012
Start 81.63 78.77 75.81 78.42 80.46 78.39 1 week 81.02 76.72 77.97 79.73 79.93 77.79 2 week 81.39 76.5 77.63 80.51 79.83 78.55 1 month 84.62 76.76 77.71 83.63 79.44 79.24 2 month 80.72 76.69 77.92 80.91 79.75 n/a 3 month 80.66 n/a 77.71 n/a 78.57 n/a 4 month 77.63 n/a n/a n/a 78.71 n/a Source: HSBC, Bloomberg * The table looks at the effects of QE on USD-JPY until further QE is introduced
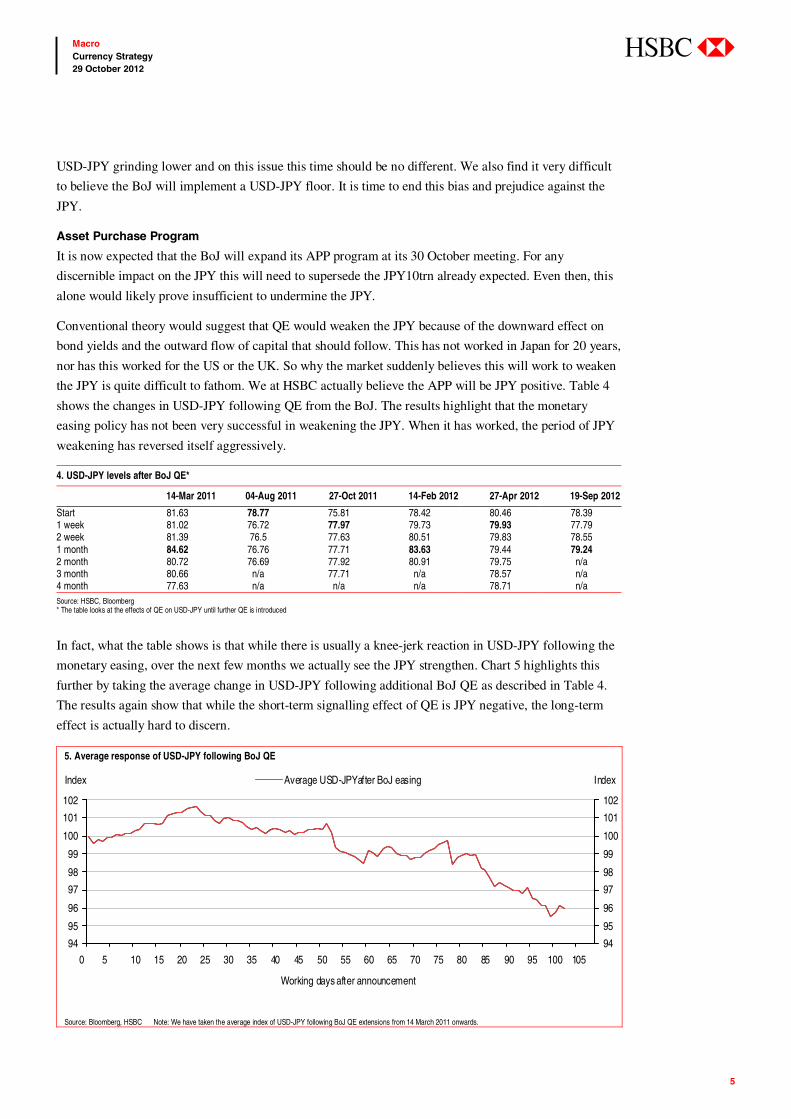
In fact, what the table shows is that while there is usually a knee-jerk reaction in USD-JPY following the
monetary easing, over the next few months we actually see the JPY strengthen. Chart 5 highlights this
further by taking the average change in USD-JPY following additional BoJ QE as described in Table 4.
The results again show that while the short-term signalling effect of QE is JPY negative, the long-term
effect is actually hard to discern.
5. Average response of USD-JPY following BoJ QE
94
95
96
97
98
99
100
101
102
0 5 10 15 20 25 30 35 40 45 50 55 60 65 70 75 80 85 90 95 100 105
94
95
96
97
98
99
100
101
102
Average USD-JPYafter BoJ easing
Working days after announcement
Index Index
Source: Bloomberg, HSBC Note: We have taken the average index of USD-JPY following BoJ QE extensions from 14 March 2011 onwards.
6
Macro Currency Strategy 29 October 2012
abc
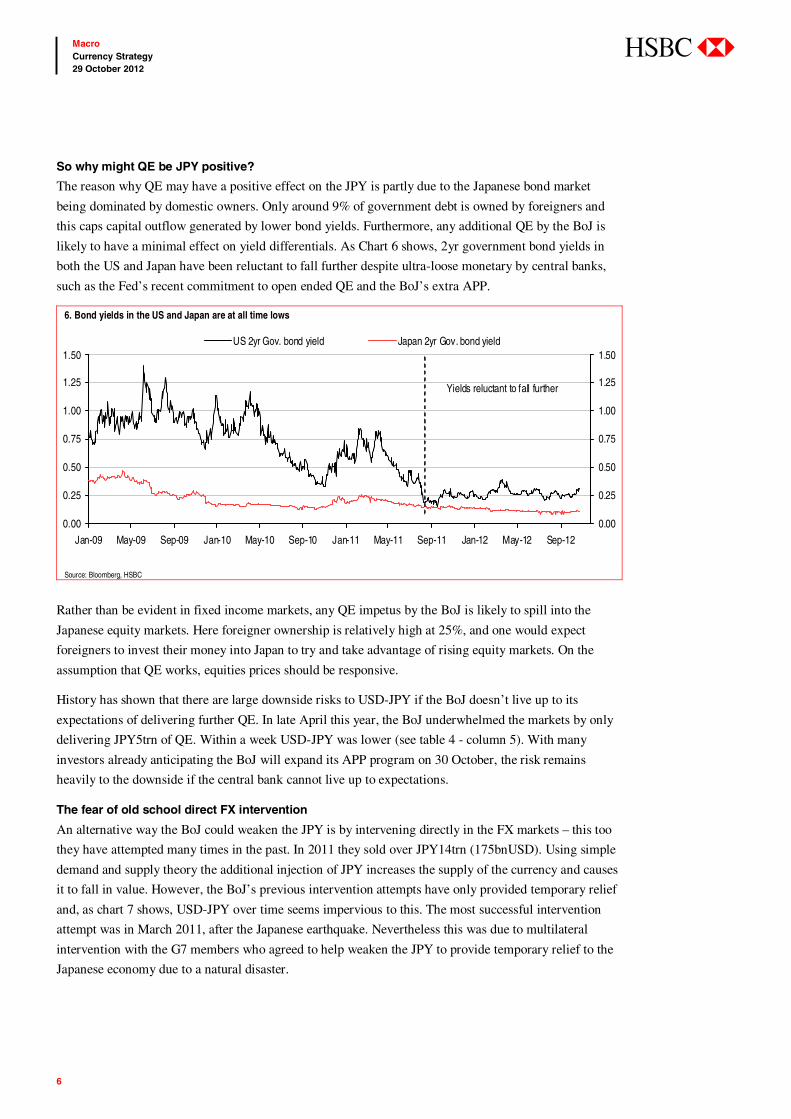
So why might QE be JPY positive?
The reason why QE may have a positive effect on the JPY is partly due to the Japanese bond market
being dominated by domestic owners. Only around 9% of government debt is owned by foreigners and
this caps capital outflow generated by lower bond yields. Furthermore, any additional QE by the BoJ is
likely to have a minimal effect on yield differentials. As Chart 6 shows, 2yr government bond yields in
both the US and Japan have been reluctant to fall further despite ultra-loose monetary by central banks,
such as the Fed’s recent commitment to open ended QE and the BoJ’s extra APP.
6. Bond yields in the US and Japan are at all time lows
0.00
0.25
0.50
0.75
1.00
1.25
1.50
Jan-09 May-09 Sep-09 Jan-10 May-10 Sep-10 Jan-11 May-11 Sep-11 Jan-12 May-12 Sep-12
0.00
0.25
0.50
0.75
1.00
1.25
1.50US 2yr Gov. bond yield Japan 2yr Gov. bond yield
Yields reluctant to fall further
Source: Bloomberg, HSBC
Rather than be evident in fixed income markets, any QE impetus by the BoJ is likely to spill into the
Japanese equity markets. Here foreigner ownership is relatively high at 25%, and one would expect
foreigners to invest their money into Japan to try and take advantage of rising equity markets. On the
assumption that QE works, equities prices should be responsive.
History has shown that there are large downside risks to USD-JPY if the BoJ doesn’t live up to its
expectations of delivering further QE. In late April this year, the BoJ underwhelmed the markets by only
delivering JPY5trn of QE. Within a week USD-JPY was lower (see table 4 - column 5). With many
investors already anticipating the BoJ will expand its APP program on 30 October, the risk remains
heavily to the downside if the central bank cannot live up to expectations.
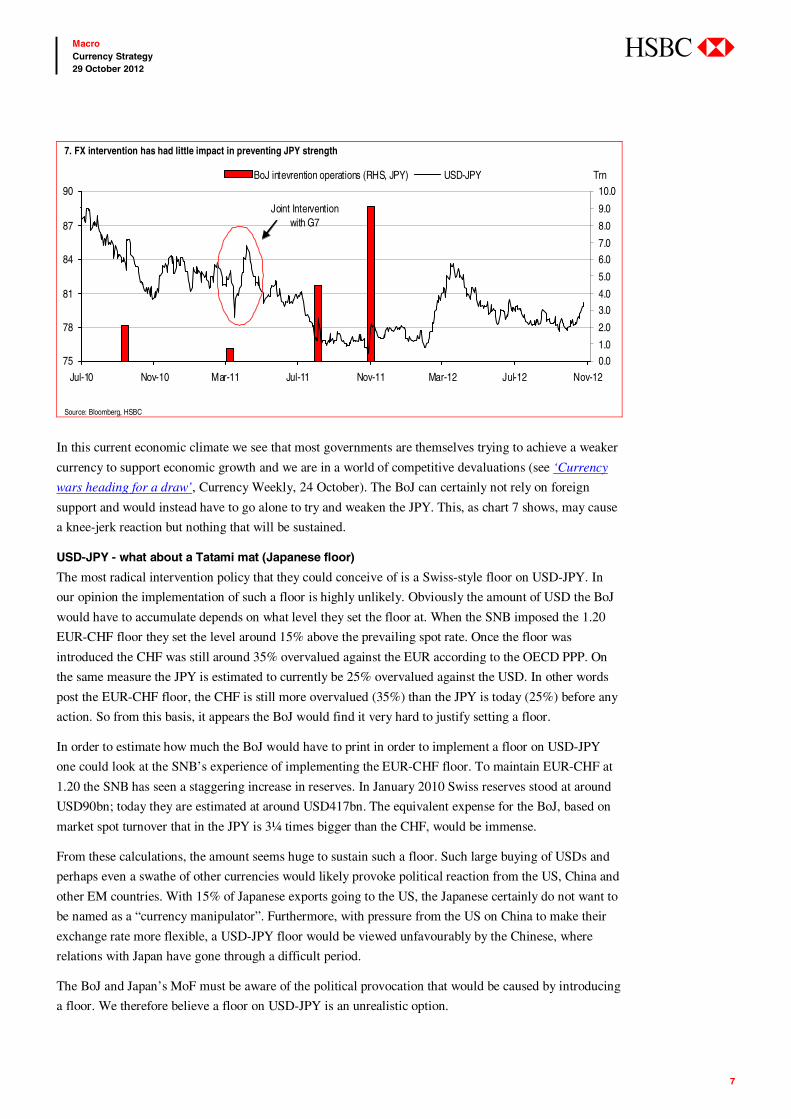
The fear of old school direct FX intervention
An alternative way the BoJ could weaken the JPY is by intervening directly in the FX markets – this too
they have attempted many times in the past. In 2011 they sold over JPY14trn (175bnUSD). Using simple
demand and supply theory the additional injection of JPY increases the supply of the currency and causes
it to fall in value. However, the BoJ’s previous intervention attempts have only provided temporary relief
and, as chart 7 shows, USD-JPY over time seems impervious to this. The most successful intervention
attempt was in March 2011, after the Japanese earthquake. Nevertheless this was due to multilateral
intervention with the G7 members who agreed to help weaken the JPY to provide temporary relief to the
Japanese economy due to a natural disaster.
7
Macro Currency Strategy 29 October 2012
abc
In this current economic climate we see that most governments are themselves trying to achieve a weaker
currency to support economic growth and we are in a world of competitive devaluations (see ‘Currency
wars heading for a draw’, Currency Weekly, 24 October). The BoJ can certainly not rely on foreign
support and would instead have to go alone to try and weaken the JPY. This, as chart 7 shows, may cause
a knee-jerk reaction but nothing that will be sustained.
USD-JPY - what about a Tatami mat (Japanese floor)
The most radical intervention policy that they could conceive of is a Swiss-style floor on USD-JPY. In
our opinion the implementation of such a floor is highly unlikely. Obviously the amount of USD the BoJ
would have to accumulate depends on what level they set the floor at. When the SNB imposed the 1.20
EUR-CHF floor they set the level around 15% above the prevailing spot rate. Once the floor was
introduced the CHF was still around 35% overvalued against the EUR according to the OECD PPP. On
the same measure the JPY is estimated to currently be 25% overvalued against the USD. In other words
post the EUR-CHF floor, the CHF is still more overvalued (35%) than the JPY is today (25%) before any
action. So from this basis, it appears the BoJ would find it very hard to justify setting a floor.
In order to estimate how much the BoJ would have to print in order to implement a floor on USD-JPY
one could look at the SNB’s experience of implementing the EUR-CHF floor. To maintain EUR-CHF at
1.20 the SNB has seen a staggering increase in reserves. In January 2010 Swiss reserves stood at around
USD90bn; today they are estimated at around USD417bn. The equivalent expense for the BoJ, based on
market spot turnover that in the JPY is 3¼ times bigger than the CHF, would be immense.
From these calculations, the amount seems huge to sustain such a floor. Such large buying of USDs and
perhaps even a swathe of other currencies would likely provoke political reaction from the US, China and
other EM countries. With 15% of Japanese exports going to the US, the Japanese certainly do not want to
be named as a “currency manipulator”. Furthermore, with pressure from the US on China to make their
exchange rate more flexible, a USD-JPY floor would be viewed unfavourably by the Chinese, where
relations with Japan have gone through a difficult period.
The BoJ and Japan’s MoF must be aware of the political provocation that would be caused by introducing
a floor. We therefore believe a floor on USD-JPY is an unrealistic option.
7. FX intervention has had little impact in preventing JPY strength
75
78
81
84
87
90
Jul-10 Nov-10 Mar-11 Jul-11 Nov-11 Mar-12 Jul-12 Nov-12
0.0
1.0
2.0
3.0
4.0
5.0
6.0
7.0
8.0
9.0
10.0BoJ intevrention operations (RHS, JPY) USD-JPY
Joint Intervention with G7
Trn
Source: Bloomberg, HSBC
8
Macro Currency Strategy 29 October 2012
abc
Conclusion
The recent rally in USD-JPY has once again come off the back of investors believing “this time is
different”. The expectation is the Japanese authorities may actively try and weaken the JPY. Under the
scenario that the BoJ expands its QE we still believe that this may actually be JPY positive. More direct
and unilateral FX intervention would also likely be ineffective in preventing USD-JPY strength in the
long term – as it has been over the last 20 years. It also appears very unlikely that the BoJ would embark
on supporting a USD-JPY floor as the political ramifications could be potentially damaging.
The bias and prejudice towards the JPY has caused investors to once again buy USD-JPY. While this may
have temporarily worked, the market will soon realise that even the BoJ is incapable of preventing the
JPY from strengthening – in the ugly contest that is currently being played out in the FX markets. USD-
JPY has been climbing up the stairs but it will soon fall down the lift shaft – ever was it thus.
9
Macro Currency Strategy 29 October 2012
abc
In this section, we publish a series of quantitative indicators that summarise current market conditions.
Below, we provide an overview of these indices and explain what they are currently telling us about the
state of the market.
1. RORO: Risk on – risk off indices (pg 10)
(a) RORO Index
The HSBC RORO index measures the extent to which the risk on – risk off paradigm is driving markets.
A high level of the index indicates that risk on – risk off is dominant and correlations are high across
many different assets. In addition to the RORO index, we also measure the extent to which different
assets and regions are driven by the risk-on – risk-off phenomenon rather than asset or region-specific
factors.
At present, the RORO Index is at extremely high levels. This indicates that the risk-on – risk-off
phenomenon continues to dominate markets. The USD is the most risk-off currency.
(b) Emerging Market RORO Indices
The EM RORO indices measure the strength of regional correlations in Asia, Latin America and EMEA.
Strong correlation in a particular region could be the result of RORO driving synchronised moves in that
region, or the result of local phenomena. To separate the two effects, we measure the extent to which
correlations in the different regions are driven by risk on – risk off rather than local factors.
Regional correlations within EM are strongest within Asia.
(c) Equity RORO Index
The Equity RORO index measures the strength of correlations within the main “risky” asset class of
equities. The Equity RORO Index is at moderately high levels.
2. OPRA: Position-based risk appetite index (pg 16)
The OPRA index measures risk appetite based on the positions held in contracts with varying degrees of
risk by speculative traders on US futures exchanges. The OPRA index is in neutral territory, which
means that speculative traders have shifted their positions in a way unrelated to the risk of holding them.
3. MRAI: Price-based risk appetite index (pg 17)
The MRAI measures risk appetite based on changes in the price and volatility of several assets that are
known to be strongly affected by the market’s appetite for risk. The index has moved sideways with
high volatility since May 2010. This is indicative of neutral risk appetite and is consistent with the
RORO phenomenon.
4. Correlation: G10 exchange rates (pg 18)
We show the strength of the correlations between all G10 exchange rates. This highlights currency pairs
that move independently or in the same (or opposite) direction.
Quant Indicators

10
Macro Currency Strategy 29 October 2012
abc
HSBC Risk-On – Risk-Off Index
Risk On – Risk Off Index RORO Index
The RORO index is at extremely high levels. This indicates that the risk-on – risk-off phenomenon continues to dominate markets. See Appendix A1 for more details of the methodology.
Source: HSBC, Bloomberg
Asset correlations with the risk-on – risk-off factor RORO Correlations
The assets that were most highly correlated with the risk-on – risk-off factor during the previous 20 weeks were:
Risk-on assets S&P Euro Stoxx 50
Risk-off assets AAA Corporate bonds US government bonds
Uncorrelated with RORO NOK Wheat EM regions are all strongly correlated with RORO. However, Latam and EMEA are slightly more strongly correlated to RORO than Asia.
Source: HSBC, Bloomberg
Uncorrelated with RORO
RORO
paradigm
stronger
Strongly risk on Strongly risk off
RORO
paradigm
weaker
11
Macro Currency Strategy 29 October 2012
abc
HSBC Emerging Market RORO Indices
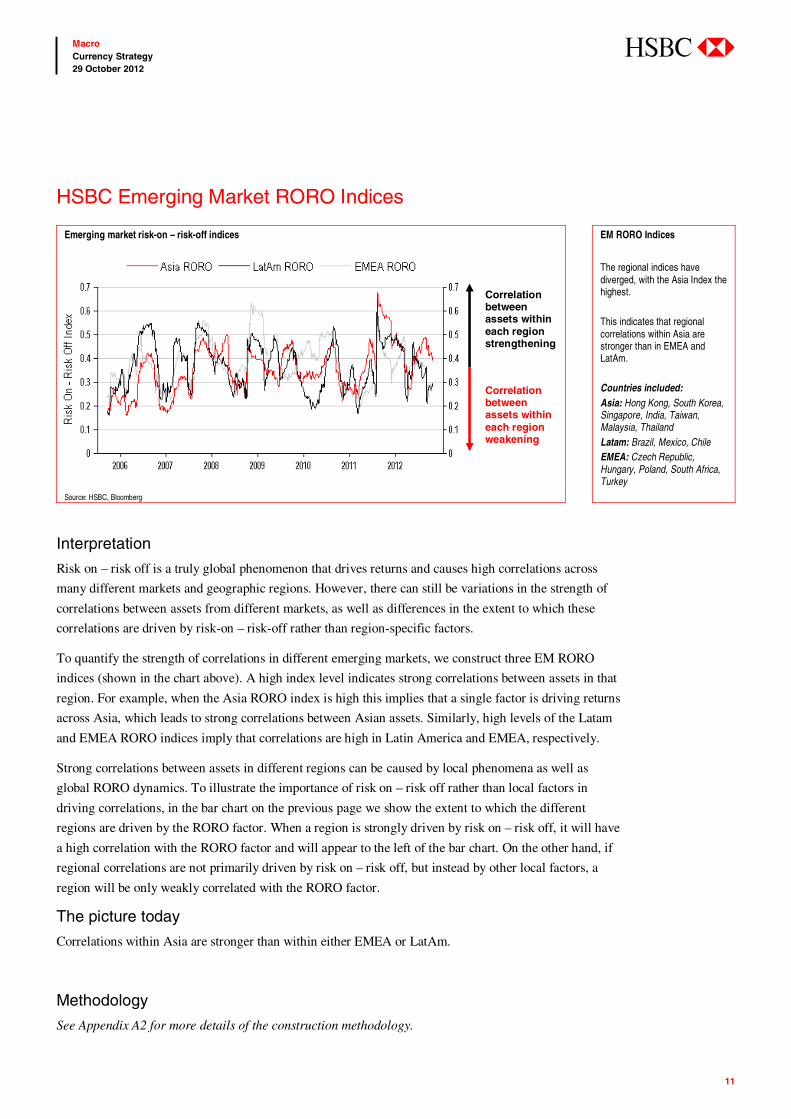
Interpretation
Risk on – risk off is a truly global phenomenon that drives returns and causes high correlations across
many different markets and geographic regions. However, there can still be variations in the strength of
correlations between assets from different markets, as well as differences in the extent to which these
correlations are driven by risk-on – risk-off rather than region-specific factors.
To quantify the strength of correlations in different emerging markets, we construct three EM RORO
indices (shown in the chart above). A high index level indicates strong correlations between assets in that
region. For example, when the Asia RORO index is high this implies that a single factor is driving returns
across Asia, which leads to strong correlations between Asian assets. Similarly, high levels of the Latam
and EMEA RORO indices imply that correlations are high in Latin America and EMEA, respectively.
Strong correlations between assets in different regions can be caused by local phenomena as well as
global RORO dynamics. To illustrate the importance of risk on – risk off rather than local factors in
driving correlations, in the bar chart on the previous page we show the extent to which the different
regions are driven by the RORO factor. When a region is strongly driven by risk on – risk off, it will have
a high correlation with the RORO factor and will appear to the left of the bar chart. On the other hand, if
regional correlations are not primarily driven by risk on – risk off, but instead by other local factors, a
region will be only weakly correlated with the RORO factor.
The picture today
Correlations within Asia are stronger than within either EMEA or LatAm.
Methodology
See Appendix A2 for more details of the construction methodology.
Emerging market risk-on – risk-off indices EM RORO Indices
The regional indices have diverged, with the Asia Index the highest.
This indicates that regional correlations within Asia are stronger than in EMEA and LatAm.
Countries included: Asia: Hong Kong, South Korea, Singapore, India, Taiwan, Malaysia, Thailand Latam: Brazil, Mexico, Chile EMEA: Czech Republic, Hungary, Poland, South Africa, Turkey
Source: HSBC, Bloomberg
Correlation between assets within each region strengthening
Correlation between assets within each region weakening

12
Macro Currency Strategy 29 October 2012
abc
Correlation heat map
Reading the heat maps
The heat map shows the correlations between different assets during the last 80 days. Dark red regions
indicate strong positive correlations. Dark blue regions indicate strong negative correlations. Yellow
and green regions indicate weak correlations/uncorrelated assets.
The picture today
The heat map illustrates that the risk-on – risk-off phenomenon remains strong. There are two large red
blocks corresponding to a group of highly correlated risk-on assets and another group of highly correlated risk-
off assets. The blue regions show the negative correlations between strongly risk-on and strongly risk-off
assets, eg the S&P and the JPY. There are some green areas (weak correlations), which indicate that a few
assets have recently moved independently of the risk-on – risk-off phenomenon.
Heat map showing correlations over the last 80 days
Source: HSBC, Bloomberg
13
Macro Currency Strategy 29 October 2012
abc
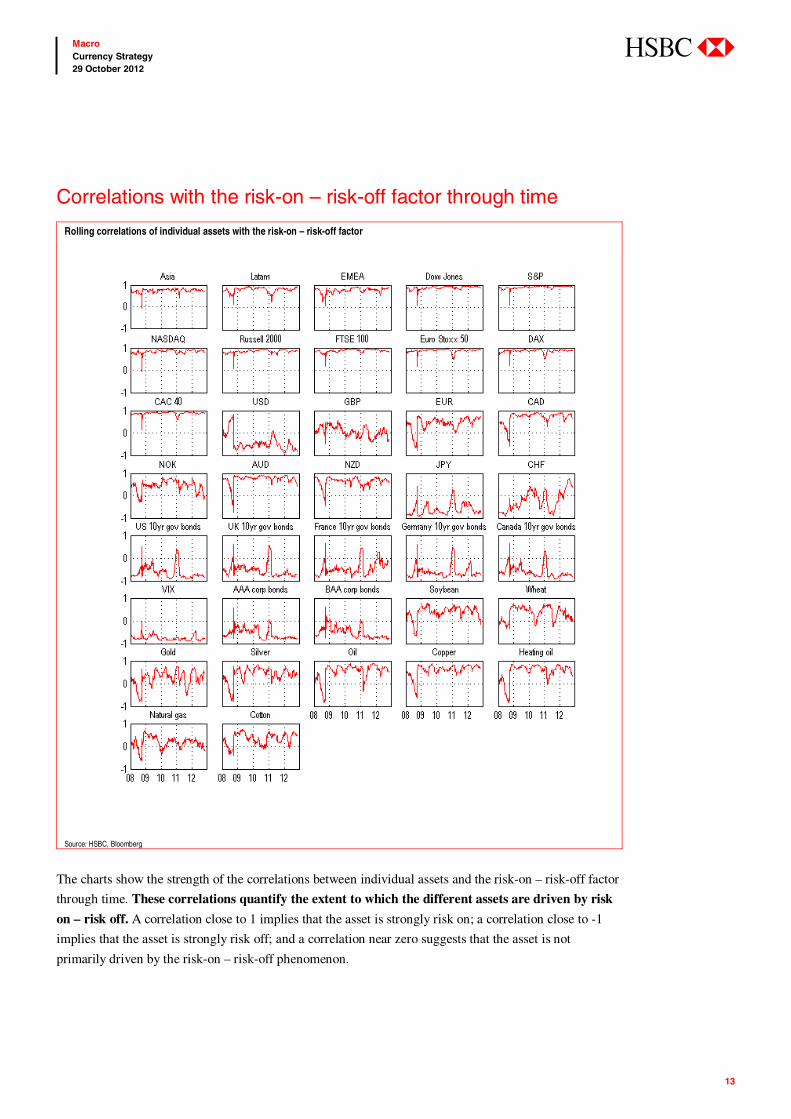
Correlations with the risk-on – risk-off factor through time
The charts show the strength of the correlations between individual assets and the risk-on – risk-off factor
through time. These correlations quantify the extent to which the different assets are driven by risk
on – risk off. A correlation close to 1 implies that the asset is strongly risk on; a correlation close to -1
implies that the asset is strongly risk off; and a correlation near zero suggests that the asset is not
primarily driven by the risk-on – risk-off phenomenon.
Rolling correlations of individual assets with the risk-on – risk-off factor
Source: HSBC, Bloomberg

14
Macro Currency Strategy 29 October 2012
abc
HSBC Equity RORO Index
Interpretation
Whilst risk on – risk off is inherently a cross-asset phenomenon, equities are the quintessential risk-on
asset. When there is a perception in the market that correlations are high, it is important to determine
whether it is simply a within-asset-class phenomenon or part of the wider global macro theme.
The HSBC Equity RORO Index allows us to distinguish between high correlations which are specific to
this main “risky” asset class and high cross-asset correlations, as measured in the original RORO Index,
which indicate broader macro stress.
The picture today
At the moment the Equity RORO Index is at moderately high levels; significantly lower than the all-
time highs seen in late 2011. This indicates that movements in individual equities remain similar, but with
more dispersion than in late 2011.
Equity RORO Index EM RORO Indices
The Equity RORO Index is at moderately high levels. This indicates that whilst equity moves remain highly correlated, there is significantly more dispersion than in late 2011. See Appendix A3 for more details of the methodology.
Source: HSBC, Bloomberg
Increasing correlation between individual equity returns
Decreasing correlation between individual equity returns
15
Macro Currency Strategy 29 October 2012
abc
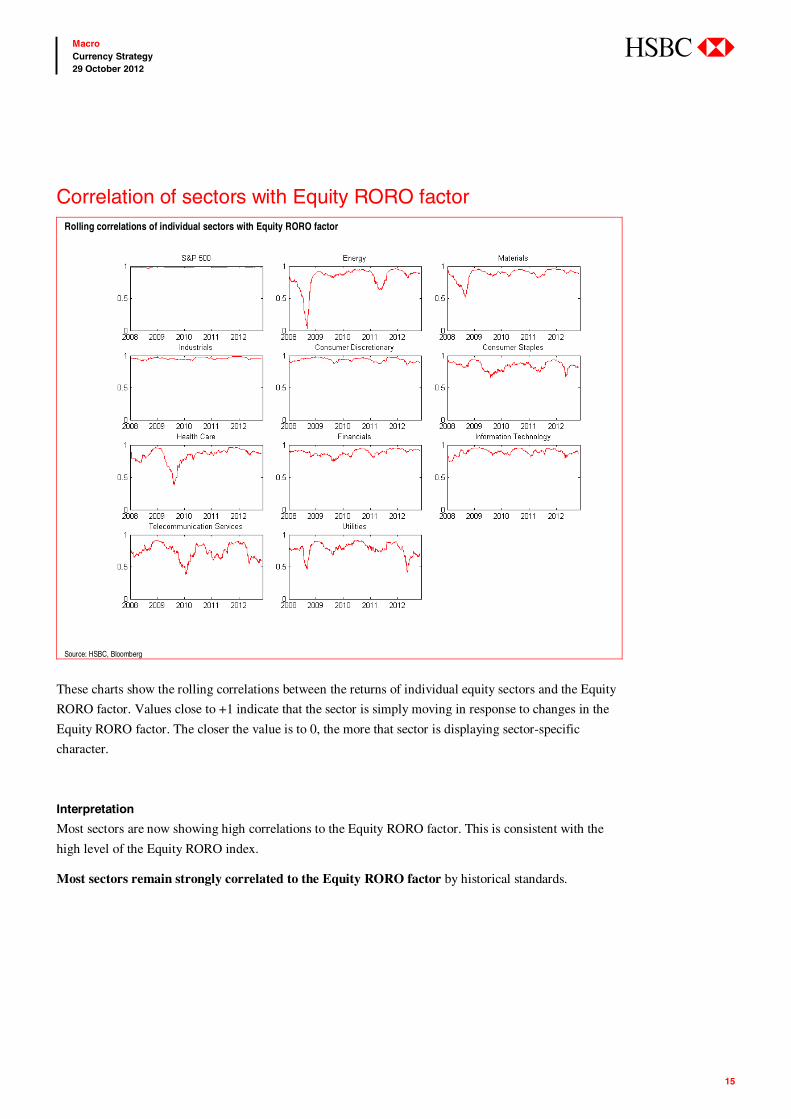
Correlation of sectors with Equity RORO factor Rolling correlations of individual sectors with Equity RORO factor
Source: HSBC, Bloomberg
These charts show the rolling correlations between the returns of individual equity sectors and the Equity
RORO factor. Values close to +1 indicate that the sector is simply moving in response to changes in the
Equity RORO factor. The closer the value is to 0, the more that sector is displaying sector-specific
character.
Interpretation
Most sectors are now showing high correlations to the Equity RORO factor. This is consistent with the
high level of the Equity RORO index.
Most sectors remain strongly correlated to the Equity RORO factor by historical standards.

16
Macro Currency Strategy 29 October 2012
abc
OPRA
Interpretation
When the OPRA index is close to 1 it indicates that speculators have increased their exposure to risky assets,
whereas a value close to -1 indicates that speculators have shifted their exposure to less risky assets.
The picture today
The position-based risk appetite index is in neutral territory. This means that speculative traders on the
US futures exchanges have shifted their positions in a way unrelated to the risk of holding them. This is
indicative of neutral risk appetite.
Methodology
The OPRA index is based on the relationship between changes in the futures positions held by speculative
traders in various contracts and the risk associated with holding the contracts. See Appendix B for more
details of the methodology.
OPRA Index
-0.8
-0.6
-0.4
-0.2
0.0
0.2
0.4
0.6
0.8
Dec-08 Jun-09 Dec-09 Jun-10 Dec-10 Jun-11 Dec-11 Jun-12
-0.8
-0.6
-0.4
-0.2
0
0.2
0.4
0.6
0.8
Risk
App
etite
Decr
easi
ngNe
utra
lTe
rrito
ryRi
sk A
ppet
iteIn
crea
sing
Source: HSBC, Bloomberg

17
Macro Currency Strategy 29 October 2012
abc
MRAI
Interpretation
A positive trend in the MRAI implies increasing risk appetite whereas a negative trend implies decreasing
risk appetite.
The picture today
The MRAI has been volatile and has shown no clear trend since May 2010. This indicates that there is
constantly changing appetite for risk, which is consistent with the risk-on – risk-off phenomenon.
MRAI: Short-term picture Short-term picture
The price-based risk appetite index has moved sideways with high volatility since May 2010. This index is based on changes in prices and volatilities of assets that are known to be affected by risk appetite. See Appendix C for more details of the methodology.
Source: HSBC, Bloomberg
MRAI: Long-term picture Long-term picture
The MRAI is in a long-term downward trend.
Source: HSBC, Bloomberg
Volatile and no clear trend Increasing risk
appetite
Decreasing risk appetite

18
Macro Currency Strategy 29 October 2012
abc
G10 Exchange Rate Correlations In the linked document at the following url
(https://www.research.hsbc.com/midas/Res/RDV?ao=20&key=XQsrkkKb2R&n=348065.PDF ), we
show the strength of the correlations between all G10 exchange rates. If one has a view on how an
exchange rate is going to move, this can be used to identify other trading opportunities by highlighting
other currency pairs that move independently or in the same (or opposite) direction.
The chart below is an example page from this document for AUD-JPY. The three bar charts show:
The correlation of AUD-JPY with all other G10 crosses during the previous week;
A comparison of AUD-JPY correlations during the previous week with a 1-week period 1-month
ago; and
A comparison of last week’s AUD-JPY correlations with the average correlation during the
previous month.
To enable us to calculate correlations over periods as short as a week, we have used hourly price data. In
the linked document, we provide similar charts for all other G10 crosses and more details of the
methodology that we use to construct the charts.
Example page from the linked correlation document: AUD-JPY correlations over the last week and versus the previous month
Source: HSBC
19
Macro Currency Strategy 29 October 2012
abc
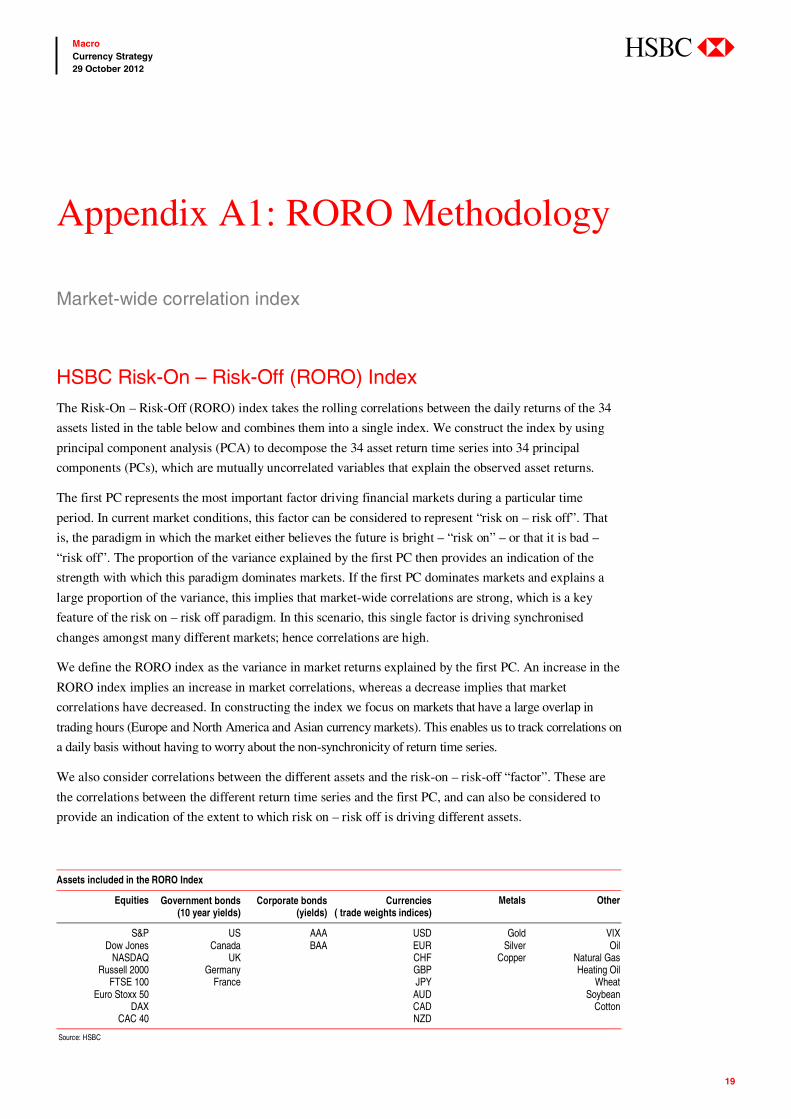
HSBC Risk-On – Risk-Off (RORO) Index The Risk-On – Risk-Off (RORO) index takes the rolling correlations between the daily returns of the 34
assets listed in the table below and combines them into a single index. We construct the index by using
principal component analysis (PCA) to decompose the 34 asset return time series into 34 principal
components (PCs), which are mutually uncorrelated variables that explain the observed asset returns.
The first PC represents the most important factor driving financial markets during a particular time
period. In current market conditions, this factor can be considered to represent “risk on – risk off”. That
is, the paradigm in which the market either believes the future is bright – “risk on” – or that it is bad –
“risk off”. The proportion of the variance explained by the first PC then provides an indication of the
strength with which this paradigm dominates markets. If the first PC dominates markets and explains a
large proportion of the variance, this implies that market-wide correlations are strong, which is a key
feature of the risk on – risk off paradigm. In this scenario, this single factor is driving synchronised
changes amongst many different markets; hence correlations are high.
We define the RORO index as the variance in market returns explained by the first PC. An increase in the
RORO index implies an increase in market correlations, whereas a decrease implies that market
correlations have decreased. In constructing the index we focus on markets that have a large overlap in
trading hours (Europe and North America and Asian currency markets). This enables us to track correlations on
a daily basis without having to worry about the non-synchronicity of return time series.
We also consider correlations between the different assets and the risk-on – risk-off “factor”. These are
the correlations between the different return time series and the first PC, and can also be considered to
provide an indication of the extent to which risk on – risk off is driving different assets.
Appendix A1: RORO Methodology
Market-wide correlation index
Assets included in the RORO Index
Equities Government bonds(10 year yields)
Corporate bonds(yields)
Currencies( trade weights indices)
Metals Other
S&P US AAA USD Gold VIX Dow Jones Canada BAA EUR Silver Oil
NASDAQ UK CHF Copper Natural Gas Russell 2000 Germany GBP Heating Oil
FTSE 100 France JPY Wheat Euro Stoxx 50 AUD Soybean
DAX CAD Cotton CAC 40 NZD
Source: HSBC

20
Macro Currency Strategy 29 October 2012
abc
HSBC Emerging Market RORO Indices We produce Emerging Market RORO Indices for Asia, Latin America, and EMEA. We construct the
indices using a similar methodology to that described in Appendix A1 for the cross-asset RORO index.
For each region, we perform a principal component analysis (PCA) on the returns of a range of assets
from that region. We then define each regional index as the proportion of the variance in the returns of
assets in that region explained by the first principal component (PC).
For the original multi-asset RORO Index the first PC represents the most important global macro factor
driving returns across a wide range of different assets. When the RORO index is high, this factor is
strong. The regional EM indices have an analogous interpretation. For example, when the Asia RORO
index is high this implies that a single factor is driving returns across Asia, which leads to strong
correlations between Asian assets. Similarly, high levels of the Latam and EMEA RORO indices imply
that correlations are high in Latin America and EMEA, respectively.
For each of the regions, we use both bond and equity data for the countries listed in the table below. To
enable us to compare the regional indices, we use weekly price data to eliminate any effects due to the
different time zones. This also allows us to compare these indices to the cross-asset RORO. We consider
the correlation between the dominant market factor in the different regions and the main risk on – risk off
factor that we identify in our cross-asset analysis. This is the correlations between the first PC for each
region and the first PC for the cross-asset returns. The strength of these correlations can be considered to
provide an indication of the extent to which risk on – risk off is driving returns in the different regions.
Appendix A2: EM RORO
Regional emerging market correlations
Assets included in the EM RORO Indices
Asia Latin America EMEA
Hong Kong Brazil Czech Republic South Korea Mexico Hungary Singapore Chile Poland India South Africa Taiwan Turkey Malaysia Thailand
Source: HSBC
21
Macro Currency Strategy 29 October 2012
abc
HSBC Equity RORO Index The HSBC Equity RORO Index looks at all current members of the S&P 500 Index that have an
appropriate data history back to 1 January 1990. We use a similar construction methodology for this index
to the one described in Appendix A1 for the RORO Index.
To construct the Equity RORO Index we perform a principal component analysis (PCA) on the returns of
all of the equities that we consider. We define the index as the proportion of the variance in the returns of
these equities that can be explained by the first principal component (PC).
This first PC is the most important factor driving the returns at any time. For the original multi-asset
RORO Index the first PC represents the most important global macro factor driving returns across a wide
range of different assets. When the RORO index is high, this factor is strong.
For the Equity RORO, there is an analogous interpretation; however, in this case we are only looking at
the risky asset class of equities. When the Equity RORO index is high it indicates there is a
“supercharged” market beta dominating stocks – correlations are high and individual identity is reduced.
We use the two indices together to characterise the stress in the global macro environment. High
correlations are generally an indication of market strain and have consequences for most asset classes.
The two indices help understand the extent to which stress is confined to risky assets or is
more comprehensive.
Appendix A3: Equity RORO
Equity market correlations

22
Macro Currency Strategy 29 October 2012
abc
Open Positions Risk Appetite (OPRA) Index We use speculative positions from the CFTC Commitments of Traders report to measure risk appetite.
We track changes in exposure of the speculative community to the various contracts listed in the table
below and relate these changes to the risk associated with the contracts.
We view it as a sign of high risk appetite when the speculative community has increased its exposure to
the more risky assets more than for less risky assets. To measure this we calculate the rank correlation
between changes in the speculative open interest and volatility. A rank correlation is used since this is less
susceptible to outliers than a standard correlation.
Since this is a correlation, the index will lie between -1 and +1. A value close to +1 indicates that
speculators have been increasing their positions in risky assets across the board, with the largest
percentage increase in exposure being in the riskiest assets. A value close to the minimum value of -1
indicates the opposite. If speculative positions have been changing in a way unrelated to risk, then the
value of this index will be close to zero.
Contracts included in OPRA Index
Agricultural Drinks Metals Currencies Oil Other
Corn Cocoa Platinum AUD LSCrude Lumber Oats Coffee Silver CAD Unleaded Rough Rice OJ Copper CHF Heating Oil Soybeans EUR Natural Gas Soybean Oil GBP Soybean Meal JPY Wheat Cotton Lean Hogs Live Cattle
Source: HSBC
Appendix B: OPRA Methodology
Position-based risk appetite index

23
Macro Currency Strategy 29 October 2012
abc
Market Risk Appetite Index (MRAI) The MRAI measures the aggregate level of risk appetite in the financial system using risk premia from
various markets. The index is based on changes in price and volatility of several assets that are known to
be strongly affected by risk appetite. A positive trend in the MRAI implies an increasing appetite for risk
whereas a negative trend in the MRAI implies a decreasing appetite for risk.
We construct the index using equally weighted z-scores of changes in the level of six inputs: the VIX and
VDAX volatility indices; the Global Hazard Index, which aggregates the 3-month implied volatilities for
EURUSD, USDJPY, and EURJPY; BAA and AAA corporate bonds spreads; and interest rate swap spreads.
Appendix C: MRAI Methodology
Price-based risk appetite index

24
Macro Currency Strategy 29 October 2012
abc
Disclosure appendix Analyst Certification The following analyst(s), economist(s), and/or strategist(s) who is(are) primarily responsible for this report, certifies(y) that the opinion(s) on the subject security(ies) or issuer(s) and/or any other views or forecasts expressed herein accurately reflect their personal view(s) and that no part of their compensation was, is or will be directly or indirectly related to the specific recommendation(s) or views contained in this research report: David Bloom, Daragh Maher, Stacy Williams, Robert Lynch, Paul Mackel and Mark McDonald
Important Disclosures This document has been prepared and is being distributed by the Research Department of HSBC and is intended solely for the clients of HSBC and is not for publication to other persons, whether through the press or by other means.
This document is for information purposes only and it should not be regarded as an offer to sell or as a solicitation of an offer to buy the securities or other investment products mentioned in it and/or to participate in any trading strategy. Advice in this document is general and should not be construed as personal advice, given it has been prepared without taking account of the objectives, financial situation or needs of any particular investor. Accordingly, investors should, before acting on the advice, consider the appropriateness of the advice, having regard to their objectives, financial situation and needs. If necessary, seek professional investment and tax advice.
Certain investment products mentioned in this document may not be eligible for sale in some states or countries, and they may not be suitable for all types of investors. Investors should consult with their HSBC representative regarding the suitability of the investment products mentioned in this document and take into account their specific investment objectives, financial situation or particular needs before making a commitment to purchase investment products.
The value of and the income produced by the investment products mentioned in this document may fluctuate, so that an investor may get back less than originally invested. Certain high-volatility investments can be subject to sudden and large falls in value that could equal or exceed the amount invested. Value and income from investment products may be adversely affected by exchange rates, interest rates, or other factors. Past performance of a particular investment product is not indicative of future results.
Analysts, economists, and strategists are paid in part by reference to the profitability of HSBC which includes investment banking revenues.
For disclosures in respect of any company mentioned in this report, please see the most recently published report on that company available at www.hsbcnet.com/research.
* HSBC Legal Entities are listed in the Disclaimer below.
Additional disclosures 1 This report is dated as at 29 October 2012. 2 All market data included in this report are dated as at close 26 October 2012, unless otherwise indicated in the report. 3 HSBC has procedures in place to identify and manage any potential conflicts of interest that arise in connection with its
Research business. HSBC's analysts and its other staff who are involved in the preparation and dissemination of Research operate and have a management reporting line independent of HSBC's Investment Banking business. Information Barrier procedures are in place between the Investment Banking and Research businesses to ensure that any confidential and/or price sensitive information is handled in an appropriate manner.

25
Macro Currency Strategy 29 October 2012
abc
Disclaimer * Legal entities as at 8 August 2012 ‘UAE’ HSBC Bank Middle East Limited, Dubai; ‘HK’ The Hongkong and Shanghai Banking Corporation Limited, Hong Kong; ‘TW’ HSBC Securities (Taiwan) Corporation Limited; 'CA' HSBC Bank Canada, Toronto; HSBC Bank, Paris Branch; HSBC France; ‘DE’ HSBC Trinkaus & Burkhardt AG, Düsseldorf; 000 HSBC Bank (RR), Moscow; ‘IN’ HSBC Securities and Capital Markets (India) Private Limited, Mumbai; ‘JP’ HSBC Securities (Japan) Limited, Tokyo; ‘EG’ HSBC Securities Egypt SAE, Cairo; ‘CN’ HSBC Investment Bank Asia Limited, Beijing Representative Office; The Hongkong and Shanghai Banking Corporation Limited, Singapore Branch; The Hongkong and Shanghai Banking Corporation Limited, Seoul Securities Branch; The Hongkong and Shanghai Banking Corporation Limited, Seoul Branch; HSBC Securities (South Africa) (Pty) Ltd, Johannesburg; HSBC Bank plc, London, Madrid, Milan, Stockholm, Tel Aviv; ‘US’ HSBC Securities (USA) Inc, New York; HSBC Yatirim Menkul Degerler AS, Istanbul; HSBC México, SA, Institución de Banca Múltiple, Grupo Financiero HSBC; HSBC Bank Brasil SA – Banco Múltiplo; HSBC Bank Australia Limited; HSBC Bank Argentina SA; HSBC Saudi Arabia Limited; The Hongkong and Shanghai Banking Corporation Limited, New Zealand Branch incorporated in Hong Kong SAR
Issuer of report HSBC Bank plc
8 Canada Square, London
E14 5HQ, United Kingdom
Telephone: +44 20 7991 8888
Telex: 888866
Fax: +44 20 7992 4880
Website: www.research.hsbc.com
This document is issued and approved in the United Kingdom by HSBC Bank plc for the information of its Clients (as defined in the Rules of FSA) and those of its affiliates only. If this research is received by a customer of an affiliate of HSBC, its provision to the recipient is subject to the terms of business in place between the recipient and such affiliate. In Australia, this publication has been distributed by The Hongkong and Shanghai Banking Corporation Limited (ABN 65 117 925 970, AFSL 301737) for the general information of its “wholesale” customers (as defined in the Corporations Act 2001). Where distributed to retail customers, this research is distributed by HSBC Bank Australia Limited (AFSL No. 232595). These respective entities make no representations that the products or services mentioned in this document are available to persons in Australia or are necessarily suitable for any particular person or appropriate in accordance with local law. No consideration has been given to the particular investment objectives, financial situation or particular needs of any recipient. The document is distributed in Hong Kong and Japan by The Hongkong and Shanghai Banking Corporation Limited and has been prepared for the New York office of HSBC Bank USA, National Association. In Korea, this publication is distributed by either The Hongkong and Shanghai Banking Corporation Limited, Seoul Securities Branch ("HBAP SLS") or The Hongkong and Shanghai Banking Corporation Limited, Seoul Branch ("HBAP SEL") for the general information of professional investors specified in Article 9 of the Financial Investment Services and Capital Markets Act (“FSCMA”). This publication is not a prospectus as defined in the FSCMA. It may not be further distributed in whole or in part for any purpose. Both HBAP SLS and HBAP SEL are regulated by the Financial Services Commission and the Financial Supervisory Service of Korea. Each of the companies listed above (the “Participating Companies”) is a member of the HSBC Group of Companies, any member of which may trade for its own account as Principal, may have underwritten an issue within the last 36 months or, together with its Directors, officers and employees, may have a long or short position in securities or instruments or in any related instrument mentioned in the document. Brokerage or fees may be earned by the Participating Companies or persons associated with them in respect of any business transacted by them in all or any of the securities or instruments referred to in this document. This publication is distributed in New Zealand by The Hongkong and Shanghai Banking Corporation Limited, New Zealand Branch incorporated in Hong Kong SAR. The information in this document is derived from sources the Participating Companies believe to be reliable but which have not been independently verified. The Participating Companies make no guarantee of its accuracy and completeness and are not responsible for errors of transmission of factual or analytical data, nor shall the Participating Companies be liable for damages arising out of any person’s reliance upon this information. All charts and graphs are from publicly available sources or proprietary data. The opinions in this document constitute the present judgement of the Participating Companies, which is subject to change without notice. This document is neither an offer to sell, purchase or subscribe for any investment nor a solicitation of such an offer. HSBC Securities (USA) Inc. accepts responsibility for the content of this research report prepared by its non-US foreign affiliate. All US persons receiving and/or accessing this report and intending to effect transactions in any security discussed herein should do so with HSBC Securities (USA) Inc. in the United States and not with its non-US foreign affiliate, the issuer of this report. In Singapore, this publication is distributed by The Hongkong and Shanghai Banking Corporation Limited, Singapore Branch for the general information of institutional investors or other persons specified in Sections 274 and 304 of the Securities and Futures Act (Chapter 289) (“SFA”) and accredited investors and other persons in accordance with the conditions specified in Sections 275 and 305 of the SFA. This publication is not a prospectus as defined in the SFA. It may not be further distributed in whole or in part for any purpose. The Hongkong and Shanghai Banking Corporation Limited Singapore Branch is regulated by the Monetary Authority of Singapore. Recipients in Singapore should contact a "Hongkong and Shanghai Banking Corporation Limited, Singapore Branch" representative in respect of any matters arising from, or in connection with this report. HSBC México, S.A., Institución de Banca Múltiple, Grupo Financiero HSBC is authorized and regulated by Secretaría de Hacienda y Crédito Público and Comisión Nacional Bancaria y de Valores (CNBV). HSBC Bank (Panama) S.A. is regulated by Superintendencia de Bancos de Panama. Banco HSBC Honduras S.A. is regulated by Comisión Nacional de Bancos y Seguros (CNBS). Banco HSBC Salvadoreño, S.A. is regulated by Superintendencia del Sistema Financiero (SSF). HSBC Colombia S.A. is regulated by Superintendencia Financiera de Colombia. Banco HSBC Costa Rica S.A. is supervised by Superintendencia General de Entidades Financieras (SUGEF). Banistmo Nicaragua, S.A. is authorized and regulated by Superintendencia de Bancos y de Otras Instituciones Financieras (SIBOIF). The document is intended to be distributed in its entirety. Unless governing law permits otherwise, you must contact a HSBC Group member in your home jurisdiction if you wish to use HSBC Group services in effecting a transaction in any investment mentioned in this document. HSBC Bank plc is registered in England No 14259, is authorised and regulated by the Financial Services Authority and is a member of the London Stock Exchange. (070905) In Canada, this document has been distributed by HSBC Bank Canada and/or its affiliates. Where this document contains market updates/overviews, or similar materials (collectively deemed “Commentary” in Canada although other affiliate jurisdictions may term “Commentary” as either “macro-research” or “research”), the Commentary is not an offer to sell, or a solicitation of an offer to sell or subscribe for, any financial product or instrument (including, without limitation, any currencies, securities,commodities or other financial instruments). © Copyright 2012, HSBC Bank plc, ALL RIGHTS RESERVED. No part of this publication may be reproduced, stored in a retrieval system, or transmitted, on any form or by any means, electronic, mechanical, photocopying, recording, or otherwise, without the prior written permission of HSBC Bank plc. MICA (P) 038/04/2012, MICA (P) 063/04/2012 and MICA (P) 206/01/2012

abc
Global
David Bloom Global Head of FX Research +44 20 7991 5969 [email protected]
Asia
Paul Mackel Head of FX Research, Asia-Pacific +852 2996 6565 [email protected]
Perry Kojodjojo +852 2996 6568 [email protected]
Dominic Bunning +852 2822 1672 [email protected]
Ju Wang +852 2822 4340 [email protected]
United Kingdom
Daragh Maher +44 20 7991 5968 [email protected]
Stacy Williams +44 20 7991 5967 [email protected]
Mark McDonald +44 20 7991 5966 [email protected]
Murat Toprak +44 20 7991 5415 [email protected]
Mark Austin Consultant
United States
Robert Lynch +1 212 525 3159 [email protected]
Clyde Wardle +1 212 525 3345 [email protected]
Marjorie Hernandez +1 212 525 4109 [email protected]
Technical Analysis
Murray Gunn +44 20 7991 6797 murray,[email protected]
Precious Metals
James Steel +1 212 525 3117 [email protected]
Howard Wen +1 212 525 3726 [email protected]
Global Currency Strategy Research Team