how to program your way into data science?
TRANSCRIPT

How to program your way into Data Science?
Eeshan ChatterjeeData Scientist @ MediaIQ Digitalhttps://in.linkedin.com/in/eeshanchatterjeewww.github.com/EeshanChatterjee

What is Data?Google Definition:
● Facts and statistics collected together for reference or analysis.
● The quantities, characters, or symbols on which operations are performed by a computer, which may be stored and transmitted in the form of electrical signals and recorded on magnetic, optical, or mechanical recording media.
● Things known or assumed as facts, making the basis of reasoning or calculation.
Umm... OK. But what is data in the business world?
Lets simplify the entire thing.
If you can Observe it, Record it, Store it and Measure it, It's gonna help your business. This is the data that is important to you.

What data does my business generate?
Each and every department, right from the CEO's Office, to the janitorial division collects data.
Stored!
People Data
Sales Data
Customer Satisfaction Data
Industrial Production & Wastage Data Travel Data
Energy Data

Now the Buzzword: Data Science

The BasicsHow did we arrive at Data Science?
Measure KPIs
Model Key Metrics
OperationsResearch
The Era of Business Intelligence
Dashboards
Frequent Updates
Business Analytics
The Era of Data Science
Cockpits
DistributedComputation
Federated Data
Intelligent Systems
Guess What didn't Change: Help Business make Better Decisions!
The Era of Statistical Insight

The BasicsIf it's always been the same core job, can a statistician call himself a Data Scientist?
Well... Not exactly. Today the job has diversified, demanding a wider skillset!
Data Design Architect
Dat
a E
ngin
eer
Requirem
ent/Business
AnalystMath &
Statistics
Business&
Domain
Tech & Computer Science
DE
SIG
N T
HIN
KIN
G}

But.. Programming for Everything?
Actually, Yes. Let's look at a popular cheatsheet circulating on the internet.
Infographic courtesy: http://nirvacana.com/thoughts/becoming-a-data-scientist/
Guess what, We can't tick off 15% of this checklist without programming!

Programming for Math
ScriptingLanguage
Packages
DataStructures
Notebooks &Markdown
PlottingTechniques
Classes &Functions
Cross-Language Execution
The Algo Whiz Codebook
● Choose your scripting language. R & Python are the popular chioces.
● Use what's out there. Prebuilt packages for almost every technique are freely available for use.
● Interactive plots cut down EDA time by a huge margin.

R or Python?The holy grail of data science choices! It is indeed difficult to choose between the two.
Their capabilities are pretty much the same. So, Which one do I choose?*
Choose R When Choose Python When
● You are begining to explore your data
● You are looking to find one-time insight or developing analysis methodology
● You want to try out a broad spectrum of techniques to find best ensembles to use
● You have a good understanding of the data and techniques you want to use
● You want to deploy your analysis methodology as a persistant large-scale production system
● You want to train deep models on GPUs
* This one is based on my experience and opinion. It has worked for me.The next person you ask, will have a different take on the matter.
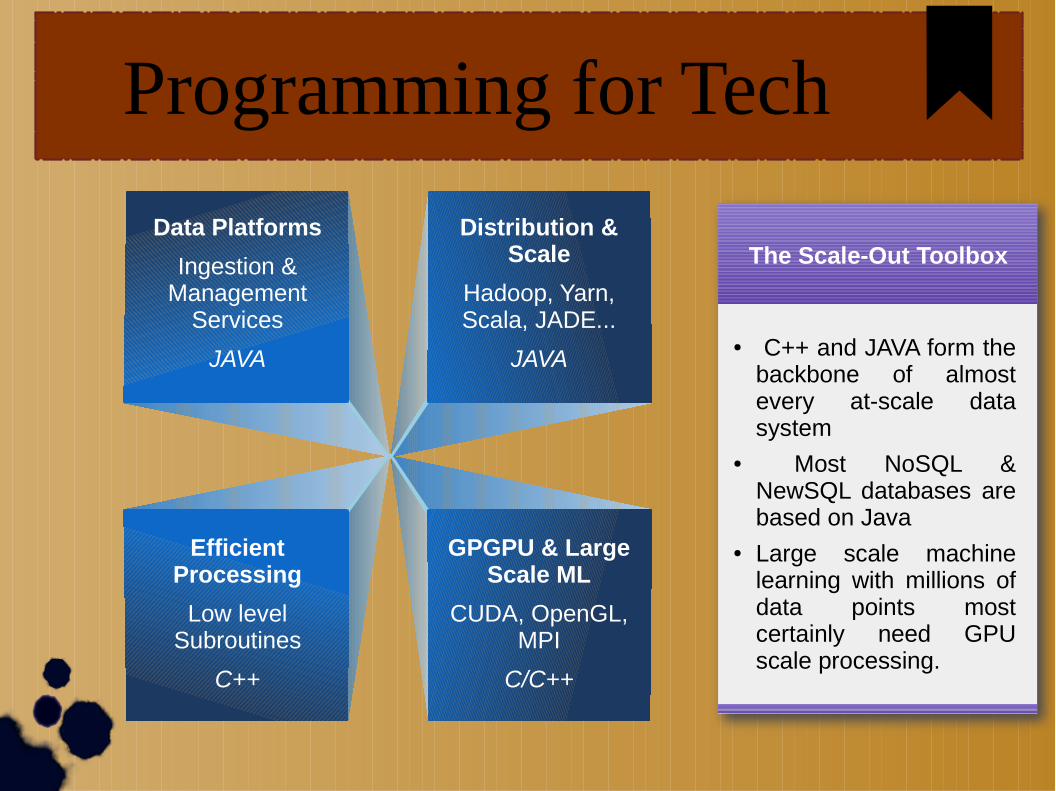
Programming for Tech
Data Platforms
Ingestion & Management
Services
JAVA
Distribution & Scale
Hadoop, Yarn, Scala, JADE...
JAVA
Efficient Processing
Low level Subroutines
C++
GPGPU & Large Scale ML
CUDA, OpenGL, MPI
C/C++
The Scale-Out Toolbox
● C++ and JAVA form the backbone of almost every at-scale data system
● Most NoSQL & NewSQL databases are based on Java
● Large scale machine learning with millions of data points most certainly need GPU scale processing.

Programming for the Business
Image courtesy: http://exposedata.com/tutorial/canvas/
The Decision-Maker's Cockpit
● Interactive charts allow answering of business questions intuitive.
● Real time updates allow decisions based on the latest information available.
● Bird's eye and drill down capabilities allow for multiple perspectives without losing context.

Design Thinking and Programming
Design Thinking let's you break down and analyse the problem and synthesize the best solution from multiple solutions possible.
At-Scale Solution
DesiredFutureState
Complication 1
Roadblock 2
Issue 3
Possible Solution 1
Possible Solution 2
Possible Solution 3
Possible Solution 4
Prototype Solution 4
Prototype Solution 3
Prototype Solution 2
Prototype Solution 1
Consumption
CurrentState
Define | Ideate | Prototype | Iterate | Develop | Deploy
