how to overcome anaerobic digestion … · biogas also contains small . ... an increase in the...
TRANSCRIPT
18th European Biosolids & Organic Resources Conference & Exhibition
www.european-biosolids.com
Organised by Aqua Enviro Technology Transfer
HOW TO OVERCOME ANAEROBIC DIGESTION TECHNICAL LIMITATIONS WITH
ULTRASOUND
Vergara L, Swain D and Melia J
Ultrawaves Global, UK
Corresponding Author +44 7714 082409 / [email protected]
Abstract
The generation and disposal of organic waste without adequate treatment will result in
significant environmental pollution. Apart from health concerns for the people in the
neighbourhood of disposal sites, degradation of waste leads to uncontrolled release of
greenhouse gases (GHGs) into the atmosphere. In this context, anaerobic digestion (AD)
offers potential benefits since AD facilities (ADFs) not only decrease GHGs emission but
also reduce dependence on fossil fuels for energy requirements. The anaerobic process
has several advantages over other methods of waste treatment. Most significantly, it is
able to accommodate relatively high rates of organic loading. With increasing use of
anaerobic technology for treating various process streams, it is expected that industries
would become more economically competitive because of their more judicious use of
natural resources. Therefore, AD technology is almost certainly assured of increased
usage in the future. The main disadvantage of AD may be found in a relatively slow
degradation rate of the biomass. In conventional digesters, the residence time is typically
about 3 weeks and more (depending on the digester type, fermentation, temperature,
etc.), resulting in the necessity of large digester volumes. However, in order to improve
the conventional AD process efficiency, Ultrawaves ultrasound (US) technology has
demonstrated to be a very effective method. Indeed, sonication of the active bacterial
biomass causes large shear stresses leading to cell lysis (destruction of cell walls and
release of cell’s content into the medium), sonochemical conversion of complex organic
compounds into simpler ones and increase of specific area of substrate particles, thus
making thus the biodegradation of biomass faster and more effective. This paper
attempts to inform technically and economically about the quick evolution and
development of the Ultrawaves technology within the ADFs market, that is, outside the
water industry where Ultrawaves has already reached more than a hundred facilities.
Keywords
Greenhouse gases, anaerobic digestion, degradation rate, biomass, fermentation,
ultrasound, sonication, active bacterial biomass, wastewater.
Introduction
As the name suggests, biogas is produced in a biological process which takes place
inside the ADF. In the absence of oxygen organic matter is broken down to form a gas
mixture known as biogas. This process is widely found in nature, taking place in moors, for
example, or at the bottom of lakes, in slurry pits and in the rumen of ruminants. Organic
matter is converted into biogas by a range of different microorganisms whilst energy
(heat) and new biomass are also generated. The resulting gas mixture consists primarily
of methane (50 - 75 vol. %) and carbon dioxide (25 - 50 vol. %). Biogas also contains small
18th European Biosolids & Organic Resources Conference & Exhibition
www.european-biosolids.com
Organised by Aqua Enviro Technology Transfer
quantities of hydrogen, hydrogen sulphide, ammonia and other trace gases. The
composition of the gas is essentially determined by the substrates, the fermentation
(digestion) process and the various technical designs of the plants.
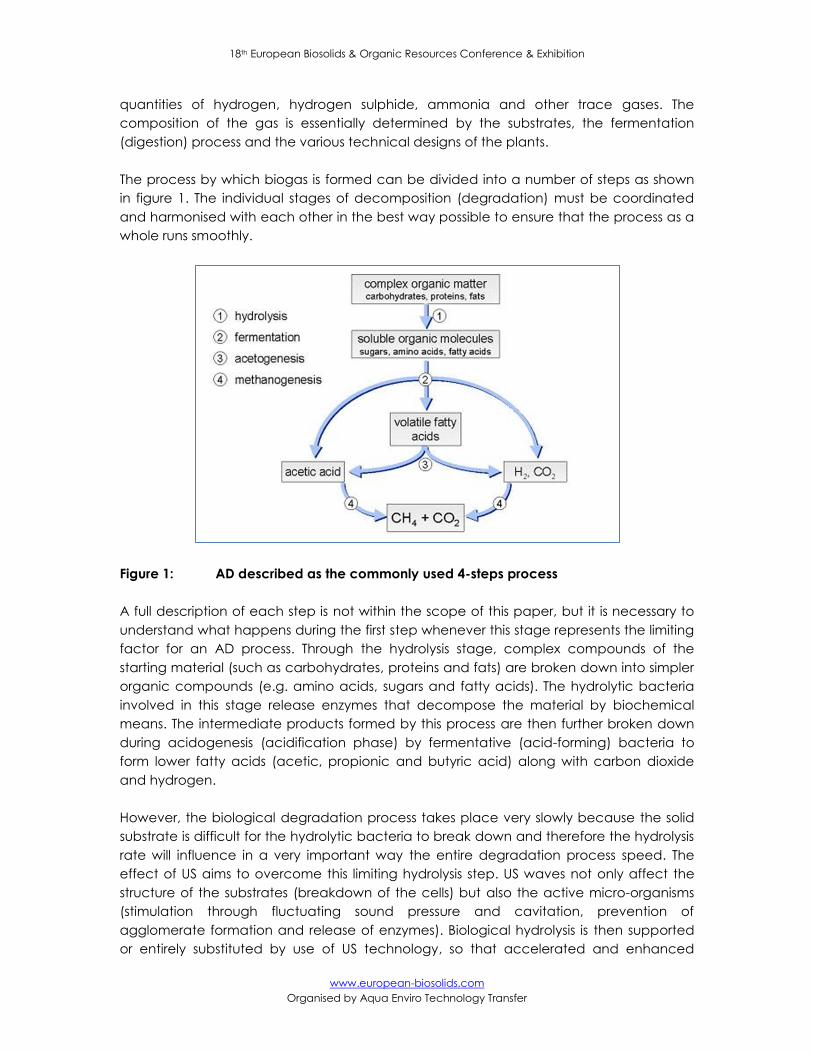
The process by which biogas is formed can be divided into a number of steps as shown
in figure 1. The individual stages of decomposition (degradation) must be coordinated
and harmonised with each other in the best way possible to ensure that the process as a
whole runs smoothly.
Figure 1: AD described as the commonly used 4-steps process
A full description of each step is not within the scope of this paper, but it is necessary to
understand what happens during the first step whenever this stage represents the limiting
factor for an AD process. Through the hydrolysis stage, complex compounds of the
starting material (such as carbohydrates, proteins and fats) are broken down into simpler
organic compounds (e.g. amino acids, sugars and fatty acids). The hydrolytic bacteria
involved in this stage release enzymes that decompose the material by biochemical
means. The intermediate products formed by this process are then further broken down
during acidogenesis (acidification phase) by fermentative (acid-forming) bacteria to
form lower fatty acids (acetic, propionic and butyric acid) along with carbon dioxide
and hydrogen.
However, the biological degradation process takes place very slowly because the solid
substrate is difficult for the hydrolytic bacteria to break down and therefore the hydrolysis
rate will influence in a very important way the entire degradation process speed. The
effect of US aims to overcome this limiting hydrolysis step. US waves not only affect the
structure of the substrates (breakdown of the cells) but also the active micro-organisms
(stimulation through fluctuating sound pressure and cavitation, prevention of
agglomerate formation and release of enzymes). Biological hydrolysis is then supported
or entirely substituted by use of US technology, so that accelerated and enhanced
18th European Biosolids & Organic Resources Conference & Exhibition
www.european-biosolids.com
Organised by Aqua Enviro Technology Transfer
degradation takes place. Fermenting microorganisms produce the enzymes (exo-
enzymes) necessary for degradation of the organic substrate. When Ultrawaves US
technology is used, even a small energy input results in enhanced release of these
enzymes so that the activity of the microorganisms is stimulated. Sonication also causes
an increase in the interface between the liquid and solid phase (disintegrated particles
and flocs), which facilitates enzymatic attack. Further energy supply also destroys the
walls of plant and bacterial cells and therefore results in the release of the dissolved
organic cell contents, which are in turn very readily degraded by fermentation. The end
effect is an intensified digestion process with further degradation of the organic
substrates and increased biogas production.
Therefore, by using US on the one hand more biogas can be produced from the same
biomass feed, and on the other hand it is also possible to reduce the feed quantity with
unchanged biogas production. In addition, the quality of the biogas is improved by an
increase in its methane content. Finally, sonication of the volumetric flow added reduces
the viscosity of the fermenter content and therefore makes it more fluid which reduces
the power consumption of agitators and pumps.
A quick review about ultrasound in environmental engineering
In the field in which sonication will be applied (biomass disintegration), US should be
considered as a sound wave with frequencies between 20 and 40 kHz and intensities
between 25 and 50 W/cm2. If US waves are applied to a liquid system under these
frequencies and intensities then it is possible to produce physical and chemical changes
in it through a technology which has become known as sonochemistry (Mason, 1991).
These changes result from the effects of the formation and collapse of cavitation
bubbles induced by sound energy - acoustic cavitation.
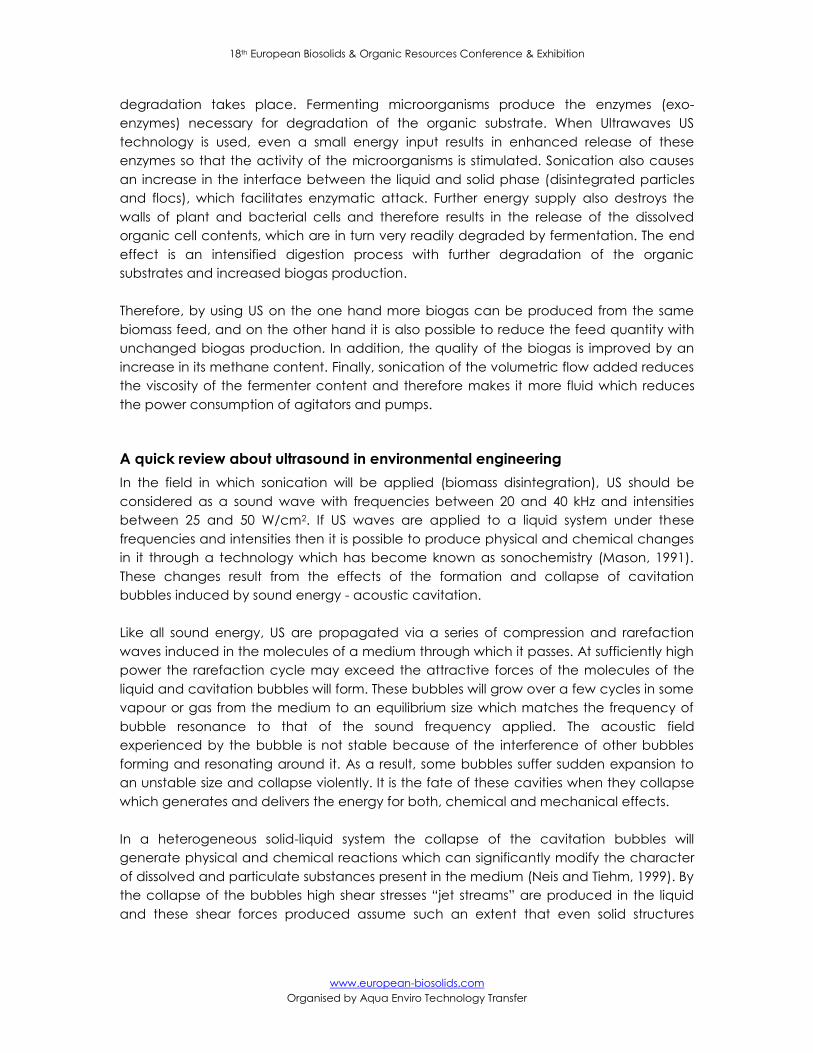
Like all sound energy, US are propagated via a series of compression and rarefaction
waves induced in the molecules of a medium through which it passes. At sufficiently high
power the rarefaction cycle may exceed the attractive forces of the molecules of the
liquid and cavitation bubbles will form. These bubbles will grow over a few cycles in some
vapour or gas from the medium to an equilibrium size which matches the frequency of
bubble resonance to that of the sound frequency applied. The acoustic field
experienced by the bubble is not stable because of the interference of other bubbles
forming and resonating around it. As a result, some bubbles suffer sudden expansion to
an unstable size and collapse violently. It is the fate of these cavities when they collapse
which generates and delivers the energy for both, chemical and mechanical effects.
In a heterogeneous solid-liquid system the collapse of the cavitation bubbles will
generate physical and chemical reactions which can significantly modify the character
of dissolved and particulate substances present in the medium (Neis and Tiehm, 1999). By
the collapse of the bubbles high shear stresses “jet streams” are produced in the liquid
and these shear forces produced assume such an extent that even solid structures
18th European Biosolids & Organic Resources Conference & Exhibition
www.european-biosolids.com
Organised by Aqua Enviro Technology Transfer
collapse. At implosion of the bubbles, dramatic conditions in the gaseous phase exist
(Suslick, 1988) as shown in figure 2.
Figure 2: Ultrasonic cavitation phenomenon
Extreme temperatures (≈ 5,000 K) and pressures (≈ 500 bar) lead to pronounced
sonochemical reactions which are due to the creation of highly reactive radicals (H+ and
OH-) and thermal breakdown of substances (pyrolysis). The cavitation of bubbles are
vapour filled and surrounded by a liquid hydrophobic boundary layer and therefore
preferably volatile and hydrophobic substances are accumulated in the bubbles where
they are subject to pyrolytic or radical reactions.
Ultrasonic disintegration of the biomass to optimise anaerobic digestion
It has been demonstrated that 20 kHz US waves generate the cavitation necessary to
produce mechanical shear forces associated with sludge and biomass disintegration
(Neis et al., 2000). Combined with high intensity US, cell aggregates as well as single cells
are destroyed and enzymatic and intracellular material is released into the medium
resulting in a higher degree of substrate bio-availability for the remaining living
microorganisms. In effect, the enzymatic biological hydrolysis, which is the initial and rate
limiting of the biological food chain, is substituted and catalysed by this mechanical
disintegration of the sludge (Tiehm et al., 2001).
This fact represents a very big application of the Ultrawaves technology whenever the
AD process is low and requires high retention time inside the digester tank. In particular,
complex substrates (proteins, carbohydrates, fats, etc.) solubilisation and conversion to
18th European Biosolids & Organic Resources Conference & Exhibition
www.european-biosolids.com
Organised by Aqua Enviro Technology Transfer
the lower molecular weight compounds (aminoacids, sugars, fatty acids, etc.) which is
known (as described earlier) as the hydrolysis stage.
By applying US to the bacterial biomass this limiting step is overcome because sonicated
biomass is more readily available for the subsequent biological enzymatic degradation
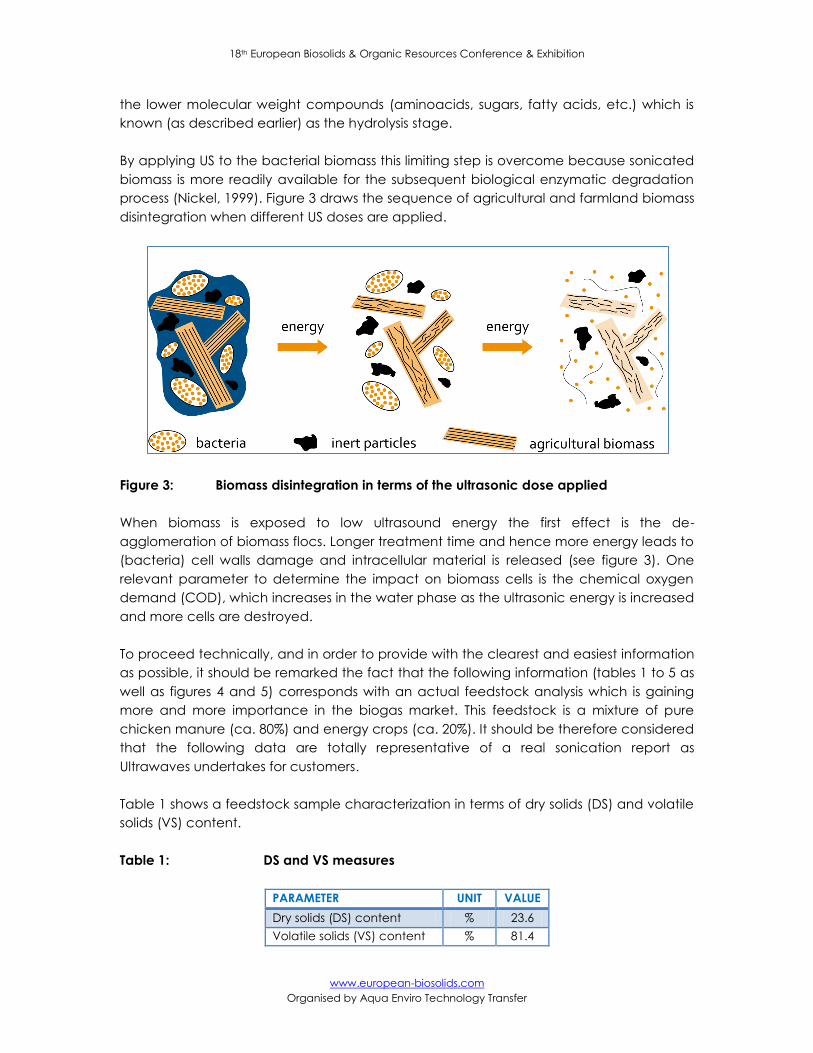
process (Nickel, 1999). Figure 3 draws the sequence of agricultural and farmland biomass
disintegration when different US doses are applied.
Figure 3: Biomass disintegration in terms of the ultrasonic dose applied
When biomass is exposed to low ultrasound energy the first effect is the de-
agglomeration of biomass flocs. Longer treatment time and hence more energy leads to
(bacteria) cell walls damage and intracellular material is released (see figure 3). One
relevant parameter to determine the impact on biomass cells is the chemical oxygen
demand (COD), which increases in the water phase as the ultrasonic energy is increased
and more cells are destroyed.
To proceed technically, and in order to provide with the clearest and easiest information
as possible, it should be remarked the fact that the following information (tables 1 to 5 as
well as figures 4 and 5) corresponds with an actual feedstock analysis which is gaining
more and more importance in the biogas market. This feedstock is a mixture of pure
chicken manure (ca. 80%) and energy crops (ca. 20%). It should be therefore considered
that the following data are totally representative of a real sonication report as
Ultrawaves undertakes for customers.
Table 1 shows a feedstock sample characterization in terms of dry solids (DS) and volatile
solids (VS) content.
Table 1: DS and VS measures
PARAMETER UNIT VALUE
Dry solids (DS) content % 23.6
Volatile solids (VS) content % 81.4
18th European Biosolids & Organic Resources Conference & Exhibition
www.european-biosolids.com
Organised by Aqua Enviro Technology Transfer
Table 2 shows sonication time variations which correspond to an increased energy input
(US dose). Water was previously added to dilute feedstock up to reach ca. 10% in DS.
Table 2: Sonication time and corresponding energy input
PARAMETER UNIT STAGE 1 STAGE 2 STAGE 3
Sonication time Min 1 3 5
Energy input Wh/l 3.0 9.1 14.9
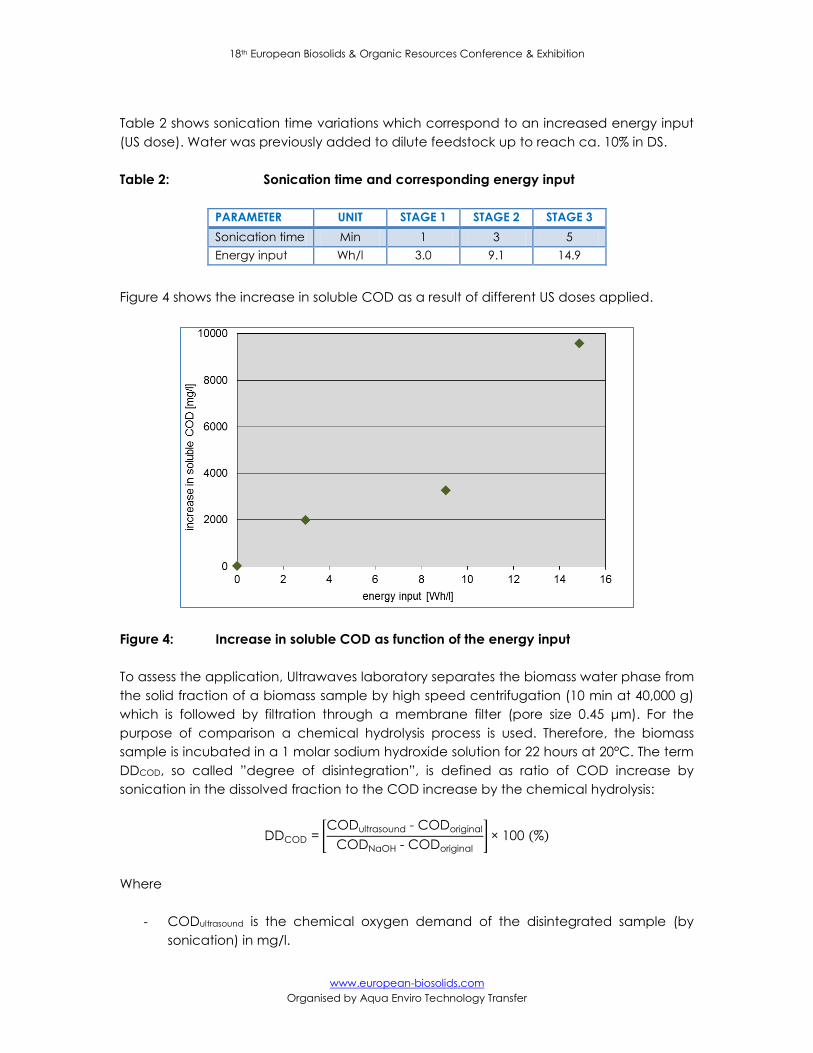
Figure 4 shows the increase in soluble COD as a result of different US doses applied.
Figure 4: Increase in soluble COD as function of the energy input
To assess the application, Ultrawaves laboratory separates the biomass water phase from
the solid fraction of a biomass sample by high speed centrifugation (10 min at 40,000 g)
which is followed by filtration through a membrane filter (pore size 0.45 μm). For the
purpose of comparison a chemical hydrolysis process is used. Therefore, the biomass
sample is incubated in a 1 molar sodium hydroxide solution for 22 hours at 20°C. The term
DDCOD, so called ”degree of disintegration”, is defined as ratio of COD increase by
sonication in the dissolved fraction to the COD increase by the chemical hydrolysis:
DDCOD CODultrasound CODoriginal
COD aO CODoriginal
00
Where
- CODultrasound is the chemical oxygen demand of the disintegrated sample (by
sonication) in mg/l.
18th European Biosolids & Organic Resources Conference & Exhibition
www.european-biosolids.com
Organised by Aqua Enviro Technology Transfer
- CODoriginal is the chemical oxygen demand of the untreated sample in mg/l.
- CODNaOH is the chemical oxygen demand of a reference sample hydrolysed
chemically in a 1 molar NaOH solution at 20°C for 22 hours in mg/l.
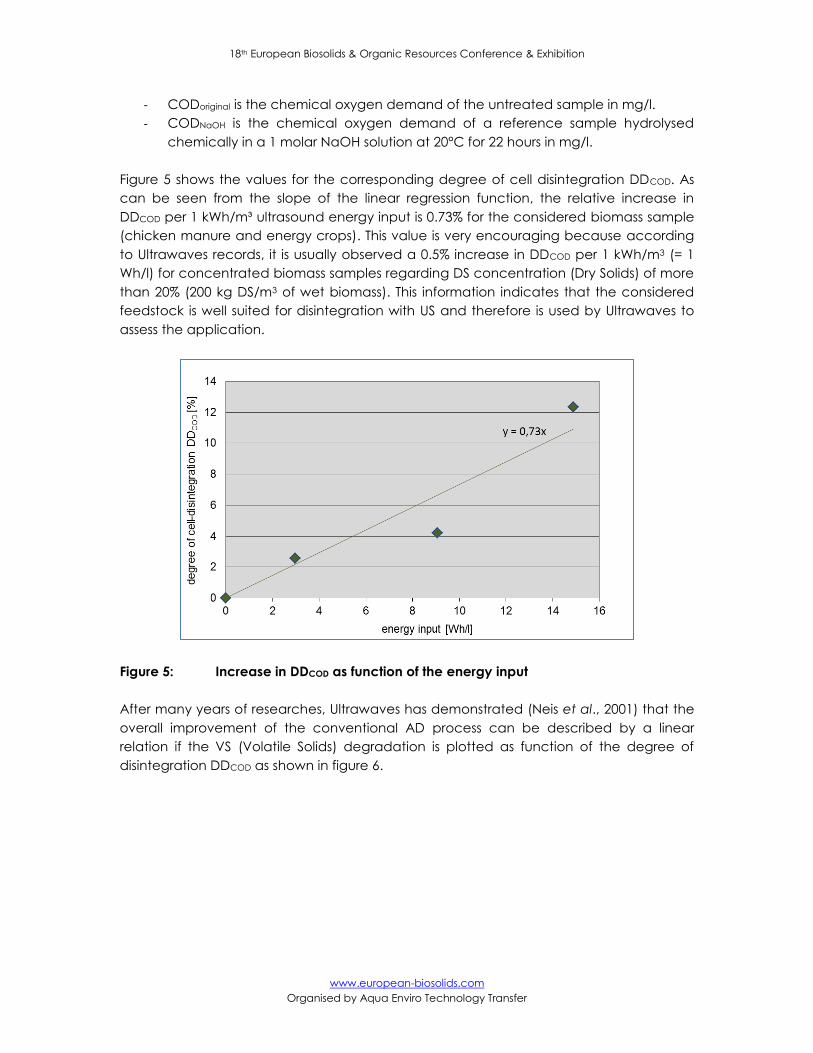
Figure 5 shows the values for the corresponding degree of cell disintegration DDCOD. As
can be seen from the slope of the linear regression function, the relative increase in
DDCOD per 1 kWh/m³ ultrasound energy input is 0.73% for the considered biomass sample
(chicken manure and energy crops). This value is very encouraging because according
to Ultrawaves records, it is usually observed a 0.5% increase in DDCOD per 1 kWh/m3 (= 1
Wh/l) for concentrated biomass samples regarding DS concentration (Dry Solids) of more
than 20% (200 kg DS/m3 of wet biomass). This information indicates that the considered
feedstock is well suited for disintegration with US and therefore is used by Ultrawaves to
assess the application.
Figure 5: Increase in DDCOD as function of the energy input
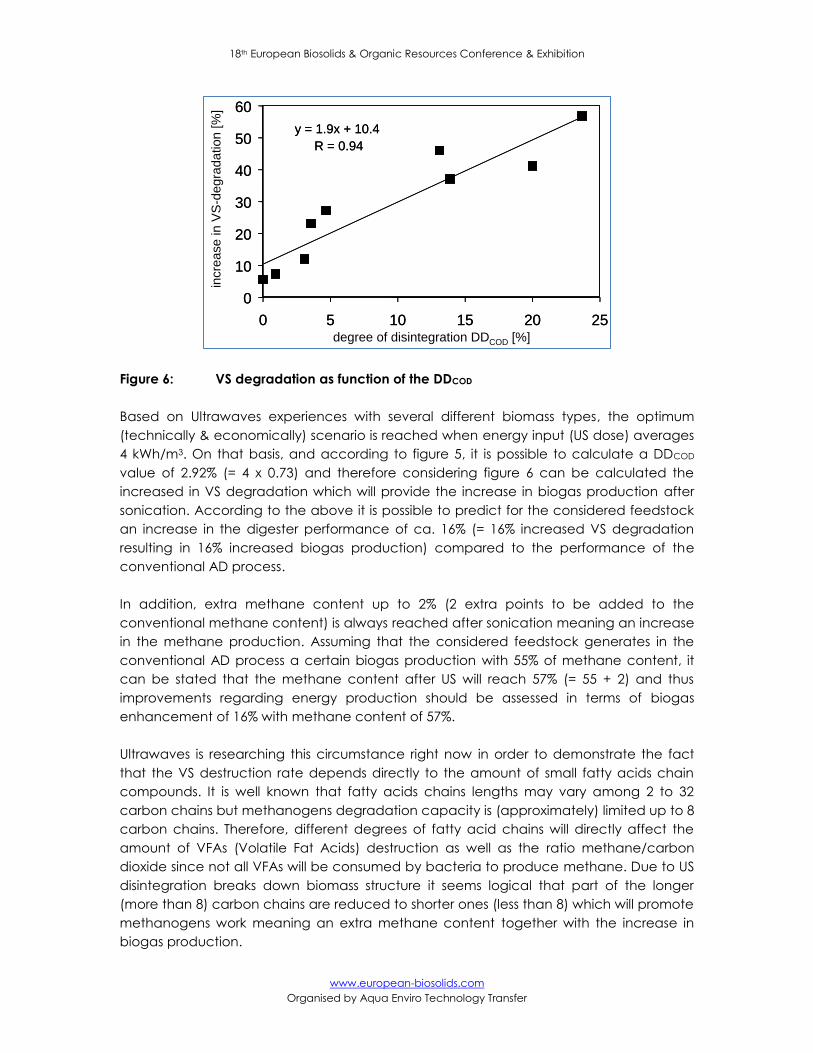
After many years of researches, Ultrawaves has demonstrated (Neis et al., 2001) that the
overall improvement of the conventional AD process can be described by a linear
relation if the VS (Volatile Solids) degradation is plotted as function of the degree of
disintegration DDCOD as shown in figure 6.
18th European Biosolids & Organic Resources Conference & Exhibition
www.european-biosolids.com
Organised by Aqua Enviro Technology Transfer
Figure 6: VS degradation as function of the DDCOD
Based on Ultrawaves experiences with several different biomass types, the optimum
(technically & economically) scenario is reached when energy input (US dose) averages
4 kWh/m3. On that basis, and according to figure 5, it is possible to calculate a DDCOD
value of 2.92% (= 4 x 0.73) and therefore considering figure 6 can be calculated the
increased in VS degradation which will provide the increase in biogas production after
sonication. According to the above it is possible to predict for the considered feedstock
an increase in the digester performance of ca. 16% (= 16% increased VS degradation
resulting in 16% increased biogas production) compared to the performance of the
conventional AD process.
In addition, extra methane content up to 2% (2 extra points to be added to the
conventional methane content) is always reached after sonication meaning an increase
in the methane production. Assuming that the considered feedstock generates in the
conventional AD process a certain biogas production with 55% of methane content, it
can be stated that the methane content after US will reach 57% (= 55 + 2) and thus
improvements regarding energy production should be assessed in terms of biogas
enhancement of 16% with methane content of 57%.
Ultrawaves is researching this circumstance right now in order to demonstrate the fact
that the VS destruction rate depends directly to the amount of small fatty acids chain
compounds. It is well known that fatty acids chains lengths may vary among 2 to 32
carbon chains but methanogens degradation capacity is (approximately) limited up to 8
carbon chains. Therefore, different degrees of fatty acid chains will directly affect the
amount of VFAs (Volatile Fat Acids) destruction as well as the ratio methane/carbon
dioxide since not all VFAs will be consumed by bacteria to produce methane. Due to US
disintegration breaks down biomass structure it seems logical that part of the longer
(more than 8) carbon chains are reduced to shorter ones (less than 8) which will promote
methanogens work meaning an extra methane content together with the increase in
biogas production.
y = 1.9x + 10.4
R = 0.94
0
10
20
30
40
50
60
0 5 10 15 20 25Aufschlußgrad ACSB [%]
Abbauste
igeru
ng
incre
ase
in
VS
-de
gra
da
tio
n [
%]
degree of disintegration DDCOD [%]
y = 1.9x + 10.4
R = 0.94
0
10
20
30
40
50
60
0 5 10 15 20 25Aufschlußgrad ACSB [%]
Abbauste
igeru
ng
incre
ase
in
VS
-de
gra
da
tio
n [
%]
degree of disintegration DDCOD [%]
18th European Biosolids & Organic Resources Conference & Exhibition
www.european-biosolids.com
Organised by Aqua Enviro Technology Transfer
In several full-scale applications worldwide of the Ultrawaves ultrasound technology case
studies have demonstrated and are demonstrating that the predicted improvement (in
biogas and methane) of anaerobic biomass degradation due to sonication of a partial
biomass flow was achieved or exceeded (Houy et al., 2010; Martinson et al., 2010).
Finally, sonicated biomass viscosity will decrease substantially which will reduce the
energy demand for pumping and mixing within the full AD process. According to the
Ultrawaves experience, this effect could be approximately assessed (a deep description
of this variation is not aimed in this paper) into a saving of ca. 25% in the energy used for
these issues.
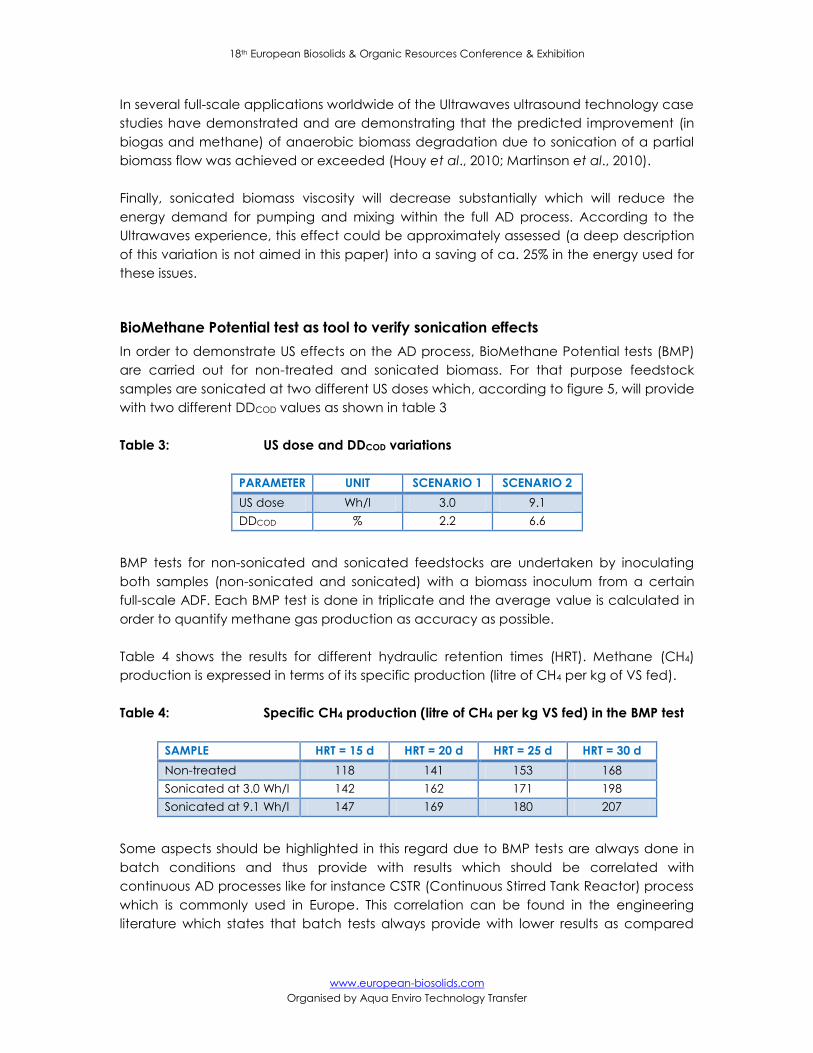
BioMethane Potential test as tool to verify sonication effects
In order to demonstrate US effects on the AD process, BioMethane Potential tests (BMP)
are carried out for non-treated and sonicated biomass. For that purpose feedstock
samples are sonicated at two different US doses which, according to figure 5, will provide
with two different DDCOD values as shown in table 3
Table 3: US dose and DDCOD variations
PARAMETER UNIT SCENARIO 1 SCENARIO 2
US dose Wh/l 3.0 9.1
DDCOD % 2.2 6.6
BMP tests for non-sonicated and sonicated feedstocks are undertaken by inoculating
both samples (non-sonicated and sonicated) with a biomass inoculum from a certain
full-scale ADF. Each BMP test is done in triplicate and the average value is calculated in
order to quantify methane gas production as accuracy as possible.
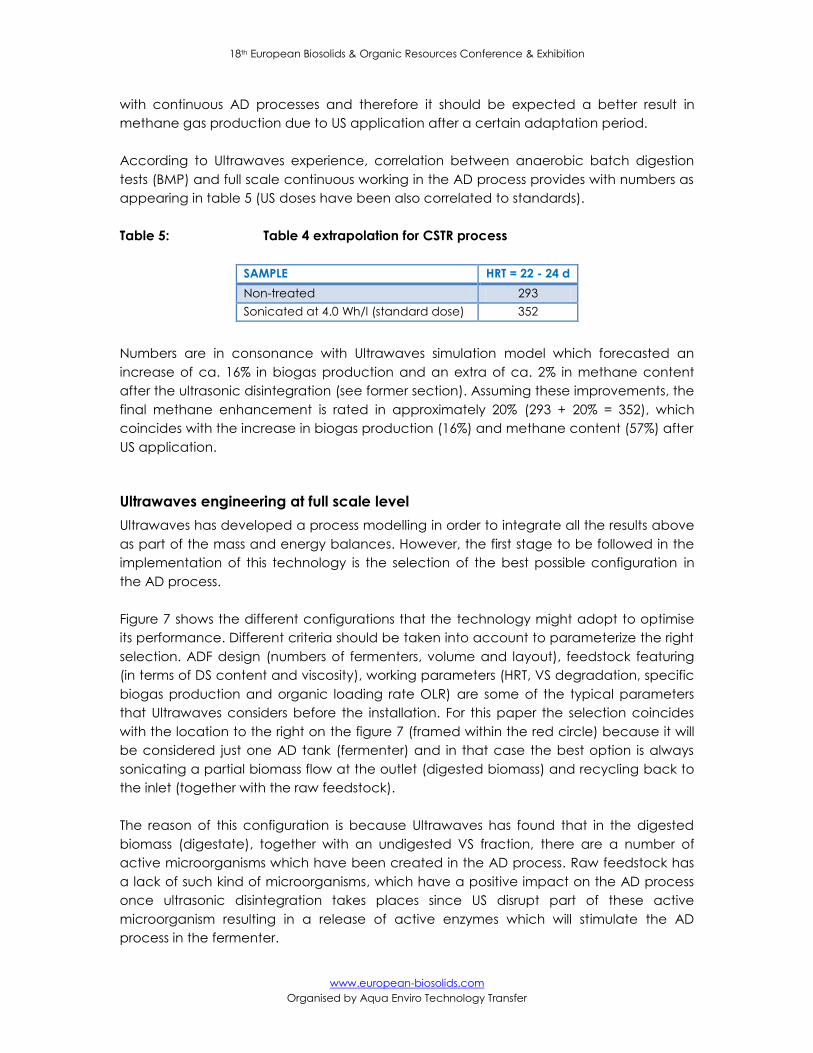
Table 4 shows the results for different hydraulic retention times (HRT). Methane (CH4)
production is expressed in terms of its specific production (litre of CH4 per kg of VS fed).
Table 4: Specific CH4 production (litre of CH4 per kg VS fed) in the BMP test
SAMPLE HRT = 15 d HRT = 20 d HRT = 25 d HRT = 30 d
Non-treated 118 141 153 168
Sonicated at 3.0 Wh/l 142 162 171 198
Sonicated at 9.1 Wh/l 147 169 180 207
Some aspects should be highlighted in this regard due to BMP tests are always done in
batch conditions and thus provide with results which should be correlated with
continuous AD processes like for instance CSTR (Continuous Stirred Tank Reactor) process
which is commonly used in Europe. This correlation can be found in the engineering
literature which states that batch tests always provide with lower results as compared
18th European Biosolids & Organic Resources Conference & Exhibition
www.european-biosolids.com
Organised by Aqua Enviro Technology Transfer
with continuous AD processes and therefore it should be expected a better result in
methane gas production due to US application after a certain adaptation period.
According to Ultrawaves experience, correlation between anaerobic batch digestion
tests (BMP) and full scale continuous working in the AD process provides with numbers as
appearing in table 5 (US doses have been also correlated to standards).
Table 5: Table 4 extrapolation for CSTR process
SAMPLE HRT = 22 - 24 d
Non-treated 293
Sonicated at 4.0 Wh/l (standard dose) 352
Numbers are in consonance with Ultrawaves simulation model which forecasted an
increase of ca. 16% in biogas production and an extra of ca. 2% in methane content
after the ultrasonic disintegration (see former section). Assuming these improvements, the
final methane enhancement is rated in approximately 20% (293 + 20% = 352), which
coincides with the increase in biogas production (16%) and methane content (57%) after
US application.
Ultrawaves engineering at full scale level
Ultrawaves has developed a process modelling in order to integrate all the results above
as part of the mass and energy balances. However, the first stage to be followed in the
implementation of this technology is the selection of the best possible configuration in
the AD process.
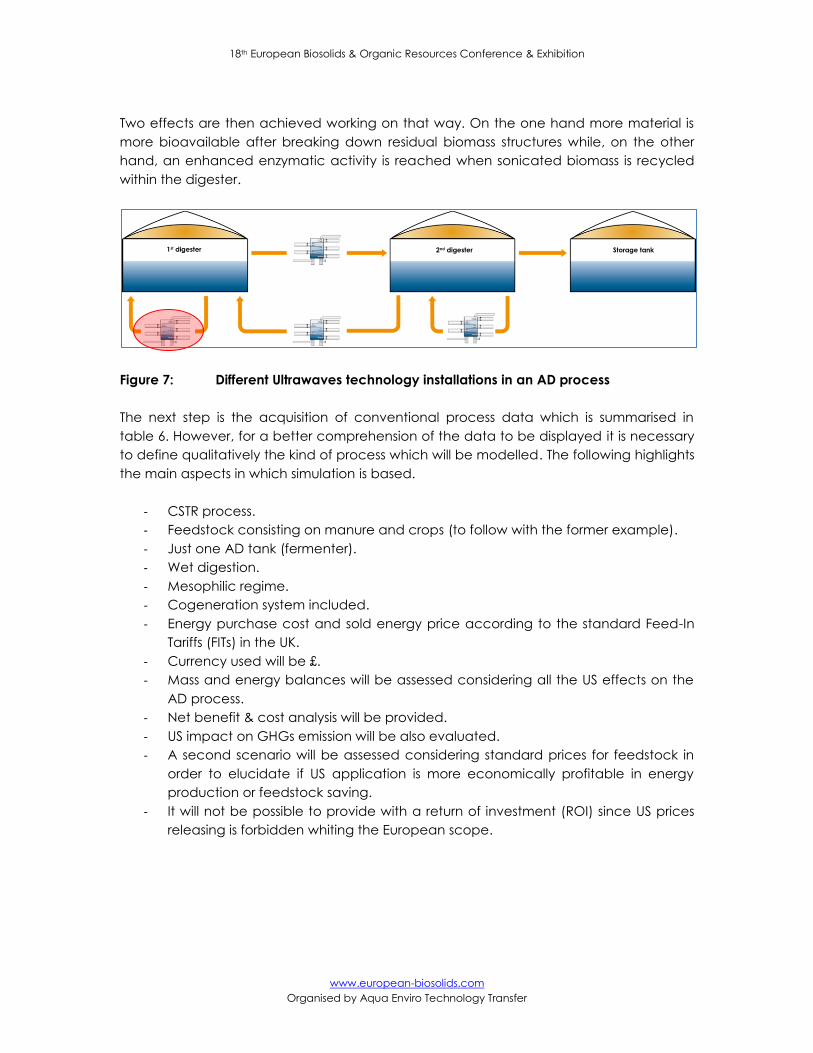
Figure 7 shows the different configurations that the technology might adopt to optimise
its performance. Different criteria should be taken into account to parameterize the right
selection. ADF design (numbers of fermenters, volume and layout), feedstock featuring
(in terms of DS content and viscosity), working parameters (HRT, VS degradation, specific
biogas production and organic loading rate OLR) are some of the typical parameters
that Ultrawaves considers before the installation. For this paper the selection coincides
with the location to the right on the figure 7 (framed within the red circle) because it will
be considered just one AD tank (fermenter) and in that case the best option is always
sonicating a partial biomass flow at the outlet (digested biomass) and recycling back to
the inlet (together with the raw feedstock).
The reason of this configuration is because Ultrawaves has found that in the digested
biomass (digestate), together with an undigested VS fraction, there are a number of
active microorganisms which have been created in the AD process. Raw feedstock has
a lack of such kind of microorganisms, which have a positive impact on the AD process
once ultrasonic disintegration takes places since US disrupt part of these active
microorganism resulting in a release of active enzymes which will stimulate the AD
process in the fermenter.
18th European Biosolids & Organic Resources Conference & Exhibition
www.european-biosolids.com
Organised by Aqua Enviro Technology Transfer
Two effects are then achieved working on that way. On the one hand more material is
more bioavailable after breaking down residual biomass structures while, on the other
hand, an enhanced enzymatic activity is reached when sonicated biomass is recycled
within the digester.
Figure 7: Different Ultrawaves technology installations in an AD process
The next step is the acquisition of conventional process data which is summarised in
table 6. However, for a better comprehension of the data to be displayed it is necessary
to define qualitatively the kind of process which will be modelled. The following highlights
the main aspects in which simulation is based.
- CSTR process.
- Feedstock consisting on manure and crops (to follow with the former example).
- Just one AD tank (fermenter).
- Wet digestion.
- Mesophilic regime.
- Cogeneration system included.
- Energy purchase cost and sold energy price according to the standard Feed-In
Tariffs (FITs) in the UK.
- Currency used will be £.
- Mass and energy balances will be assessed considering all the US effects on the
AD process.
- Net benefit & cost analysis will be provided.
- US impact on GHGs emission will be also evaluated.
- A second scenario will be assessed considering standard prices for feedstock in
order to elucidate if US application is more economically profitable in energy
production or feedstock saving.
- It will not be possible to provide with a return of investment (ROI) since US prices
releasing is forbidden whiting the European scope.
1st digester 2nd digester Storage tank
18th European Biosolids & Organic Resources Conference & Exhibition
www.european-biosolids.com
Organised by Aqua Enviro Technology Transfer
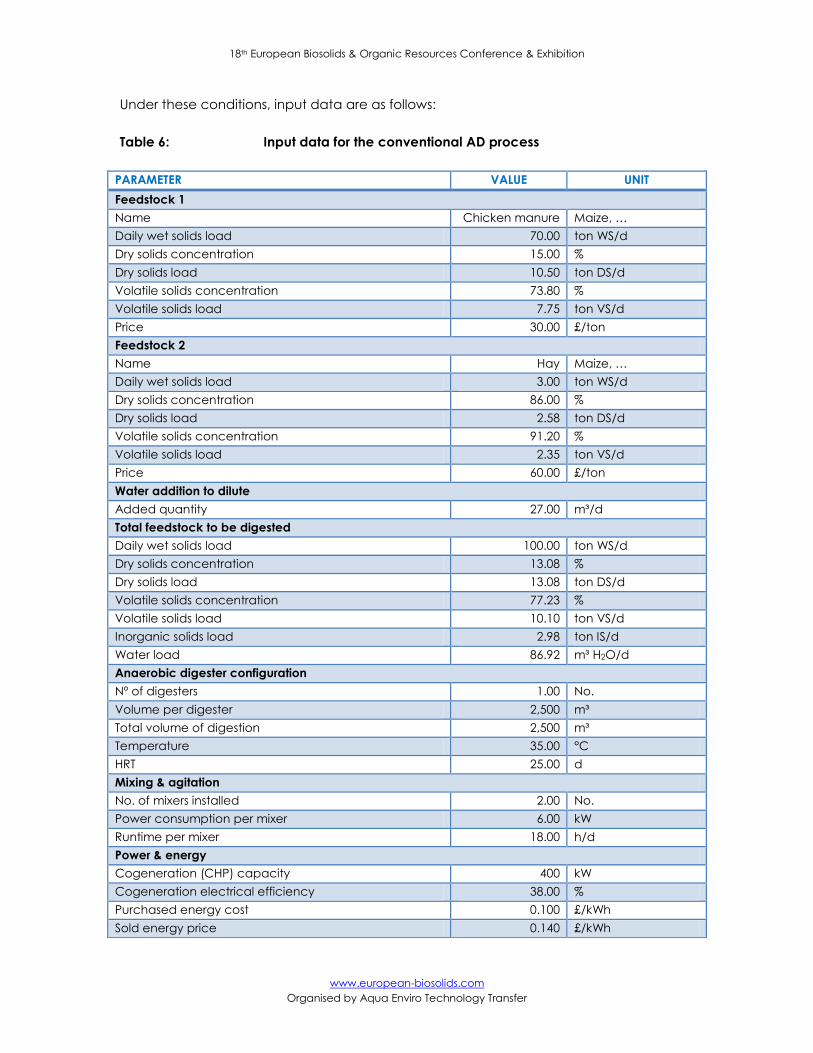
Under these conditions, input data are as follows:
Table 6: Input data for the conventional AD process
PARAMETER VALUE UNIT
Feedstock 1
Name Chicken manure Maize, …
Daily wet solids load 70.00 ton WS/d
Dry solids concentration 15.00 %
Dry solids load 10.50 ton DS/d
Volatile solids concentration 73.80 %
Volatile solids load 7.75 ton VS/d
Price 30.00 £/ton
Feedstock 2
Name Hay Maize, …
Daily wet solids load 3.00 ton WS/d
Dry solids concentration 86.00 %
Dry solids load 2.58 ton DS/d
Volatile solids concentration 91.20 %
Volatile solids load 2.35 ton VS/d
Price 60.00 £/ton
Water addition to dilute
Added quantity 27.00 m³/d
Total feedstock to be digested
Daily wet solids load 100.00 ton WS/d
Dry solids concentration 13.08 %
Dry solids load 13.08 ton DS/d
Volatile solids concentration 77.23 %
Volatile solids load 10.10 ton VS/d
Inorganic solids load 2.98 ton IS/d
Water load 86.92 m³ H2O/d
Anaerobic digester configuration
Nº of digesters 1.00 No.
Volume per digester 2,500 m³
Total volume of digestion 2,500 m³
Temperature 35.00 °C
HRT 25.00 d
Mixing & agitation
No. of mixers installed 2.00 No.
Power consumption per mixer 6.00 kW
Runtime per mixer 18.00 h/d
Power & energy
Cogeneration (CHP) capacity 400 kW
Cogeneration electrical efficiency 38.00 %
Purchased energy cost 0.100 £/kWh
Sold energy price 0.140 £/kWh
18th European Biosolids & Organic Resources Conference & Exhibition
www.european-biosolids.com
Organised by Aqua Enviro Technology Transfer
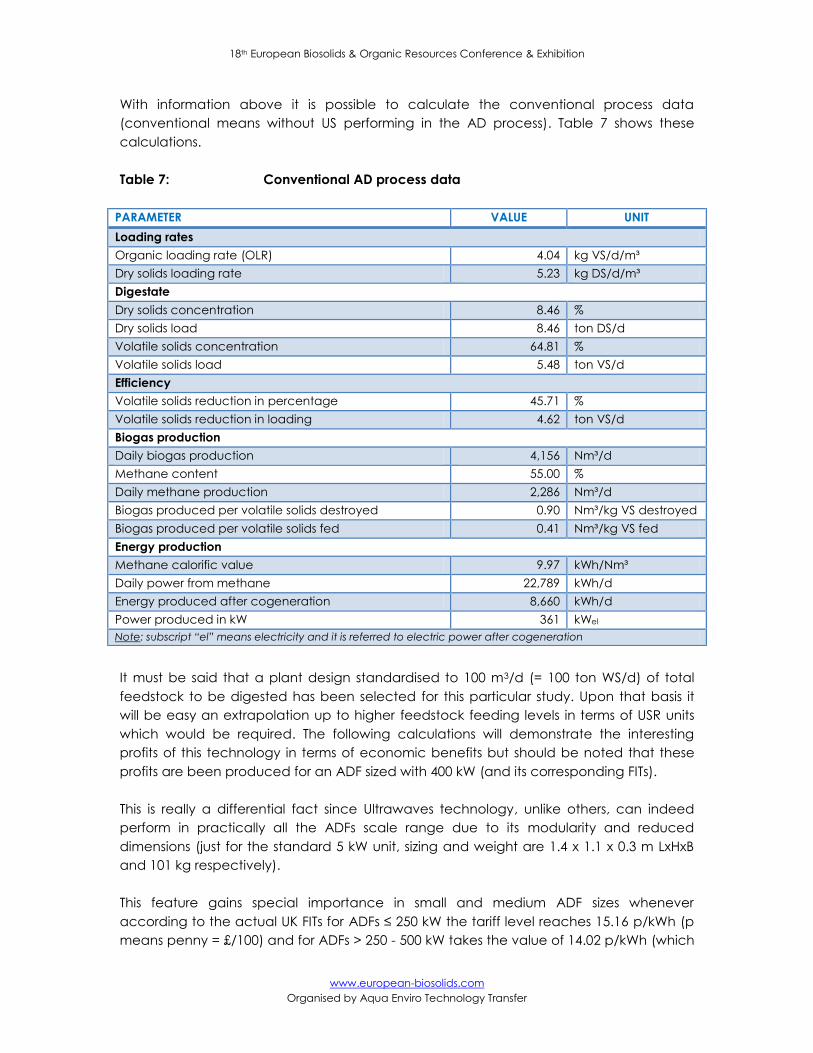
With information above it is possible to calculate the conventional process data
(conventional means without US performing in the AD process). Table 7 shows these
calculations.
Table 7: Conventional AD process data
It must be said that a plant design standardised to 100 m3/d (= 100 ton WS/d) of total
feedstock to be digested has been selected for this particular study. Upon that basis it
will be easy an extrapolation up to higher feedstock feeding levels in terms of USR units
which would be required. The following calculations will demonstrate the interesting
profits of this technology in terms of economic benefits but should be noted that these
profits are been produced for an ADF sized with 400 kW (and its corresponding FITs).
This is really a differential fact since Ultrawaves technology, unlike others, can indeed
perform in practically all the ADFs scale range due to its modularity and reduced
dimensions (just for the standard 5 kW unit, sizing and weight are 1.4 x 1.1 x 0.3 m LxHxB
and 101 kg respectively).
This feature gains special importance in small and medium ADF sizes whenever
according to the actual UK FITs for ADFs ≤ 250 kW the tariff level reaches 5. 6 p/kWh (p
means penny = £/100) and for ADFs > 250 - 500 kW takes the value of 14.02 p/kWh (which
PARAMETER VALUE UNIT
Loading rates
Organic loading rate (OLR) 4.04 kg VS/d/m³
Dry solids loading rate 5.23 kg DS/d/m³
Digestate
Dry solids concentration 8.46 %
Dry solids load 8.46 ton DS/d
Volatile solids concentration 64.81 %
Volatile solids load 5.48 ton VS/d
Efficiency
Volatile solids reduction in percentage 45.71 %
Volatile solids reduction in loading 4.62 ton VS/d
Biogas production
Daily biogas production 4,156 Nm³/d
Methane content 55.00 %
Daily methane production 2,286 Nm³/d
Biogas produced per volatile solids destroyed 0.90 Nm³/kg VS destroyed
Biogas produced per volatile solids fed 0.41 Nm³/kg VS fed
Energy production
Methane calorific value 9.97 kWh/Nm³
Daily power from methane 22,789 kWh/d
Energy produced after cogeneration 8,660 kWh/d
Power produced in kW 361 kWel
Note: subscript “el” means electricity and it is referred to electric power after cogeneration
18th European Biosolids & Organic Resources Conference & Exhibition
www.european-biosolids.com
Organised by Aqua Enviro Technology Transfer
has been used in this paper). From here it follows that performing in such ADF ranges (if a
technology is able to work in that level!!) would be very profitable for such ADF owners
because according to smaller installation a better tariff remuneration will be awarded.
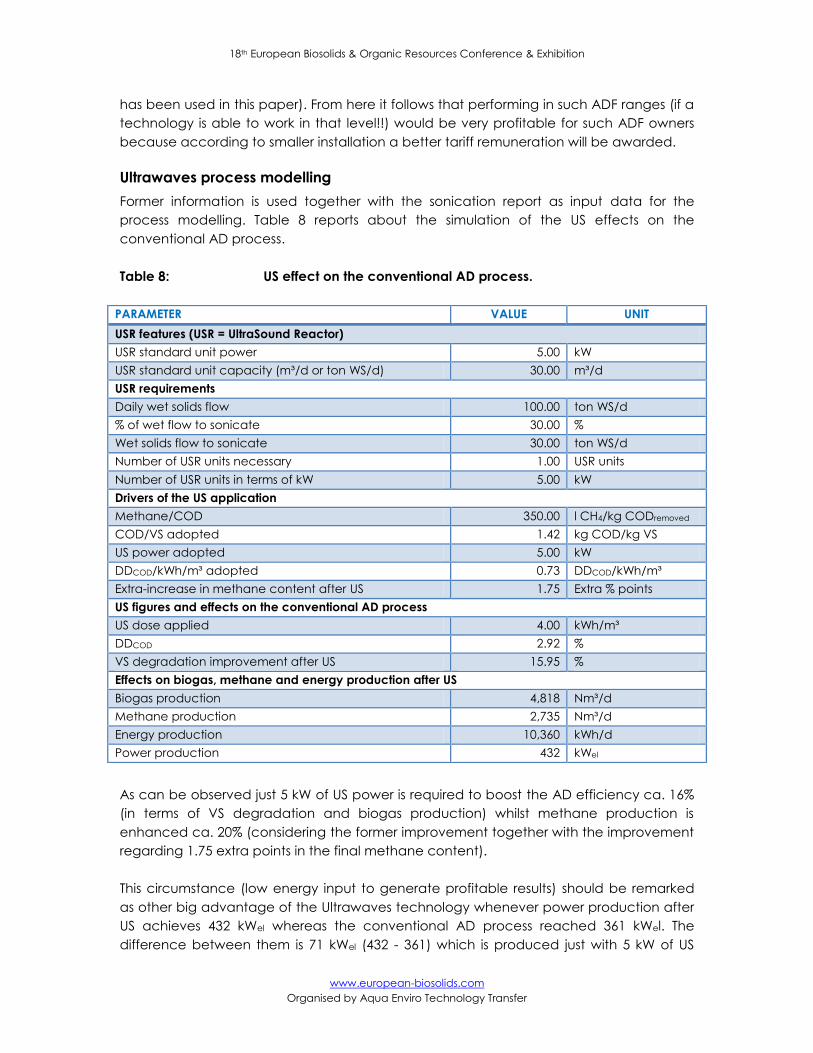
Ultrawaves process modelling
Former information is used together with the sonication report as input data for the
process modelling. Table 8 reports about the simulation of the US effects on the
conventional AD process.
Table 8: US effect on the conventional AD process.
As can be observed just 5 kW of US power is required to boost the AD efficiency ca. 16%
(in terms of VS degradation and biogas production) whilst methane production is
enhanced ca. 20% (considering the former improvement together with the improvement
regarding 1.75 extra points in the final methane content).
This circumstance (low energy input to generate profitable results) should be remarked
as other big advantage of the Ultrawaves technology whenever power production after
US achieves 432 kWel whereas the conventional AD process reached 361 kWel. The
difference between them is 71 kWel (432 - 361) which is produced just with 5 kW of US
PARAMETER VALUE UNIT
USR features (USR = UltraSound Reactor)
USR standard unit power 5.00 kW
USR standard unit capacity (m³/d or ton WS/d) 30.00 m³/d
USR requirements
Daily wet solids flow 100.00 ton WS/d
% of wet flow to sonicate 30.00 %
Wet solids flow to sonicate 30.00 ton WS/d
Number of USR units necessary 1.00 USR units
Number of USR units in terms of kW 5.00 kW
Drivers of the US application
Methane/COD 350.00 l CH4/kg CODremoved
COD/VS adopted 1.42 kg COD/kg VS
US power adopted 5.00 kW
DDCOD/kWh/m³ adopted 0.73 DDCOD/kWh/m³
Extra-increase in methane content after US 1.75 Extra % points
US figures and effects on the conventional AD process
US dose applied 4.00 kWh/m³
DDCOD 2.92 %
VS degradation improvement after US 15.95 %
Effects on biogas, methane and energy production after US
Biogas production 4,818 Nm³/d
Methane production 2,735 Nm³/d
Energy production 10,360 kWh/d
Power production 432 kWel
18th European Biosolids & Organic Resources Conference & Exhibition
www.european-biosolids.com
Organised by Aqua Enviro Technology Transfer
power. Thereby, the net power production will be 66 kWel (71 - 5) which is indeed a very
positive balance (see more information in table 11).
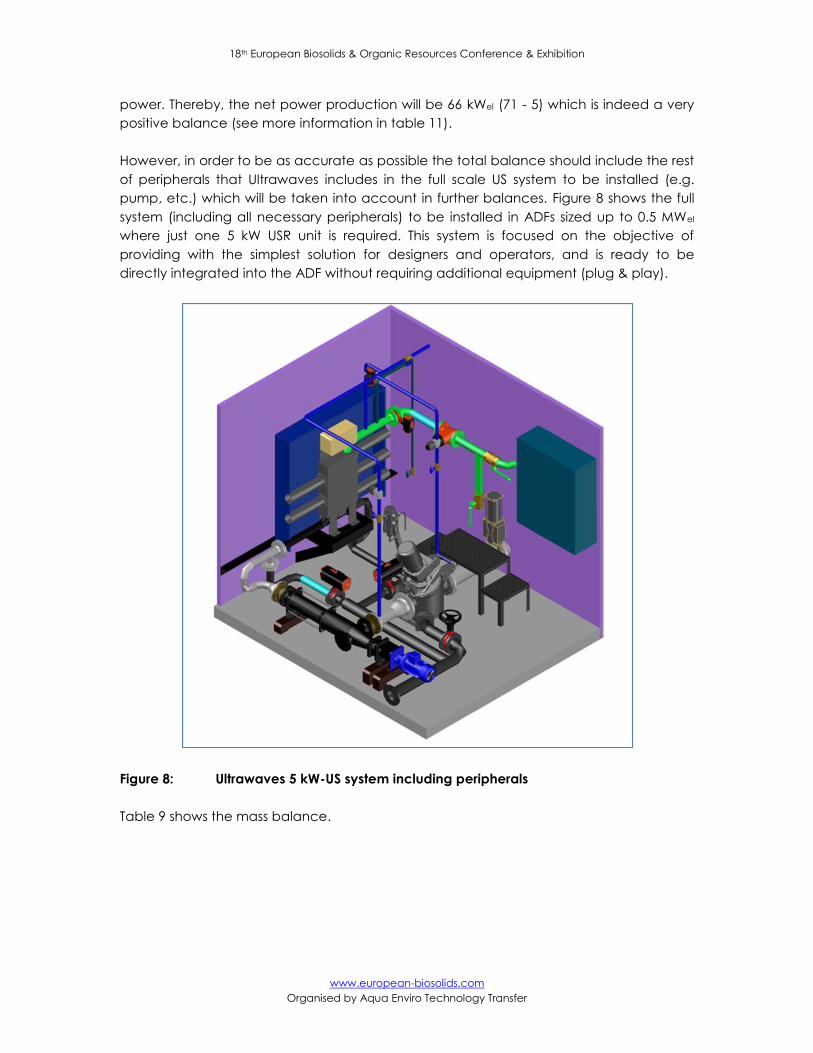
However, in order to be as accurate as possible the total balance should include the rest
of peripherals that Ultrawaves includes in the full scale US system to be installed (e.g.
pump, etc.) which will be taken into account in further balances. Figure 8 shows the full
system (including all necessary peripherals) to be installed in ADFs sized up to 0.5 MWel
where just one 5 kW USR unit is required. This system is focused on the objective of
providing with the simplest solution for designers and operators, and is ready to be
directly integrated into the ADF without requiring additional equipment (plug & play).
Figure 8: Ultrawaves 5 kW-US system including peripherals
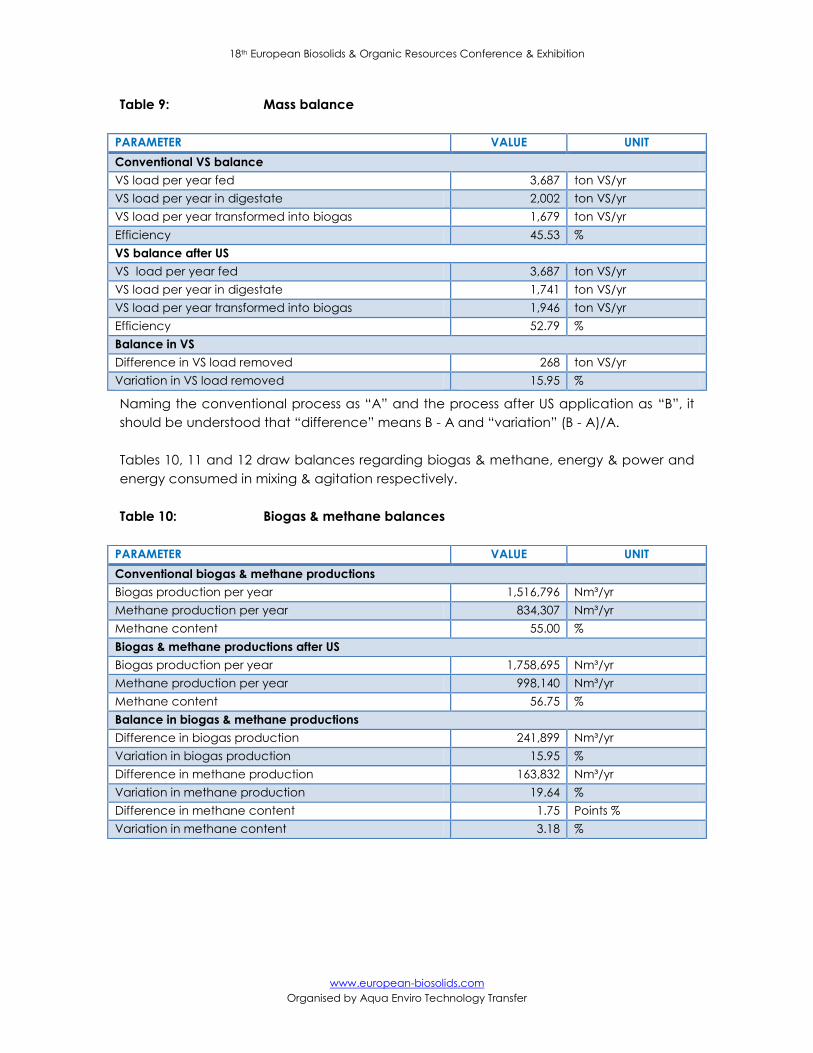
Table 9 shows the mass balance.
18th European Biosolids & Organic Resources Conference & Exhibition
www.european-biosolids.com
Organised by Aqua Enviro Technology Transfer
Table 9: Mass balance
aming the conventional process as “A” and the process after US application as “B”, it
should be understood that “difference” means B - A and “variation” (B - A)/A.
Tables 10, 11 and 12 draw balances regarding biogas & methane, energy & power and
energy consumed in mixing & agitation respectively.
Table 10: Biogas & methane balances
PARAMETER VALUE UNIT
Conventional VS balance
VS load per year fed 3,687 ton VS/yr
VS load per year in digestate 2,002 ton VS/yr
VS load per year transformed into biogas 1,679 ton VS/yr
Efficiency 45.53 %
VS balance after US
VS load per year fed 3,687 ton VS/yr
VS load per year in digestate 1,741 ton VS/yr
VS load per year transformed into biogas 1,946 ton VS/yr
Efficiency 52.79 %
Balance in VS
Difference in VS load removed 268 ton VS/yr
Variation in VS load removed 15.95 %
PARAMETER VALUE UNIT
Conventional biogas & methane productions
Biogas production per year 1,516,796 Nm³/yr
Methane production per year 834,307 Nm³/yr
Methane content 55.00 %
Biogas & methane productions after US
Biogas production per year 1,758,695 Nm³/yr
Methane production per year 998,140 Nm³/yr
Methane content 56.75 %
Balance in biogas & methane productions
Difference in biogas production 241,899 Nm³/yr
Variation in biogas production 15.95 %
Difference in methane production 163,832 Nm³/yr
Variation in methane production 19.64 %
Difference in methane content 1.75 Points %
Variation in methane content 3.18 %
18th European Biosolids & Organic Resources Conference & Exhibition
www.european-biosolids.com
Organised by Aqua Enviro Technology Transfer
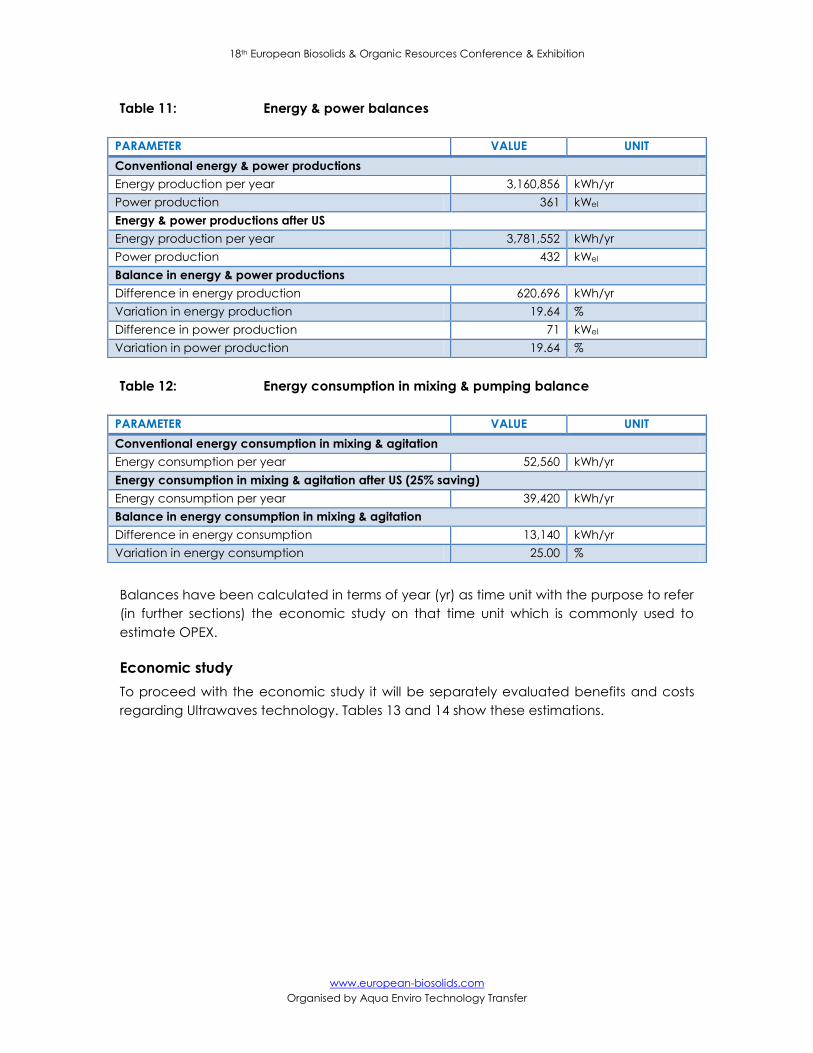
Table 11: Energy & power balances
Table 12: Energy consumption in mixing & pumping balance
Balances have been calculated in terms of year (yr) as time unit with the purpose to refer
(in further sections) the economic study on that time unit which is commonly used to
estimate OPEX.
Economic study
To proceed with the economic study it will be separately evaluated benefits and costs
regarding Ultrawaves technology. Tables 13 and 14 show these estimations.
PARAMETER VALUE UNIT
Conventional energy & power productions
Energy production per year 3,160,856 kWh/yr
Power production 361 kWel
Energy & power productions after US
Energy production per year 3,781,552 kWh/yr
Power production 432 kWel
Balance in energy & power productions
Difference in energy production 620,696 kWh/yr
Variation in energy production 19.64 %
Difference in power production 71 kWel
Variation in power production 19.64 %
PARAMETER VALUE UNIT
Conventional energy consumption in mixing & agitation
Energy consumption per year 52,560 kWh/yr
Energy consumption in mixing & agitation after US (25% saving)
Energy consumption per year 39,420 kWh/yr
Balance in energy consumption in mixing & agitation
Difference in energy consumption 13,140 kWh/yr
Variation in energy consumption 25.00 %
18th European Biosolids & Organic Resources Conference & Exhibition
www.european-biosolids.com
Organised by Aqua Enviro Technology Transfer
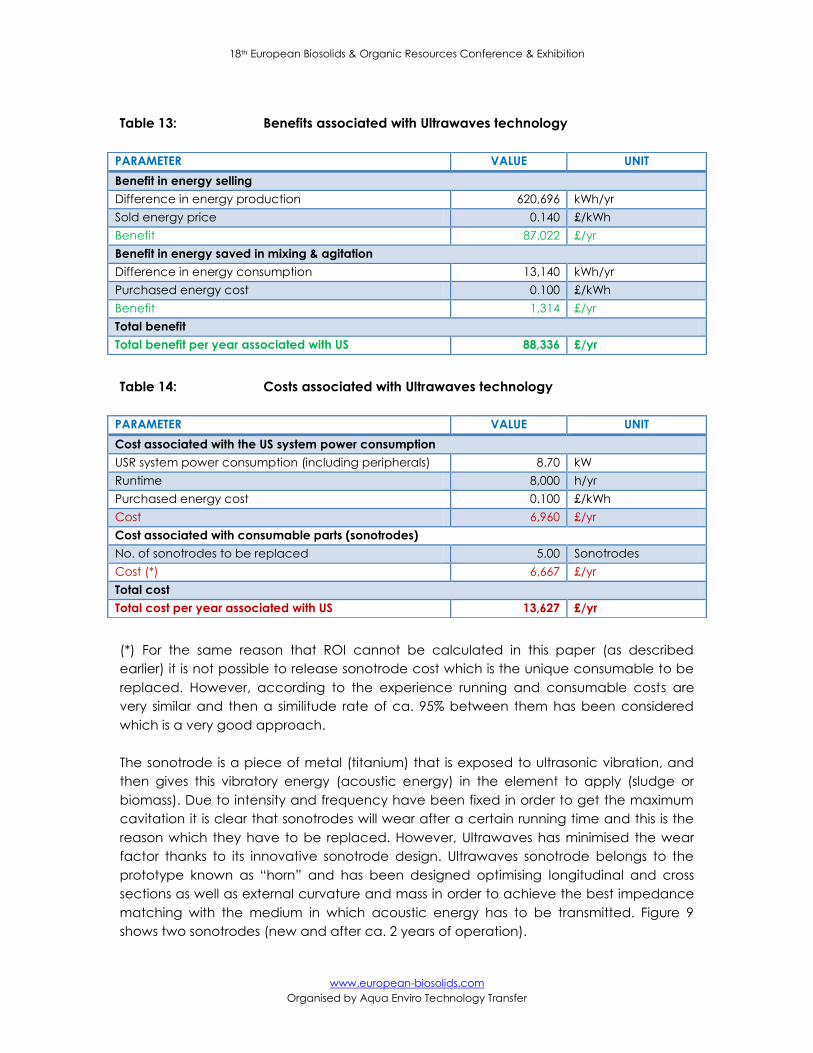
Table 13: Benefits associated with Ultrawaves technology
Table 14: Costs associated with Ultrawaves technology
(*) For the same reason that ROI cannot be calculated in this paper (as described
earlier) it is not possible to release sonotrode cost which is the unique consumable to be
replaced. However, according to the experience running and consumable costs are
very similar and then a similitude rate of ca. 95% between them has been considered
which is a very good approach.
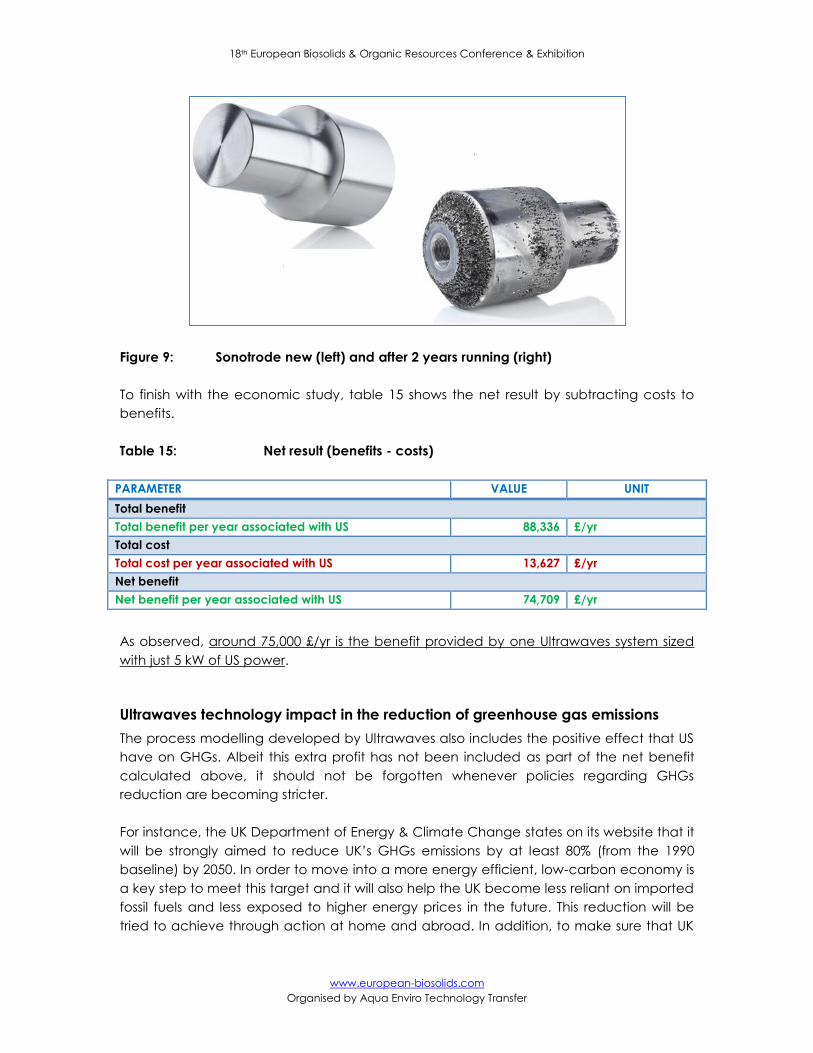
The sonotrode is a piece of metal (titanium) that is exposed to ultrasonic vibration, and
then gives this vibratory energy (acoustic energy) in the element to apply (sludge or
biomass). Due to intensity and frequency have been fixed in order to get the maximum
cavitation it is clear that sonotrodes will wear after a certain running time and this is the
reason which they have to be replaced. However, Ultrawaves has minimised the wear
factor thanks to its innovative sonotrode design. Ultrawaves sonotrode belongs to the
prototype known as “horn” and has been designed optimising longitudinal and cross
sections as well as external curvature and mass in order to achieve the best impedance
matching with the medium in which acoustic energy has to be transmitted. Figure 9
shows two sonotrodes (new and after ca. 2 years of operation).
PARAMETER VALUE UNIT
Benefit in energy selling
Difference in energy production 620,696 kWh/yr
Sold energy price 0.140 £/kWh
Benefit 87,022 £/yr
Benefit in energy saved in mixing & agitation
Difference in energy consumption 13,140 kWh/yr
Purchased energy cost 0.100 £/kWh
Benefit 1,314 £/yr
Total benefit
Total benefit per year associated with US 88,336 £/yr
PARAMETER VALUE UNIT
Cost associated with the US system power consumption
USR system power consumption (including peripherals) 8.70 kW
Runtime 8,000 h/yr
Purchased energy cost 0.100 £/kWh
Cost 6,960 £/yr
Cost associated with consumable parts (sonotrodes)
No. of sonotrodes to be replaced 5.00 Sonotrodes
Cost (*) 6,667 £/yr
Total cost
Total cost per year associated with US 13,627 £/yr
18th European Biosolids & Organic Resources Conference & Exhibition
www.european-biosolids.com
Organised by Aqua Enviro Technology Transfer
Figure 9: Sonotrode new (left) and after 2 years running (right)
To finish with the economic study, table 15 shows the net result by subtracting costs to
benefits.
Table 15: Net result (benefits - costs)
As observed, around 75,000 £/yr is the benefit provided by one Ultrawaves system sized
with just 5 kW of US power.
Ultrawaves technology impact in the reduction of greenhouse gas emissions
The process modelling developed by Ultrawaves also includes the positive effect that US
have on GHGs. Albeit this extra profit has not been included as part of the net benefit
calculated above, it should not be forgotten whenever policies regarding GHGs
reduction are becoming stricter.
For instance, the UK Department of Energy & Climate Change states on its website that it
will be strongly aimed to reduce UK’s G Gs emissions by at least 80% (from the 1990
baseline) by 2050. In order to move into a more energy efficient, low-carbon economy is
a key step to meet this target and it will also help the UK become less reliant on imported
fossil fuels and less exposed to higher energy prices in the future. This reduction will be
tried to achieve through action at home and abroad. In addition, to make sure that UK
PARAMETER VALUE UNIT
Total benefit
Total benefit per year associated with US 88,336 £/yr
Total cost
Total cost per year associated with US 13,627 £/yr
Net benefit
Net benefit per year associated with US 74,709 £/yr
18th European Biosolids & Organic Resources Conference & Exhibition
www.european-biosolids.com
Organised by Aqua Enviro Technology Transfer
government policies contribute effectively to GHGs reduction some actions like listed
below will be undertaken.
- Setting carbon budgets to limit the amount of GHGs allowed to emit.
- Investing in low-carbon technologies.
- Reforming the UK’s electricity market.
- Providing over £200 million of funding for innovation in low-carbon technologies
from 2011 to 2015.
Referred actions will have a very positive effect on Ultrawaves technology evolution in
the renewables market. In this context, Ultrawaves technology impact and subsequent
benefit regarding GHGs reduction will gain a great importance. Table 16 summarises
such benefit.
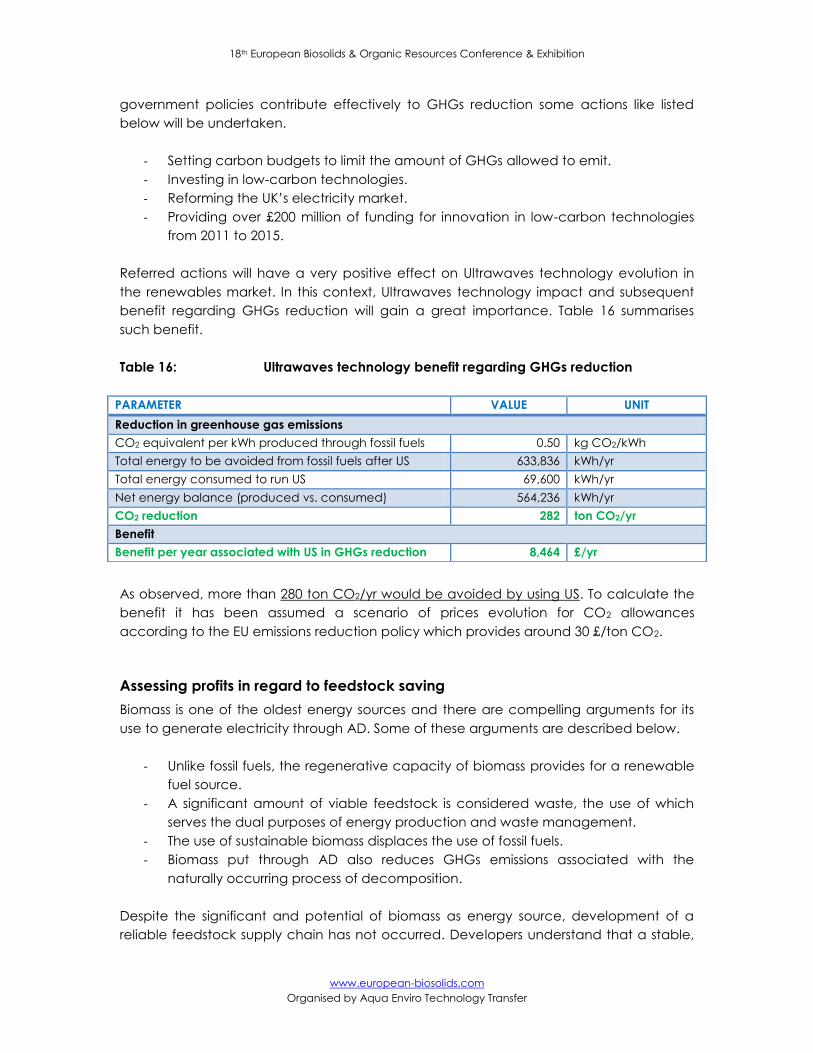
Table 16: Ultrawaves technology benefit regarding GHGs reduction
As observed, more than 280 ton CO2/yr would be avoided by using US. To calculate the
benefit it has been assumed a scenario of prices evolution for CO2 allowances
according to the EU emissions reduction policy which provides around 30 £/ton CO2.
Assessing profits in regard to feedstock saving
Biomass is one of the oldest energy sources and there are compelling arguments for its
use to generate electricity through AD. Some of these arguments are described below.
- Unlike fossil fuels, the regenerative capacity of biomass provides for a renewable
fuel source.
- A significant amount of viable feedstock is considered waste, the use of which
serves the dual purposes of energy production and waste management.
- The use of sustainable biomass displaces the use of fossil fuels.
- Biomass put through AD also reduces GHGs emissions associated with the
naturally occurring process of decomposition.
Despite the significant and potential of biomass as energy source, development of a
reliable feedstock supply chain has not occurred. Developers understand that a stable,
PARAMETER VALUE UNIT
Reduction in greenhouse gas emissions
CO2 equivalent per kWh produced through fossil fuels 0.50 kg CO2/kWh
Total energy to be avoided from fossil fuels after US 633,836 kWh/yr
Total energy consumed to run US 69,600 kWh/yr
Net energy balance (produced vs. consumed) 564,236 kWh/yr
CO2 reduction 282 ton CO2/yr
Benefit
Benefit per year associated with US in GHGs reduction 8,464 £/yr
18th European Biosolids & Organic Resources Conference & Exhibition
www.european-biosolids.com
Organised by Aqua Enviro Technology Transfer
long-term feedstock agreement is essential to procuring financing for any biomass
project. At the same time, storage and transportation costs should be considered before
financing a project. All these circumstances provoke that feedstock prices can widely
vary which will affect the benefits. Ultrawaves has researched into the cost saving
processes and incorporated in its simulation the possibility of analysing US benefit not in
terms of more biogas & methane production but less feedstock to be fed whilst the
conventional biogas production is maintained.
Depending on feedstock availability and price there will be occasions in which it is more
profitable to achieve savings in feedstock to be fed as compared with more biogas and
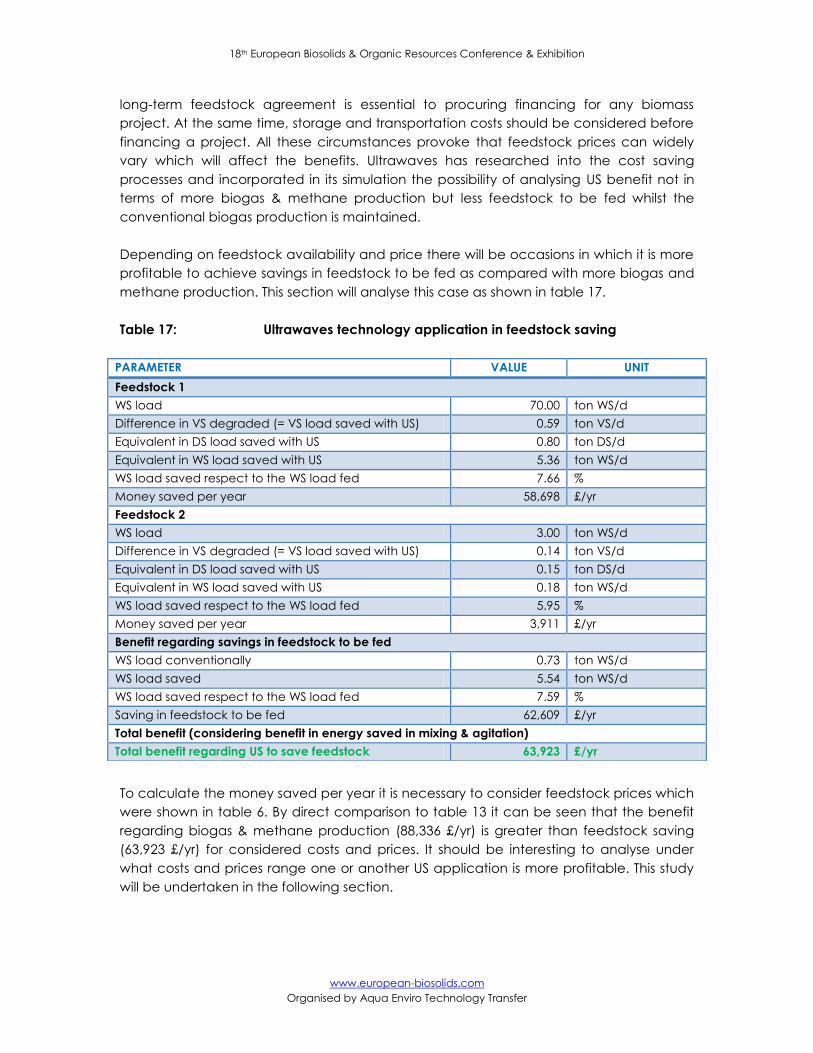
methane production. This section will analyse this case as shown in table 17.
Table 17: Ultrawaves technology application in feedstock saving
To calculate the money saved per year it is necessary to consider feedstock prices which
were shown in table 6. By direct comparison to table 13 it can be seen that the benefit
regarding biogas & methane production (88,336 £/yr) is greater than feedstock saving
(63,923 £/yr) for considered costs and prices. It should be interesting to analyse under
what costs and prices range one or another US application is more profitable. This study
will be undertaken in the following section.
PARAMETER VALUE UNIT
Feedstock 1
WS load 70.00 ton WS/d
Difference in VS degraded (= VS load saved with US) 0.59 ton VS/d
Equivalent in DS load saved with US 0.80 ton DS/d
Equivalent in WS load saved with US 5.36 ton WS/d
WS load saved respect to the WS load fed 7.66 %
Money saved per year 58,698 £/yr
Feedstock 2
WS load 3.00 ton WS/d
Difference in VS degraded (= VS load saved with US) 0.14 ton VS/d
Equivalent in DS load saved with US 0.15 ton DS/d
Equivalent in WS load saved with US 0.18 ton WS/d
WS load saved respect to the WS load fed 5.95 %
Money saved per year 3,911 £/yr
Benefit regarding savings in feedstock to be fed
WS load conventionally 0.73 ton WS/d
WS load saved 5.54 ton WS/d
WS load saved respect to the WS load fed 7.59 %
Saving in feedstock to be fed 62,609 £/yr
Total benefit (considering benefit in energy saved in mixing & agitation)
Total benefit regarding US to save feedstock 63,923 £/yr
18th European Biosolids & Organic Resources Conference & Exhibition
www.european-biosolids.com
Organised by Aqua Enviro Technology Transfer
Sensitive analysis
This analysis will be developed to support the technical decision of one or another
Ultrawaves technology application (meaning biogas & methane production or
feedstock saving). Due to the feedstock to be digested is a mixture between chicken
manure and hay, it has been considered a number of scenarios where their costs have
been proportionally increased with respect to the costs shown in table 6 (considered as
the basis). A range of benefits will be calculated according to each scenario
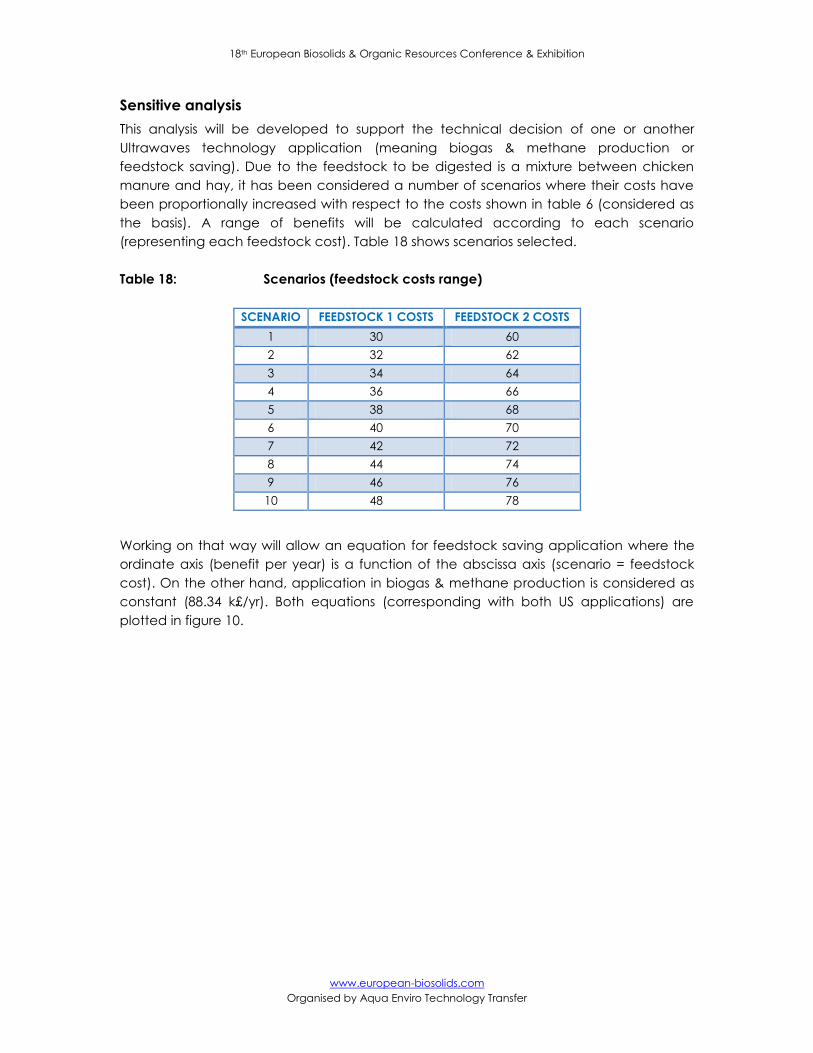
(representing each feedstock cost). Table 18 shows scenarios selected.
Table 18: Scenarios (feedstock costs range)
Working on that way will allow an equation for feedstock saving application where the
ordinate axis (benefit per year) is a function of the abscissa axis (scenario = feedstock
cost). On the other hand, application in biogas & methane production is considered as
constant (88.34 k£/yr). Both equations (corresponding with both US applications) are
plotted in figure 10.
SCENARIO FEEDSTOCK 1 COSTS FEEDSTOCK 2 COSTS
1 30 60
2 32 62
3 34 64
4 36 66
5 38 68
6 40 70
7 42 72
8 44 74
9 46 76
10 48 78
18th European Biosolids & Organic Resources Conference & Exhibition
www.european-biosolids.com
Organised by Aqua Enviro Technology Transfer
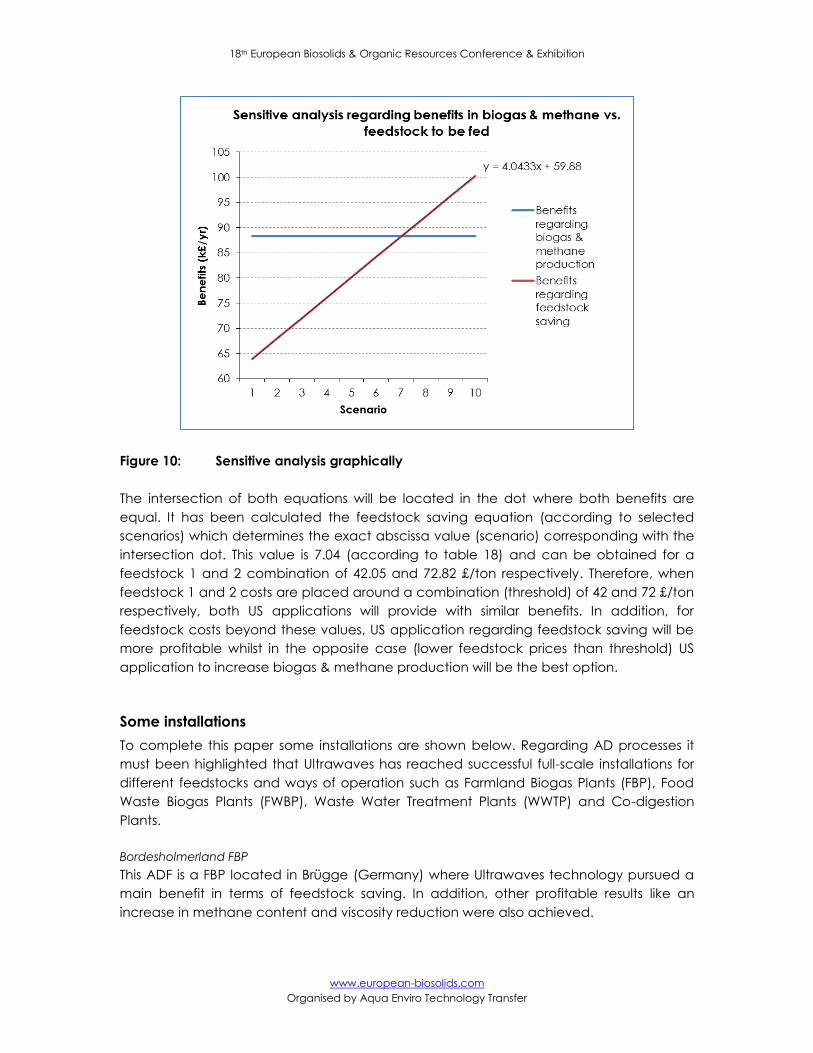
Figure 10: Sensitive analysis graphically
The intersection of both equations will be located in the dot where both benefits are
equal. It has been calculated the feedstock saving equation (according to selected
scenarios) which determines the exact abscissa value (scenario) corresponding with the
intersection dot. This value is 7.04 (according to table 18) and can be obtained for a
feedstock 1 and 2 combination of 42.05 and 72.82 £/ton respectively. Therefore, when
feedstock 1 and 2 costs are placed around a combination (threshold) of 42 and 72 £/ton
respectively, both US applications will provide with similar benefits. In addition, for
feedstock costs beyond these values, US application regarding feedstock saving will be
more profitable whilst in the opposite case (lower feedstock prices than threshold) US
application to increase biogas & methane production will be the best option.
Some installations
To complete this paper some installations are shown below. Regarding AD processes it
must been highlighted that Ultrawaves has reached successful full-scale installations for
different feedstocks and ways of operation such as Farmland Biogas Plants (FBP), Food
Waste Biogas Plants (FWBP), Waste Water Treatment Plants (WWTP) and Co-digestion
Plants.
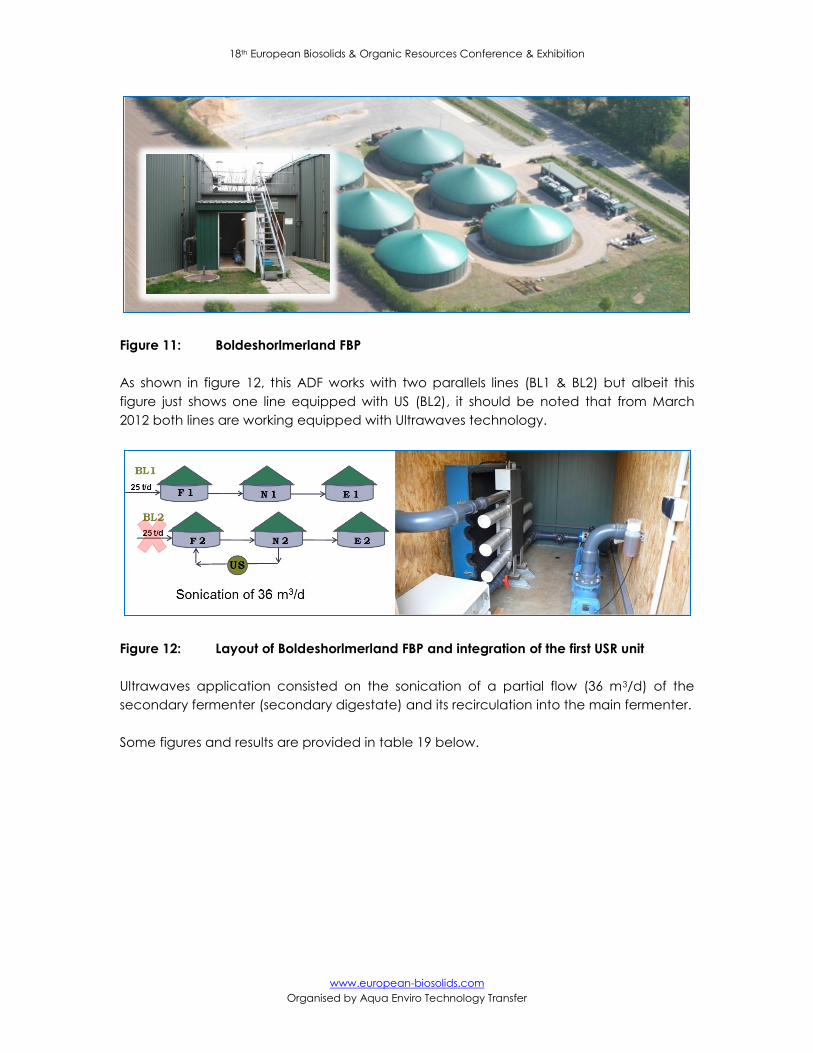
Bordesholmerland FBP
This ADF is a FBP located in Brügge (Germany) where Ultrawaves technology pursued a
main benefit in terms of feedstock saving. In addition, other profitable results like an
increase in methane content and viscosity reduction were also achieved.
18th European Biosolids & Organic Resources Conference & Exhibition
www.european-biosolids.com
Organised by Aqua Enviro Technology Transfer
Figure 11: Boldeshorlmerland FBP
As shown in figure 12, this ADF works with two parallels lines (BL1 & BL2) but albeit this
figure just shows one line equipped with US (BL2), it should be noted that from March
2012 both lines are working equipped with Ultrawaves technology.
Figure 12: Layout of Boldeshorlmerland FBP and integration of the first USR unit
Ultrawaves application consisted on the sonication of a partial flow (36 m3/d) of the
secondary fermenter (secondary digestate) and its recirculation into the main fermenter.
Some figures and results are provided in table 19 below.
18th European Biosolids & Organic Resources Conference & Exhibition
www.european-biosolids.com
Organised by Aqua Enviro Technology Transfer
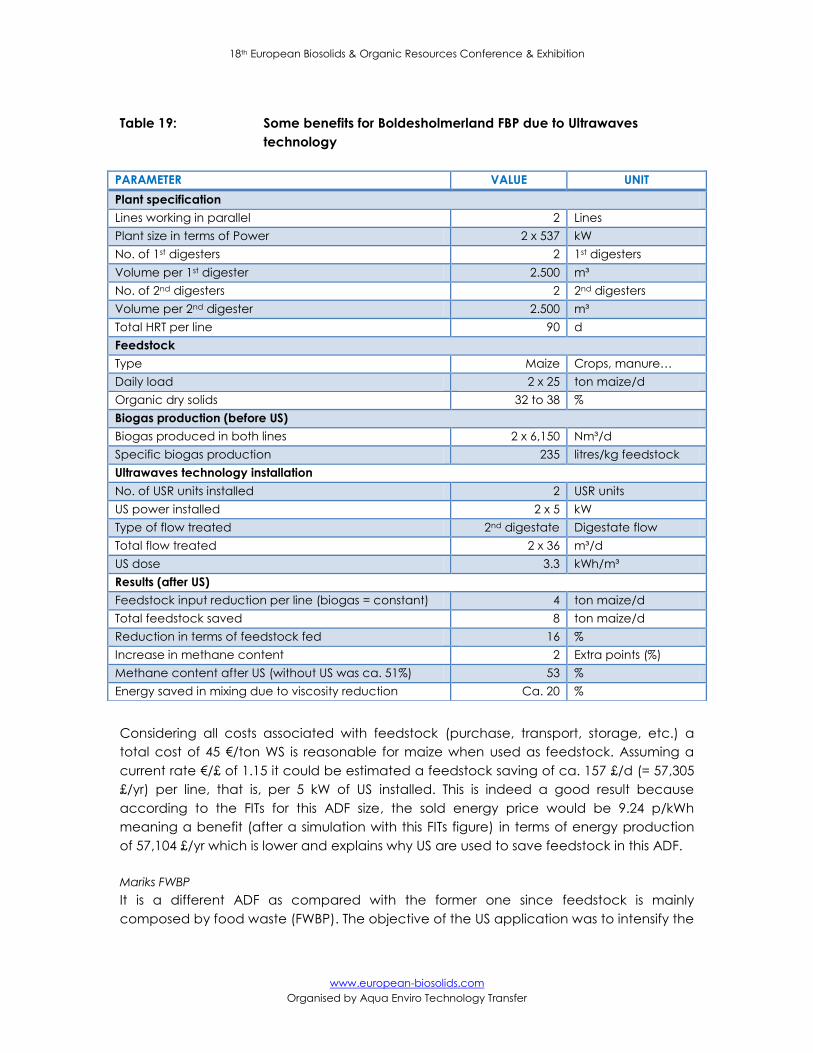
Table 19: Some benefits for Boldesholmerland FBP due to Ultrawaves
technology
Considering all costs associated with feedstock (purchase, transport, storage, etc.) a
total cost of 45 €/ton WS is reasonable for maize when used as feedstock. Assuming a
current rate €/£ of 1.15 it could be estimated a feedstock saving of ca. 157 £/d (= 57,305
£/yr) per line, that is, per 5 kW of US installed. This is indeed a good result because
according to the FITs for this ADF size, the sold energy price would be 9.24 p/kWh
meaning a benefit (after a simulation with this FITs figure) in terms of energy production
of 57,104 £/yr which is lower and explains why US are used to save feedstock in this ADF.
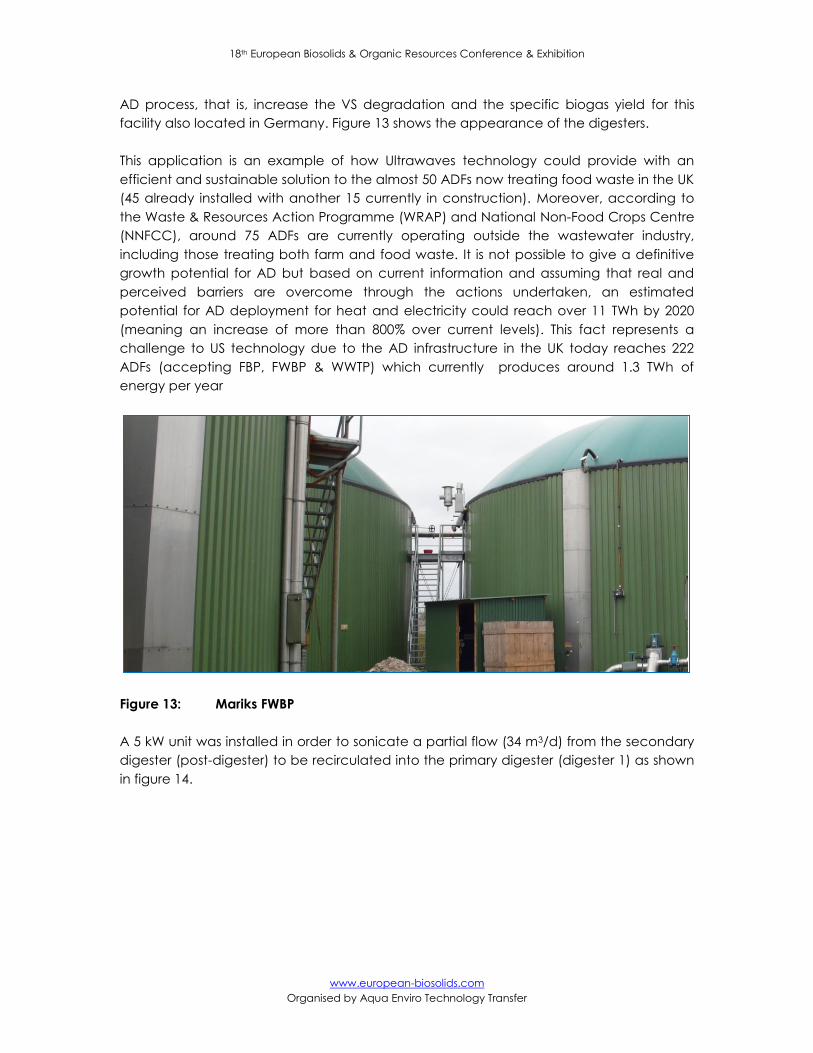
Mariks FWBP
It is a different ADF as compared with the former one since feedstock is mainly
composed by food waste (FWBP). The objective of the US application was to intensify the
PARAMETER VALUE UNIT
Plant specification
Lines working in parallel 2 Lines
Plant size in terms of Power 2 x 537 kW
No. of 1st digesters 2 1st digesters
Volume per 1st digester 2.500 m³
No. of 2nd digesters 2 2nd digesters
Volume per 2nd digester 2.500 m³
Total HRT per line 90 d
Feedstock
Type Maize Crops, manure…
Daily load 2 x 25 ton maize/d
Organic dry solids 32 to 38 %
Biogas production (before US)
Biogas produced in both lines 2 x 6,150 Nm³/d
Specific biogas production 235 litres/kg feedstock
Ultrawaves technology installation
No. of USR units installed 2 USR units
US power installed 2 x 5 kW
Type of flow treated 2nd digestate Digestate flow
Total flow treated 2 x 36 m³/d
US dose 3.3 kWh/m³
Results (after US)
Feedstock input reduction per line (biogas = constant) 4 ton maize/d
Total feedstock saved 8 ton maize/d
Reduction in terms of feedstock fed 16 %
Increase in methane content 2 Extra points (%)
Methane content after US (without US was ca. 51%) 53 %
Energy saved in mixing due to viscosity reduction Ca. 20 %
18th European Biosolids & Organic Resources Conference & Exhibition
www.european-biosolids.com
Organised by Aqua Enviro Technology Transfer
AD process, that is, increase the VS degradation and the specific biogas yield for this
facility also located in Germany. Figure 13 shows the appearance of the digesters.
This application is an example of how Ultrawaves technology could provide with an
efficient and sustainable solution to the almost 50 ADFs now treating food waste in the UK
(45 already installed with another 15 currently in construction). Moreover, according to
the Waste & Resources Action Programme (WRAP) and National Non-Food Crops Centre
(NNFCC), around 75 ADFs are currently operating outside the wastewater industry,
including those treating both farm and food waste. It is not possible to give a definitive
growth potential for AD but based on current information and assuming that real and
perceived barriers are overcome through the actions undertaken, an estimated
potential for AD deployment for heat and electricity could reach over 11 TWh by 2020
(meaning an increase of more than 800% over current levels). This fact represents a
challenge to US technology due to the AD infrastructure in the UK today reaches 222
ADFs (accepting FBP, FWBP & WWTP) which currently produces around 1.3 TWh of
energy per year
Figure 13: Mariks FWBP
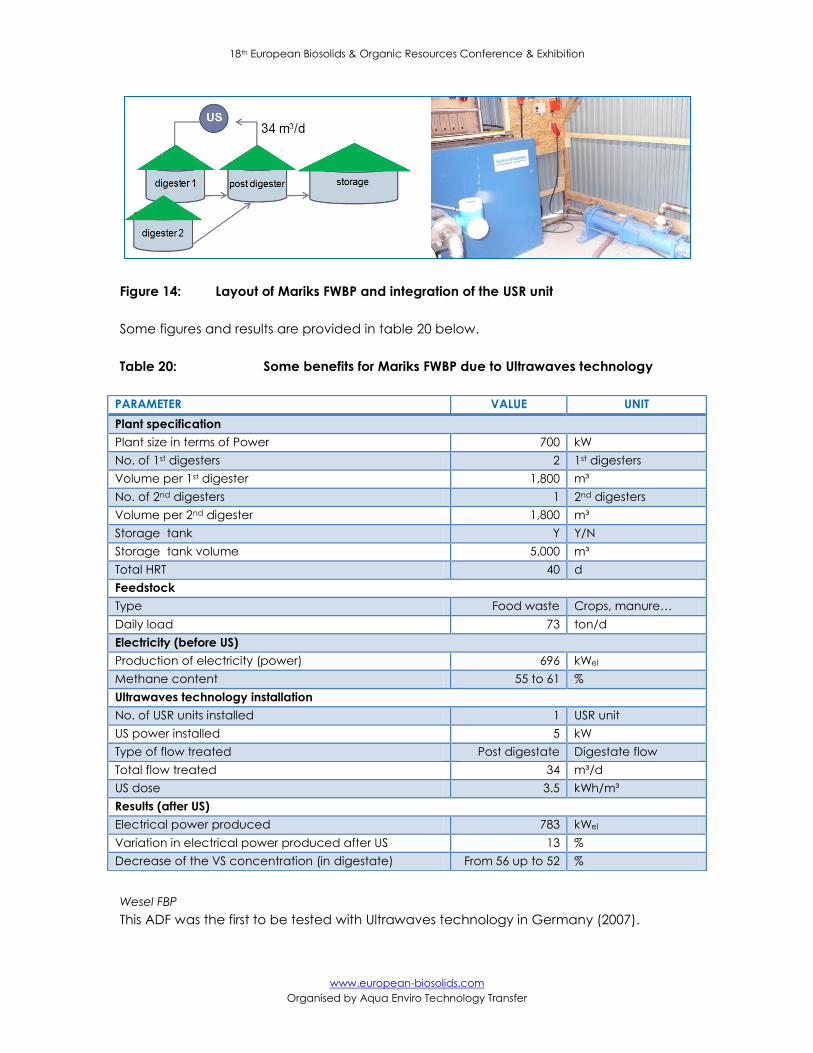
A 5 kW unit was installed in order to sonicate a partial flow (34 m3/d) from the secondary
digester (post-digester) to be recirculated into the primary digester (digester 1) as shown
in figure 14.
18th European Biosolids & Organic Resources Conference & Exhibition
www.european-biosolids.com
Organised by Aqua Enviro Technology Transfer
Figure 14: Layout of Mariks FWBP and integration of the USR unit
Some figures and results are provided in table 20 below.
Table 20: Some benefits for Mariks FWBP due to Ultrawaves technology
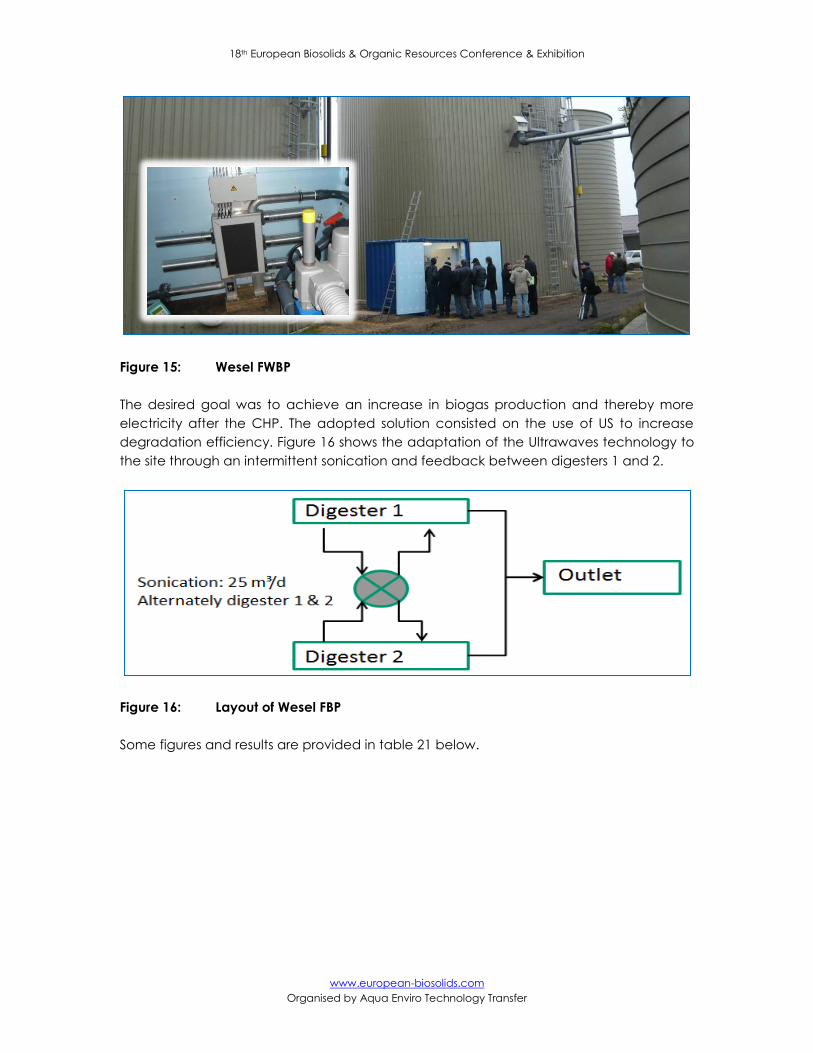
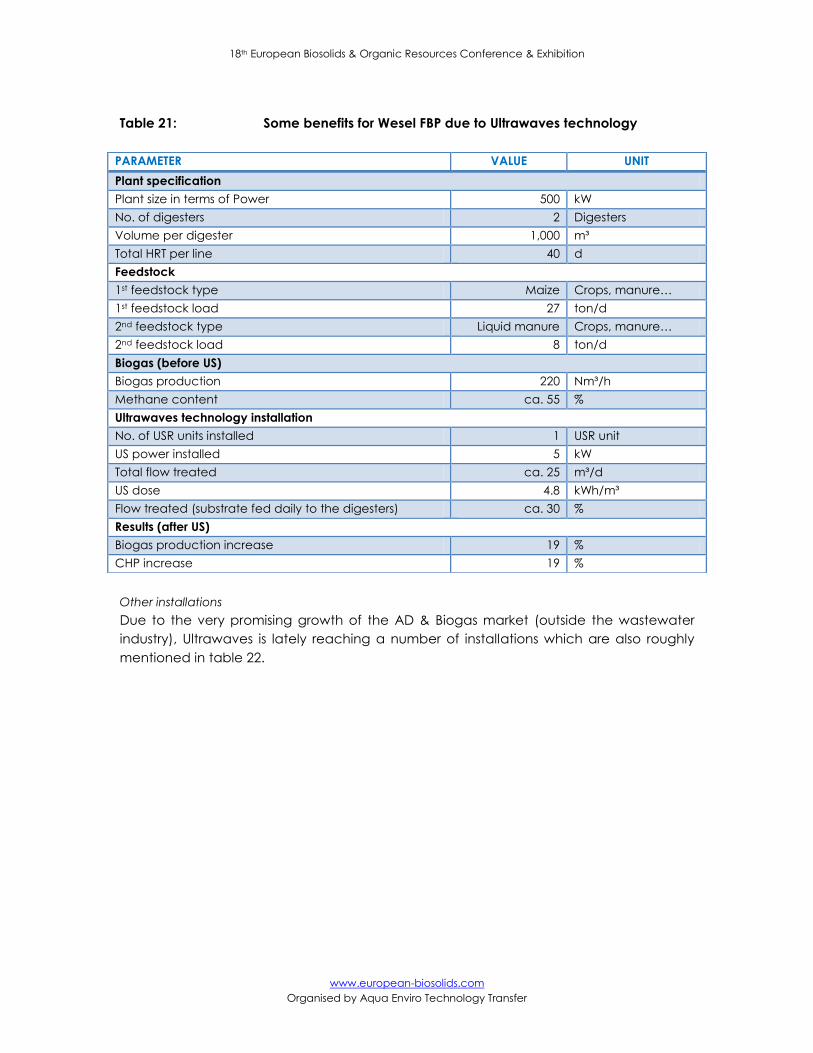
Wesel FBP
This ADF was the first to be tested with Ultrawaves technology in Germany (2007).
PARAMETER VALUE UNIT
Plant specification
Plant size in terms of Power 700 kW
No. of 1st digesters 2 1st digesters
Volume per 1st digester 1,800 m³
No. of 2nd digesters 1 2nd digesters
Volume per 2nd digester 1,800 m³
Storage tank Y Y/N
Storage tank volume 5,000 m³
Total HRT 40 d
Feedstock
Type Food waste Crops, manure…
Daily load 73 ton/d
Electricity (before US)
Production of electricity (power) 696 kWel
Methane content 55 to 61 %
Ultrawaves technology installation
No. of USR units installed 1 USR unit
US power installed 5 kW
Type of flow treated Post digestate Digestate flow
Total flow treated 34 m³/d
US dose 3.5 kWh/m³
Results (after US)
Electrical power produced 783 kWel
Variation in electrical power produced after US 13 %
Decrease of the VS concentration (in digestate) From 56 up to 52 %
18th European Biosolids & Organic Resources Conference & Exhibition
www.european-biosolids.com
Organised by Aqua Enviro Technology Transfer
Figure 15: Wesel FWBP
The desired goal was to achieve an increase in biogas production and thereby more
electricity after the CHP. The adopted solution consisted on the use of US to increase
degradation efficiency. Figure 16 shows the adaptation of the Ultrawaves technology to
the site through an intermittent sonication and feedback between digesters 1 and 2.
Figure 16: Layout of Wesel FBP
Some figures and results are provided in table 21 below.
18th European Biosolids & Organic Resources Conference & Exhibition
www.european-biosolids.com
Organised by Aqua Enviro Technology Transfer
Table 21: Some benefits for Wesel FBP due to Ultrawaves technology
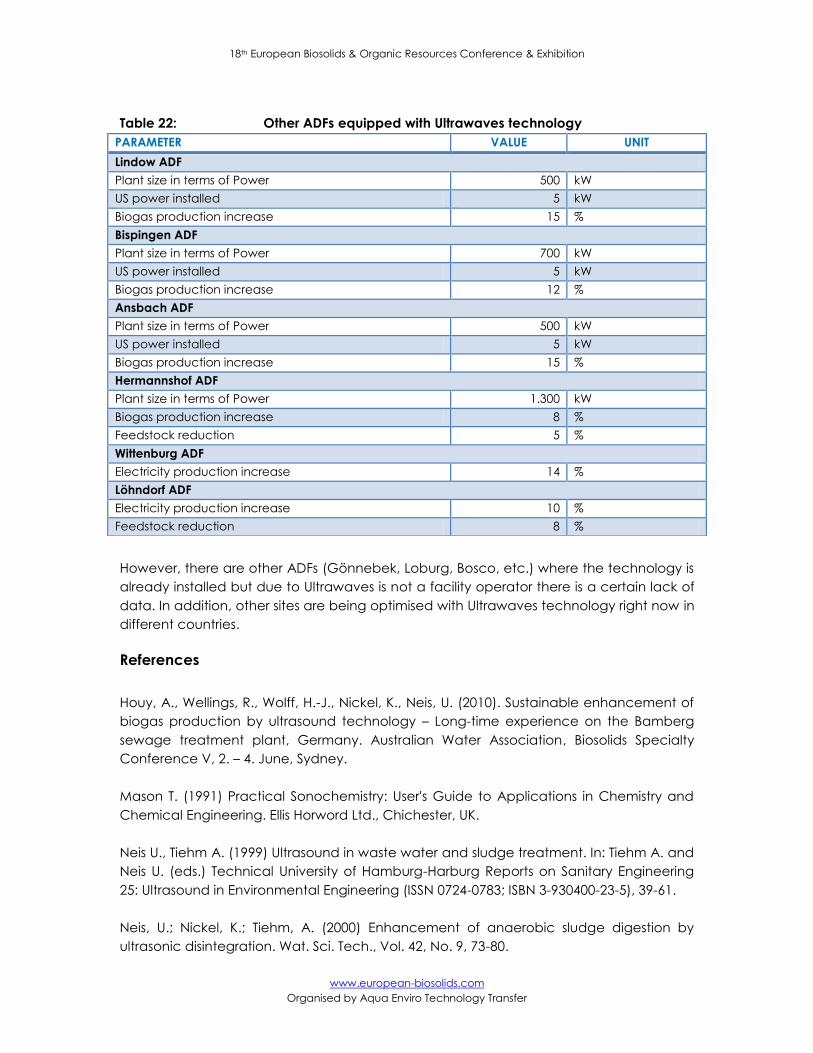
Other installations
Due to the very promising growth of the AD & Biogas market (outside the wastewater
industry), Ultrawaves is lately reaching a number of installations which are also roughly
mentioned in table 22.
PARAMETER VALUE UNIT
Plant specification
Plant size in terms of Power 500 kW
No. of digesters 2 Digesters
Volume per digester 1,000 m³
Total HRT per line 40 d
Feedstock
1st feedstock type Maize Crops, manure…
1st feedstock load 27 ton/d
2nd feedstock type Liquid manure Crops, manure…
2nd feedstock load 8 ton/d
Biogas (before US)
Biogas production 220 Nm³/h
Methane content ca. 55 %
Ultrawaves technology installation
No. of USR units installed 1 USR unit
US power installed 5 kW
Total flow treated ca. 25 m³/d
US dose 4.8 kWh/m³
Flow treated (substrate fed daily to the digesters) ca. 30 %
Results (after US)
Biogas production increase 19 %
CHP increase 19 %
18th European Biosolids & Organic Resources Conference & Exhibition
www.european-biosolids.com
Organised by Aqua Enviro Technology Transfer
Table 22: Other ADFs equipped with Ultrawaves technology
However, there are other ADFs (Gönnebek, Loburg, Bosco, etc.) where the technology is
already installed but due to Ultrawaves is not a facility operator there is a certain lack of
data. In addition, other sites are being optimised with Ultrawaves technology right now in
different countries.
References
Houy, A., Wellings, R., Wolff, H.-J., Nickel, K., Neis, U. (2010). Sustainable enhancement of
biogas production by ultrasound technology – Long-time experience on the Bamberg
sewage treatment plant, Germany. Australian Water Association, Biosolids Specialty
Conference V, 2. – 4. June, Sydney.
Mason T. (1991) Practical Sonochemistry: User's Guide to Applications in Chemistry and
Chemical Engineering. Ellis Horword Ltd., Chichester, UK.
Neis U., Tiehm A. (1999) Ultrasound in waste water and sludge treatment. In: Tiehm A. and
Neis U. (eds.) Technical University of Hamburg-Harburg Reports on Sanitary Engineering
25: Ultrasound in Environmental Engineering (ISSN 0724-0783; ISBN 3-930400-23-5), 39-61.
Neis, U.; Nickel, K.; Tiehm, A. (2000) Enhancement of anaerobic sludge digestion by
ultrasonic disintegration. Wat. Sci. Tech., Vol. 42, No. 9, 73-80.
PARAMETER VALUE UNIT
Lindow ADF
Plant size in terms of Power 500 kW
US power installed 5 kW
Biogas production increase 15 %
Bispingen ADF
Plant size in terms of Power 700 kW
US power installed 5 kW
Biogas production increase 12 %
Ansbach ADF
Plant size in terms of Power 500 kW
US power installed 5 kW
Biogas production increase 15 %
Hermannshof ADF
Plant size in terms of Power 1.300 kW
Biogas production increase 8 %
Feedstock reduction 5 %
Wittenburg ADF
Electricity production increase 14 %
Löhndorf ADF
Electricity production increase 10 %
Feedstock reduction 8 %
18th European Biosolids & Organic Resources Conference & Exhibition
www.european-biosolids.com
Organised by Aqua Enviro Technology Transfer
Nickel, K. (1999). Improving anaerobic degradation by ultrasonic disintegration of
sewage sludge. In: Tiehm, A. and Neis, U. (eds.), Ultrasound in environmental engineering,
TU Hamburg-Harburg Reports on Sanitary Engineering, 25, GFEU-Verlag, 217-232.
Suslick, K. S.: Ultrasound: its chemical, physical, and biological effects, VCH Publishers
(1988).
Tiehm A., Nickel K., Zellhorn M., Neis U. (2001) Ultrasonic waste activated sludge
disintegration for improving anaerobic stabilization. Water Research, Vol. 35, No. 8, 2003-
2009.