how to measure inflation in india
DESCRIPTION
A paper that describes the basics of inflation and the issues of measurement of inflation in India. A wonderful research paper.....!!!TRANSCRIPT
How to measure inflation in India?
Ila Patnaik, Ajay Shah, Giovanni Veronese
Working Paper 2011-83
February 2011
NIPFP-DEA Research Program on Capital Flows and their ConsequencesNational Institute of Public Finance and Policy
New Delhi
http://www.nipfp.org.in/nipfp-dea-program/index.html
How to measure inflation in India?
Ila Patnaik Ajay Shah Giovanni Veronese ∗
February 7, 2011
Abstract
What is the best inflation measure in India? What inflation mea-sure is most relevant for monetary policy making in India? Questionsof timeliness, weights in the price index, accuracy of food price mea-surement, and inclusion of services prices are relevant to the choice ofmeasure. We show that under present conditions of measurement, theConsumer Price Index for Industrial Workers (CPI-IW) is preferableto either the Wholesale Price Index or the GDP deflator.
JEL classification: E52; E58.
Keywords: Monetary policy; inflation measure; statistical sys-tem.
∗Ila Patnaik and Ajay Shah are with the National Institute of Public Finance and Policyand Giovanni Veronese is with the Bank of Italy. The authors thank Ashish Kumar forresearch assistance. The views expressed in this paper are exclusively those of the authorsand not of their institutions. This paper was written under the aegis of the NIPFP-DEAResearch Program.
1
Contents
1 Introduction 3
2 Multiple inflation measures 5
3 Issues in choice of inflation measure 8
4 Wholesale price index 9
5 GDP deflator 13
6 Consumer price index 146.1 Food prices . . . . . . . . . . . . . . . . . . . . . . . . . . . . 166.2 Base year . . . . . . . . . . . . . . . . . . . . . . . . . . . . . 186.3 Price of services . . . . . . . . . . . . . . . . . . . . . . . . . . 186.4 Issues of core inflation and further research . . . . . . . . . . . 22
7 Conclusion 24
A Appendix 27A.1 Notes on the food-prices dataset . . . . . . . . . . . . . . . . . 27
2
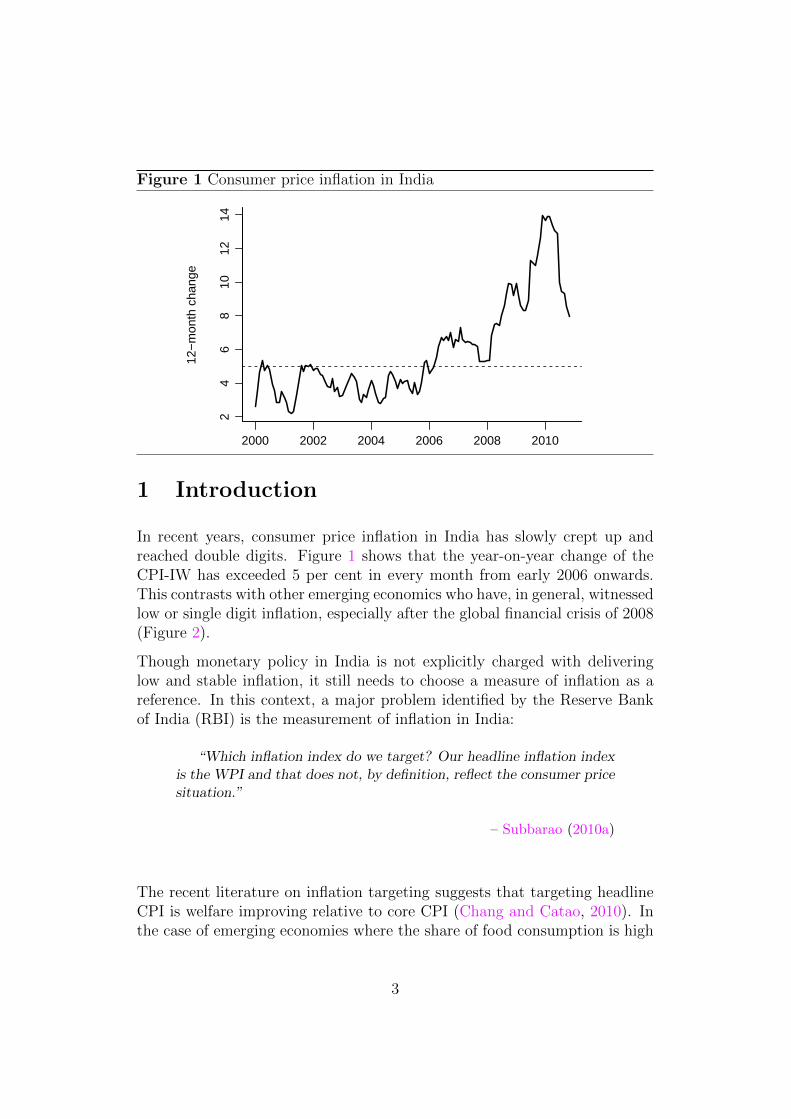
Figure 1 Consumer price inflation in India
2000 2002 2004 2006 2008 2010
24
68
1012
14
12−
mon
th c
hang
e
1 Introduction
In recent years, consumer price inflation in India has slowly crept up andreached double digits. Figure 1 shows that the year-on-year change of theCPI-IW has exceeded 5 per cent in every month from early 2006 onwards.This contrasts with other emerging economics who have, in general, witnessedlow or single digit inflation, especially after the global financial crisis of 2008(Figure 2).
Though monetary policy in India is not explicitly charged with deliveringlow and stable inflation, it still needs to choose a measure of inflation as areference. In this context, a major problem identified by the Reserve Bankof India (RBI) is the measurement of inflation in India:
“Which inflation index do we target? Our headline inflation indexis the WPI and that does not, by definition, reflect the consumer pricesituation.”
– Subbarao (2010a)
The recent literature on inflation targeting suggests that targeting headlineCPI is welfare improving relative to core CPI (Chang and Catao, 2010). Inthe case of emerging economies where the share of food consumption is high
3
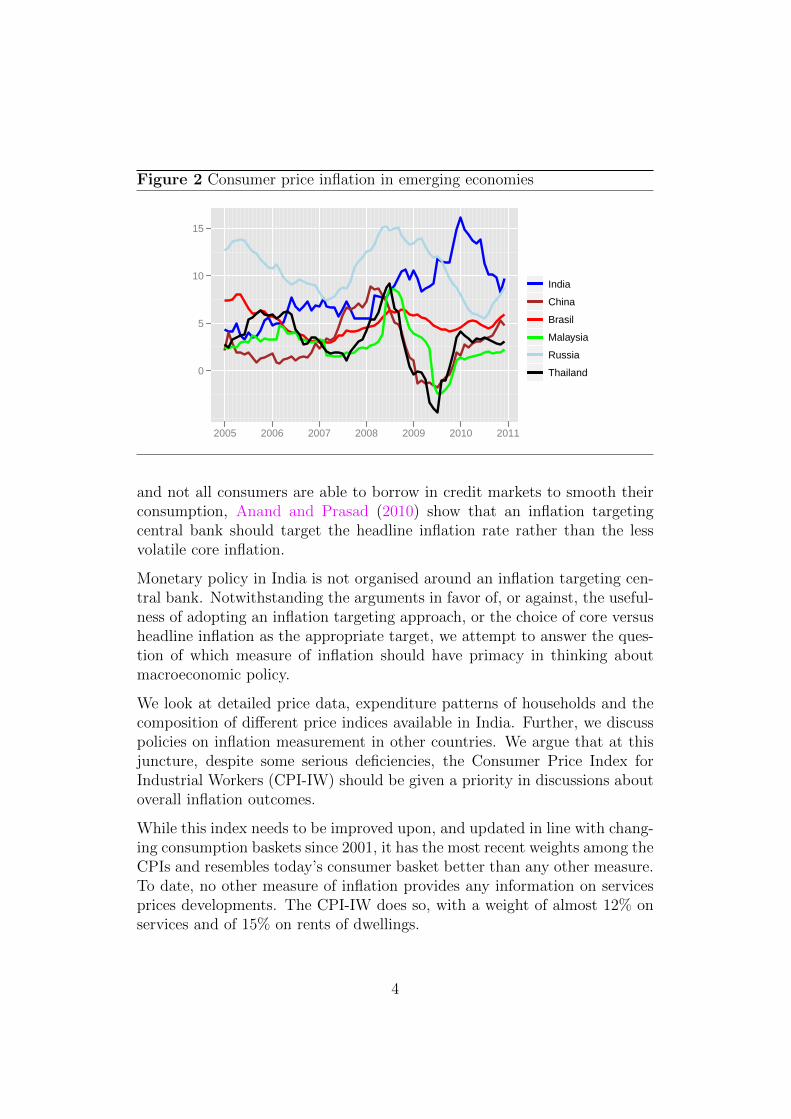
Figure 2 Consumer price inflation in emerging economies
0
5
10
15
2005 2006 2007 2008 2009 2010 2011
India
China
Brasil
Malaysia
Russia
Thailand
and not all consumers are able to borrow in credit markets to smooth theirconsumption, Anand and Prasad (2010) show that an inflation targetingcentral bank should target the headline inflation rate rather than the lessvolatile core inflation.
Monetary policy in India is not organised around an inflation targeting cen-tral bank. Notwithstanding the arguments in favor of, or against, the useful-ness of adopting an inflation targeting approach, or the choice of core versusheadline inflation as the appropriate target, we attempt to answer the ques-tion of which measure of inflation should have primacy in thinking aboutmacroeconomic policy.
We look at detailed price data, expenditure patterns of households and thecomposition of different price indices available in India. Further, we discusspolicies on inflation measurement in other countries. We argue that at thisjuncture, despite some serious deficiencies, the Consumer Price Index forIndustrial Workers (CPI-IW) should be given a priority in discussions aboutoverall inflation outcomes.
While this index needs to be improved upon, and updated in line with chang-ing consumption baskets since 2001, it has the most recent weights among theCPIs and resembles today’s consumer basket better than any other measure.To date, no other measure of inflation provides any information on servicesprices developments. The CPI-IW does so, with a weight of almost 12% onservices and of 15% on rents of dwellings.
4
We argue that the Wholesale Price Index (WPI), while continuing to be avaluable source of price data, should be demphasised in the discussion ofinflation outcomes. Increasing trade integration coupled with the domesticliberalization of administered prices has turned a growing fraction of theWPI basket into tradable goods, whose prices are determined in internationalmarkets.
By this reasoning, the acceleration in year-on-year inflation beyond 5 per centfrom early 2006 onwards should be seen as a serious problem. The problemof high and volatile inflation should not be downplayed on the grounds thatit is based on low quality information.
The Central Statistical Office’s plans of releasing a new CPI series for Indiain February 2010 lends fresh salience to this question. This new CPI is likelyto become the best candidate for a headline inflation indicator, through sig-nificant improvement upon existing price indices in terms of representation,quality of price collection and weighting. The release of this new CPI is anatural opportunity for RBI to de-emphasise other inflation measures andfocus on the new CPI.
2 Multiple inflation measures
The multiplicity of inflation indices available in India has often been describedas problematic and has been used as an argument for not adopting a fullfledged inflation targeting framework:
“In India, we have one wholesale price index and four consumerprice indices. There are ongoing efforts at a technical level to reducethe number of consumer price indices, and I believe the technical issuesare not insurmountable. But that still will not give us a single repre-sentative inflation rate for an emerging market economy with marketimperfections, diverse geography and 1.2 billion people.”
– Subbarao (2010b)
Table 1 shows that a multiplicity of inflation measures are also found inother countries. Indeed, India does not collate some of the indicators thatare available in other countries. Some careful country descriptions are useful:
The United States In the US, consumer price indexes are available for two
5
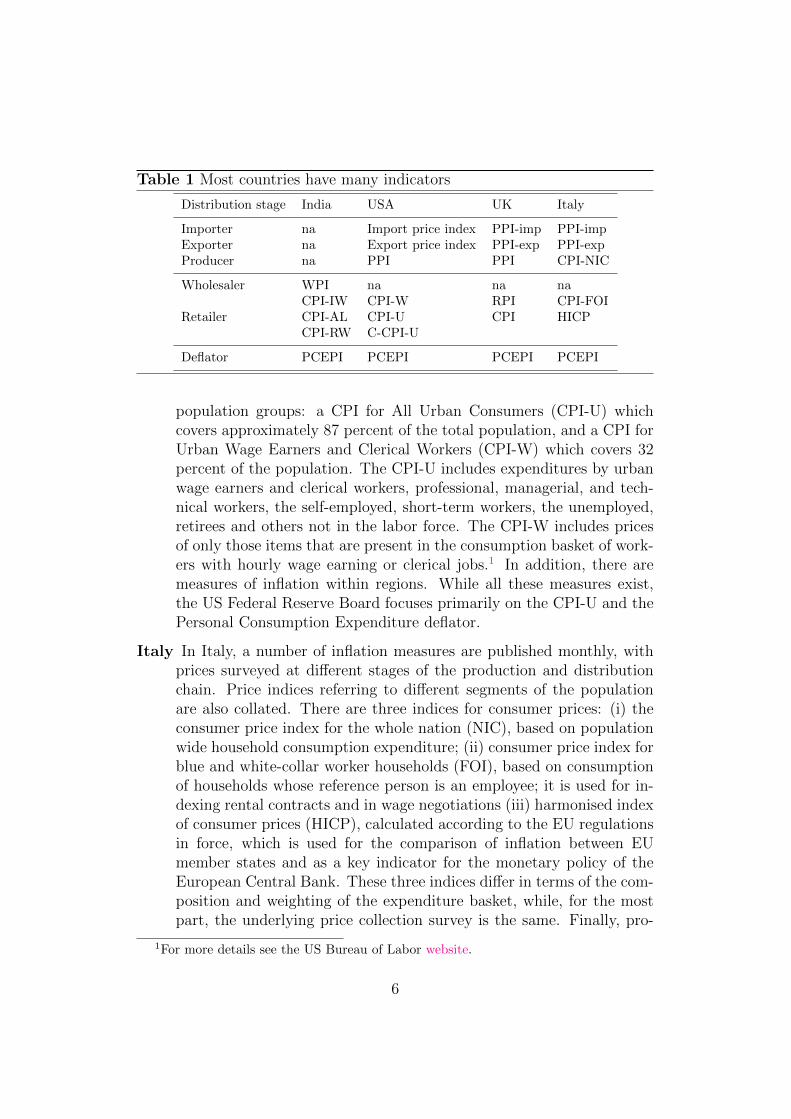
Table 1 Most countries have many indicators
Distribution stage India USA UK Italy
Importer na Import price index PPI-imp PPI-impExporter na Export price index PPI-exp PPI-expProducer na PPI PPI CPI-NIC
Wholesaler WPI na na naCPI-IW CPI-W RPI CPI-FOI
Retailer CPI-AL CPI-U CPI HICPCPI-RW C-CPI-U
Deflator PCEPI PCEPI PCEPI PCEPI
population groups: a CPI for All Urban Consumers (CPI-U) whichcovers approximately 87 percent of the total population, and a CPI forUrban Wage Earners and Clerical Workers (CPI-W) which covers 32percent of the population. The CPI-U includes expenditures by urbanwage earners and clerical workers, professional, managerial, and tech-nical workers, the self-employed, short-term workers, the unemployed,retirees and others not in the labor force. The CPI-W includes pricesof only those items that are present in the consumption basket of work-ers with hourly wage earning or clerical jobs.1 In addition, there aremeasures of inflation within regions. While all these measures exist,the US Federal Reserve Board focuses primarily on the CPI-U and thePersonal Consumption Expenditure deflator.
Italy In Italy, a number of inflation measures are published monthly, withprices surveyed at different stages of the production and distributionchain. Price indices referring to different segments of the populationare also collated. There are three indices for consumer prices: (i) theconsumer price index for the whole nation (NIC), based on populationwide household consumption expenditure; (ii) consumer price index forblue and white-collar worker households (FOI), based on consumptionof households whose reference person is an employee; it is used for in-dexing rental contracts and in wage negotiations (iii) harmonised indexof consumer prices (HICP), calculated according to the EU regulationsin force, which is used for the comparison of inflation between EUmember states and as a key indicator for the monetary policy of theEuropean Central Bank. These three indices differ in terms of the com-position and weighting of the expenditure basket, while, for the mostpart, the underlying price collection survey is the same. Finally, pro-
1For more details see the US Bureau of Labor website.
6
ducer prices (PPI) are surveyed monthly, distinguishing developmentson the domestic and the export market.
The United Kingdom A similar situation exists in the UK, where theConsumer Price Index (CPI) is the Government’s preferred measure ofinflation for macroeconomic policy. The institutional arrangement inthe UK involves a central bank that targets inflation, while the Treasuryspecifies which index should be used and what rate should be targeted.The UK Treasury has instructed the Bank of England to deliver 2%inflation as measured by the CPI.
In contrast, the UK Retail Prices Index (RPI) is a general purpose in-dicator of inflation and its uses include indexation of pensions, benefitsand index-linked gilts. A variant of the RPI is the RPI-X which ex-cludes mortgage payments, but includes other components of housingcosts (housing depreciation, council tax, dwellings insurance, groundrent, estate agents fees, surveyors costs and conveyancing fees). TheProducer Price Index (PPI) is a monthly survey that measures the pricechanges of goods bought and sold by UK manufacturers. The surveycollects information to develop the output price index, sometimes re-ferred to as factory gate prices, which measures prices of goods sold byUK manufacturers. Furthermore, it also collects information for theInput index which measures the prices of materials and fuel purchasedby manufacturers. In addition, there are a number of export and im-port price indices available. Finally, the Services Producer Price Index(SPPI) is a quarterly survey of prices charged for services provided byUK businesses to other UK businesses and government.2
These examples illustrate the point that in all countries, multiple price mea-sures exist and have a useful role. At the same time, the presence of multiplemeasures does not undermine the conduct of macroeconomic policy.
On the issue of a large and diverse population also, India is not unique. As anexample, the US has substantial domestic heterogeneity, with greater incomeinequality than is found in India. This has not undermined the notion of anoverall average measure of inflation. A more striking counter-example is thatof the European Central Bank (ECB), which has the mandate of deliveringprice stability for a group of 14 countries with a population adding up to 320million featuring substantial regional diversity.
While these differences may be present, there is still much value in viewing
2Industry-specific series covering about half the total corporate services sector are cur-rently published as experimental statistics.
7
an overall average measure of inflation as one of the key summary statisticsof macroeconomic conditions. Since macroeconomic policy is about aggrega-tive policy instruments which influence every household, it is appropriatethat it respond to aggregative information measures which average across allhouseholds.
In a nutshell, we conclude that other countries too have many price indices,but this does not deter them from choosing one or the other measure of infla-tion for macroeconomic policy making. This motivates a careful examinationof the price indices available in India with the aim of choosing one.
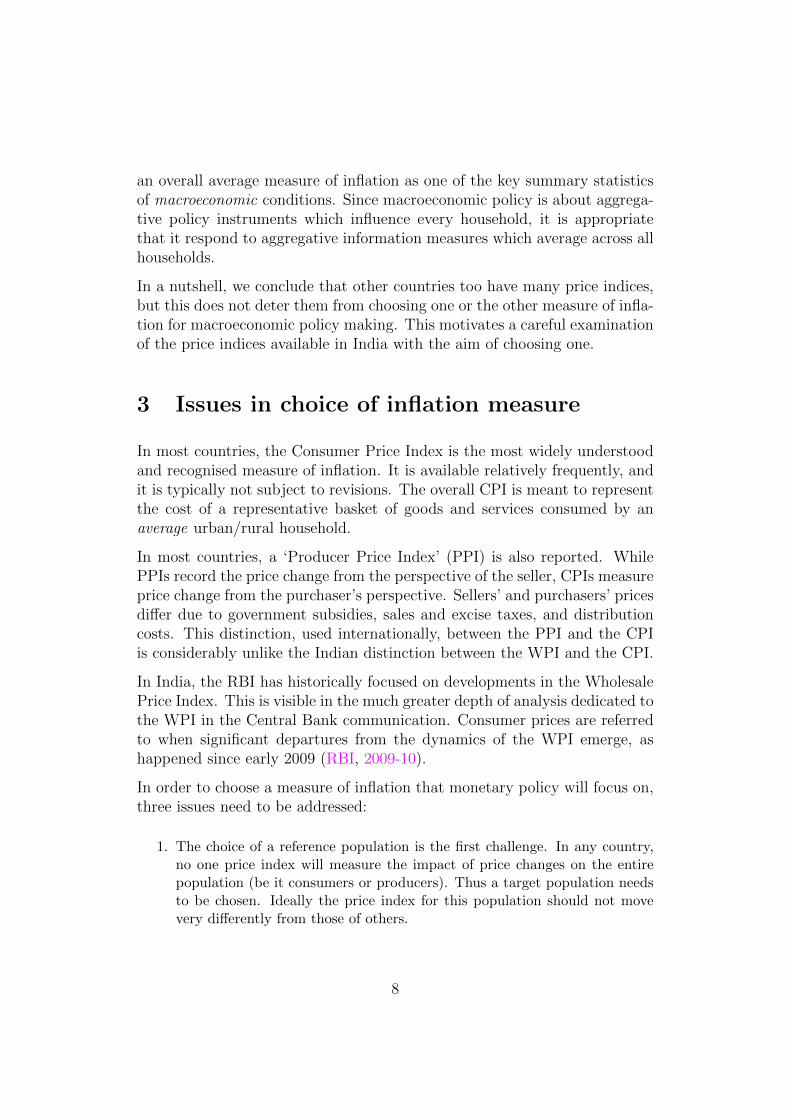
3 Issues in choice of inflation measure
In most countries, the Consumer Price Index is the most widely understoodand recognised measure of inflation. It is available relatively frequently, andit is typically not subject to revisions. The overall CPI is meant to representthe cost of a representative basket of goods and services consumed by anaverage urban/rural household.
In most countries, a ‘Producer Price Index’ (PPI) is also reported. WhilePPIs record the price change from the perspective of the seller, CPIs measureprice change from the purchaser’s perspective. Sellers’ and purchasers’ pricesdiffer due to government subsidies, sales and excise taxes, and distributioncosts. This distinction, used internationally, between the PPI and the CPIis considerably unlike the Indian distinction between the WPI and the CPI.
In India, the RBI has historically focused on developments in the WholesalePrice Index. This is visible in the much greater depth of analysis dedicated tothe WPI in the Central Bank communication. Consumer prices are referredto when significant departures from the dynamics of the WPI emerge, ashappened since early 2009 (RBI, 2009-10).
In order to choose a measure of inflation that monetary policy will focus on,three issues need to be addressed:
1. The choice of a reference population is the first challenge. In any country,no one price index will measure the impact of price changes on the entirepopulation (be it consumers or producers). Thus a target population needsto be chosen. Ideally the price index for this population should not movevery differently from those of others.
8
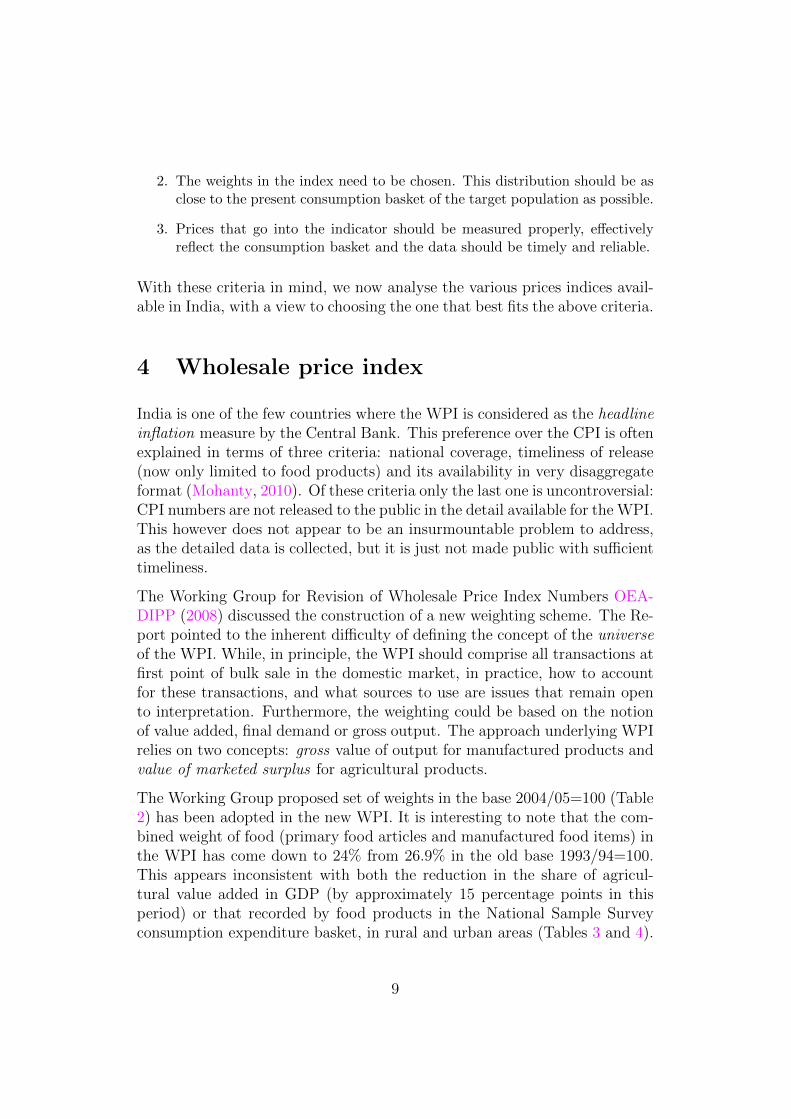
2. The weights in the index need to be chosen. This distribution should be asclose to the present consumption basket of the target population as possible.
3. Prices that go into the indicator should be measured properly, effectivelyreflect the consumption basket and the data should be timely and reliable.
With these criteria in mind, we now analyse the various prices indices avail-able in India, with a view to choosing the one that best fits the above criteria.
4 Wholesale price index
India is one of the few countries where the WPI is considered as the headlineinflation measure by the Central Bank. This preference over the CPI is oftenexplained in terms of three criteria: national coverage, timeliness of release(now only limited to food products) and its availability in very disaggregateformat (Mohanty, 2010). Of these criteria only the last one is uncontroversial:CPI numbers are not released to the public in the detail available for the WPI.This however does not appear to be an insurmountable problem to address,as the detailed data is collected, but it is just not made public with sufficienttimeliness.
The Working Group for Revision of Wholesale Price Index Numbers OEA-DIPP (2008) discussed the construction of a new weighting scheme. The Re-port pointed to the inherent difficulty of defining the concept of the universeof the WPI. While, in principle, the WPI should comprise all transactions atfirst point of bulk sale in the domestic market, in practice, how to accountfor these transactions, and what sources to use are issues that remain opento interpretation. Furthermore, the weighting could be based on the notionof value added, final demand or gross output. The approach underlying WPIrelies on two concepts: gross value of output for manufactured products andvalue of marketed surplus for agricultural products.
The Working Group proposed set of weights in the base 2004/05=100 (Table2) has been adopted in the new WPI. It is interesting to note that the com-bined weight of food (primary food articles and manufactured food items) inthe WPI has come down to 24% from 26.9% in the old base 1993/94=100.This appears inconsistent with both the reduction in the share of agricul-tural value added in GDP (by approximately 15 percentage points in thisperiod) or that recorded by food products in the National Sample Surveyconsumption expenditure basket, in rural and urban areas (Tables 3 and 4).
9
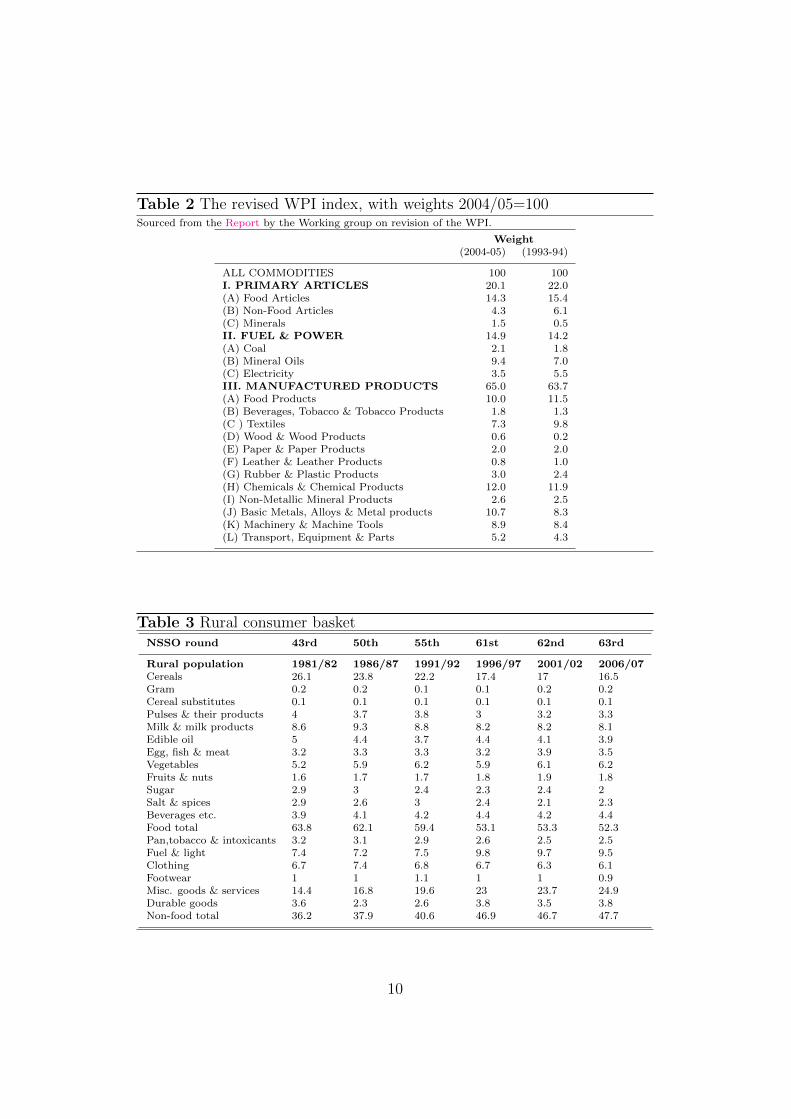
Table 2 The revised WPI index, with weights 2004/05=100Sourced from the Report by the Working group on revision of the WPI.
Weight(2004-05) (1993-94)
ALL COMMODITIES 100 100I. PRIMARY ARTICLES 20.1 22.0(A) Food Articles 14.3 15.4(B) Non-Food Articles 4.3 6.1(C) Minerals 1.5 0.5II. FUEL & POWER 14.9 14.2(A) Coal 2.1 1.8(B) Mineral Oils 9.4 7.0(C) Electricity 3.5 5.5III. MANUFACTURED PRODUCTS 65.0 63.7(A) Food Products 10.0 11.5(B) Beverages, Tobacco & Tobacco Products 1.8 1.3(C ) Textiles 7.3 9.8(D) Wood & Wood Products 0.6 0.2(E) Paper & Paper Products 2.0 2.0(F) Leather & Leather Products 0.8 1.0(G) Rubber & Plastic Products 3.0 2.4(H) Chemicals & Chemical Products 12.0 11.9(I) Non-Metallic Mineral Products 2.6 2.5(J) Basic Metals, Alloys & Metal products 10.7 8.3(K) Machinery & Machine Tools 8.9 8.4(L) Transport, Equipment & Parts 5.2 4.3
Table 3 Rural consumer basketNSSO round 43rd 50th 55th 61st 62nd 63rd
Rural population 1981/82 1986/87 1991/92 1996/97 2001/02 2006/07Cereals 26.1 23.8 22.2 17.4 17 16.5Gram 0.2 0.2 0.1 0.1 0.2 0.2Cereal substitutes 0.1 0.1 0.1 0.1 0.1 0.1Pulses & their products 4 3.7 3.8 3 3.2 3.3Milk & milk products 8.6 9.3 8.8 8.2 8.2 8.1Edible oil 5 4.4 3.7 4.4 4.1 3.9Egg, fish & meat 3.2 3.3 3.3 3.2 3.9 3.5Vegetables 5.2 5.9 6.2 5.9 6.1 6.2Fruits & nuts 1.6 1.7 1.7 1.8 1.9 1.8Sugar 2.9 3 2.4 2.3 2.4 2Salt & spices 2.9 2.6 3 2.4 2.1 2.3Beverages etc. 3.9 4.1 4.2 4.4 4.2 4.4Food total 63.8 62.1 59.4 53.1 53.3 52.3Pan,tobacco & intoxicants 3.2 3.1 2.9 2.6 2.5 2.5Fuel & light 7.4 7.2 7.5 9.8 9.7 9.5Clothing 6.7 7.4 6.8 6.7 6.3 6.1Footwear 1 1 1.1 1 1 0.9Misc. goods & services 14.4 16.8 19.6 23 23.7 24.9Durable goods 3.6 2.3 2.6 3.8 3.5 3.8Non-food total 36.2 37.9 40.6 46.9 46.7 47.7
10
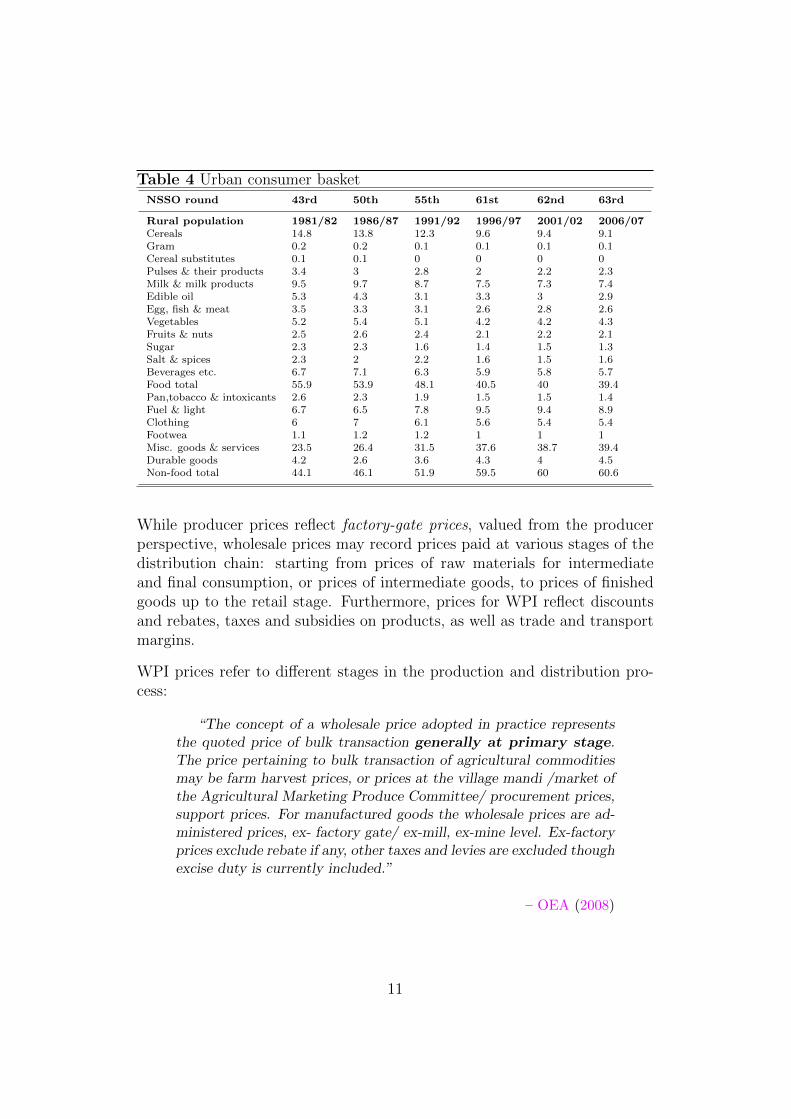
Table 4 Urban consumer basketNSSO round 43rd 50th 55th 61st 62nd 63rd
Rural population 1981/82 1986/87 1991/92 1996/97 2001/02 2006/07Cereals 14.8 13.8 12.3 9.6 9.4 9.1Gram 0.2 0.2 0.1 0.1 0.1 0.1Cereal substitutes 0.1 0.1 0 0 0 0Pulses & their products 3.4 3 2.8 2 2.2 2.3Milk & milk products 9.5 9.7 8.7 7.5 7.3 7.4Edible oil 5.3 4.3 3.1 3.3 3 2.9Egg, fish & meat 3.5 3.3 3.1 2.6 2.8 2.6Vegetables 5.2 5.4 5.1 4.2 4.2 4.3Fruits & nuts 2.5 2.6 2.4 2.1 2.2 2.1Sugar 2.3 2.3 1.6 1.4 1.5 1.3Salt & spices 2.3 2 2.2 1.6 1.5 1.6Beverages etc. 6.7 7.1 6.3 5.9 5.8 5.7Food total 55.9 53.9 48.1 40.5 40 39.4Pan,tobacco & intoxicants 2.6 2.3 1.9 1.5 1.5 1.4Fuel & light 6.7 6.5 7.8 9.5 9.4 8.9Clothing 6 7 6.1 5.6 5.4 5.4Footwea 1.1 1.2 1.2 1 1 1Misc. goods & services 23.5 26.4 31.5 37.6 38.7 39.4Durable goods 4.2 2.6 3.6 4.3 4 4.5Non-food total 44.1 46.1 51.9 59.5 60 60.6
While producer prices reflect factory-gate prices, valued from the producerperspective, wholesale prices may record prices paid at various stages of thedistribution chain: starting from prices of raw materials for intermediateand final consumption, or prices of intermediate goods, to prices of finishedgoods up to the retail stage. Furthermore, prices for WPI reflect discountsand rebates, taxes and subsidies on products, as well as trade and transportmargins.
WPI prices refer to different stages in the production and distribution pro-cess:
“The concept of a wholesale price adopted in practice representsthe quoted price of bulk transaction generally at primary stage.The price pertaining to bulk transaction of agricultural commoditiesmay be farm harvest prices, or prices at the village mandi /market ofthe Agricultural Marketing Produce Committee/ procurement prices,support prices. For manufactured goods the wholesale prices are ad-ministered prices, ex- factory gate/ ex-mill, ex-mine level. Ex-factoryprices exclude rebate if any, other taxes and levies are excluded thoughexcise duty is currently included.”
– OEA (2008)
11
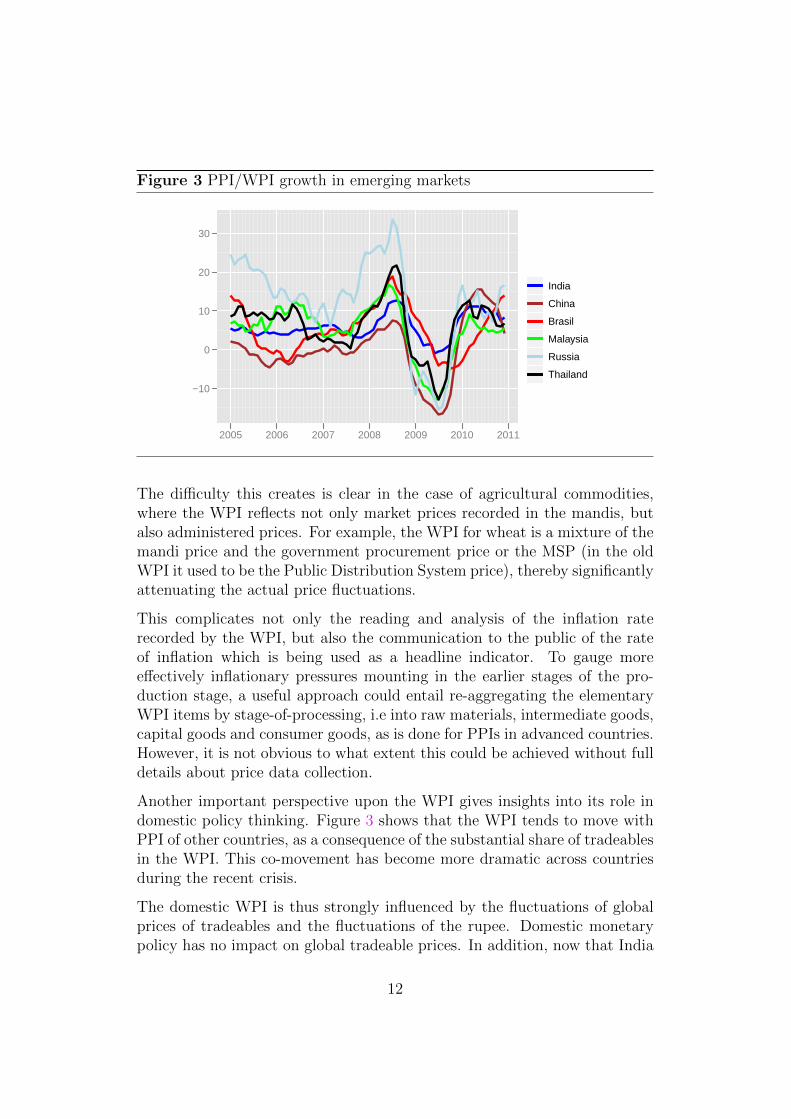
Figure 3 PPI/WPI growth in emerging markets
−10
0
10
20
30
2005 2006 2007 2008 2009 2010 2011
India
China
Brasil
Malaysia
Russia
Thailand
The difficulty this creates is clear in the case of agricultural commodities,where the WPI reflects not only market prices recorded in the mandis, butalso administered prices. For example, the WPI for wheat is a mixture of themandi price and the government procurement price or the MSP (in the oldWPI it used to be the Public Distribution System price), thereby significantlyattenuating the actual price fluctuations.
This complicates not only the reading and analysis of the inflation raterecorded by the WPI, but also the communication to the public of the rateof inflation which is being used as a headline indicator. To gauge moreeffectively inflationary pressures mounting in the earlier stages of the pro-duction stage, a useful approach could entail re-aggregating the elementaryWPI items by stage-of-processing, i.e into raw materials, intermediate goods,capital goods and consumer goods, as is done for PPIs in advanced countries.However, it is not obvious to what extent this could be achieved without fulldetails about price data collection.
Another important perspective upon the WPI gives insights into its role indomestic policy thinking. Figure 3 shows that the WPI tends to move withPPI of other countries, as a consequence of the substantial share of tradeablesin the WPI. This co-movement has become more dramatic across countriesduring the recent crisis.
The domestic WPI is thus strongly influenced by the fluctuations of globalprices of tradeables and the fluctuations of the rupee. Domestic monetarypolicy has no impact on global tradeable prices. In addition, now that India
12
has moved towards a flexible exchange rate policy, domestic monetary policydoes not involve an administrative control of the exchange rate.3 There isa telling contrast between Figure 3, where a range of countries have similartradeables inflation, and Figure 2, which shows the divergence of consumerprice inflation across the same countries.
This suggests that the central bank should focus on Figure 2 – the uniquefeatures of each domestic economy – rather than on Figure 3 – the commonfactor of global tradeables inflation.
5 GDP deflator
The GDP deflator is another indicator of inflation, which is often consideredto be broader than the CPI and the WPI. The GDP deflator in most countriesis obtained by using a variety of primary price indices. These are used todeflate individual components of GDP valued at current prices (either fromthe production or the demand side estimates) to obtain volume estimates.The GDP deflator is then defined implicitly as the ratio of the estimate atcurrent prices to the one at constant prices. When this process is followed,the GDP deflator is legitimately recognised as a high quality measure ofinflation. Nonetheless, given the delay in publication of national accounts itis seldom used as a headline indicator of inflation in a realtime setting.
In India, some observers have argued in favor of using the GDP deflator as thereference measure of inflation. While appealing in theory, this suggestions donot take into account the actual procedures used to estimate this deflator inIndia. For quarterly accounts, the production approach GDP estimates arefirst obtained using proxy indicators of quantity (e.g. industrial production)and then inflated to current price estimates. This operation, especially forthe most recent quarters, is performed using the overall WPI series.4 Itshould not, therefore, come as a surprise that the dynamics in the deflatorclosely resembles the ones of WPI, especially so in the last available quarters,as mentioned in Nadhanael and Pattnaik (2010)5. Thus, by construction, themost recent figures on the quarterly GDP deflator contain little information
3Domestic monetary policy does have an indirect impact upon the exchange rate. Otherthings being equal, when the Indian policy rate goes up, more capital comes into India,and the rupee appreciates. However, these changes are a small part of the overall volatilityof the INR/USD exchange rate which now works out to roughly 10 per cent per year.
4In our knowledge, the CPI-IW is used only for 2 sectors.5See CSO (2008).
13
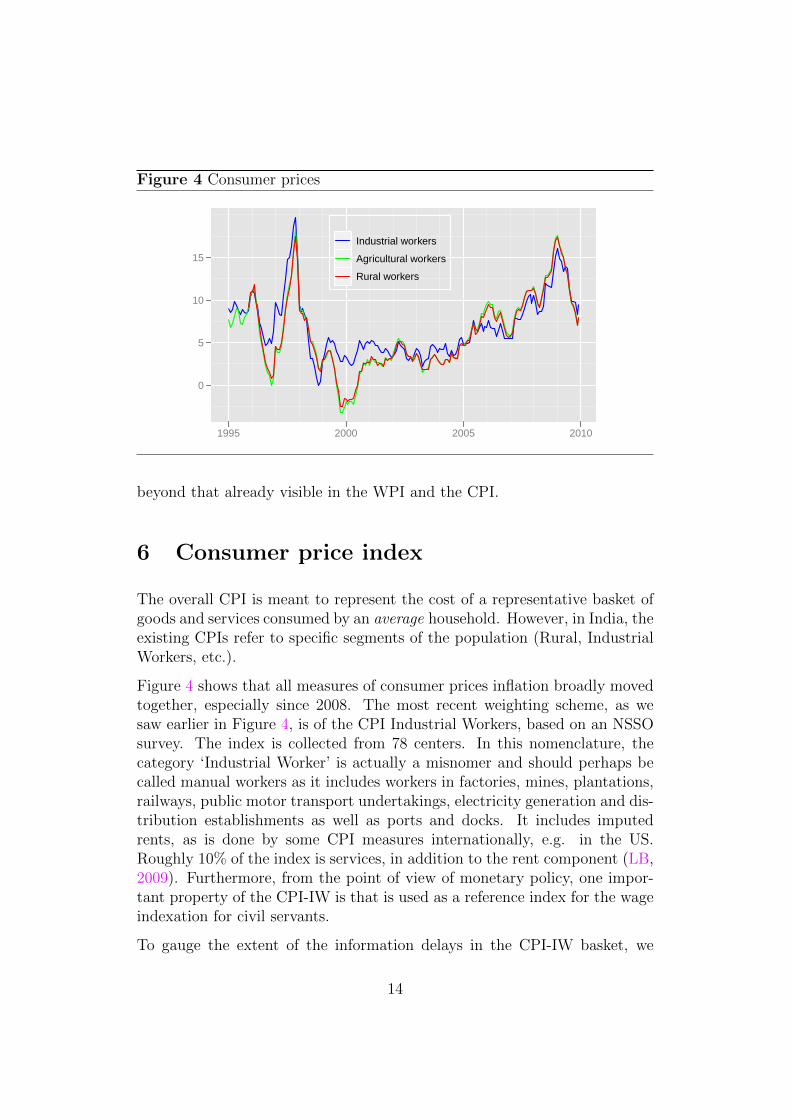
Figure 4 Consumer prices
0
5
10
15
1995 2000 2005 2010
Industrial workers
Agricultural workers
Rural workers
beyond that already visible in the WPI and the CPI.
6 Consumer price index
The overall CPI is meant to represent the cost of a representative basket ofgoods and services consumed by an average household. However, in India, theexisting CPIs refer to specific segments of the population (Rural, IndustrialWorkers, etc.).
Figure 4 shows that all measures of consumer prices inflation broadly movedtogether, especially since 2008. The most recent weighting scheme, as wesaw earlier in Figure 4, is of the CPI Industrial Workers, based on an NSSOsurvey. The index is collected from 78 centers. In this nomenclature, thecategory ‘Industrial Worker’ is actually a misnomer and should perhaps becalled manual workers as it includes workers in factories, mines, plantations,railways, public motor transport undertakings, electricity generation and dis-tribution establishments as well as ports and docks. It includes imputedrents, as is done by some CPI measures internationally, e.g. in the US.Roughly 10% of the index is services, in addition to the rent component (LB,2009). Furthermore, from the point of view of monetary policy, one impor-tant property of the CPI-IW is that is used as a reference index for the wageindexation for civil servants.
To gauge the extent of the information delays in the CPI-IW basket, we
14
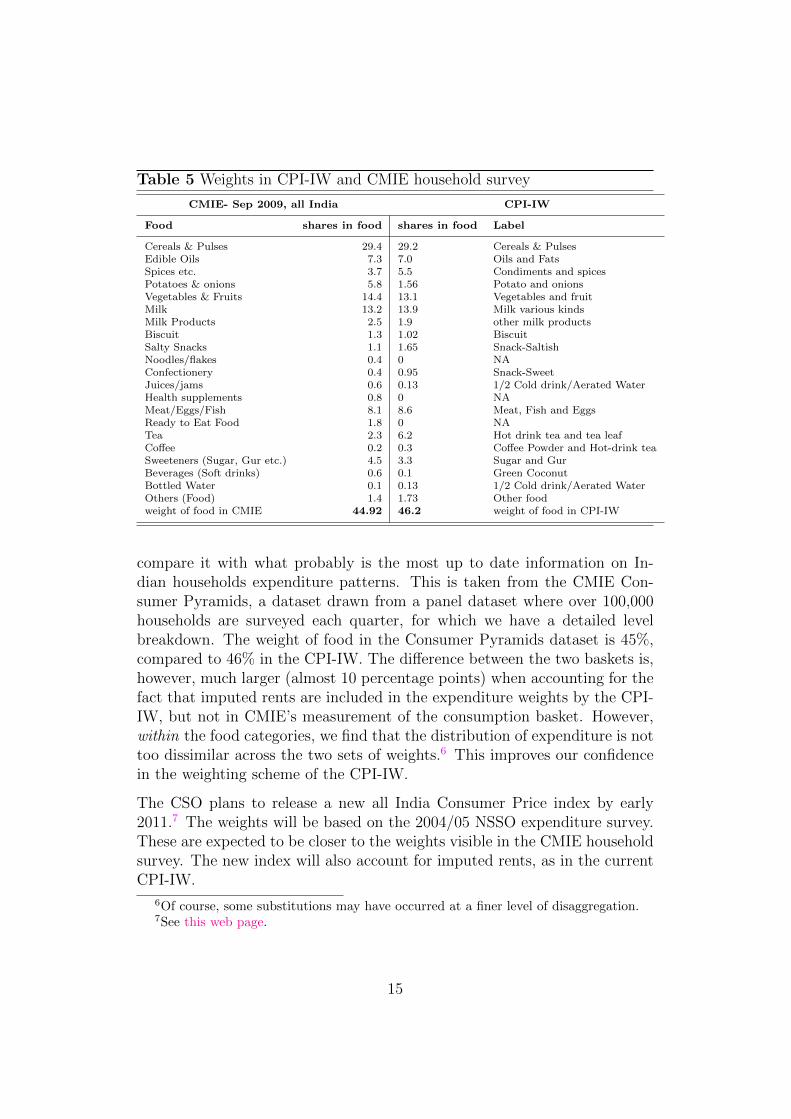
Table 5 Weights in CPI-IW and CMIE household survey
CMIE- Sep 2009, all India CPI-IW
Food shares in food shares in food Label
Cereals & Pulses 29.4 29.2 Cereals & PulsesEdible Oils 7.3 7.0 Oils and FatsSpices etc. 3.7 5.5 Condiments and spicesPotatoes & onions 5.8 1.56 Potato and onionsVegetables & Fruits 14.4 13.1 Vegetables and fruitMilk 13.2 13.9 Milk various kindsMilk Products 2.5 1.9 other milk productsBiscuit 1.3 1.02 BiscuitSalty Snacks 1.1 1.65 Snack-SaltishNoodles/flakes 0.4 0 NAConfectionery 0.4 0.95 Snack-SweetJuices/jams 0.6 0.13 1/2 Cold drink/Aerated WaterHealth supplements 0.8 0 NAMeat/Eggs/Fish 8.1 8.6 Meat, Fish and EggsReady to Eat Food 1.8 0 NATea 2.3 6.2 Hot drink tea and tea leafCoffee 0.2 0.3 Coffee Powder and Hot-drink teaSweeteners (Sugar, Gur etc.) 4.5 3.3 Sugar and GurBeverages (Soft drinks) 0.6 0.1 Green CoconutBottled Water 0.1 0.13 1/2 Cold drink/Aerated WaterOthers (Food) 1.4 1.73 Other foodweight of food in CMIE 44.92 46.2 weight of food in CPI-IW
compare it with what probably is the most up to date information on In-dian households expenditure patterns. This is taken from the CMIE Con-sumer Pyramids, a dataset drawn from a panel dataset where over 100,000households are surveyed each quarter, for which we have a detailed levelbreakdown. The weight of food in the Consumer Pyramids dataset is 45%,compared to 46% in the CPI-IW. The difference between the two baskets is,however, much larger (almost 10 percentage points) when accounting for thefact that imputed rents are included in the expenditure weights by the CPI-IW, but not in CMIE’s measurement of the consumption basket. However,within the food categories, we find that the distribution of expenditure is nottoo dissimilar across the two sets of weights.6 This improves our confidencein the weighting scheme of the CPI-IW.
The CSO plans to release a new all India Consumer Price index by early2011.7 The weights will be based on the 2004/05 NSSO expenditure survey.These are expected to be closer to the weights visible in the CMIE householdsurvey. The new index will also account for imputed rents, as in the currentCPI-IW.
6Of course, some substitutions may have occurred at a finer level of disaggregation.7See this web page.
15
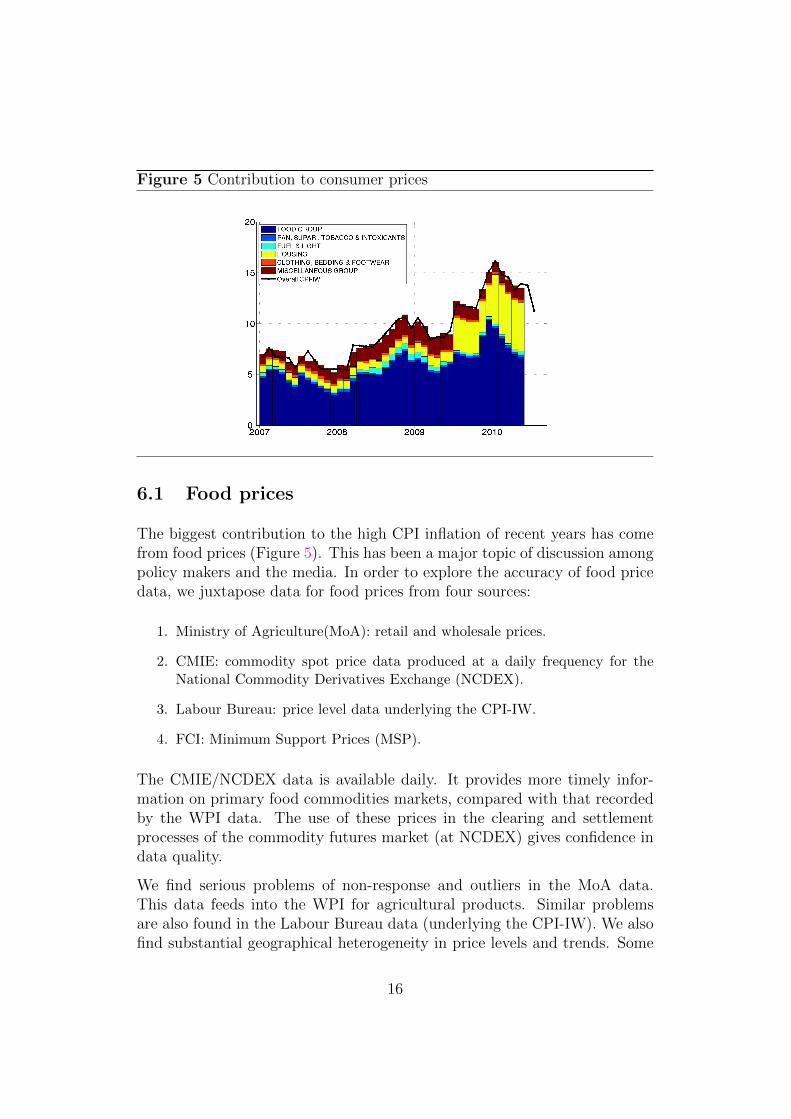
Figure 5 Contribution to consumer prices
6.1 Food prices
The biggest contribution to the high CPI inflation of recent years has comefrom food prices (Figure 5). This has been a major topic of discussion amongpolicy makers and the media. In order to explore the accuracy of food pricedata, we juxtapose data for food prices from four sources:
1. Ministry of Agriculture(MoA): retail and wholesale prices.
2. CMIE: commodity spot price data produced at a daily frequency for theNational Commodity Derivatives Exchange (NCDEX).
3. Labour Bureau: price level data underlying the CPI-IW.
4. FCI: Minimum Support Prices (MSP).
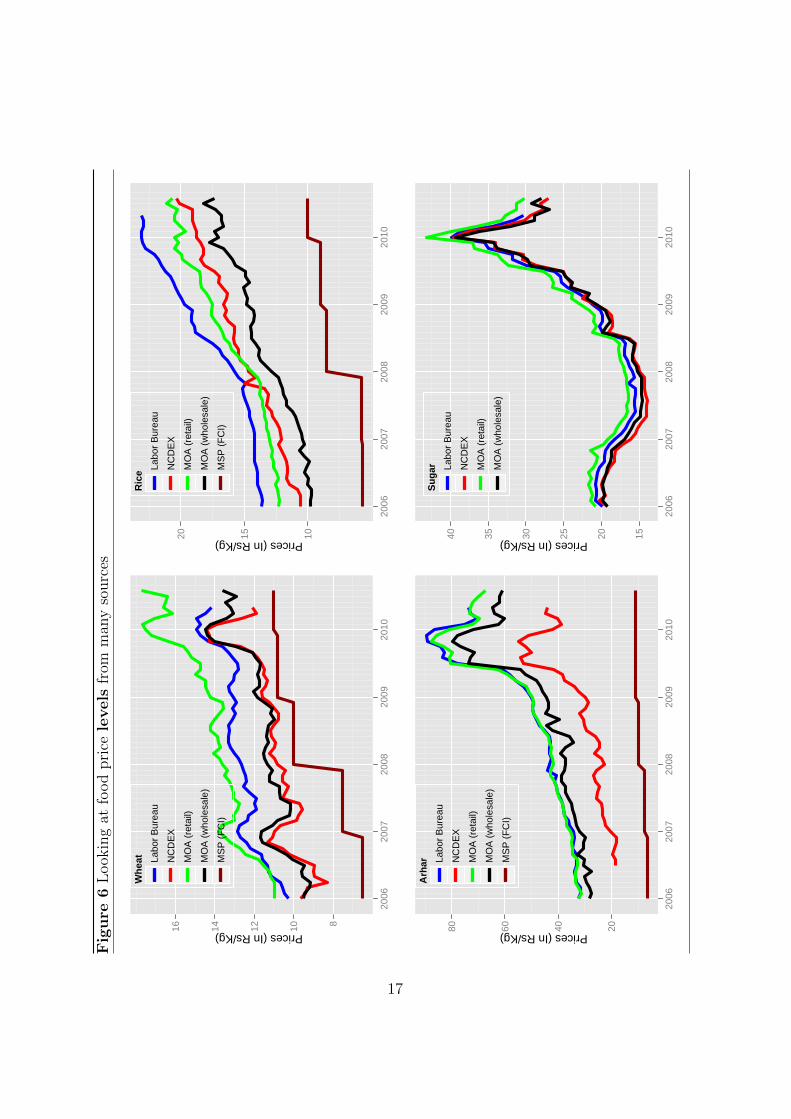
The CMIE/NCDEX data is available daily. It provides more timely infor-mation on primary food commodities markets, compared with that recordedby the WPI data. The use of these prices in the clearing and settlementprocesses of the commodity futures market (at NCDEX) gives confidence indata quality.
We find serious problems of non-response and outliers in the MoA data.This data feeds into the WPI for agricultural products. Similar problemsare also found in the Labour Bureau data (underlying the CPI-IW). We alsofind substantial geographical heterogeneity in price levels and trends. Some
16
Fig
ure
6L
ook
ing
atfo
od
pri
cele
vels
from
man
yso
urc
es
Prices (In Rs/Kg)
810121416
2006
2007
2008
2009
2010
Whe
at Labo
r B
urea
u
NC
DE
X
MO
A (
reta
il)
MO
A (
who
lesa
le)
MS
P (
FC
I)
Prices (In Rs/Kg) 101520
2006
2007
2008
2009
2010
Ric
e
Labo
r B
urea
u
NC
DE
X
MO
A (
reta
il)
MO
A (
who
lesa
le)
MS
P (
FC
I)
Prices (In Rs/Kg) 20406080
2006
2007
2008
2009
2010
Arh
ar
Labo
r B
urea
u
NC
DE
X
MO
A (
reta
il)
MO
A (
who
lesa
le)
MS
P (
FC
I)
Prices (In Rs/Kg) 152025303540
2006
2007
2008
2009
2010
Sug
ar Labo
r B
urea
u
NC
DE
X
MO
A (
reta
il)
MO
A (
who
lesa
le)
17
discrepancies in price levels are also visible across sources, but may relateto issues of product variety. Both the MoA wholesale data, and the LabourBureau retail data comoves with the NCDEX data after we delete outliersand non-responding locations. This suggests that the quality of the foodprice data which is one of the largest components of the CPI is acceptable.
As an aside, it is interesting to note the limited extent to which other pricedata comoves with Minimum Support Prices.
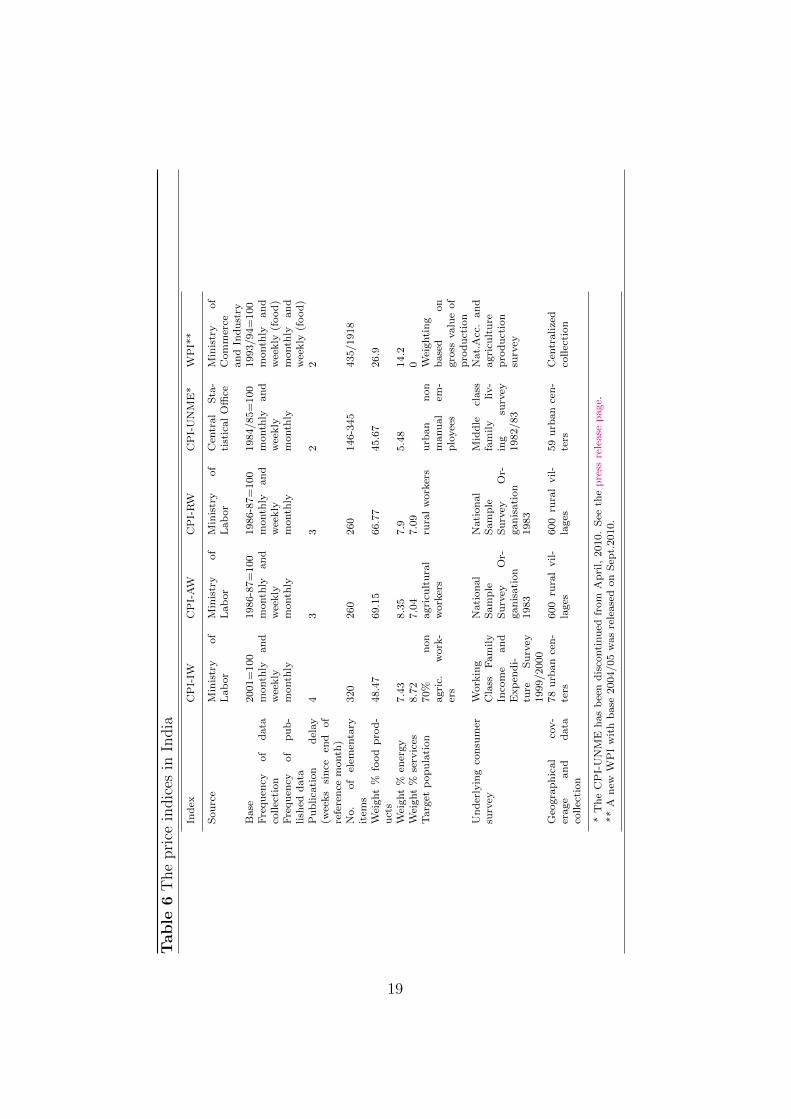
6.2 Base year
Among the consumer price indices in India, the most recent weights are fromCPI-IW, based on an ad-hoc NSSO survey on expenditure patterns in 2001.The other indices, as seen in Table 6, are fairly outdated. Unti August 2010,the WPI which was often used to discuss inflation, had 1993-94 as its baseperiod. Only in August 2010, a new WPI was released with 2004/05 as itsbase period.
6.3 Price of services
While services account for half of Indian GDP, and a large share of house-hold consumption expenditure, there is no price index for output prices inthis sector, neither at the consumer nor at the producer level. The onlyprice series available for some services prices are those that have always beenroutinely collected in the CPI surveys (in particular for the CPI-IW). Thisseries is not published or easily accessible and the data for various servicesprices has not been collated into a single index.8
Since CPI contains an element of services, we examine services price data toassess whether data under this category is meaningful. In this section, wefocus on services prices in the CPI-IW. Do the trends in services prices inthe CPI-IW look reasonable?
Using the publicly available breakdown of the CPI-IW basket into 310 ele-mentary items, we isolate those items which could be regarded as relatingentirely to services prices. We exclude from this group the housing category,which refers to the rents of leased9 apartments and owner occupier hous-
8Following a formal request to the Bureau of Labour, we obtained the price series ofthese items. We thank Director S.S. Negi in Shimla for his kind help.
9For more details, see the OEA (2008)
18
Tab
le6
The
pri
cein
dic
esin
India
Ind
exC
PI-
IWC
PI-
AW
CP
I-R
WC
PI-
UN
ME
*W
PI*
*
Sou
rce
Min
istr
yof
Lab
or
Min
istr
yof
Lab
or
Min
istr
yof
Lab
or
Cen
tral
Sta
-ti
stic
al
Offi
ceM
inis
try
of
Com
mer
cean
dIn
du
stry
Base
2001=
100
1986-8
7=
100
1986-8
7=
100
1984/85=
100
1993/94=
100
Fre
qu
ency
of
data
collec
tion
month
lyan
dw
eekly
month
lyan
dw
eekly
month
lyan
dw
eekly
month
lyan
dw
eekly
month
lyan
dw
eekly
(food
)F
requ
ency
of
pu
b-
lish
edd
ata
month
lym
onth
lym
onth
lym
onth
lym
onth
lyan
dw
eekly
(food
)P
ub
lica
tion
del
ay
(wee
ks
sin
ceen
dof
refe
ren
cem
onth
)
43
32
2
No.
of
elem
enta
ryit
ems
320
260
260
146-3
45
435/1918
Wei
ght
%fo
od
pro
d-
uct
s48.4
769.1
566.7
745.6
726.9
Wei
ght
%en
ergy
7.4
38.3
57.9
5.4
814.2
Wei
ght
%se
rvic
es8.7
27.0
47.0
90
Targ
etp
op
ula
tion
70%
non
agri
c.w
ork
-er
s
agri
cult
ura
lw
ork
ers
rura
lw
ork
ers
urb
an
non
manu
al
em-
plo
yee
s
Wei
ghti
ng
base
don
gro
ssvalu
eof
pro
du
ctio
nU
nd
erly
ing
con
sum
ersu
rvey
Work
ing
Cla
ssF
am
ily
Inco
me
an
dE
xp
end
i-tu
reS
urv
ey1999/2000
Nati
on
al
Sam
ple
Su
rvey
Or-
gan
isati
on
1983
Nati
on
al
Sam
ple
Su
rvey
Or-
gan
isati
on
1983
Mid
dle
class
fam
ily
liv-
ing
surv
ey1982/83
Nat.
Acc
.an
dagri
cult
ure
pro
du
ctio
nsu
rvey
Geo
gra
ph
ical
cov-
erage
an
dd
ata
collec
tion
78
urb
an
cen
-te
rs600
rura
lvil-
lages
600
rura
lvil-
lages
59
urb
an
cen
-te
rsC
entr
alize
dco
llec
tion
*T
he
CP
I-U
NM
Eh
as
bee
nd
isco
nti
nu
edfr
om
Ap
ril,
2010.
See
the
pre
ssre
lease
page.
**
An
ewW
PI
wit
hb
ase
2004/05
was
rele
ase
don
Sep
t.2010.
19
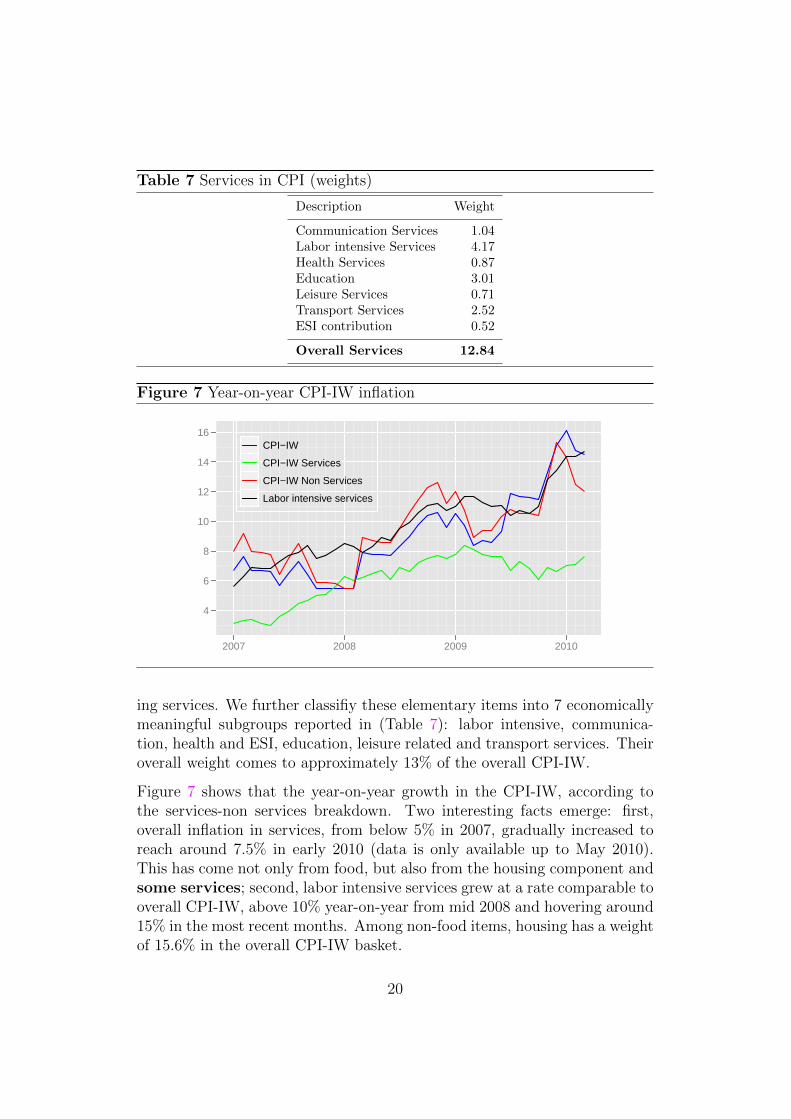
Table 7 Services in CPI (weights)
Description Weight
Communication Services 1.04Labor intensive Services 4.17Health Services 0.87Education 3.01Leisure Services 0.71Transport Services 2.52ESI contribution 0.52
Overall Services 12.84
Figure 7 Year-on-year CPI-IW inflation
4
6
8
10
12
14
16
2007 2008 2009 2010
CPI−IW
CPI−IW Services
CPI−IW Non Services
Labor intensive services
ing services. We further classifiy these elementary items into 7 economicallymeaningful subgroups reported in (Table 7): labor intensive, communica-tion, health and ESI, education, leisure related and transport services. Theiroverall weight comes to approximately 13% of the overall CPI-IW.
Figure 7 shows that the year-on-year growth in the CPI-IW, according tothe services-non services breakdown. Two interesting facts emerge: first,overall inflation in services, from below 5% in 2007, gradually increased toreach around 7.5% in early 2010 (data is only available up to May 2010).This has come not only from food, but also from the housing component andsome services; second, labor intensive services grew at a rate comparable tooverall CPI-IW, above 10% year-on-year from mid 2008 and hovering around15% in the most recent months. Among non-food items, housing has a weightof 15.6% in the overall CPI-IW basket.
20
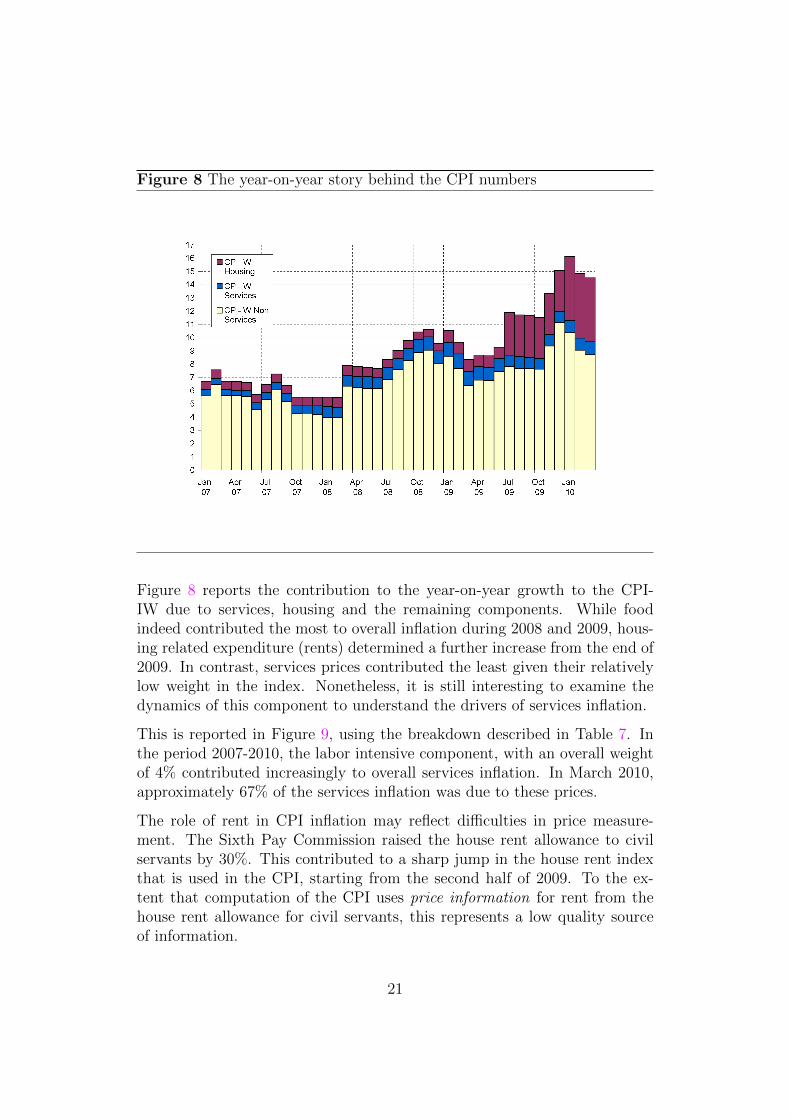
Figure 8 The year-on-year story behind the CPI numbers
Figure 8 reports the contribution to the year-on-year growth to the CPI-IW due to services, housing and the remaining components. While foodindeed contributed the most to overall inflation during 2008 and 2009, hous-ing related expenditure (rents) determined a further increase from the end of2009. In contrast, services prices contributed the least given their relativelylow weight in the index. Nonetheless, it is still interesting to examine thedynamics of this component to understand the drivers of services inflation.
This is reported in Figure 9, using the breakdown described in Table 7. Inthe period 2007-2010, the labor intensive component, with an overall weightof 4% contributed increasingly to overall services inflation. In March 2010,approximately 67% of the services inflation was due to these prices.
The role of rent in CPI inflation may reflect difficulties in price measure-ment. The Sixth Pay Commission raised the house rent allowance to civilservants by 30%. This contributed to a sharp jump in the house rent indexthat is used in the CPI, starting from the second half of 2009. To the ex-tent that computation of the CPI uses price information for rent from thehouse rent allowance for civil servants, this represents a low quality sourceof information.
21
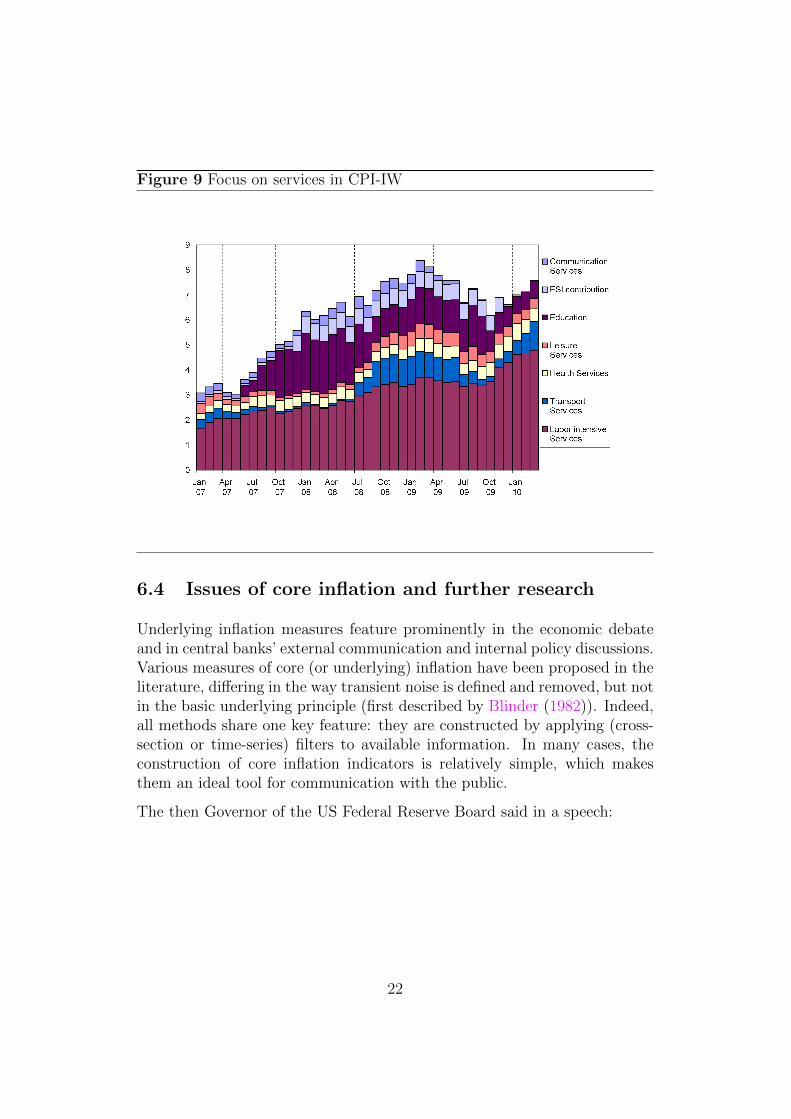
Figure 9 Focus on services in CPI-IW
6.4 Issues of core inflation and further research
Underlying inflation measures feature prominently in the economic debateand in central banks’ external communication and internal policy discussions.Various measures of core (or underlying) inflation have been proposed in theliterature, differing in the way transient noise is defined and removed, but notin the basic underlying principle (first described by Blinder (1982)). Indeed,all methods share one key feature: they are constructed by applying (cross-section or time-series) filters to available information. In many cases, theconstruction of core inflation indicators is relatively simple, which makesthem an ideal tool for communication with the public.
The then Governor of the US Federal Reserve Board said in a speech:
22
“In discussing and thinking about the conduct of monetarypolicy, many central bankers focus on core inflation —that is,a measure of inflation that excludes the rate of increase of prices forcertain volatile components in price indexes. The Federal Reserve, forexample, pays particular attention to the rate of growth of the corepersonal consumption expenditure (PCE) deflator, which excludesfood and energy prices.”
– Mishkin (2007)
Central banks differ in their use of total CPI or some measure of core CPI astheir official target. By downplaying temporary fluctuations in food pricesand energy prices, as well as other one-off changes (from administered pricesor VAT), the central bank can convey better the developments in underlyinginflation. In the last year, unlike in previous episodes of high inflation, theReserve Bank of India has increasingly referred to the dynamics of the WPIexcluding energy and food to signal price pressures becoming more broadlybased.
Whether existing core inflation indicators should play a role in the monetarypolicy decision-making process —whether they would prove valuable in thatcontext— has not been subjected to systematic theoretical scrutiny. An ex-ception is Aoki (2001), who first provided a normative argument in supportof the construction and use of core inflation indicators, using a New Key-nesian model.10 Aoki (2001) shows that, in an economy where the degreeof price stickiness differs from sector to sector, the central bank should aimat stabilizing inflation in sectors where prices are stickier. Indeed, availablemicroeconomic evidence on sectoral price rigidity for both the euro area andthe US Dhyne et al. (2006); Nakamura and Steinssonn (2008) shows thatconsumer prices tend to be more flexible precisely in the energy and foodsectors, thereby providing empirical support for targeting a measure of coreinflation which excludes the latter prices. The items to be included are thentypically services prices or wages Mankiw and Reis (2007).
Building on these findings, S. Eusepi and Tambalotti (2009) use a calibratedDSGE model of the US economy to construct a personal consumption ex-penditured based price index, with weights chosen to minimize the welfarecosts of nominal distortions arising from heterogeneity in price rigidity across
10Benigno and Woodford (2005) extends Aoki (2001) results to a multiple country set-ting.
23
sectors.
However, the focus of these theoretical results on core inflation has gen-erally been on developed economies. One major concern over extendingthese results to emerging economies lies in the relevant weight of food inthe households consumption basket. Addressing this concern, Anand andPrasad (2010) reverse the key result of Aoki (2001) by showing that in aneconomy populated by credit constrained households and with a low price andincome elasticities of food, the Central Bank should not ignore fluctuationsin food prices. The latter are to be accounted for when setting interest rates,since agents may factor in food price inflation when formulating their strat-egy on the labour market, thereby determining second-round effects throughthe expectations channel.
Based on empirical results, recent research on China by Zhang and Law(2010) suggests that surging food prices may call for policy reactions evenif non-food-price inflation is tame. The authors present evidence suggestingthat while food-price inflation may have pushed up inflation expectations, itfailed to generate significant second-round effects on non-food-price inflation,because of the lack of workers bargaining power.
7 Conclusion
In recent years, India has experienced a remarkable surge in CPI-IW inflation.In this paper, we have argued that CPI-IW should take center stage amongthe existing measures of inflation in India as the headline inflation rate. Thearguments of this paper are likely to be amplified with the improvementsunveiled in the new CPI of February 2011.
The CPI reflects the consumption bundle of households, and is thus more rel-evant than any other measure of inflation. Second, the CPI-IW also refectsprices of food as accurately as other measures. Third, CPI-IW includes theprice of services that are not included in any other measure of inflation. Fur-ther, the WPI or the PPI largely reflect global prices of tradeables expressedin rupees. Monetary policy of the RBI has a minimal role in influencingthese, other than through the exchange rate. On the contrary, the consumerprice index has a large share of non-tradables. Monetary policy of the RBIhas a much bigger role to pay in influcencing domestic non-tradable prices.
Indian macroeconomic analysis and policy thinking thus needs to move awayfrom a focus on the WPI to the CPI-IW.
24
References
Anand R, Prasad ES (2010). “Optimal Price Indices for Targeting Infla-tion under Incomplete Markets.” (16290). URL http://www.nber.org/
papers/w16290.
Aoki K (2001). “Optimal Monetary Policy Responses to Relative PriceChanges.” Journal of Monetary Economics, 48(3), 55–80.
Benigno P, Woodford M (2005). “Inflation Stabilization and Welfare: TheCase of a Distorted Steady State.” Journal of the European EconomicAssociation, 3(6), 1185–1236.
Blinder AS (1982). “Inventories and Sticky Prices: More on the Micro-foundations of Macroeconomics.” The American Economic Review, 72(3),334–348.
Chang R, Catao L (2010). “World Food Prices and Monetary Policy.”(16563).
CSO (2008). Manual on Index of Industrial Production (IIP). URL www.
mospi.gov.in/manual_iip_23oct08.pdf.
Dhyne E, Alvarez LJ, Bihan HL, Veronese G, Dias D, Hoffmann J, JonkerN, Lunnemann P, Rumler F, Vilmunen J (2006). “Price Changes in theEuro Area and the United States: Some Facts from Individual ConsumerPrice Data.” Journal of Economic Perspectives, 20(2), 171–192.
LB (2009). “Report of the Index Review Committee.” Technical report,Labor Bureau, New Delhi. URL http://labourbureau.nic.in/Index_
RevComRep_082009.pdf.
Mankiw NG, Reis R (2007). “Sticky Information in General Equilibrium.”Journal of the European Economic Association, 5(2-3), 603–613. URLhttp://ideas.repec.org/a/tpr/jeurec/v5y2007i2-3p603-613.html.
Mishkin FS (2007). “Headline versus Core Inflation in the Conductof Monetary Policy, At the Business Cycles, International Transmis-sion and Macroeconomic Policies Conference, HEC Montreal, Montreal,Canada.” URL http://www.federalreserve.gov/newsevents/speech/
mishkin20071020a.htm.
Mohanty D (2010). “Measures of inflation - issues and perspectives.” URLhttp://www.bis.org/review/r100125f.pdf?noframes=1.
Nadhanael GV, Pattnaik S (2010). “Measurement of Inflation in India: Issues
25
and associated challenges for the conduct of monetary policy.” In “RBIStaff Papers,” Reserve Bank of India.
Nakamura E, Steinssonn J (2008). “Five Facts About Prices: A Reevaluationof Menu Cost Models.” Quarterly Journal of Economics, 123(4), 1415–1464.
OEA MoC (2008). Manual on compilation of index numbers of Wholesaleprices in India. URL http://eaindustry.nic.in/manual_out.htm.
OEA-DIPP (2008). “Technical Report of the working group, revision ofIndex numbers of wholesale prices in India from the base -94 to 2004-05.”Technical report, Office of the Economic Adviser, Department of IndustrialPolicy and Promotion, Ministry of Commerce and Industry, New Delhi.
RBI (2009-10). “Annual Report.” Technical report, Reserve Bank of India,Mumbai.
S Eusepi BH, Tambalotti A (2009). “CONDI: A Cost-of-Nominal-DistortionsIndex.” In “Staff Papers,” 367. Federal Reserve Bank of New York.
Subbarao D (2010a). “Financial Crisis - Some Old Questions and MaybeSome New Answers, Tenth C.D. Deshmukh Memorial Lecture deliv-ered at Council for Social Development, Southern Regional Centre, Hy-derabad.” URL http://www.rbi.org.in/scripts/BS_SpeechesView.
aspx?Id=515.
Subbarao D (2010b). “India and the global financial crisis transcendingfrom recovery to growth, at the Peterson Institute for International Eco-nomics, Washington DC.” URL http://www.rbi.org.in/scripts/BS_
SpeechesView.aspx?Id=502.
Zhang W, Law D (2010). “What drives China’s food-price inflation and howdoes it affect the aggregate inflation?” HKMA working paper, Hong KongMonetary Authority.
26
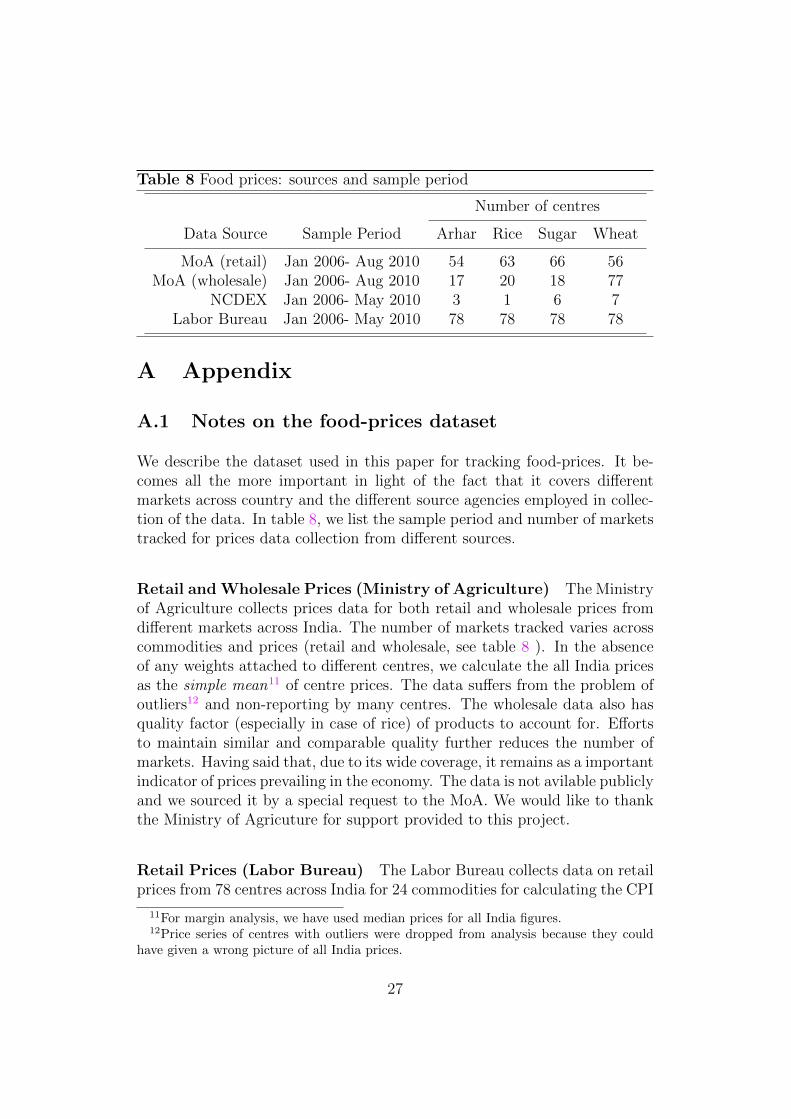
Table 8 Food prices: sources and sample period
Number of centres
Data Source Sample Period Arhar Rice Sugar Wheat
MoA (retail) Jan 2006- Aug 2010 54 63 66 56MoA (wholesale) Jan 2006- Aug 2010 17 20 18 77
NCDEX Jan 2006- May 2010 3 1 6 7Labor Bureau Jan 2006- May 2010 78 78 78 78
A Appendix
A.1 Notes on the food-prices dataset
We describe the dataset used in this paper for tracking food-prices. It be-comes all the more important in light of the fact that it covers differentmarkets across country and the different source agencies employed in collec-tion of the data. In table 8, we list the sample period and number of marketstracked for prices data collection from different sources.
Retail and Wholesale Prices (Ministry of Agriculture) The Ministryof Agriculture collects prices data for both retail and wholesale prices fromdifferent markets across India. The number of markets tracked varies acrosscommodities and prices (retail and wholesale, see table 8 ). In the absenceof any weights attached to different centres, we calculate the all India pricesas the simple mean11 of centre prices. The data suffers from the problem ofoutliers12 and non-reporting by many centres. The wholesale data also hasquality factor (especially in case of rice) of products to account for. Effortsto maintain similar and comparable quality further reduces the number ofmarkets. Having said that, due to its wide coverage, it remains as a importantindicator of prices prevailing in the economy. The data is not avilable publiclyand we sourced it by a special request to the MoA. We would like to thankthe Ministry of Agricuture for support provided to this project.
Retail Prices (Labor Bureau) The Labor Bureau collects data on retailprices from 78 centres across India for 24 commodities for calculating the CPI
11For margin analysis, we have used median prices for all India figures.12Price series of centres with outliers were dropped from analysis because they could
have given a wrong picture of all India prices.
27
(IW). All India prices are calculated as the weighted average of the centreprices, weights being centre weights used to calculate the CPI (IW) prices.The level of non-reporting and outliers in the data is lesser than MoA data,but is persistent in places from North-East and Kashmir. Another featureto note for is the price-stickiness observed at centeres at West Bengal andadjoining states. This data is available in public domain (See page).
NCDEX prices (CMIE) CMIE collects data on commodity spot pricesproduced at a weekly frequency by conducting spot market surveys of theNational Commodity Derivatives Exchange (NCDEX) mandis. We classifythis data in the wholesale category because it is sourced from mandis whoseprices go into the derivatives pricing of agricultural products. It covers alimited set of markets across India and the all India prices are the simpleaverage of the mandi prices. The issue of non-reporting is negligible in thisdata. This is a classified information and is not available publicly. We thankCMIE for providing us access to the data.
28