how to easily make money day or swing trading stocks onlinewealthv.com/articles/pdfs/how to easily...
TRANSCRIPT
How to Easily Make Money Day or Swing
Trading Stocks Online Hanging on to it is the hard part
08/28/05 A Comprehensive Guide to Day and Swing Trading Online
Introduction About the guy writing this book
I have been trading stocks off and on since 1994. Back then I was clueless.
Ah, I can remember it well. I thought trading was all about buying a well
known company then hoping the price would rise higher than what you paid
for it. Well, I was partly right. We want the price to rise, but hoping aint
gonna cut it. I called my “discount” broker, told him to buy “X” amount of
shares of GE. I paid my $35.00 commission then waited, and waited, and
waited for the price to rise. I finally sold, and after paying another $35.00
commission I think I just about broke even. Then came the dotcom boom
which I entered right before the crash. What impeccable timing I have. Can
you say Etoys? I bought a number of shares through that same broker, again
paid my $35.00 commission, only to watch my investment crash and burn. I
lost a lot on that one. In 2001 I lost my job as an IT professional due to
downsizing. I thought to myself, “now what do I do?” No one was hiring in
my area at the time. IT jobs were far and few between. I got it…DAY
TRADING!! Yeah, that was the ticket. Heck I saw all those guys on TV
making millions. Yeah that’s it! I got all setup to trade online. Fast
Computer, DSL connection, a trading platform, online broker…all systems go.

“I can guarantee with confidence the following: reduced risk and higher profits. That’s what it’s all about, isn’t it?”
Keep these things in mind when trading:
• There is no “Holy Grail”.
• The Market is 10% mechanics, and 90% Psychology.
Fear and Greed rule the Market
I immediately bought a well known company (you will never guess which
one…yes GE again) then waited and waited and waited for the price to rise. It
did. Hallelujah!!! I sold, netted my profit, paid my commission which at
$10.99 X 2 sure beat the discount broker. The good news was that I netted a
whopping $94.00. I was really proud of myself. The bad news was that it
took almost 2 weeks. That means I was making $47.00 a week. Not good. I
needed to do better. There had to be a way. I then went on a quest to find
“The Holy Grail.” I scanned hundreds of websites; read a ton of books all
promising the road to riches. Some were good some were not so good. I
tried and tested just about every system out there. There are black boxes,
red and green blinking lights, you name it. Bottom Line? There is no “Holy
Grail.” I do not guarantee an easy road to wealth and riches in this book. No
one can guarantee that. I can guarantee with confidence the following:
• reduced risk
• higher profits
That’s what it’s all about, isn’t it? I possess a B A degree in Psychology. I can
honestly tell you that trading stocks is 10% mechanics and 90% psychology.
Fear and Greed rule the Market. It’s easy to make money trading; the hard
part is not giving it all back. The one question that is asked over and over is
….”if the system is so good, why doesn’t the author just make all of his money
day trading, why go though all the trouble of writing a book?” The answer is
easy. I have developed a skill. One which I am willing to share. Am I that
altruistic? You bet I am. I don’t like seeing traders make costly mistakes.
Been there done that. I have read countless postings on message boards
where the traders had no idea what they were doing. I have helped many of
them for free. I also however, don’t mind the extra $$ in my pocket. The
Market can be volatile and therefore I do not trade every day. Having another
source of income to supplement my trading account is just fine by me.
Let’s decipher The title of this book “How to Make Money Day or Swing
Trading Stocks Online”, “Hanging on to it is the hard part”. Is making money
trading stocks easy? Well, yes and no. You must have a trading plan, and
follow it religiously. You have probably read this many times…ad
nuaseum…”Plan your trade, trade your plan” (I have other clichés’ peppered
throughout this book, please find a way to forgive me) There are rules which
must be followed. Are they all written in stone? No. Can they be bent here
and there? Yes. Are there some rules that must always be adhered to? Yes.
If you follow the rules, have discipline and patience I guarantee that you will
make money. Guarantee? Yes. How can I guarantee anything? I can,
because I did it and am still doing it. If I can do it, anyone can. (oops another
cliché). I will be the first to tell you that I am no Stock Market or trading
guru. I just follow the rules laid out in this book. They work. Now let’s talk
about the sub title. “Hanging on to it is the hard part”. This is where the
difficulty of trading comes into play. You follow the rules, plan your trade,
trade your plan, you make your profit. Then what? You let it all slip away.
Why? Because you got greedy. This is the traders Achilles’ heel. Overcoming
greed my friend is the hard part. Too many traders initially make nice profits
only to lose everything due to greed. The trading system you are about to
learn will enable you to overcome this greed, and hang on to your profits. You
must however adhere to the rules. Do I cover all there is to cover regarding
trading? No. Why not? This book would be umpteen billion pages long if I
did. Then what would happen? You would get all excited, read about ¼ of it,
put it down and it would start collecting dust somewhere in your “My
Documents” folder. I am going to cover all the pertinent aspects of my
trading system. You the reader will need to do plenty of homework on your

I want you to write down the following: “My Goal is to Reduce Risk, Maximize Profits, and to Protect My Capital at All Times.”
own. You will also need to practice, practice. practice. How do you get to
Carnegie Hall? (another cliché , sorry, well I am not really sorry). I will do my
part, but I expect you to do your part. This book is unlike any other you have
read. I try to make it interesting as well as fun and entertaining. Learning
something new can be frustrating and tiresome. Stay with me, and you will
be a 90% better trader than you are now. Trust me on this.
What the Heck is Day Trading Anyway?
Day Trading involves buying large amount of shares of a given stock (200-
whateverucanafford) and holding for seconds, minutes, hours. (When I day
trade a stock, I usually hold the stock the entire day or until my sell signals
tell me to exit. I don’t like the quick in and out momentum plays since they
inherently contain too much risk for my style of trading.) The trade is entered
and exited the same day. We will not be discussing holding for seconds which
is also known as scalping. Scalping is neither for the weak of heart nor for the
less experienced trader. So you newbie’s out there, ….don’t even think about
it. I know of one scalper who consistently makes at least 1K a day trading
10,000 shares of CSCO (both long and short) for a .10 profit. Again, this is
something for the experienced trader and I do not recommend due to the
risks involved. My system also works for swing trading which is holding a
given stock for a few days up to a few weeks. The profit potential is greater
with swing trading but so is the risk. (Who knows what will happen tomorrow?
If oil hits $80 a barrel, or your stock gets downgraded, your trade could be
sunk) With day trading, profit potential is lower, but the risk is lower as well
since you do not have to worry about waking up to bad news the next day.
What will the student get out of this book?
I want you to write down the following:

• My Goal is to Reduce Risk, Maximize Profits, and to Protect My
Capital at All Times.
If you walk away with anything from this book, I want it to at least be this
goal. Now hang it on your mirror, keep it in your pocket or wherever, just
make sure that you look at it several times a day. Always write down your
goals; it works. “Why does it work?” You ask. It works because your
subconscious mind rules your conscious mind. Huh? Are we trying to achieve
Zen here? No not really. Think of it this way; your subconscious mind is
constantly working away, sorting through all the stimuli with which you
interact during your waking hours. It’s always turned on, even when you are
asleep. Who do you think makes up those goofy dreams? The subconscious
mind directly affects the conscious mind. When you write down a goal, you
are more or less sending it via FedEx to the subconscious mind. The
subconscious then leads the conscious to achieve that goal. It’s multitasking
in the background, while you are doing other things. It will point the
conscious mind in the right direction and cause you to do things to achieve
that particular goal. My Mother wanted to buy a second hand car. She looked
and looked for what she wanted but ran into one disappointment after
another. She then wrote down what she wanted; the exact make model year
and color. Within a few weeks Walla!; she found exactly what she was looking
for. Sort of spooky isn’t it? Trust me, it works.
What will the author get out of this book? (besides money)
My goal is to exceed the reader’s expectations, by providing a new, more
powerful way to approach trading. I am looking forward to the thousands of
fan letters I hope to be receiving after you guys improve your trading skills
and start making big $$. If you follow what I lay out in this book to the letter

and control your emotions while trading, you will make money.
Summary
What have we learned so far? Let’s look at a play by play. The author
couldn’t trade his way out of a hat. Sometime in 2001 after he lost his IT job,
he made $97.00 trading GE. Fed up with his lousy trading skills, he went on a
quest to find the “Holy Grail”. He found no “Holy Grail”, and states he cannot
guarantee an easy road to wealth and riches by using his system; although he
will guarantee less risk and more profits. He stated that Fear and Greed rule
the Market and that the Market is 10% mechanics and 90% Psychology. He
said he knows this because he has a B.A. in psychology. He says he is
altruistic. (personally I don’t believe that he is) Then he defined Day Trading
(whoopee like I didn’t know what it meant). He told the newbie’s not to scalp;
then went on to tell about a guy that makes $1,000 a day doing the exact
thing he just told them not to do. He made us write down a goal stating that
we “will reduce risk, maximize profits and protect our capital at all times”, and
then told us to stick it on our mirror. Then he started to rant on about this
conscious vs. unconscious err I mean subconscious minds thing. His mom
bought a car, and he wants to exceed our expectations and improve our
trading skills with some powerful new method and expects fan letters. Close
enough? Oh, he also said something about FedEx but I forgot what it was.
Some Really Important Stuff
Trading capital, hardware, internet connection, online broker, trading platform
Ready, Set, Go! Not so fast there pardners. We need to setup a check list
first. The following are a must:
At least 10K to 20K of trading capital which does not include the

mortgage payment or little Johnny’s future tuition.
A reliable computer with a fast processor and enough memory to easily
handle multi-tasking. Have a backup PC in place if possible.
2 to 3 monitors (you can get by with 1 but will need to due a lot of
flipping through screens)
A high speed Internet connection (DSL, Cable)
An online broker
Trading platform
A trading account of at least 10K to 20K is recommended for day/swing
trading since the concept involves purchasing a large number of shares of a
given stock for a limited period of time (seconds, minutes, hours, days,
weeks,). You can get by with fewer than 10K (I did) but trading will be a
challenge unless you use margin. Margin will double your buying power. It
has its upside as well as its downside. Note: I do not recommend the use of
margin for new traders.
You will need a fast reliable computer which will handle multitasking. At this
writing, a fast Pentium P4 w hyper-threading processor with at least 512 megs
of memory will suffice. I personally recommend 1 gig of memory. You do not
want to be in a trade with a 20% profit going only to have your computer lock
up when you are trying to sell. It’s not a bad idea to have a back up system
in place either. If you do get stuck, most online brokers have phone support,
so you still will be able to sell, albeit not as quickly.
You should have at least 2 monitors in your setup, since you will be looking at
many charts, Level II, news items, throughout the day, not to mention trade
execution.
A high speed internet connection such as DSL or Cable is a must. I personally

“Real time charting is an absolute must!”
use DSL and have found it fast and reliable. You can get by with dial up (56K)
but I don’t advise it. Again, when exiting a trade for profit, speed is of the
essence. You don’t want a slow unreliable internet connection. It could cost
you big $$.
There are plenty of online brokers to choose from. Most offer competitive
pricing and tools such as real time charting, Level II screen, etc. I personally
use Ameritrade. www.ameritrade.com They have quick reliable phone support
in case you experience a problem. All trades are $10.99 including limit
orders. You will be using limit orders which I will cover later. There are
plenty of good brokers out there so do some shopping around. The Market is
getting competitive so commission prices are coming down.
Last but not least is a trading platform from which you will do most of your
transactions. It is comprised of real time intraday charts, Level II screen,
stock portfolios, and watch lists. The existing data feed provided by your
online broker will hook into it. Some online brokers provide these tools at no
cost, some do not. I use Medved Quotetracker www.quotetracker.com. The
free beta version provides real time charting for up to 2 days. Real time
charting is an absolute must! The registered version which is $60.00 per
year (a great value) has real time charting for up to 10 days. Their technical
support is top notch with lightning fast response time. One time I emailed a
problem at 2:00AM and received a response within minutes from Jerry Medved
himself.
Summary
We discussed the tangible things needed to day/swing trade. Trading capital,
hardware, high speed internet connection, online broker, trading platform etc.
10K to 20K trading capital is preferred. The use of margin is frowned upon by
the author esp. for new traders. Do not trade with the rent money. Real time

“Your goal is to have a list of no more than 10 stocks that you know inside and out. You want movers. Stocks that move a point or more every day provide great trading opportunities. You will be trading these same stocks over and over.”
charting is a must.
Thar’s Gold in Them Thar Hills!! NASDAQ Index, stock screening
What do we do next? Let’s see if we can mine some of that gold. GOLD!
GOLD I say!! (What is he talking about? Has he lost his mind?) I am talking
about stocks, yes STOCKS! The modern day goldmine with plenty of gold for
the taking….that is if you know how to safely mine the gold. (profit) How do
we get there from here? First we must find the mine. We need a map.
Anyone have a map? Wait I do right here. Let’s see now…ummmm. It says
the gold mine is named NASDAQ. Yes that’s it, I heard all about that place.
The gold flies fast and furious out of there. OK we found the mine, now where
is the gold? Let’s look inside the mine, there is gold lying all about just
waiting for the taking. There is pure gold, and not so pure gold. We need to
find the purist gold possible. The following is our criteria:
Longs:
Stock price = or > $10.00
Volume = or > 1M (500K min)
Index = NASDAQ or COMP
Beta = or > 1.5
Shorts:
Stock price = or > $20.00
Volume = or > 1M (500K min)
Index = NASDAQ or COMP
Beta = or > 1.5

Now that we have our criteria, how do we find the stock candidates? One
word…stockscreener, or is that 2 words? Yes it is 2 words. Errr sorry.
There are lots of stock screeners out there both technical and fundamental.
Some are free, some are expensive. Free is good. I prefer free. Ameritrade
provides a program called Advanced Analyzer free of charge for active traders.
It has a built in stock screener which provides screens for just about every
any scenario you can think of. Another good screener is Vector Vest’s Pro
Trader www.vectorvest.com It is a little on the pricey side but good
nonetheless. Another is www.stockfetcher.com. It has a small monthly fee.
CNBC provides a good fundamental technical screener.
http://moneycentral.msn.com/content/Investing/Findhotstocks/P38816.asp
You will need to find the one that is best suited for you so you will need to do
some experimenting. Your goal is to have a list of no more than 10 stocks
that you know inside and out both technically as well as fundamentally.
Ideally, they should be from the same sector/industry. This will make it
easier to keep up with the news and earnings. Also, you want movers.
Stocks that move a point or more every day provide great trading
opportunities. You will be trading these same stocks over and over. That’s
not to say you can’t trade other stocks, but it’s good to have a core of stocks
that you a very familiar with. I have traded Varian Semiconductor (VSEA)
over and over for about 3 yrs now with only a handful of losses.
How do you know if a stock is a mover? Beta! Volatility is measured by the
beta coefficient. This is the measure of a stocks risk. The beta coefficient
is calculated by dividing a given stock’s historical returns by historical returns
of the stock market. The higher the beta coefficient is, the better because the
volatility of that stock is higher than the Market. A stock with a beta
coefficient of 1.2 will move 20% more than the Market. This is extremely
important because it ensures that the stock which is being traded will provide

the highest possible number of trading opportunities. Daily volume should be
more than 1 million shares (500K min) a day. Stocks trading at this volume
have high liquidity. This ensures us that when we want to sell or buy shares,
there will be buyers and sellers available. We want the stock price to be over
$10.00 per share and under $100.00. Stocks priced under $10.00 don’t
move all that much, and stocks over $100.00 take up a big chunk of capital
to trade and also may have wide swings a la Google. My range is usually
between $10.00 and $80.00. Please, please stay away from penny stocks. I
am sure you heard the story of Uncle Bob who bought Xerox when it was .10
and made a fortune. Those stocks are far and few between. If you want to
gamble with them, you are better off learning how to count cards, then going
to Las Vegas and playing Black Jack. There is a reason they are penny
stocks. It usually means the company is a startup or is not doing very well.
Go check the Yahoo message board for WEL or better yet, check a 3yr chart.
They were contracted under Halliburton to fight the oil fires in Iraq during the
present Iraq war. The stock went from under .50 to around $4.00 or $5.00,
had everyone buzzing and buying. Then it crashed. I think it’s around a
dollar something today after a reverse split. Most penny stocks are pump
and dump schemes. The pumper buys the shares cheap, hypes up the stock,
then sells them to you before the price tops out. So my advice is to stay
away.
Ok, enough of that. We need to find a stock screener. I know..let’s Yahoo.
I think they have a stock screener, and it’s free. Free is good!
Ready??…FIELD TRIP!!
Click on car to go to Yahoo Finance
Are we there yet? Everyone one with us? If you couldn’t make it by car, copy
and Paste the following url into your web browser by going to File/open.
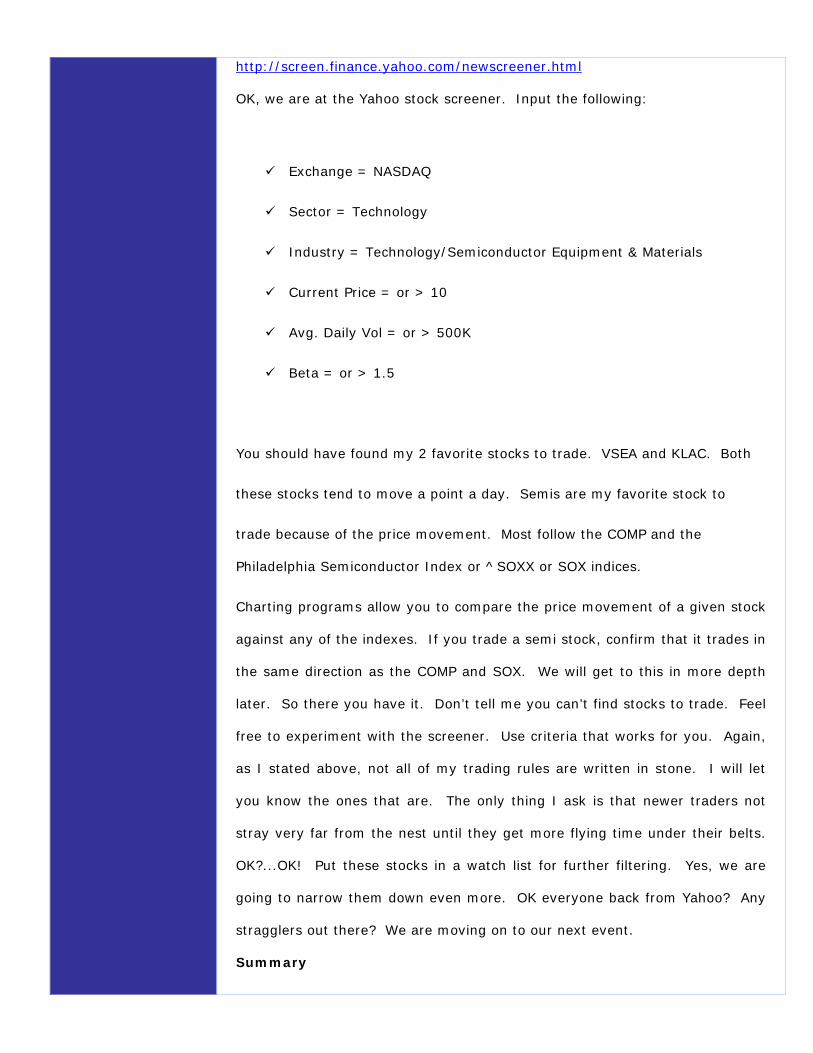
http://screen.finance.yahoo.com/newscreener.html
OK, we are at the Yahoo stock screener. Input the following:
Exchange = NASDAQ
Sector = Technology
Industry = Technology/Semiconductor Equipment & Materials
Current Price = or > 10
Avg. Daily Vol = or > 500K
Beta = or > 1.5
You should have found my 2 favorite stocks to trade. VSEA and KLAC. Both
these stocks tend to move a point a day. Semis are my favorite stock to
trade because of the price movement. Most follow the COMP and the
Philadelphia Semiconductor Index or ^SOXX or SOX indices.
Charting programs allow you to compare the price movement of a given stock
against any of the indexes. If you trade a semi stock, confirm that it trades in
the same direction as the COMP and SOX. We will get to this in more depth
later. So there you have it. Don’t tell me you can’t find stocks to trade. Feel
free to experiment with the screener. Use criteria that works for you. Again,
as I stated above, not all of my trading rules are written in stone. I will let
you know the ones that are. The only thing I ask is that newer traders not
stray very far from the nest until they get more flying time under their belts.
OK?...OK! Put these stocks in a watch list for further filtering. Yes, we are
going to narrow them down even more. OK everyone back from Yahoo? Any
stragglers out there? We are moving on to our next event.
Summary

The NASDAQ is our index of choice. We discussed the criteria required for
stock screening. We want to find stocks that move a lot. (at least a point a
day) The 2 standout variables are beta and volume. We then plugged all the
variables into the Yahoo Finance stock screener and now have a list of
semiconductor stocks that meet our requirement as trading candidates. Most
semiconductor stocks follow the COMP and ^SOXX indices. Not all of the
authors trading rules are written in stone. The author will let you know which
are and which are not.

The Really, Really, Good Stuff Charts, Momentum Indicators, Support and Resistance
OK, is everyone back? I think we lost one person. Either they are still at the
Yahoo site or fell into the Vortex. Gee I hope it’s not the latter.
We are now about to take on the serious stuff. No more fooling around. This
is it. The “Meat and Potatos”. I am talking charts, momentum indicators,
support and reistance. You cannot, I repeat, cannot trade successfully without
a thorough understanding of all the above. We are going to take another field
trip, this time we will be visiting investopedia.com They have a lot of
informaiton at that site plus a trading simulator. So explore. We are going to
learn the momentum indicators inside and out, one by one. This field trip is
going to be brutal, so what do you say we take a ½ hr break? I am getting a
little bleary eyed myself. I will see you shortly.
TAKE A ½ HOUR BREAK
Alright I see that everyone is back except the person we lost at Yahoo. We
are now going to learn about the following momentum indicators.
MACD
Stochastics
RSI
CCI
There are a slew of momentum indicators out there. I have narrowed them
down to the above list. I found these to be the most effective. We are going
to use these indicators for confirmation when entering trades on the long side.
I am not going to explain how to enter on the short side. If you want to short
then just do the opposite of what I recommend for longs. I am not about to
repeat my self over and over just to say the opposite of what I was saying
about longs. You can figure all that out for yourselves and it’s less writing for
me as well. Do you think this is easy? Before going any further, I would like
everyone to click on the bus and go to investopdedia.com. Go over each
indicator one by one. Take notes. You don’t need to understand all the
technical stuff, just get a good overview. I will see you back here in about 1
hr.
Click on bus for field trip to investopedia.com
Alright. Is everyone back? Is the Yahoo guy still MIA? Did you get a good
basic understanding of all the indicators? Let’s move on and review.
MACD
MACD is a lagging momentum indicator which detects swings in a stock price.
It will signal both bullish and bearish conditions. MACD (Moving Average
Convergence Divergence) is without a doubt the most powerful indicator out
there. It will identify short and long term up trends as well as downtrends. It
shows the relationship between two moving averages of prices. MACD
is calculated by subtracting the 26-day exponential moving average
(EMA) from the 12-day EMA. A 9-day EMA of the MACD, called the "signal line”
is also used. MACD is a lagging it indicator, in that it lags behind the stock
price. This is important. The settings we will use for MACD are 9, 15, and 5.
You will find that the standard is 12, 26, and 9. I find the settings of 9, 15,
and 5 are faster and tend to get you in and out of a trade before the general
populace does. The following is very important. It is considered bullish when
the MACD crosses up over the centerline or “0”. When the MACD starts to pull
away from the signal line, this indicates that the stock is getting overbought
however there is lots of buying pressure. This is what we want to see. We
also want to see the histogram bars getting taller. If MACD has crossed up

over the signal line, the histogram bars will be above 0. If MACD has crossed
down over the signal line, the histogram bars will be below 0. If it pulls away
from the signal line but is below 0 this indicates the stock is oversold. Again,
the histogram shows the divergence. For our long positions, we want to
find stocks where the MACD is crossing up over the signal line as well
as crossing up through the centerline. This indicates lots of buying
pressure. The up move should be good for 5 to 7 bars depending on the time
frame of the chart. On a daily chart that would be 5 to 7 days, on a 60
minute, 5 to 7 hrs. We must however confirm the move with the other
indicators. For our short positions, we want to find stocks where the
MACD is crossing down over the signal as well as crossing down
through the centerline. This indicates lots of selling pressure The down
move as in the up move would be good for 5-7 bars. Stocks with MACD
crossing up over the signal line but below 0 are in a short term uptrend.
Stocks with MACD crossing down over the signal line but above 0 are in a
short term downtrend. MACD can also be used to show divergences from
price. If the stock price keeps moving up, but MACD starts to move down, the
divergence means the stock price is losing momentum.
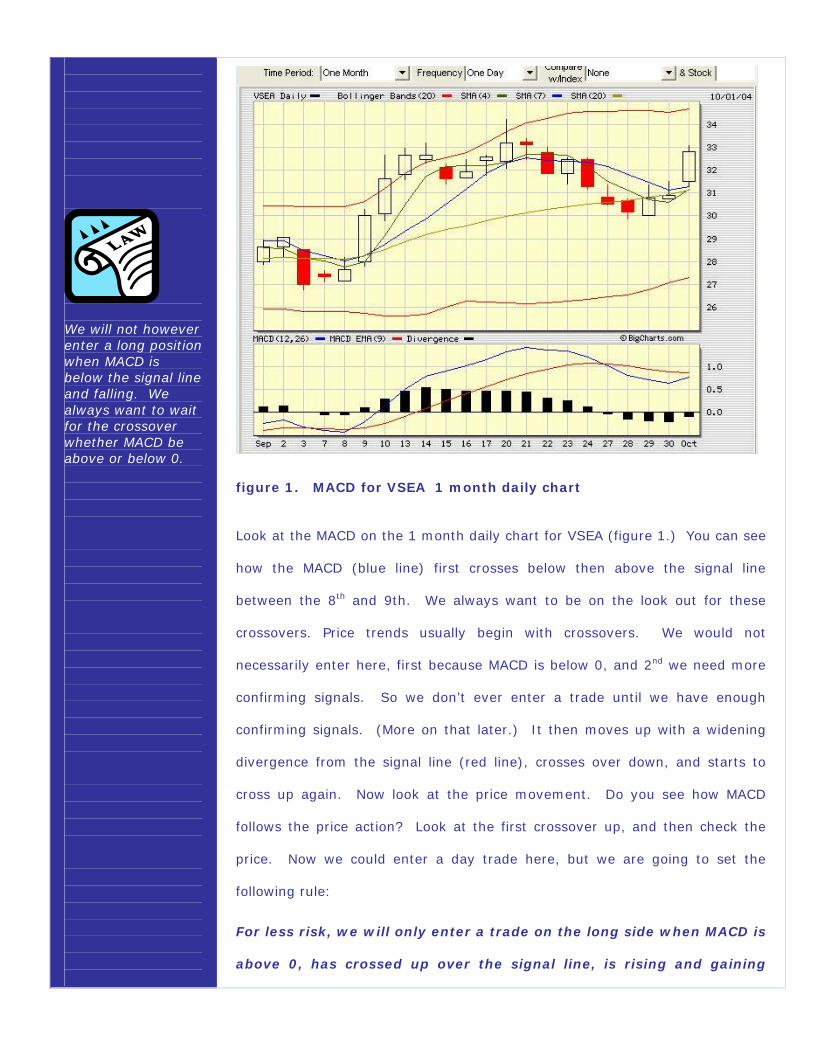
We will not however enter a long position when MACD is below the signal line and falling. We always want to wait for the crossover whether MACD be above or below 0.
figure 1. MACD for VSEA 1 month daily chart
Look at the MACD on the 1 month daily chart for VSEA (figure 1.) You can see
how the MACD (blue line) first crosses below then above the signal line
between the 8th and 9th. We always want to be on the look out for these
crossovers. Price trends usually begin with crossovers. We would not
necessarily enter here, first because MACD is below 0, and 2nd we need more
confirming signals. So we don’t ever enter a trade until we have enough
confirming signals. (More on that later.) It then moves up with a widening
divergence from the signal line (red line), crosses over down, and starts to
cross up again. Now look at the price movement. Do you see how MACD
follows the price action? Look at the first crossover up, and then check the
price. Now we could enter a day trade here, but we are going to set the
following rule:
For less risk, we will only enter a trade on the long side when MACD is
above 0, has crossed up over the signal line, is rising and gaining

momentum (per histogram) on both the daily and intraday chart 5 day
60 charts. Bias is always to the upside when MACD is above 0. This
rule is bendable as far as entering a long trade when MACD is below 0,
but be aware that long trades with MACD below 0 contain more risk.
Bias is always to the downside when MACD is below 0. We will not
however enter a long position when MACD is below the signal line and
falling. We always want to wait for the crossover whether MACD be
above or below 0. Our settings for MACD are 9 15 5
Therefore we would consider this stock as a day or swing trade candidate once
the MACD crossed “0” or the centerline after the first crossover up. We could
enter at the crossover, but MACD is below 0 and therefore our risk level is
increased. Do you remember the goal I asked you to write down? Nuff said.
If we entered on the 10th we could have exited on the 14th when MACD had
the most momentum. (note the histogram bar) We always want to exit the
trade before MACD starts to lose momentum. We want to sell into strength.
MACD keeps losing momentum but also keeps rising; we could hang on until
the 20th, but would have taken on some additional risk since stock price was
becoming overbought. Below you will see why it would be best to exit on the
14th.
Stochastics
Stochastics is a leading momentum indicator which measures the relationship
between an issue's closing price and its price range over a predetermined
period of time. Stochastics will tell you if a stock is overbought or oversold,
and also what the immediate short term trend is. You will notice 2 lines (%K
%D) which rise and fall depending on whether or not there are more buyers or
more sellers. %D is more important than %K, however %K leads %D. A
rising %K and %D indicates an uptrend, while a falling %K and %D indicates a

down trend. We want to look for %K and %D to be rising above 20 but below
80. Ideally we want to see both indicators moving in the same direction. This
confirms a positive uptrend. There are slow and fast stochastics, both use 2
parameters. There is also full stochastics which uses 3. We will opt for full
stochastics with a setting of 6 5 5. This setting is a little smoother than
default settings. If the available chart does not have full stochasitcs we will
use slow stochastics with a setting of 6 5. Fast stochastics whipsaw and give
too many false signals.
Figure 2. Stochastics for VSEA 1 month daily chart
Notice how %K (red line) crosses above %D (blue line) between the 8th and
9th of September. (Figure 2) Now look at how the stock price trends up
following the stochastics all the way to the 14th . Do you see how the price
dropped on the 15th? (remember our first choice to exit above was the 14th?)
A clue that the price may drop was given between the 13th and 14th when
stochastics went flat, dropping slightly and were above 80. Anytime

stochastics are above 80 they are at extremes, and caution is now the
prevailing word of the day. Then there was a crossover down between the
14th and 15th. Notice how between the 16th and the 21st stochastics dropped
but the price rose. This is a divergence which does not happen very often.
Usually when stochastics drop, so does the stock price. You can almost bank
on it. From the 21st to the 28th stochastics kept falling and now so did the
stock price. Between the 28th and the 29th there was another crossover up
and the stock price rose once again. We want to see a stochastics crossover
up from 20 or above. %K crossing up over % D with both lines rising from
above 20. This would be a confirming or buy signal. We want to be wary
when stochastics are extremes at 80 or higher. This would be a caution or sell
signal. We will now set the following rule:
We will only enter a trade on the long side when stochastics are rising
from above 20 on the daily and intraday charts. This is bendable here.
Sometimes when a stock price has a lot of momentum stochastics can
stay pegged at 80 or above for a long time. We can enter these
positions but must be very cautious and must be aware of any
crossovers down. We need to keep a close eye on price and MACD. As
long as MACD is rising and gaining momentum we are usually OK.
Ideally we want to enter after the crossover and while both lines are
rising from above 20. For short positions we want to enter when
stochcastics crossover down from 80. Our settings for stochastics are
6 5 5 We want to use full or 3 period stochastics as opposed to slow
or fast stochastics which both use 2 periods. If we do not have a
chart which has full stochastics then we will use slow stochstics with
a setting of 6 5.
RSI (Relative Strength Index)
RSI is a leading oscillator which compares the magnitude of a stock's recent
gains to the magnitude of its recent losses on a scale from 0 to 100. It
measures the internal strength of the stock. Generally, if RSI rises above 30
it is considered bullish for the underlying stock. Conversely, if the RSI falls
below 70, it is a bearish signal. We want to see RSI rising between 30 and 70
for a confirming buy signal. If RSI rises above 70 then the stock is considered
to be overbought and would now become either a sell signal or a “proceed
with caution” signal. Conversely if RSI is below 30 the stock the stock would
be considered oversold and this would signify a buy signal. We want to see
RSI rising from 30 but below 70 for solid confirmation.
Also watch for divergences between RSI and the stock price. If the stock price
is rising but RSI is falling, this could mean a short term downtrend. If the
stock price is falling but RSI is rising a short term uptrend could be in the
making. We will be using RSI as a secondary confirming signal. Our primary
confirming signals will be provided by MACD and stochastics.

Figure 3. RSI for VSEA 1 month daily chart
On August 10th you can see as RSI rises from 30, the stock price rises as well.
A steady uptrend within this range would be a confirming signal.
We will enter a trade on the long side when RSI is rising from above
30
CCI (Commodity Channel Index)
CCI is an oscillator that is in effect a gauge which measures a stock’s current
price in comparison to its statistical mean. CCI will fluctuate between +100
and -100. (on some charts it’s +200 and -200). A reading of -100 shows that
the stock is oversold, and a reading of +100 shows the stock is overbought.
Ideally we want to see the line trending up above 0 towards the +100 mark.

CCI is best used with the monthly/daily chart (1 month 1 day) however; I use
it on my intraday charts as well. CCI is also a leading indicator. If the stock
price is rising, but CCI is falling, the stock price will most likely fall as well.
Figure 4 CCI for VSEA 1 month daily chart
Note rising CCI between 08/08 and 08/15. Also note stock price.
We will enter a trade on the long side when CCI is rising above 0 towards +100 or +200 on the daily chart.
Support and Resistance/Bollinger Bands
Support and Resistance levels are our bread and butter. We will determine
our profit potential and our entries and exits based on them. Basically support
and resistance levels are where the buyers and sellers have a showdown.
Nobody wins and like the “Black Knight” scene in “Monty Python and the Holy
Grail”, we say….”Ok, we will call it a draw”. (Haven’t seen that movie? Put
this course away, and go rent it now.)
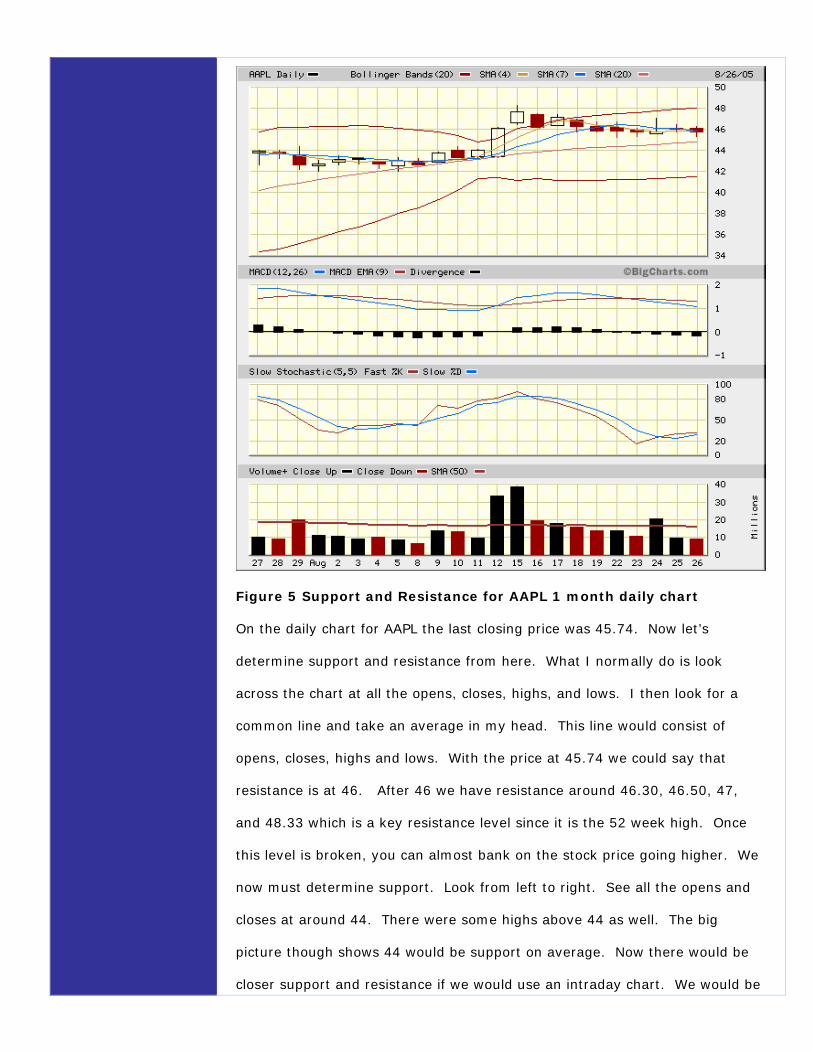
Figure 5 Support and Resistance for AAPL 1 month daily chart
On the daily chart for AAPL the last closing price was 45.74. Now let’s
determine support and resistance from here. What I normally do is look
across the chart at all the opens, closes, highs, and lows. I then look for a
common line and take an average in my head. This line would consist of
opens, closes, highs and lows. With the price at 45.74 we could say that
resistance is at 46. After 46 we have resistance around 46.30, 46.50, 47,
and 48.33 which is a key resistance level since it is the 52 week high. Once
this level is broken, you can almost bank on the stock price going higher. We
now must determine support. Look from left to right. See all the opens and
closes at around 44. There were some highs above 44 as well. The big
picture though shows 44 would be support on average. Now there would be
closer support and resistance if we would use an intraday chart. We would be

more concerned about intraday s/r levels for entries and exits. If we were to
put on a trade here, we first would want to see 46 broken again, then buy
there or a little below on a retrace is possible. Our target exit price could then
be 47 giving us a profit potential of 1.00. Of course we would not be putting
on any trade until we had enough confirmation.
Bollinger Bands
I sometimes use Bollinger Bands as support and resistance cheat sheets.
They can be good for longer term s/r levels. They also show if a stock is
overbought or oversold. If the stock price is near, touching or above the
upper BB, it is said to be overbought, if it is doing the same at the lower BB it
is said to be oversold. The bands are self-adjusting and widen during volatile
price action and contract during tighter trading ranges. An increase in price
action may follow a tight narrowing of the Bollinger Bands.
Putting it all together
My system uses the following:
MACD
Full or slow stochastics
RSI
CCI
Bollinger Bands
20 SMA
4 and 7 SMA
Increasing Volume
I trade high beta stocks with most being from the semiconductor sector. I
look for stocks that move at least a point a day. I primarily trade a handful
of stocks that I know very well. One stock that I trade repeatedly is VSEA.
I have traded it many times in 3 years and have had very few losses with it.
I have traded it both long and short.
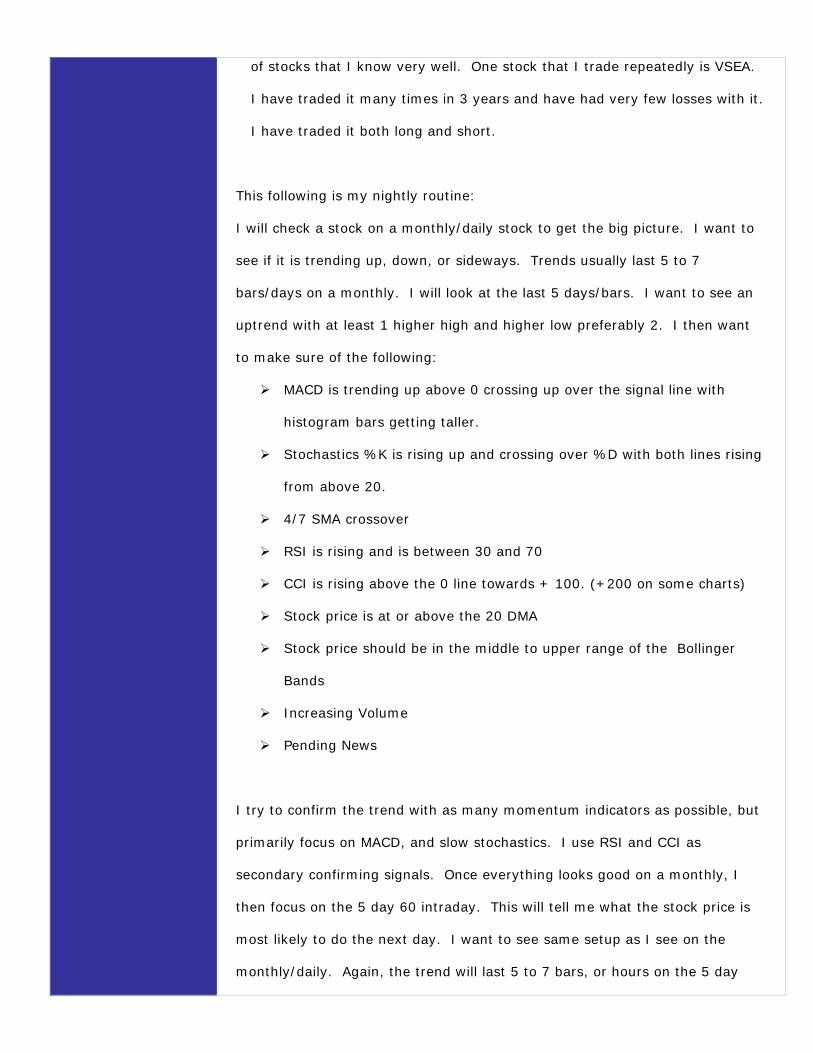
This following is my nightly routine:
I will check a stock on a monthly/daily stock to get the big picture. I want to
see if it is trending up, down, or sideways. Trends usually last 5 to 7
bars/days on a monthly. I will look at the last 5 days/bars. I want to see an
uptrend with at least 1 higher high and higher low preferably 2. I then want
to make sure of the following:
MACD is trending up above 0 crossing up over the signal line with
histogram bars getting taller.
Stochastics %K is rising up and crossing over %D with both lines rising
from above 20.
4/7 SMA crossover
RSI is rising and is between 30 and 70
CCI is rising above the 0 line towards + 100. (+200 on some charts)
Stock price is at or above the 20 DMA
Stock price should be in the middle to upper range of the Bollinger
Bands
Increasing Volume
Pending News
I try to confirm the trend with as many momentum indicators as possible, but
primarily focus on MACD, and slow stochastics. I use RSI and CCI as
secondary confirming signals. Once everything looks good on a monthly, I
then focus on the 5 day 60 intraday. This will tell me what the stock price is
most likely to do the next day. I want to see same setup as I see on the
monthly/daily. Again, the trend will last 5 to 7 bars, or hours on the 5 day
60. In order to plan my entry and exits, I first determine profit potential by
finding support and resistance levels on the monthly daily and 5 day 60. If a
stock is trading at support at 20.00 and resistance is at 21.00, the profit
potential is 1.00. Because the price action tends to get volatile at resistance I
will not take the entire 1.00 but 70% of it. (I want to get out before
resistance because things tend to get volatile there) I also have my stop in
place which is usually a little bit below the next support level. (there are
many ways to use stops. Always use real stops and not mental stops, since
you tend to talk yourself out of them) My planned exit would then be $20.70.
I fine tune my entries and exits by using the 2 day 15, 10, 5, 3, 1 minute
intraday charts along with Level II. I usually can get within pennies of the
high of the day or at least the afternoon. I want to enter as 5 day 60
indicators are rising. I want to see the same in the 2 day 15 min chart. (the 2
day 15 min chart leads the 5 day 60) I then drill down to 2 day 5 and 3 min
charts and wait until they bottom. When 2 day 5 is just about bottomed I will
then look to buy when 2 day 3 starts to turn up. I have a rule: Never buy
when 2 day 5 and 3 min charts are high, never sell when they are low. Wait
on them if need be. If entering and they do not bottom, then do not chase.
If I entered this trade at $20.00, I could put a sell limit order in at the time of
the trade for $20.70 or watch the momentum indicators on the intraday charts
for more profit. I may want to take some profit at 20.70, put in a stop, and
let the rest run. It all depends on the circumstances. Is the Market strong, (I
also chart out the COMP (^IXIC), and watch the TICK and TRIN) is the stock
gaining momentum and volume etc.?? I always want to exit my trade
before MACD starts losing momentum, and sell into strength. I watch
the 5 day 60 and 2 day 15 min charts. When MACD and stochastics are
topping out on both, I then look to exit. I drill down to a 2 day 3 minute chart

and make sure that is topped out as well. All the while, I am watching bid and
ask prices that are coming up on level II. I then put my limit order in for the
price that I think I can get. Always use limit orders. Only use market
orders if you need to get out of a trade in a hurry.
The bottom line is that I try to take as much risk out of a trade as possible. I
take smaller, but consistent profits. I take no chances, but take no prisoners
either. This is a very low risk trading system but may be adjusted to fit your
risk tolerance.
Example of a recent Swing trade:

Figure 6 VSEA 1 Month Daily The Perfect Storm!
You can see on 8/11 (Figure 1) that in the 5 day price trend there were higher
highs and higher lows, volume was increasing, stochastics had a crossover
up, MACD had a crossover up. There was also a 4/7 crossover up. RSI and
CCI were also rising. Support was at 43, resistance was 44. Next resistance
was 44.20 (52 week high) then 45 which you need to see on a 2yr weekly
chart. First price target was 44, second target was 45 depending upon the
strength of the indicators and if indeed 44.20 resistance was broken. All the
confirming signals were there. Crossovers are the key. Trade entered on
Monday 8/15 at 43.30 (stop in place at 42.45, support at 42.50, gave some
breathing room here) and exited on Tuesday 8/16 at 44.70. We want to look
to enter when indicators are rising, and then sell into strength as they top out
and before they begin to weaken. When entering or exiting,
we want to see the same setup (or as close as possible) on the 5 day 60 and 2
day 15 minute real time charts.

Figure 7 VSEA Intraday 5 day 60 chart
On the 5 day 60 chart (Figure 2) note stochastics rising and the MACD
crossover up around 11:45PM on Monday. The entry was made here at 43.30.
Indicators started to weaken toward the close, but I did not sell due to the
strength of the daily chart, and also because 44.20 key resistance was indeed
tested and broken. Then on Tues note another stochastics crossover up with
rising MACD. The trade was exited here, selling into strength at
approximately 9:33AM at 44.70, below 45 resistance and before indicators lost
momentum.
We take profits as they are handed to us. We don’t want to over stay

our welcome. We want to make trading as mechanical as possible as
to take the emotions out of it. We enter and exit the trade when the
indicators tell us to do so, or when our profit objective is met.
Emotions will cause us to lose profits every time. Fear and Greed rule
the Markets. Overcoming that duo is not easy. It takes practice,
patience and dedication. Follow the rules and you will prosper.
By the way….whatever happened to that Yahoo guy anyway??
More stuff you need to know Candlestick Charting Review at http://stockcharts.com/education/ChartAnalysis/candlesticks.html
Chart Patterns Review at http://stockcharts.com/education/ChartAnalysis/index.html
http://clearstation.etrade.com/education/cover.shtml
TICK and TRIN for NASDAQ (USQ TICK, USQ TRIN) Review TICK (Index) and TRIN at http://www.investopedia.com/dictionary/
Stop Loss Review Stop Loss at http://www.investopedia.com/dictionary/
Money Management Review Money Management at http://www.investopedia.com/university/tm/MoneyManagement/MoneyManagementPart1.asp
http://clearstation.etrade.com/education/cover.shtml
Trading platform and real time charting Download free beta version of Quotetracker www.quotetracker.com

Online Broker Sign up for free Scottrade Demo Account. https://www.scottrader.com/agreements/register.asp
News
www.briefing.com www.cnnfn.com www.marketwatch.com www.cnbc.com
Fundamentals
http://finance.yahoo.com
http://moneycentral.msn.com/investor/srs/srsmain.asp?Symbol=EBAY
Look for stocks with a rating of 6 or better.
Charting note: parameters for indicators can not be changed
Setup www.bigcharts.comPlug in any ticker symbol then click "Interactive Charting". After that, setup the following, Time Frame 1 month 1 day Indicators Moving Averages SMA 3 line. then put in 4 7 20 in the box to the right Upper Indicators Bollinger Bands Lower indicator 1 MACD Lower indicator 2 Slow Stochastic Lower indicator 3 Toggle between Volume + and RSI Chart Style Price display Candlestick Chart Background Default Chart Size Medium Then click "store chart settings" Then click draw chart. Make sure MA's at the top of the chart say 4 7 20. Sometimes it doesn't take and you need to re-enter them. If you do not see these choices, there are little orange triangles next to Time Frame, Indicators and Chart Style. You need to click on them, and the drop down boxes will become visible.

Mentoring available via Yahoo or Windows IM. Please contact Bob at [email protected] for further details.
Legalese All readers/users of this series of tutorials are subject to the following terms and conditions.
Copyright
This series of tutorials are copyright and all rights are reserved. No part of these tutorials may be reproduced or transmitted in any form or by any means or stored in a data base or retrieval system, without the prior written consent of the authors.
Warranty
The author believes the information provided herein is reliable. While every care has been taken to ensure accuracy, the information is furnished to the recipients with no warranty as to the completeness or accuracy of its contents and on condition that any errors or omissions shall not be made the basis for any claim, demand or cause for action.
Disclaimer
This course is provided for educational purposes only.
The basic philosophy of Online Stock Trading Formula is that stock or option investors or traders should take total responsibility for their investment and trading decisions.
Neither the author of this tutorial nor the principals of Online Stock Trading Formula are an investment advisory service; registered investment advisors nor broker-dealers and they do not purport to tell or suggest which securities should be bought or sold.
Stock or option traders or investors requiring trading or investment advice should contact a registered licensed advisor.
Information or examples contained in this publication or on the Online Stock Trading Formula website are for educational, illustration and entertainment purposes only. Nothing should be considered as advice or a recommendation to buy or sell any security or financial instrument.
All investing and trading involves risk and you can lose a lot of money in the stock market.
Stock and options trading has large potential rewards, but also large potential risk. You must be aware of the risks and be willing to accept them in order to invest in the stock and options markets.
Don't trade with money you can't afford to lose.
The past performance of any trading system or methodology is not necessarily indicative of future results.
Hypothetical performance results have many inherent limitations, some of which are described below. No presentation is being made that any account will or is likely to achieve profits or losses
similar to those shown. In fact, there are frequently sharp differences between hypothetical performance results and actual results subsequently achieved by any particular trading program.
The above text is copyrighted intellectual property of the seller and under penalty of law may not be copied, sold or distributed under any
circumstances without the written consent of the author.
Copyright © 2005 Online Stock Trading Formula. All rights reserved worldwide.
