how national policies impact global biopharma innovation ... · how national policies impact global...
TRANSCRIPT
PAGE 1
BY J. JOHN WU AND STEPHEN J. EZELL | APRIL 2016
INFORMATION TECHNOLOGY & INNOVATION FOUNDATION | APRIL 2016
How National Policies Impact Global Biopharma Innovation: A Worldwide Ranking
From 1990 to 2013, the average life expectancy at birth of the world’s citizens increased from 65 to 71 years—a testament to both improved public health-care systems and the advent of new, life-saving drugs and therapies.1 Continued improvements in global health outcomes depend on nations doing their fair share to support global life-sciences innovation and not free riding off the hard work and investment of the leaders. This means that nations must not only prioritize public funds for life-sciences research but must also ensure that their drug pricing and intellectual property (IP) policies support robust private-sector biopharma innovation. Accordingly, this report ranks 56 nations on the extent to which their scientific research, drug pricing, and intellectual property policies contribute to global biopharma innovation. It finds that the United States, Switzerland, Taiwan, Singapore, and Sweden have enacted policies that contribute the most to life-sciences innovation globally (policies that, not coincidentally, have helped these nations become leading life-sciences innovators themselves). In contrast, India, South Africa, Thailand, the Philippines, and Australia have policies that do the least to support the global life-sciences ecosystem.
If the global production of life-sciences innovation is to reach its full potential, individual countries must implement the right policy frameworks; this report assesses which countries’ policies are doing the most to contribute to life-sciences innovation globally.
PAGE 2 INFORMATION TECHNOLOGY & INNOVATION FOUNDATION | APRIL 2016
INTRODUCTION Innovation is not manna from heaven, as Nobel Prize-winning economist Robert Solow once suggested it was.2 Rather, it is the product of intentional human action. And, in the case of the life-sciences sector, innovation requires years of cumulative, painstaking, risky, and expensive research: for example, every new pharmaceutical compound requires an average of 12 to 14 years of research, development, and clinical trials, at an average cost of $2.6 billion.3 Despite these challenges, many nations, universities, and companies remain focused on developing new life-saving and life-improving treatments and cures. But these efforts are held back by nations that “free ride” on the efforts of leaders and fail to do their fair part. Some countries do not invest adequately in life-sciences research. Some seek to pay less than their fair share for drugs by failing to protect intellectual property or forcing drug companies to sell drugs at artificially low prices. These policies make it harder for life-sciences innovators to capture returns from one generation of biomedical innovation to fund investment in the next, weakening a virtuous cycle of life-sciences innovation.
This report builds upon the Information Technology and Innovation Foundation’s (ITIF’s) Contributors and Detractors: Ranking Countries’ Impact on Global Innovation report by specifically examining the extent to which the public investment, intellectual property, and drug pricing policies of 56 countries contribute proactively (or detractively) to global life-sciences innovation.4 Countries with robust life-sciences innovation policies contribute disproportionately to the global stock of innovation in life-sciences fields, as the benefits of this innovation exceed what is captured by the host country, spilling over into the global public commons.
In contrast, countries that invest little in life-sciences research, that fail to provide adequate IP protections, or that restrict drug prices to such a degree that innovators have little incentive to develop innovative life-sciences products at best do little to contribute to and at worst actively harm the global environment for life-sciences innovation. These nations have made the choice to free ride off the global stock of life-sciences innovation by investing less in research and paying less for drugs. These choices hurt all of humankind by slowing down biopharmaceutical innovation.
ITIF has found a strong correlation between countries’ contributor innovation policies and their levels of domestic innovation success, as evidenced by the strong correlation between these countries’ contributor scores and their innovation output scores on the World Intellectual Property Organization’s 2015 Global Innovation Index report (a correlation of 0.84 between that report’s “Creative Outputs” and “Knowledge and Technology” measures).5 In other words, a country’s doing well on innovation policy can also mean it’s doing good for the world. Likewise, this report finds that the countries with the strongest life-sciences-enabling innovation policies globally also have some of the most competitive life-sciences innovation ecosystems.
This report begins by explaining the indicators and methodology used to rank countries’ contributions to global life-sciences innovation; it then articulates the importance of each indicator and assesses how countries perform on them. It concludes with policy recommendations.
By architecting the right conditions under which life-sciences innovation can flourish, countries contribute to generating better health outcomes not only for their own citizens, but for citizens throughout the entire world.
PAGE 3 INFORMATION TECHNOLOGY & INNOVATION FOUNDATION | APRIL 2016
INDICATORS AND METHODOLOGY This report leverages three main indicators: governments’ R&D expenditures on health; the extent of their price controls on pharmaceutical drugs; and their protections for life-sciences IP (as measured by their period of biologics data exclusivity protection), as summarized below.
Indicators Government Research and Development Expenditures on Health: More public investment stimulates business investment because public research in basic science reduces the overall risk of biopharmaceutical R&D activities, making it easier for the private sector to innovate. This indicator is a combination of two variables: Government health R&D (share of government R&D dedicated to health research) and government R&D as a share of GDP (the extent to which a government contributes to R&D activities relative to its country’s economic output).
Pharmaceutical Price Controls: Price controls limit revenue for biopharma companies, which decreases the amount of money they can invest in R&D. This variable measures the extent to which governments intervene in markets to limit drug prices, and is categorized as low, moderate, or high levels of control.
Biologics Data Exclusivity: Because life-sciences research expenditures generate intellectual property (which is subject to misappropriation), robust IP protections are essential if a virtuous cycle of life-sciences innovation is to flourish. This is a measure of the extent to which governments protect intellectual property rights for data that prove the clinical safety and efficacy of novel biologic drugs, measured in years.
Methodology To allow comparisons between variables measured in different ways, each one of these variables undergoes a process of standardization by which it is transformed into a z-score. Once a variable is calculated as a z-score, it can be compared to other variables on the same scale. Basically, a z-score indicates how far a data point is from the mean of all data points collected for that variable.
Using government health R&D as an illustration: In our 56-country sample, the mean of the government health R&D variable is 15.3 percent. A country that invests exactly 15.3 percent on health R&D has a z-score of 0. Countries that have a positive z-score spend a greater-than-average proportion on health R&D, while countries that have a negative z-score spend a lesser-than-average proportion on health R&D. This logic applies to all variables, with positive z-scores indicating a value greater than the mean, and negative z-scores indicating a value lower than the mean.
In other words, z-scores provide a measure of distance from the average score of a variable. Scores with greater magnitude (either positive or negative) are further away from the mean than scores with a smaller magnitude. For example, the United States, which invests 22 percent of its government R&D outlays on health R&D, posts a z-score of 0.91 on the government health R&D indicator, so its score is substantially above the mean.
PAGE 4 INFORMATION TECHNOLOGY & INNOVATION FOUNDATION | APRIL 2016
The Netherlands, which invests 14.6 percent of its government R&D on health R&D, very close to the mean of 15.3 percent, posts a z-score of -0.08.
Once each of the variables is converted to a z-score, each variable has the same point of reference: a z-score of 0. Since the z-score can be interpreted as a standard measure of distance, it eliminates the problem of trying to compare variables with different units (i.e., variables expressed in percentages, years, or categories, as in this report). The composite z-score for each country is a sum of the z-scores from each variable; z-scores are weighted based on the importance of each variable.
The weights assigned to the z-scores sum up to 100 percent: government R&D expenditures on health contributes 35 percent, pharmaceutical price controls contributes 35 percent, and biologic data exclusivity accounts for 30 percent. Breaking down government R&D expenditures on health into its two components, share of government R&D invested in health contributes two-thirds, while government R&D as a share of GDP contributes one-third.
The country with the most positive composite z-score is ranked number one, because that country is furthest above the average score of all countries; the country with the most negative composite z-score is ranked last, since that country is furthest below the average score of all countries. Appendix A: Detailed Scores provides the standardized z-scores for each country’s variables, the weights attached to each variable, and the final composite z-score for each country.
SUMMARY OF RESULTS AND ANALYSIS Table 1 summarizes the 56 countries’ contributions to life-sciences innovation. The United States places first overall, a product of ranking seventh in the government R&D allocated to health research indicator, of ranking first on the IP indicator, and of tying for first on the price-controls indicator. Switzerland, Taiwan, Singapore, and Sweden come in second through fifth, respectively, a result of their robust government investment in life-sciences research coupled with low pharmaceutical price controls for Switzerland, Taiwan, and Singapore, and strong IP protections for Switzerland and Sweden.
In contrast, the policies of India, South Africa, Thailand, the Philippines, and Australia do the least to support global life-sciences innovation. This group of countries offers life-sciences innovators only weak IP protections. This is particularly true of India, the Philippines, and South Africa, which offer no biologics data exclusivity protection. These five countries also invest relatively less in health R&D and impose strict price regulations on pharmaceuticals that, by definition, reduce revenues that can be reinvested into the next generation of biopharmaceutical innovation.
A number of nations that have strong innovation policies overall have only moderate scores when it comes to supporting life-sciences innovation. Finland, Canada, and Japan invest less in health R&D than the leaders and impose moderate price controls. Israel, a nation with a reputation for strong R&D, invests almost nothing in health R&D and has weak intellectual property provisions. The United Kingdom, a nation that seeks to be a global leader in life sciences, in part through attractive tax policies such as the patent box, ranks
The countries with the strongest global life-sciences-enabling innovation policies also have some of the most productive life-sciences innovation ecosystems themselves.
PAGE 5 INFORMATION TECHNOLOGY & INNOVATION FOUNDATION | APRIL 2016
25th in large part because of strict price controls exercised through its national health service.
Unsurprisingly, countries that have the most effective policies in place to promote innovation in the life sciences also have some of the most innovative life-sciences sectors. For example, the United States offers one of the more balanced ecosystems for life-sciences innovation. Between 1997 and 2012, more than half of the intellectual property related to the world’s new medicines was invented in America, while, in the 2000s, U.S. biopharmaceutical companies introduced more new chemical entities than companies from the next five nations combined.6 Likewise, Switzerland was second to the United States in the number of new chemical entities invented between 2001 and 2010.7 Singapore’s aggressive push into life sciences has resulted in eight of the top ten global pharmaceutical firms locating their regional headquarter there.8 In Sweden, the number of life-sciences companies operating in the country increased by 130 percent from 1998 to 2012.9
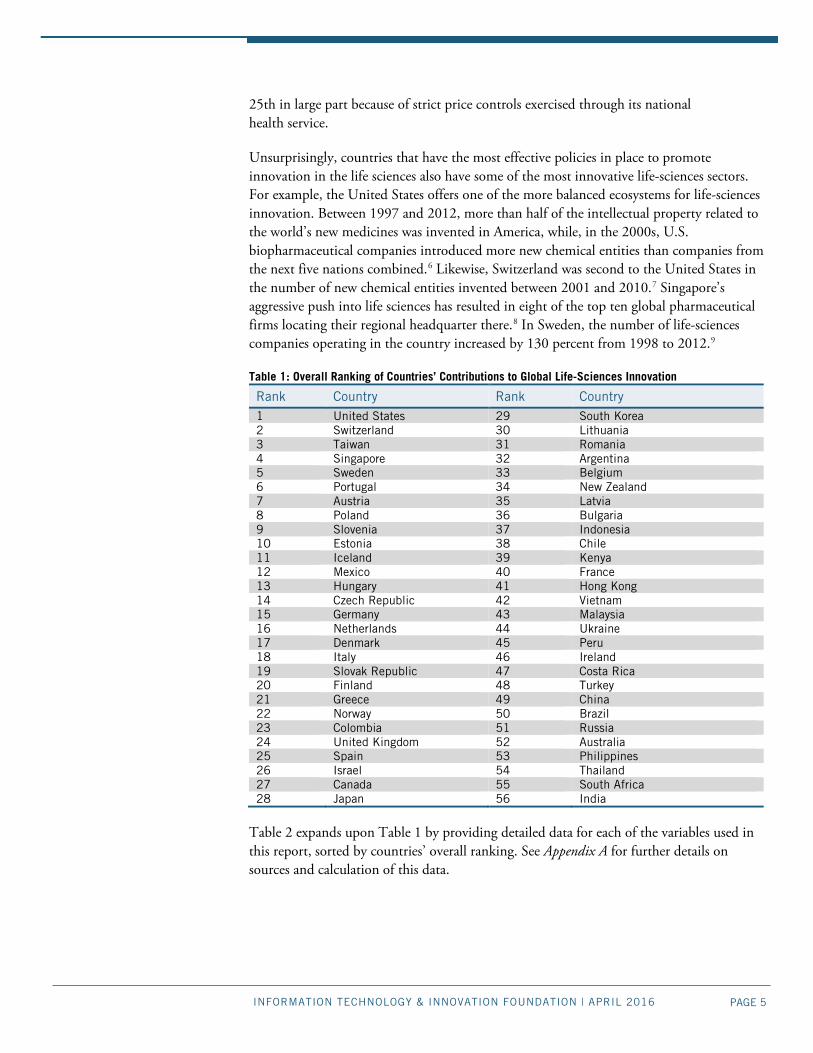
Table 1: Overall Ranking of Countries’ Contributions to Global Life-Sciences Innovation
Rank Country Rank Country 1 United States 29 South Korea 2 Switzerland 30 Lithuania 3 Taiwan 31 Romania 4 Singapore 32 Argentina 5 Sweden 33 Belgium 6 Portugal 34 New Zealand 7 Austria 35 Latvia 8 Poland 36 Bulgaria 9 Slovenia 37 Indonesia 10 Estonia 38 Chile 11 Iceland 39 Kenya 12 Mexico 40 France 13 Hungary 41 Hong Kong 14 Czech Republic 42 Vietnam 15 Germany 43 Malaysia 16 Netherlands 44 Ukraine 17 Denmark 45 Peru 18 Italy 46 Ireland 19 Slovak Republic 47 Costa Rica 20 Finland 48 Turkey 21 Greece 49 China 22 Norway 50 Brazil 23 Colombia 51 Russia 24 United Kingdom 52 Australia 25 Spain 53 Philippines 26 Israel 54 Thailand 27 Canada 55 South Africa 28 Japan 56 India
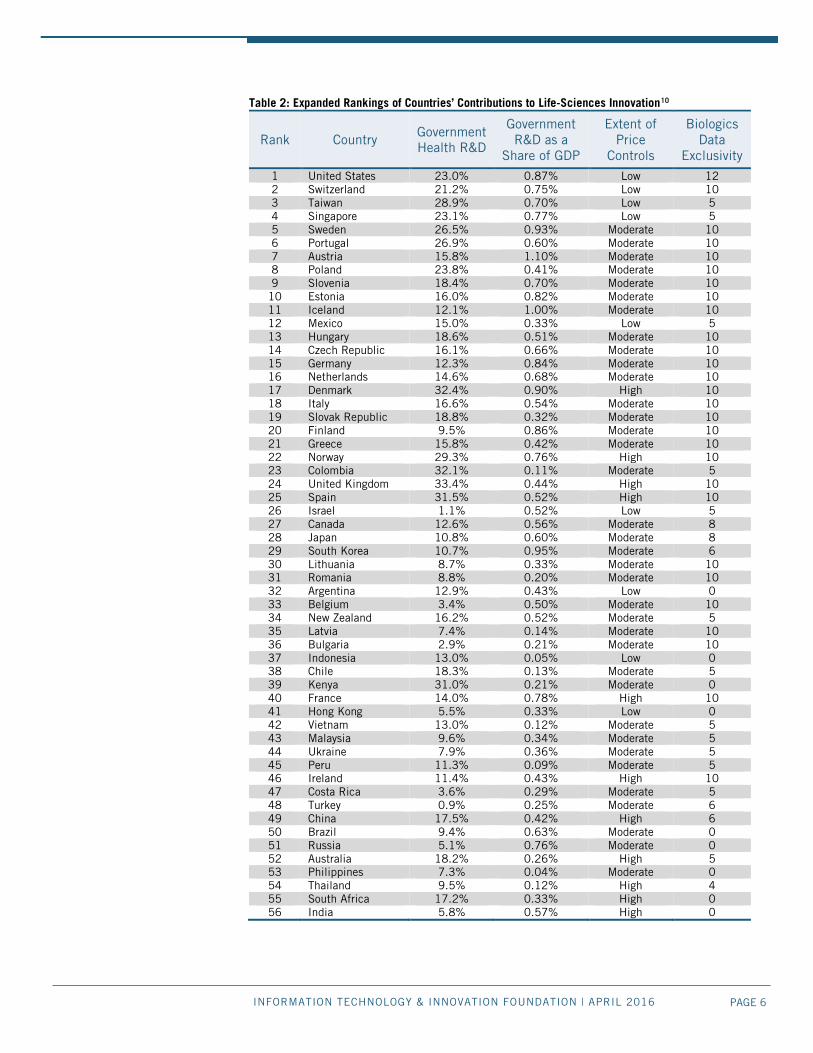
Table 2 expands upon Table 1 by providing detailed data for each of the variables used in this report, sorted by countries’ overall ranking. See Appendix A for further details on sources and calculation of this data.
PAGE 6 INFORMATION TECHNOLOGY & INNOVATION FOUNDATION | APRIL 2016
Table 2: Expanded Rankings of Countries’ Contributions to Life-Sciences Innovation10
Rank Country Government Health R&D
Government R&D as a
Share of GDP
Extent of Price
Controls
Biologics Data
Exclusivity
1 United States 23.0% 0.87% Low 12 2 Switzerland 21.2% 0.75% Low 10 3 Taiwan 28.9% 0.70% Low 5 4 Singapore 23.1% 0.77% Low 5 5 Sweden 26.5% 0.93% Moderate 10 6 Portugal 26.9% 0.60% Moderate 10 7 Austria 15.8% 1.10% Moderate 10 8 Poland 23.8% 0.41% Moderate 10 9 Slovenia 18.4% 0.70% Moderate 10
10 Estonia 16.0% 0.82% Moderate 10 11 Iceland 12.1% 1.00% Moderate 10 12 Mexico 15.0% 0.33% Low 5 13 Hungary 18.6% 0.51% Moderate 10 14 Czech Republic 16.1% 0.66% Moderate 10 15 Germany 12.3% 0.84% Moderate 10 16 Netherlands 14.6% 0.68% Moderate 10 17 Denmark 32.4% 0.90% High 10 18 Italy 16.6% 0.54% Moderate 10 19 Slovak Republic 18.8% 0.32% Moderate 10 20 Finland 9.5% 0.86% Moderate 10 21 Greece 15.8% 0.42% Moderate 10 22 Norway 29.3% 0.76% High 10 23 Colombia 32.1% 0.11% Moderate 5 24 United Kingdom 33.4% 0.44% High 10 25 Spain 31.5% 0.52% High 10 26 Israel 1.1% 0.52% Low 5 27 Canada 12.6% 0.56% Moderate 8 28 Japan 10.8% 0.60% Moderate 8 29 South Korea 10.7% 0.95% Moderate 6 30 Lithuania 8.7% 0.33% Moderate 10 31 Romania 8.8% 0.20% Moderate 10 32 Argentina 12.9% 0.43% Low 0 33 Belgium 3.4% 0.50% Moderate 10 34 New Zealand 16.2% 0.52% Moderate 5 35 Latvia 7.4% 0.14% Moderate 10 36 Bulgaria 2.9% 0.21% Moderate 10 37 Indonesia 13.0% 0.05% Low 0 38 Chile 18.3% 0.13% Moderate 5 39 Kenya 31.0% 0.21% Moderate 0 40 France 14.0% 0.78% High 10 41 Hong Kong 5.5% 0.33% Low 0 42 Vietnam 13.0% 0.12% Moderate 5 43 Malaysia 9.6% 0.34% Moderate 5 44 Ukraine 7.9% 0.36% Moderate 5 45 Peru 11.3% 0.09% Moderate 5 46 Ireland 11.4% 0.43% High 10 47 Costa Rica 3.6% 0.29% Moderate 5 48 Turkey 0.9% 0.25% Moderate 6 49 China 17.5% 0.42% High 6 50 Brazil 9.4% 0.63% Moderate 0 51 Russia 5.1% 0.76% Moderate 0 52 Australia 18.2% 0.26% High 5 53 Philippines 7.3% 0.04% Moderate 0 54 Thailand 9.5% 0.12% High 4 55 South Africa 17.2% 0.33% High 0 56 India 5.8% 0.57% High 0
PAGE 7 INFORMATION TECHNOLOGY & INNOVATION FOUNDATION | APRIL 2016
ANALYSIS OF VARIABLES AND COUNTRIES’ SCORES The following section explains how each indicator impacts life-sciences innovation and examines which countries performed best and worst for each indicator.
Government Expenditures on Health-Care Research Investment in R&D activities carries significant risk because the benefits only emerge over a long period of time and after considerable expense. But without significant injections of R&D investment, neither incremental nor breakthrough biopharma innovations will occur.
Governments’ role in the matter is foundational. Government investment in basic life-sciences research produces new scientific discoveries that point the way toward the development of new drug therapies. This dynamic can be seen quite clearly in the United States, where between 1965 and 1992, federally funded research enabled the discovery of 15 of the 21 top-grossing drugs, 7 of which were directly related to research discoveries made by America’s federally funded National Institutes of Health (NIH).11 These included breakthrough antidepressant drugs that leveraged discoveries about neurotransmitters to develop selective serotonin reuptake inhibitors (SSRIs), anti-AIDS drugs, and drugs used in heart surgery. More recently, NIH-funded research into monoclonal antibodies has supported the development of new monoclonal therapy-based drugs that in 2010 accounted for five of the top twenty best-selling drugs in the United States.12 As one survey concluded, “while it is very difficult to be precise about the pay-offs of publicly funded research [in biomedical science], we conclude from a survey of a wide variety of quantitative and qualitative academic studies that the returns from this investment have been large, and may be growing even larger.”13
Public expenditures in R&D catalyze private-sector R&D investments, boosting innovation outcomes in the long run. For example, a recent Organization for Economic Cooperation and Development (OECD) study entitled The Impact of Public R&D Expenditures on Business R&D found that “direct government funding of R&D performed by firms (either grants or procurement) has a positive effect on business-financed R&D (one dollar given to firms results in 1.70 dollars of research on average).”14 This is evidence of “crowding in” where public investments draw in private funding rather than replace it. Most other studies of the issue report similar findings: the effect varies from around 10 cents to 30 cents additional R&D for every dollar of government funding for university or government laboratory research.15 What’s more, research has shown that there is a strong positive correlation between private R&D investment in a given year, and public R&D spending in the year prior.16
Indeed, as ITIF detailed in its recent report Why Life-Sciences Innovation is Politically “Purple,” many academic studies have continually demonstrated the need for governments to support research into the life sciences robustly.17 As an OECD study argues, “It is particularly important for government-funded research to continue to provide the early seeds of innovation. The shortening of private-sector product and R&D cycles carries the risk of under-investment in scientific research and long-term technologies with broad applications.”18 Likewise, America’s National Academy of Sciences notes, “Fewer
Public expenditures in R&D catalyze private-sector R&D investments, boosting innovation outcomes in the long run.
PAGE 8 INFORMATION TECHNOLOGY & INNOVATION FOUNDATION | APRIL 2016
investments in basic research (by NIH) can result in fewer new drug therapy candidates, which in turn can result in fewer investments by private industry to advance promising candidates.”19 Likewise, the Tufts Center for Drug development writes, “These scientific and development histories demonstrate the rich interconnectivity of all sectors in the drug-discovery and drug-development ecosystem.”20 The Battelle Memorial Institute found that “NIH funded research produced an average of 5.9 patents per $100 million in R&D expenditures from 2000-2013—or at a rate of one patent per every $16.9 million in NIH funding.”21 The report went on to state that “NIH patents also averaged 5.14 forward citations, meaning the NIH is an integral part of the knowledge chain for $105.9 million in downstream R&D for every $100 million in taxpayer funded. These downstream connections represent other research organizations, in both the private and public sector, leveraging NIH discoveries into follow-on R&D spending that is equal to the original federal investment—supporting high skilled, high-wage R&D jobs.”22
Governments’ support for life-sciences research and innovation not only improves health outcomes domestically, but also generates spillover effects, especially among a country’s trade partners. For example, as Coe, Helpman, and Hoffmaister report in their paper International R&D Spillovers and Institutions, “There are spillovers from current R&D to future R&D activities. In an international context these spillovers cross national borders, implying that [the] R&D of one country impacts not only the future R&D costs of domestic firms, but also the future R&D costs of foreign firms.”23 As such, countries that invest more in R&D thereby create new knowledge and technologies, providing a public good that benefits the entire global innovation ecosystem.
Moreover, the interconnected nature of global trade and innovation means that countries with innovative life-science sectors tend to trade in higher-quality medical products. In studying trade flows in medical technologies, Papageorgiou, Savvides, and Zachariadis found that medical technology diffusion, in the form of imports and ideas, is an important contributor to improved health outcomes in the developing world. The authors found that countries farther from the technology frontier enjoyed more benefits contingent on the magnitude of medical R&D conducted by their trading partners.24
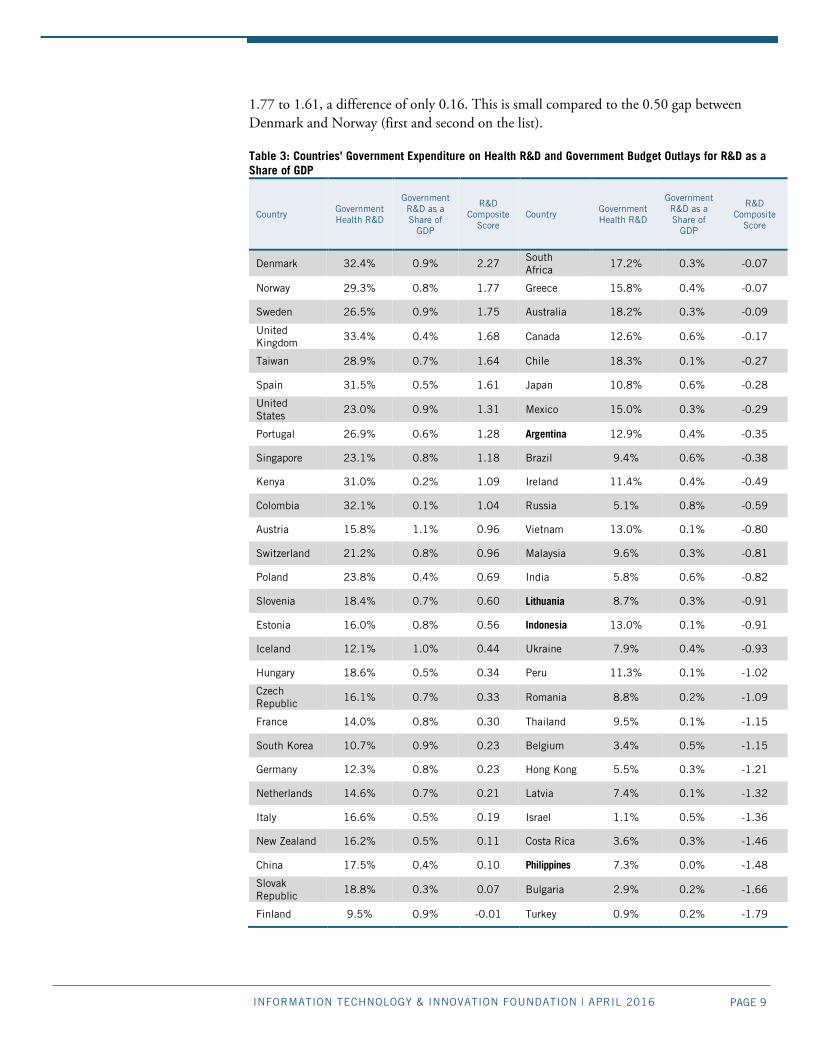
Table 3 shows how much governments prioritize research investment in the life sciences. Again, countries’ scores here are determined as a combined metric of their share of government R&D funding directed to health research and government R&D investment as a share of the country’s GDP. Denmark, Norway, Sweden, the United Kingdom, and Taiwan score highest on this indicator, while Turkey, Bulgaria, the Philippines, Costa Rica, and Israel score lowest.
In developing the weights for this composite indicator, government health R&D is weighted twice as much as a government’s R&D as a share of GDP. This prioritizes life sciences innovation, but also acknowledges that health priorities must be coupled with sizable government investments into general R&D. As the composite scores can be interpreted in terms of distance, by this measure, Denmark leads the rankings by a large margin, with a score of 2.27. The next five countries are clustered with scores ranging from
PAGE 9 INFORMATION TECHNOLOGY & INNOVATION FOUNDATION | APRIL 2016
1.77 to 1.61, a difference of only 0.16. This is small compared to the 0.50 gap between Denmark and Norway (first and second on the list).
Table 3: Countries' Government Expenditure on Health R&D and Government Budget Outlays for R&D as a Share of GDP
Country Government Health R&D
Government R&D as a Share of
GDP
R&D Composite
Score Country
Government Health R&D
Government R&D as a Share of
GDP
R&D Composite
Score
Denmark 32.4% 0.9% 2.27 South Africa
17.2% 0.3% -0.07
Norway 29.3% 0.8% 1.77 Greece 15.8% 0.4% -0.07
Sweden 26.5% 0.9% 1.75 Australia 18.2% 0.3% -0.09
United Kingdom
33.4% 0.4% 1.68 Canada 12.6% 0.6% -0.17
Taiwan 28.9% 0.7% 1.64 Chile 18.3% 0.1% -0.27
Spain 31.5% 0.5% 1.61 Japan 10.8% 0.6% -0.28
United States
23.0% 0.9% 1.31 Mexico 15.0% 0.3% -0.29
Portugal 26.9% 0.6% 1.28 Argentina 12.9% 0.4% -0.35
Singapore 23.1% 0.8% 1.18 Brazil 9.4% 0.6% -0.38
Kenya 31.0% 0.2% 1.09 Ireland 11.4% 0.4% -0.49
Colombia 32.1% 0.1% 1.04 Russia 5.1% 0.8% -0.59
Austria 15.8% 1.1% 0.96 Vietnam 13.0% 0.1% -0.80
Switzerland 21.2% 0.8% 0.96 Malaysia 9.6% 0.3% -0.81
Poland 23.8% 0.4% 0.69 India 5.8% 0.6% -0.82
Slovenia 18.4% 0.7% 0.60 Lithuania 8.7% 0.3% -0.91
Estonia 16.0% 0.8% 0.56 Indonesia 13.0% 0.1% -0.91
Iceland 12.1% 1.0% 0.44 Ukraine 7.9% 0.4% -0.93
Hungary 18.6% 0.5% 0.34 Peru 11.3% 0.1% -1.02
Czech Republic 16.1% 0.7% 0.33 Romania 8.8% 0.2% -1.09
France 14.0% 0.8% 0.30 Thailand 9.5% 0.1% -1.15
South Korea 10.7% 0.9% 0.23 Belgium 3.4% 0.5% -1.15
Germany 12.3% 0.8% 0.23 Hong Kong 5.5% 0.3% -1.21
Netherlands 14.6% 0.7% 0.21 Latvia 7.4% 0.1% -1.32
Italy 16.6% 0.5% 0.19 Israel 1.1% 0.5% -1.36
New Zealand 16.2% 0.5% 0.11 Costa Rica 3.6% 0.3% -1.46
China 17.5% 0.4% 0.10 Philippines 7.3% 0.0% -1.48
Slovak Republic
18.8% 0.3% 0.07 Bulgaria 2.9% 0.2% -1.66
Finland 9.5% 0.9% -0.01 Turkey 0.9% 0.2% -1.79
PAGE 10 INFORMATION TECHNOLOGY & INNOVATION FOUNDATION | APRIL 2016
The variable for the share of government R&D investment going to health R&D has the United Kingdom on top at 33.4 percent, with Denmark close behind, at 32.4 percent. Conversely, the countries investing the least in health as a share of government R&D are Turkey at 0.9 percent and Israel at 1.1 percent, followed by Bulgaria at 2.9 percent and Belgium and Costa Rica at under 4 percent. Table 3 shows that there is considerable variation among countries in the share of government R&D being directed to health research, with some countries spending as little as just under 1 percent of their R&D budgets on health to countries dedicating as much as one-third of their federal R&D budgets to health research.
In terms of government R&D as a share of GDP, of the 56 countries in this study, Austria and Iceland lead at 1.1 percent and 1.0 percent, respectively, followed by Finland, Denmark, South Korea, Sweden, and the United States, all at 0.9 percent. In Chile, Latvia, Indonesia, Peru, Thailand, and Vietnam, government R&D as a share of GDP is the weakest, approximately 0.1 percent.
Although countries may emphasize R&D in the life sciences, they may not invest a lot of money in R&D at all. This is evident from the weak correlation of 0.2 between government health R&D and government R&D as a share of GDP. To score well on our indicator, governments need to dedicate more resources to overall R&D, as well as to target more investment toward life-sciences R&D.
In conclusion, countries do well on this measure when their governments invest heavily in R&D (as a share of a country’s economic output) and when governments prioritize health as an R&D objective. For the top five countries, more than one-quarter of their government R&D funding goes toward health R&D. Furthermore, these countries also commit very high levels of government R&D as a share of GDP. On the other end of the spectrum, the five countries scoring poorest on this indicator invest little in R&D, while also assigning no special priority for life sciences R&D.
Bio-Pharmaceutical Price Controls Most governments apply some form of price controls on pharmaceutical products. And although the price of pharmaceuticals is only one of many variables that impact the effectiveness of any health-care provision system, pharmaceutical sales are the main source of revenues for pharmaceutical companies to invest in future generations of innovative medicines. Overly restrictive price controls levied on bio-pharmaceuticals, by definition, mean less revenue for biopharma companies to invest in R&D.
The bottom line is that when bio-pharmaceutical companies more fully capture the value of their innovations from the market, they reinvest much of those additional revenues toward future innovations. Research in pharmaceutical economics continually demonstrates that innovative pharmaceutical output is strongly linked to robust revenue streams. As the OECD report Pharmaceuticals Pricing Policies in a Global Market explains, “There is a high degree of correlation between sales revenues and R&D expenditures.”25 Indeed, recent data from the United Kingdom’s Department of Innovation, Universities, and Skills R&D Scoreboard indicate a very strong relationship between R&D expenditures
Research in pharmaceutical economics continually demonstrates that robust revenue streams and innovative pharmaceutical output are strongly tied to one another.
PAGE 11 INFORMATION TECHNOLOGY & INNOVATION FOUNDATION | APRIL 2016
and sales for the largest 151 pharmaceutical firms worldwide in terms of expenditures on R&D.26 Henderson and Cockburn find that R&D expenditures are directly proportional to the sales revenues available to fund R&D investment.27 Gambardella finds that sales revenue from previous periods has a significant positive impact on R&D.28 Moreover, pharmaceutical firms with the greatest sales are also the ones with the largest R&D investments, which may in part explain why most global R&D investments are undertaken by the largest multinational firms.29 Symeonidis notes that this is in part because large firms are better able to spread the risks of R&D uncertainty over multiple simultaneous projects.30
Take, for example Europe’s experience with price controls: up until the 1970s, European Union (EU) countries developed the vast majority of the world’s innovative pharmaceutical products.31 But as European countries implemented more stringent price regulations, innovation output fell. Indeed, a key reason why Europe has produced fewer biopharmaceutical innovations than the United States in recent decades is because its biopharmaceutical firms have not generated as much revenue (which can be reinvested in R&D) as American ones. (While it’s true that both American and European pharmaceutical firms sell into global markets, the largest proportion of drugs sold in the EU are made by EU companies, and the largest proportion of drugs sold in the United States are made by American ones, explaining why countries’ drug pricing and procurement levels affect firm-level profits differently across the Atlantic.) Differential revenues explain in part why, as noted, in the 2000s, more new chemical entities were developed in the United States than in the next five nations—Switzerland, Japan, the United Kingdom, Germany, and France—combined.32 European drug-price controls indeed factor directly into this reality. For example, Golec and Vernon contend that, because of drug price regulations, “European Union pharmaceutical firms are less profitable, spend less on R&D, and earn smaller stock returns than U.S. firms.”33 Drawing on data from 1986 through 2004, they go on to show that the economic tradeoff for the European Union’s maintaining real pharmaceutical prices constant over 19 years was forgoing about 46 new medicine compounds. Golec and Vernon took this one step further by presenting a counterfactual scenario of the United States adopting EU-type price controls over the same time period; they estimate that similar price controls would have resulted in 117 fewer new medicine compounds.34
Countries that impose overly strict regulations on the prices of pharmaceutical drugs also disincentivize international companies from entering markets to provide more innovative health-care solutions. A study that examined the 28 largest pharmaceutical markets between 1980 and 2000 found that countries with strict price controls hurt both domestic innovation in the life sciences as well as domestic consumers.35 Not only are drug launches delayed in these price-controlled countries compared to other less-regulated countries; companies are also less likely to introduce their product in additional markets once it is available in a market with heavy price regulations. Domestically produced pharmaceutical products from countries with stronger price controls also reach a smaller market internationally.36
A study that examined the 28 largest pharmaceutical markets between 1980 and 2000 found that countries with strict price controls hurt both domestic innovation in life sciences as well as domestic consumers.
PAGE 12 INFORMATION TECHNOLOGY & INNOVATION FOUNDATION | APRIL 2016
Other studies yield similar findings in the international market for pharmaceuticals. In one, the probability of pharmaceutical launch is positively related to the expected price and volume of sales for a given market.37 This follows the logic that pharmaceutical companies will launch their products in markets where they can better capture the value of their innovations. Another study confirms the finding that consumers in countries that have stricter price controls, compared with countries that do not, have to wait longer for drug launches by international firms.38 These studies highlight the interconnected nature of global life-sciences innovation, where government-mandated price controls do a disservice to consumers, domestic pharmaceutical firms, foreign pharmaceutical firms, and overall drug innovation.
The United States foots most of the bill for global life-sciences innovation. Although the United States produces about 22 percent of global GDP and accounts for 4 percent of the world’s population, it accounts for 44 percent of global biomedical R&D expenditures and its domestic market accounts for 40 percent of the world’s pharmaceutical market share.39 Other countries that impose overly strict price controls are free riding off the United States’ and other similar nations’ efforts. All nations benefit when breakthrough treatments for various diseases are discovered, but by imposing price control mechanisms, countries send a clear signal that they do not want to pay for the costs that go into discovering and commercializing such treatments.
Table 4 assesses the extent to which nations impose price reductions on the sale of pharmaceutical products. Nations enact price controls on pharmaceuticals directly or indirectly based on their national structure for health-care provision. Countries develop price-control policies because they think it will promote drug affordability or limit national budget expenditures.
Various factors inform the retail price of drugs, including wholesale markups, distribution costs, and various taxes. These additional factors vary from country to country, complicating the task of establishing comparable price levels. Depending on country, some policies target pricing choices of pharmaceutical manufacturers, others target pricing choices of pharmaceutical wholesalers, while others target payments levied through health insurance systems—factors external to pharmaceutical companies’ pricing decisions.
Two studies have provided a means of grouping countries based on whether their citizens pay high, moderate, or low prices for pharmaceuticals, relative to these country’s average income levels. First, the OECD has compared price levels for pharmaceuticals against standardized economy-wide price levels. To compare across countries, prices were adjusted by the spending power of countries’ domestic currency relative to the U.S. dollar. A theoretical basket of pharmaceuticals and general products was developed to perform cross-country comparisons. The basket contained a mix of 75 percent original drugs and 25 percent generics. The study assessed whether consumers in OECD countries were overpaying or underpaying for their pharmaceuticals relative to day-to-day goods and services.40 Second, a paper examining differential pricing of pharmaceuticals worldwide compared net-sales data of drug purchases to a theoretical equitable price weighted by gross national income levels and purchasing price parity. Through this framework and across all
PAGE 13 INFORMATION TECHNOLOGY & INNOVATION FOUNDATION | APRIL 2016
national incomes, certain countries were found to pay more than an “equitable” price for drugs, while others pay less.41
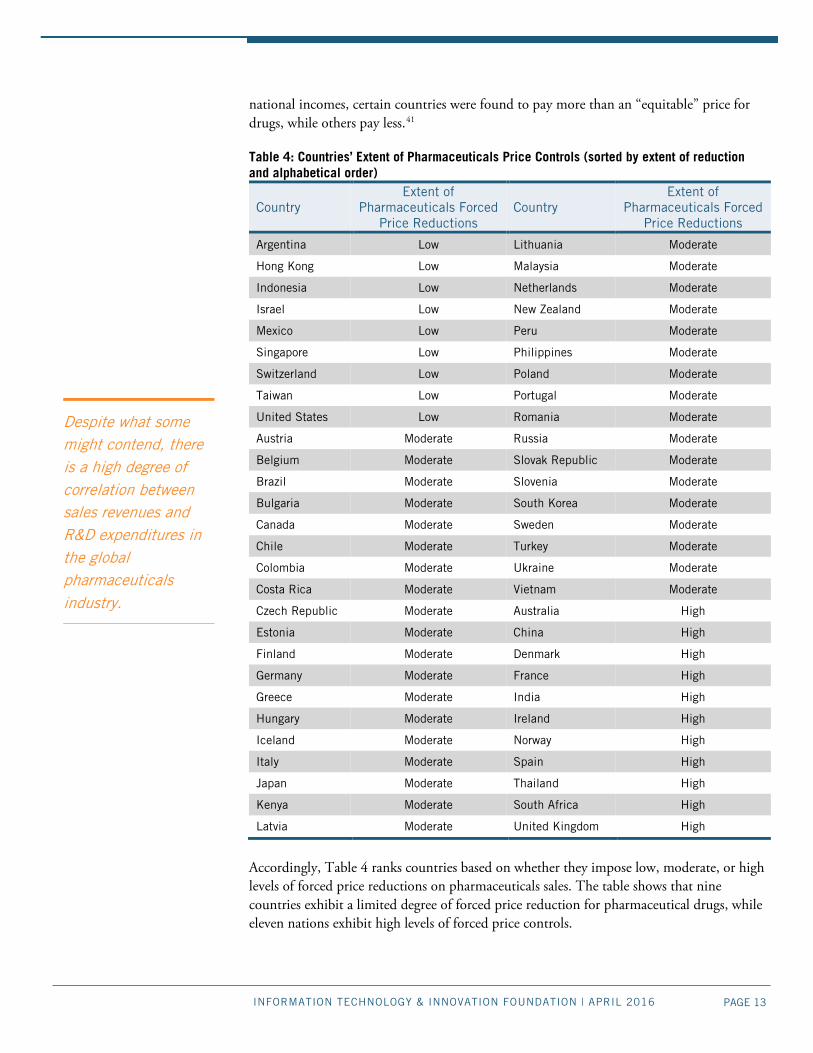
Table 4: Countries’ Extent of Pharmaceuticals Price Controls (sorted by extent of reduction and alphabetical order)
Country Extent of
Pharmaceuticals Forced Price Reductions
Country Extent of
Pharmaceuticals Forced Price Reductions
Argentina Low Lithuania Moderate
Hong Kong Low Malaysia Moderate
Indonesia Low Netherlands Moderate
Israel Low New Zealand Moderate
Mexico Low Peru Moderate
Singapore Low Philippines Moderate
Switzerland Low Poland Moderate
Taiwan Low Portugal Moderate
United States Low Romania Moderate
Austria Moderate Russia Moderate
Belgium Moderate Slovak Republic Moderate
Brazil Moderate Slovenia Moderate
Bulgaria Moderate South Korea Moderate
Canada Moderate Sweden Moderate
Chile Moderate Turkey Moderate
Colombia Moderate Ukraine Moderate
Costa Rica Moderate Vietnam Moderate
Czech Republic Moderate Australia High
Estonia Moderate China High
Finland Moderate Denmark High
Germany Moderate France High
Greece Moderate India High
Hungary Moderate Ireland High
Iceland Moderate Norway High
Italy Moderate Spain High
Japan Moderate Thailand High
Kenya Moderate South Africa High
Latvia Moderate United Kingdom High
Accordingly, Table 4 ranks countries based on whether they impose low, moderate, or high levels of forced price reductions on pharmaceuticals sales. The table shows that nine countries exhibit a limited degree of forced price reduction for pharmaceutical drugs, while eleven nations exhibit high levels of forced price controls.
Despite what some might contend, there is a high degree of correlation between sales revenues and R&D expenditures in the global pharmaceuticals industry.
PAGE 14 INFORMATION TECHNOLOGY & INNOVATION FOUNDATION | APRIL 2016
IP Protections in the Life Sciences IP protections are an economic tool to stimulate investment in risky and difficult innovation. As a biopharmaceutical compound completes its complicated decade-long or longer process from discovery to commercialization, IP protections prevent competitors from appropriating that finalized compound for sale on the market (since replication costs are very low), providing the innovators of that compound a head-start in realizing the fruits of their efforts. Without sufficient IP protections, innovators will have little motivation to invest the economic resources necessary to discover new pharmaceutical compounds. Indeed, once that protection period expires, biopharmaceutical innovators typically see a substantial decrease in profits, as generics step in and drive prices down.42
As mentioned in the section on price controls, revenues serve as the mechanism that transfers value from one generation of life-sciences innovations to the next. In turn, IP protections serve as the mechanism that ensures revenue levels sufficient to stimulate continual investment into the life sciences; as it is, seven out of ten pharmaceuticals released on the market end up as money-losing endeavors.43
One measure of IP protection in bio-pharmaceuticals is the period of data exclusivity on biologic drugs. Much of the current generation of life-sciences innovation rides on the wave of biotechnology. Biologic drugs now account for 30 percent of drugs under development worldwide; going forward, more than 900 novel biologic drugs targeting more than one hundred different diseases are under development today, addressing a range of conditions from cancers such as leukemia and melanoma to diabetes and infectious diseases.44
Some key differences between biologic drugs and traditional pharmaceutical drugs point to the need for different IP treatments. Biologic drugs are large, complex molecules derived from living organisms and manufactured in living tissues, distinguishing them from traditional “small molecule”, chemically synthesized pharmaceutical drugs.45 In fact, biologic medicines—which include therapeutic proteins, DNA vaccines, monoclonal antibodies, and fusion proteins—are significantly more structurally complex than traditional small molecule pharmaceutical drugs and are often 200 to 1,000 times larger in size.46 Already, almost 200 biologic medicines have transformed the lives of over 800 million patients, including the breakthrough anti-cancer medicines Avastin, Herceptin, and Rituxan.47 And, since they can be tailored to the individuals taking the medicine, biologics constitute an important step toward realizing the vision of personalized treatments.48
But as biologics are large, complex molecules that must be manufactured within living tissues, the resulting protein is unique to the cell lines and the specific process used to produce it, and even slight differences in the manufacturing of a biologic can alter its nature.49 Indeed, the sensitivity of these complex proteins makes them more difficult to characterize and to produce; even minor differences in manufacturing processes or cell lines may result in variations in the resulting protein.50 Accordingly, the intellectual property components of a biologic drug include both the structure of the molecule itself and the process for how to reliably, safely, and consistently manufacture the molecule to scale in living tissues.
Unfortunately, the process of developing a biologic drug is extremely risky, time-consuming, and expensive. In fact, the vast majority of biologic medicines never make it to
Data exclusivity protects the actual investment needed to prove the safety and efficacy of a biopharmaceutical product.
PAGE 15 INFORMATION TECHNOLOGY & INNOVATION FOUNDATION | APRIL 2016
the approval stage, with less than 15 percent moving from initial pre-clinical studies to clinical trials.51 Moreover, for biologic drugs that are approved, development of manufacturing facilities represents an additional cost beyond R&D that can range from $90 million to $450 million or more. Given the time, risk, and expense involved in developing biologics, studies find that the break-even time to recover development, manufacturing, promotion, and capital costs averages 14.6 years.52 This long break-even timeframe means that biologics developers have a limited window of opportunity to recoup their investment, and to make sufficient revenues to fund further innovation activities, before a biologic drug’s intellectual property rights expire.
Accordingly, most countries afford biologics two forms of IP protection: 1) patent rights and 2) data exclusivity protection on the clinical trial data that validates the safety and efficacy of novel biologic drugs. Data exclusivity protects the actual investment needed to prove the safety and efficacy of a biopharmaceutical product. It represents the number of years generics competitors (i.e., “biosimilars” manufacturers) must wait before they can use the original biologic innovator’s clinical trial data to prove the safety and efficacy of their biosimilar products in their applications for drug approval.
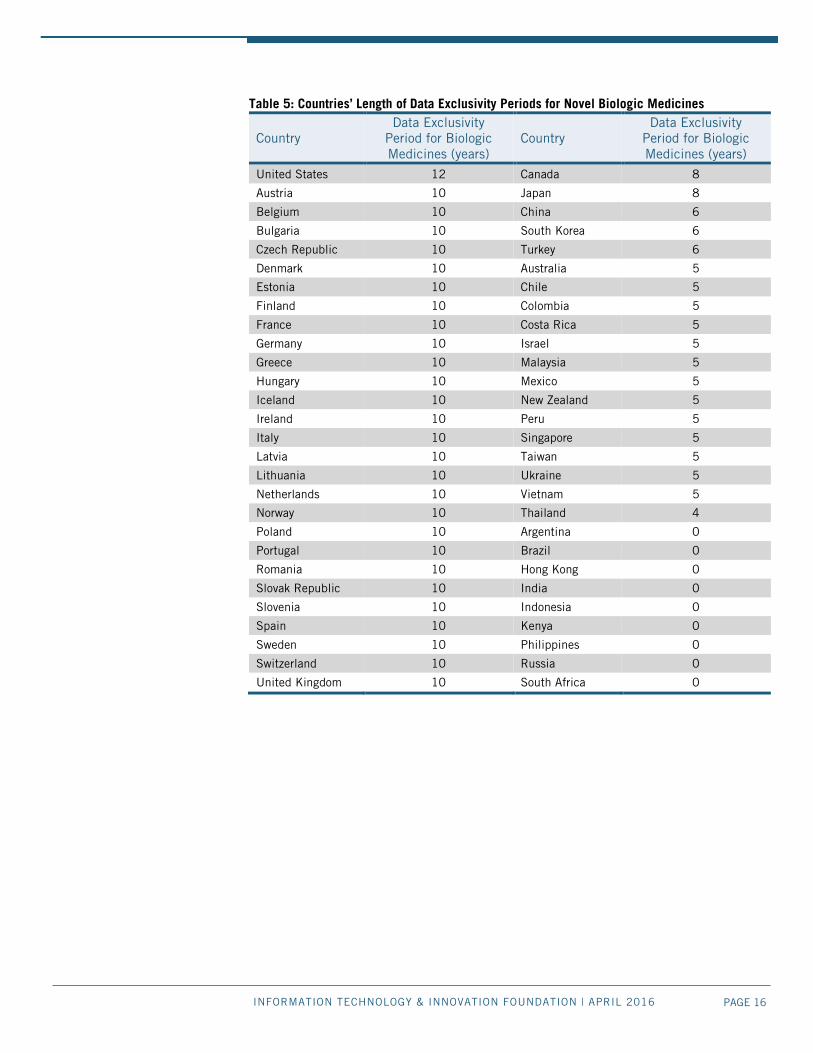
As Table 5 shows, the United States, which is the world’s leading developer of biologic medicines, not coincidentally offers the strongest data exclusivity protections for biologic drugs. U.S. legislators established a standard of 12 years of data protection to strike an appropriate balance between promoting competition and providing adequate incentives to support continued innovation. For their part, European Union countries offer ten years of data exclusivity protection, also supporting a robust environment for life- sciences innovation.
Among countries outside Europe and the United States, Canada and Japan offer the strongest protections for biologic drugs at eight years each, followed by China, Korea, and Turkey, whose laws afford six years of data exclusivity protection. (However, while China’s laws formally state six years of data protection for novel biologic drugs, that standard has often not been met in practice.) This report uses five years as the term of data exclusivity for countries that have signed onto the recently concluded Trans-Pacific Partnership (TPP) agreement—notably Australia, Chile, Malaysia, Mexico, New Zealand, Peru, and Vietnam—although several countries (i.e., Peru and Vietnam) do not currently offer biologics data exclusivity periods, and this will have to change as part of their ratification and implementation of the TPP. Argentina, Brazil, Hong Kong, India, Indonesia, Kenya, the Philippines, and Russia do not offer data exclusivity periods for biologics.
In summary, countries that offer no, or only minimal, periods of biologics data exclusivity fail to cultivate an environment in which the latest biologics-based life-sciences innovations can flourish. In so failing, these countries undermine their own potential to become havens of biomedical innovation and thus also fail to contribute as much as possible to the global innovation system, both through their weak IP protections, and through their unrealized potential for novel life-sciences innovation.
The United States, which is the world’s leading developer of biologic medicines, not coincidentally offers the strongest data exclusivity protections for biologic drugs.
PAGE 16 INFORMATION TECHNOLOGY & INNOVATION FOUNDATION | APRIL 2016
Table 5: Countries’ Length of Data Exclusivity Periods for Novel Biologic Medicines
Country Data Exclusivity
Period for Biologic Medicines (years)
Country Data Exclusivity
Period for Biologic Medicines (years)
United States 12 Canada 8
Austria 10 Japan 8
Belgium 10 China 6
Bulgaria 10 South Korea 6
Czech Republic 10 Turkey 6
Denmark 10 Australia 5
Estonia 10 Chile 5
Finland 10 Colombia 5
France 10 Costa Rica 5
Germany 10 Israel 5
Greece 10 Malaysia 5
Hungary 10 Mexico 5
Iceland 10 New Zealand 5
Ireland 10 Peru 5
Italy 10 Singapore 5
Latvia 10 Taiwan 5
Lithuania 10 Ukraine 5
Netherlands 10 Vietnam 5
Norway 10 Thailand 4
Poland 10 Argentina 0
Portugal 10 Brazil 0
Romania 10 Hong Kong 0
Slovak Republic 10 India 0
Slovenia 10 Indonesia 0
Spain 10 Kenya 0
Sweden 10 Philippines 0
Switzerland 10 Russia 0
United Kingdom 10 South Africa 0
PAGE 17 INFORMATION TECHNOLOGY & INNOVATION FOUNDATION | APRIL 2016
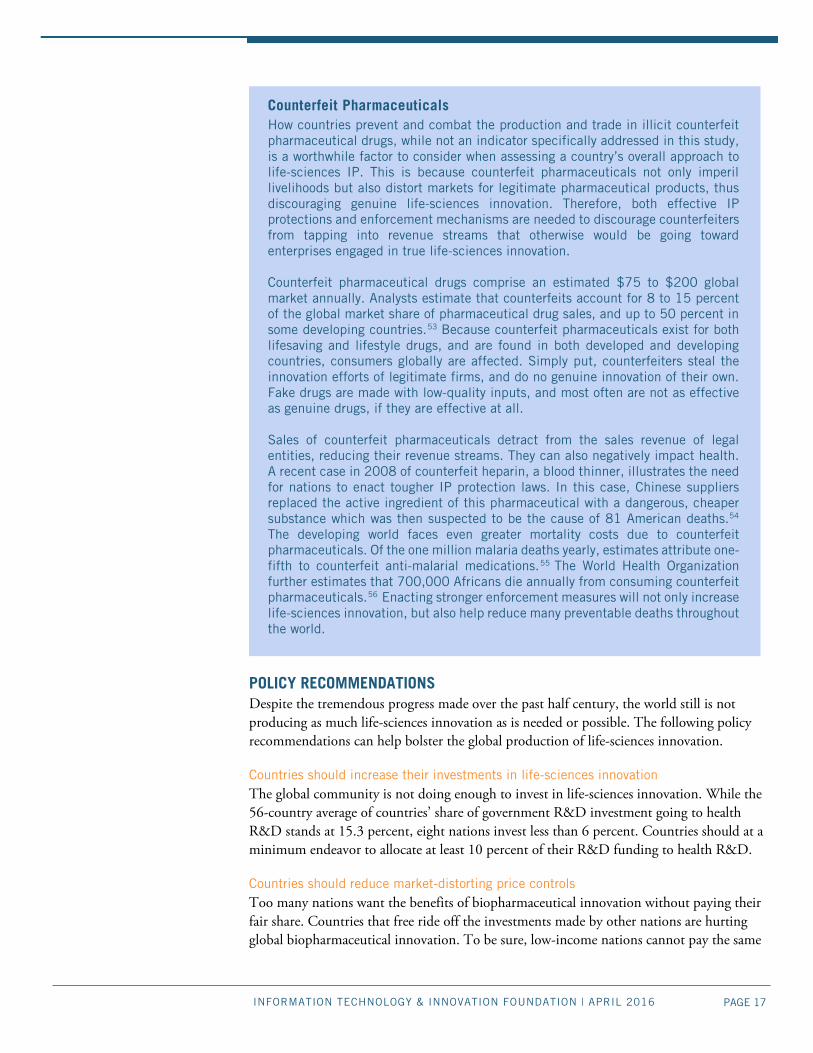
Counterfeit Pharmaceuticals How countries prevent and combat the production and trade in illicit counterfeit pharmaceutical drugs, while not an indicator specifically addressed in this study, is a worthwhile factor to consider when assessing a country’s overall approach to life-sciences IP. This is because counterfeit pharmaceuticals not only imperil livelihoods but also distort markets for legitimate pharmaceutical products, thus discouraging genuine life-sciences innovation. Therefore, both effective IP protections and enforcement mechanisms are needed to discourage counterfeiters from tapping into revenue streams that otherwise would be going toward enterprises engaged in true life-sciences innovation. Counterfeit pharmaceutical drugs comprise an estimated $75 to $200 global market annually. Analysts estimate that counterfeits account for 8 to 15 percent of the global market share of pharmaceutical drug sales, and up to 50 percent in some developing countries.53 Because counterfeit pharmaceuticals exist for both lifesaving and lifestyle drugs, and are found in both developed and developing countries, consumers globally are affected. Simply put, counterfeiters steal the innovation efforts of legitimate firms, and do no genuine innovation of their own. Fake drugs are made with low-quality inputs, and most often are not as effective as genuine drugs, if they are effective at all. Sales of counterfeit pharmaceuticals detract from the sales revenue of legal entities, reducing their revenue streams. They can also negatively impact health. A recent case in 2008 of counterfeit heparin, a blood thinner, illustrates the need for nations to enact tougher IP protection laws. In this case, Chinese suppliers replaced the active ingredient of this pharmaceutical with a dangerous, cheaper substance which was then suspected to be the cause of 81 American deaths.54 The developing world faces even greater mortality costs due to counterfeit pharmaceuticals. Of the one million malaria deaths yearly, estimates attribute one-fifth to counterfeit anti-malarial medications.55 The World Health Organization further estimates that 700,000 Africans die annually from consuming counterfeit pharmaceuticals.56 Enacting stronger enforcement measures will not only increase life-sciences innovation, but also help reduce many preventable deaths throughout the world.
POLICY RECOMMENDATIONS Despite the tremendous progress made over the past half century, the world still is not producing as much life-sciences innovation as is needed or possible. The following policy recommendations can help bolster the global production of life-sciences innovation.
Countries should increase their investments in life-sciences innovation The global community is not doing enough to invest in life-sciences innovation. While the 56-country average of countries’ share of government R&D investment going to health R&D stands at 15.3 percent, eight nations invest less than 6 percent. Countries should at a minimum endeavor to allocate at least 10 percent of their R&D funding to health R&D.
Countries should reduce market-distorting price controls Too many nations want the benefits of biopharmaceutical innovation without paying their fair share. Countries that free ride off the investments made by other nations are hurting global biopharmaceutical innovation. To be sure, low-income nations cannot pay the same
PAGE 18 INFORMATION TECHNOLOGY & INNOVATION FOUNDATION | APRIL 2016
prices for drugs that richer nations should. But the goal should be for countries with strict price controls to bring controls down to moderate levels, and for countries with moderate price controls to bring them down to low levels.
Countries should provide reasonable data exclusivity periods for biologic drugs One way nations avoid paying for the cost of the development of drugs is to have a weak intellectual property system that lets generics onto the market too soon. No or weak data exclusivity periods for biologic drugs is one form of this policy. This not only free rides on the global biopharma innovation system, it limits countries’ own ability to produce novel life-sciences innovations. Countries that have become world leaders in biologics innovation—the United States and European counties such as Sweden and Switzerland—have installed double-digit years of data protection for novel biologic drugs. This should become a global standard reflected in multi-lateral and bilateral trade agreements between and among nations.
CONCLUSION A healthy optimism surrounds advances in life sciences across the globe. Some estimate that, by 2035, health outcomes in the developing world will improve to a point of convergence with those of the developed world.57 While that is a long ways off, it represents a laudable goal. But if we are going to get there, countries are going to have to put in place policies under which life-sciences innovation can flourish. As this report has elucidated, the right policy framework includes the trifecta of governments prioritizing biopharma innovation in their R&D policy, limiting market-distorting price controls, and ensuring robust IP protections for biologics innovation.
PAGE 19 INFORMATION TECHNOLOGY & INNOVATION FOUNDATION | APRIL 2016
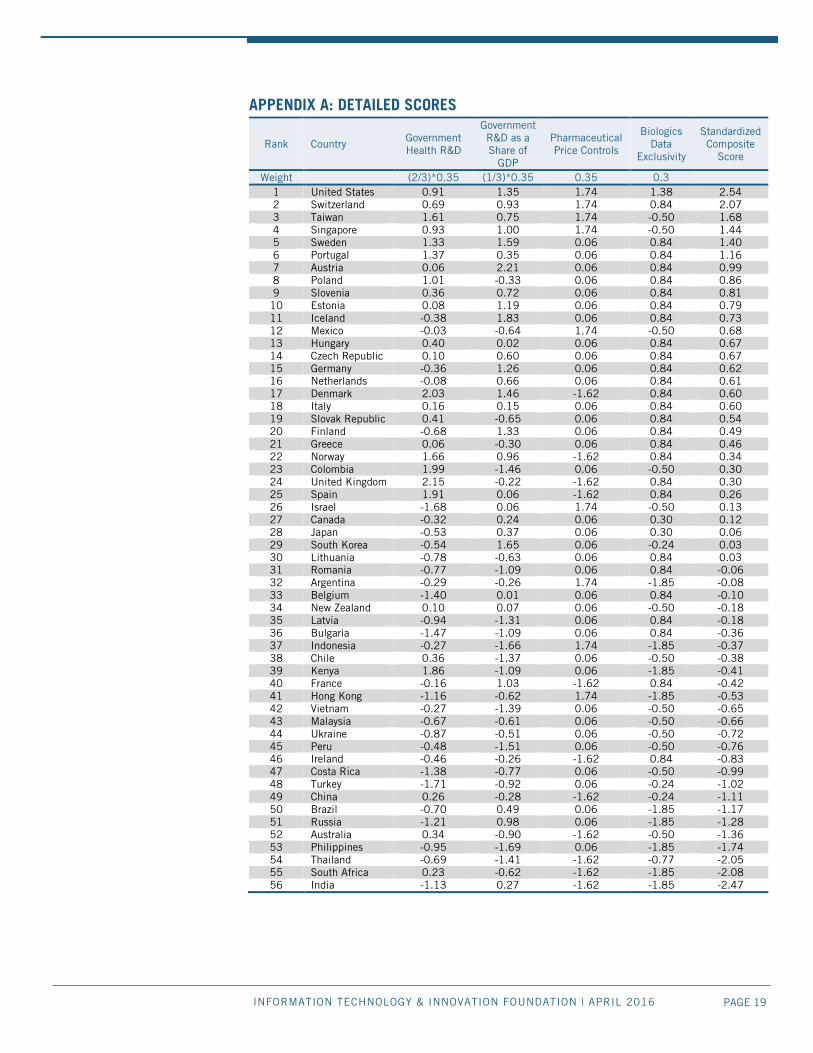
APPENDIX A: DETAILED SCORES
Rank Country Government Health R&D
Government R&D as a Share of
GDP
Pharmaceutical Price Controls
Biologics Data
Exclusivity
Standardized Composite
Score
Weight (2/3)*0.35 (1/3)*0.35 0.35 0.3 1 United States 0.91 1.35 1.74 1.38 2.54 2 Switzerland 0.69 0.93 1.74 0.84 2.07 3 Taiwan 1.61 0.75 1.74 -0.50 1.68 4 Singapore 0.93 1.00 1.74 -0.50 1.44 5 Sweden 1.33 1.59 0.06 0.84 1.40 6 Portugal 1.37 0.35 0.06 0.84 1.16 7 Austria 0.06 2.21 0.06 0.84 0.99 8 Poland 1.01 -0.33 0.06 0.84 0.86 9 Slovenia 0.36 0.72 0.06 0.84 0.81 10 Estonia 0.08 1.19 0.06 0.84 0.79 11 Iceland -0.38 1.83 0.06 0.84 0.73 12 Mexico -0.03 -0.64 1.74 -0.50 0.68 13 Hungary 0.40 0.02 0.06 0.84 0.67 14 Czech Republic 0.10 0.60 0.06 0.84 0.67 15 Germany -0.36 1.26 0.06 0.84 0.62 16 Netherlands -0.08 0.66 0.06 0.84 0.61 17 Denmark 2.03 1.46 -1.62 0.84 0.60 18 Italy 0.16 0.15 0.06 0.84 0.60 19 Slovak Republic 0.41 -0.65 0.06 0.84 0.54 20 Finland -0.68 1.33 0.06 0.84 0.49 21 Greece 0.06 -0.30 0.06 0.84 0.46 22 Norway 1.66 0.96 -1.62 0.84 0.34 23 Colombia 1.99 -1.46 0.06 -0.50 0.30 24 United Kingdom 2.15 -0.22 -1.62 0.84 0.30 25 Spain 1.91 0.06 -1.62 0.84 0.26 26 Israel -1.68 0.06 1.74 -0.50 0.13 27 Canada -0.32 0.24 0.06 0.30 0.12 28 Japan -0.53 0.37 0.06 0.30 0.06 29 South Korea -0.54 1.65 0.06 -0.24 0.03 30 Lithuania -0.78 -0.63 0.06 0.84 0.03 31 Romania -0.77 -1.09 0.06 0.84 -0.06 32 Argentina -0.29 -0.26 1.74 -1.85 -0.08 33 Belgium -1.40 0.01 0.06 0.84 -0.10 34 New Zealand 0.10 0.07 0.06 -0.50 -0.18 35 Latvia -0.94 -1.31 0.06 0.84 -0.18 36 Bulgaria -1.47 -1.09 0.06 0.84 -0.36 37 Indonesia -0.27 -1.66 1.74 -1.85 -0.37 38 Chile 0.36 -1.37 0.06 -0.50 -0.38 39 Kenya 1.86 -1.09 0.06 -1.85 -0.41 40 France -0.16 1.03 -1.62 0.84 -0.42 41 Hong Kong -1.16 -0.62 1.74 -1.85 -0.53 42 Vietnam -0.27 -1.39 0.06 -0.50 -0.65 43 Malaysia -0.67 -0.61 0.06 -0.50 -0.66 44 Ukraine -0.87 -0.51 0.06 -0.50 -0.72 45 Peru -0.48 -1.51 0.06 -0.50 -0.76 46 Ireland -0.46 -0.26 -1.62 0.84 -0.83 47 Costa Rica -1.38 -0.77 0.06 -0.50 -0.99 48 Turkey -1.71 -0.92 0.06 -0.24 -1.02 49 China 0.26 -0.28 -1.62 -0.24 -1.11 50 Brazil -0.70 0.49 0.06 -1.85 -1.17 51 Russia -1.21 0.98 0.06 -1.85 -1.28 52 Australia 0.34 -0.90 -1.62 -0.50 -1.36 53 Philippines -0.95 -1.69 0.06 -1.85 -1.74 54 Thailand -0.69 -1.41 -1.62 -0.77 -2.05 55 South Africa 0.23 -0.62 -1.62 -1.85 -2.08 56 India -1.13 0.27 -1.62 -1.85 -2.47
PAGE 20 INFORMATION TECHNOLOGY & INNOVATION FOUNDATION | APRIL 2016
APPENDIX B: DATA SOURCES The following provides the data sources for each of the three measures.
Government Research and Development Expenditure on Health Care Data Sources: Authors’ research from multiple sources. Organization for Economic Co-Operation and Development, Science, Technology, and Patents Statistics (Government budget appropriations or outlays for R&D, Socio economic objective – Health); accessed March 11, 2016); United Nations Educational, Scientific and Cultural Organization, Science, Technology, and Innovation Statistics, (Expenditure on R&D, Government Medical and Health Sciences R&D; accessed March 11, 2016); Australia – Australian Bureau of Statistics, “Catalogue 8109.0: Research and Experimental Development, Government and Private Non-Profit Organizations, 2012-2013”; Brazil – Estimate (Justin Chakma, Stephen M Sammut, and Ajay Agrawal, “Table 1: Characteristics of Biopharma R&D financing in China, India, Brazil, and South Africa,” Nature Biotechnology 31, (March 7, 2013), http://www.nature.com/nbt/journal/v31/n3/fig_tab/nbt.2529_T1.html; PricewaterhousCoopers Brazil, “The Pharmaceutical Industry in Brazil,” 2013, https://www.pwc.com.br/pt/publicacoes/setores-atividade/assets/saude/pharma-13-ingles.pdf; Group of Eight Australia, “Policy Note: Government Research Funding in 2014 in selected countries,” April 2014, https://go8.edu.au/sites/default/files/docs/publications/policy_note_-_government_research_funding_in_2014_in_selected_countries_final.pdf); Colombia and Costa Rica – Network for Science and Technology Indicators Ivero American and Inter America (RICYT), http://www.ricyt.org/by-country; China – Estimate (Justin Chakma et al., “Asia’s Ascent – Global Trends in Biomedical R&D Expenditures,” The New England Journal of Medicine 370, (January 2, 2014), http://www.nejm.org/doi/pdf/10.1056/NEJMp1311068; Yutao Sun and Cong Cao, “Research Funding. Demystifying central government R&D spending in China,” Science 345 (6200), August 2014, http://science.sciencemag.org/content/345/6200/1006.summary?sid=db19191e-8cd0-4278-a157-1697bf001b91); Indonesia – Average of Lower-Middle Countries in this sample, defined by World Bank Income Groupings; India – Department of Science and Tech, Government of India, “Research and Development Statistics at a Glance, 2011 – 2012,” http://www.nstmis-dst.org/PDF/FINALRnDStatisticsataGlance2011121.pdf; Malaysia – Malaysian Science and Technology Information Centre, “National Survey of Research and Development 2012,” http://irep.iium.edu.my/34884/; Peru – Average of Upper-Middle Countries in this sample, defined by World Bank Income Groupings; Philippines – Therese T. Estella, “Results of the 2011 Survey of R&D Expenditures and Human Resources and Updates on R&D Indicators in the Philippines – Table 7 and Table 11,” Presented at the 12th National Convention on Statistics, Mandaluyong City, October 1-2, 2013, http://www.nscb.gov.ph/ncs/12thncs/papers/INVITED/IPS-43%20Science%20and%20Technology%20and%20Innovation%20Statistics/IPS-43_2%20Results%20of%20the%202011%20Survey%20of%20R%20&%20D%20Expenditures%20and%20Human%20Resources%20and%20Updates%20on%20R%20&%20D%20Indicators%20in%20the.pdf; Hong Kong – Census and Statistics Department Hong Kong Special Administrative Region, “Table 1.8: Total expenditure on in-house R&D activities in the business sector in 2014 by field of R&D activity by selected industry
PAGE 21 INFORMATION TECHNOLOGY & INNOVATION FOUNDATION | APRIL 2016
grouping/size of establishment,” Hong Kong Innovation Activities Statistics 2014, December 2015, http://www.statistics.gov.hk/pub/B11100102014AN14B0100.pdf; Switzerland – Estimated from the Average Health R&D Expenditures of the EU-15, less Belgium and Luxembourg; Sweden – Statistics Sweden, “GBAORD distributed by socio-economic objectives (Protection and improvement of human health, and Medical and Health Sciences),” http://www.scb.se/en_/Finding-statistics/Statistics-by-subject-area/Education-and-research/Research/Government-budget-appropriations-or-outlays-for-research-and-development/Aktuell-Pong/25074/126407/; South Africa – Estimate (South Africa Department of Science and Technology, “National Survey of Research and Experimental Development Main Analysis Report 2012/2013,” http://www.hsrc.ac.za/en/departments/cestii/sa-national-survey-of-research-and-experimental-development; Singapore – Singapore Statistical Agency, “Yearbook 2015:Table 9.3 – R&D Expenditure by Area of Research, 2013,” http://www.singstat.gov.sg/docs/default-source/default-document-library/publications/publications_and_papers/reference/yearbook_2015/excel/topic9.xls; Taiwan – National Statistics Republic of China (Taiwan), “Statistical Yearbook of the Republic of China 2014 – Table 49,” http://eng.stat.gov.tw/public/data/dgbas03/bs2/yearbook_eng/y049.pdf; Thailand – Estimate – National Research Council of Thailand, “Research & Development Index of Thailand (2012 – 2016),” http://en.nrct.go.th/en/RDindexofThailand.aspx; Turkey – Turkish Statistical Institute, “Research and Development Activities Survey, Central Government Budget Appropriations and Outlays on R&D by Socio-Economic Objectives,” http://www.turkstat.gov.tr/PreTablo.do?alt_id=1082; United States – National Science Foundation, “Federal Funds for R&D (Department of Health and Human Services),” http://www.nsf.gov/statistics/2015/nsf15322/; Vietnam – Average of Lower-Middle Countries in this Sample, defined by World Bank Income Groupings. Period of Biologics Data Exclusivity Protection Data Sources: Authors’ research from multiple sources. See in particular International Federation of Pharmaceutical Manufacturers and Associations (IFPMA), Data Exclusivity: Encouraging Development of New Medicines (July 2011), http://www.ifpma.org/fileadmin/content/Publication/IFPMA_2011_Data_Exclusivity__En_Web.pdf; Lisa Mueller, “TPP and the Continuing Controversy Over the Exclusivity Period for Biologics,” BRIC Wall, November 22, 2015, https://bricwallblog.wordpress.com/tag/data-exclusivity/. Pharmaceutical Price Controls Data Sources: OECD, OECD Health Policy Studies: Pharmaceutical Pricing Policies in a Global Market, OECD 2008, http://apps.who.int/medicinedocs/documents/s19834en/s19834en.pdf; Rutger Daems, Edith Maes, and Christoph Glaetzer, “Equity in Pharmaceutical Pricing and Reimbursement: Crossing the Income Divide in Asia Pacific,” Value in Health Regional Issues 2 (2013) 160–166, http://www.ispor.org/ValueInHealth/ShowValueInHealth.aspx?issue=9D094770-F933-40CE-8859-BE54DA4395C1.
PAGE 22 INFORMATION TECHNOLOGY & INNOVATION FOUNDATION | APRIL 2016
ENDNOTES
1. The World Bank, “World Development Indicators: Mortality,” (accessed March 25, 2016), http://wdi.worldbank.org/table/2.21.
2. “It just happens” is a frequent characterization of technological change as postulated by Nobel Prize-winning economist Robert M. Solow in “A Contribution to the Theory of Economic Growth” Quarterly Journal of Economics 70, no. 1 (1956): 65-94.
3. Tufts Center for the Study of Drug Development, “Cost to Develop and Win Marketing Approval for a New Drug is $2.6 Billion,” news release, November 18, 2014, http://csdd.tufts.edu/news/complete_story/pr_tufts_csdd_2014_cost_study.
4. Stephen J. Ezell, Adams B. Nager, and Robert D. Atkinson, Contributors and Detractors: Ranking Countries’ Impact on Global Innovation (Information Technology and Innovation Foundation, January 2016), http://www2.itif.org/2016-contributors-and-detractors.pdf.
5. Ibid., 26. 6. Ross C. DeVol, Armen Bedroussian, and Benjamin Yeo, “The Global Biomedical Industry: Preserving
U.S. Leadership” (Milken Institute, September 22, 2011), 5, http://www.milkeninstitute.org/publications/view/476.
7. Ibid. 8. Robert D. Atkinson, Stephen J. Ezell, Val Giddings, Luke A. Stewart, and Scott M. Andes, “Leadership
in Decline: Assessing U.S. International Competitiveness in Biomedical Research” (Information Technology and Innovation Foundation, May 17, 2012), http://www2.itif.org/2012-leadership-in-decline.pdf?_ga=1.187504554.303802310.1458684800.
9. Anna Sandstrom, “Global trends with local effects: The Swedish Life Science Industry 1998-2012,” (Swedish Governmental Agency for Innovation Systems [VINNOVA], March 2014), http://www.vinnova.se/upload/EPiStorePDF/va_14_03.pdf.
10. Table 2 was updated on April 11, 2016, to correct a transposition error that affected several of the countries’ rankings in this table. Lithuania originally was incorrectly ranked 29, South Korea 30, Latvia 34, New Zealand 35, France 39, and Kenya 40. This transposition error was confined to table 2 and affected no other tables or rankings anywhere else in the report.
11. Everett Ehrlich, An Economic Engine: NIH Research, Employment, and the Future of the Medical Innovation Sector (United for Medical Research, 2011), 5, http://www.eyeresearch.org/pdf/UMR_Economic%20Engine_042711a.pdf.
12. Ibid., 7. 13. Iain M. Cockburn and Rebecca M. Henderson, “Publicly Funded Science and the Productivity of the
Pharmaceutical Industry” (working paper, National Bureau of Economic Research, January 2001), http://www.nber.org/chapters/c10775.pdf.
14. Dominique Guellec and Bruno van Pottelsberghe de la Potterie, “The Impact of Public R&D Expenditure on Business R&D” (working paper no. 2000/04, OECD Science, Technology and Industry Working Papers, OECD Publishing, Paris, 2000), http://www.oecd-ilibrary.org/science-and-technology/the-impact-of-public-r-d-expenditure-on-business-r-d_670385851815.
15. Carter Bloch and Ebbe Krogh Graversen, “Additionality of Public R&D Funding in Business R&D” (The Danish Centre for Studies in Research and Research Policy, 2008), https://www.researchgate.net/publication/228894417_Additionality_of_public_RD_funding_in_business_RD; Paul A. David, Bronwyn H. Hall, and Andrew A. Toole, “Is Public R&D a Complement or Substitute for Private R&D? A Review of the Econometric Evidence” (working paper no. 7373, National Bureau of Economic Research, 1999), http://www.nber.org/papers/w7373.
16. Martin Bailey, “Trends in Productivity Growth” Technology and Growth: Conference Proceedings, Federal Reserve Bank of Boston (June 1996), https://www.bostonfed.org/economic/conf/conf40/conf40.pdf.
17. Robert D. Atkinson, “Why Life-Sciences Innovation Is Politically “Purple”—and How Partisans Get It Wrong” (Information Technology and Innovation Foundation, February 2016), http://www2.itif.org/2016-life-sciences-purple.pdf?_ga=1.254787338.303802310.1458684800.
18. Organization for Economic Cooperation and Development, “A New Economy? The Changing Role of Innovation and Information Technology in Growth,” (OECD, July 6, 2000), http://www.oecd.org/sti/inno/aneweconomythechangingroleofinnovationandinformationtechnologyingrowth.htm.
PAGE 23 INFORMATION TECHNOLOGY & INNOVATION FOUNDATION | APRIL 2016
19. Theresa Wizemann et al., Breakthrough Business Models: Drug Development for Rare and Neglected Diseases
and Individualized Therapies: Workshop Summary (The National Academies Press, 2008), http://www.nap.edu/catalog/12219/breakthrough-business-models-drug-development-for-rare-and-neglected-diseases.
20. Joseph A. DiMasi, Henry G. Grabowski, and Ronald W. Hansen, “Cost of Drug Development,” The New England Journal of Medicine 372, (May 14, 2015), http://www.nejm.org/doi/full/10.1056/NEJMc1504317.
21. “Patents as Proxies Revisited: NIH Innovation 2000 to 2013” (Battelle Technology Partnership Practice, 2015), http://www.battelle.org/docs/tpp/battelle_2015_patents_as_proxies.pdf?sfvrsn=2.
22. Ibid. 23. David T. Coe, Elhanan Helpman, and Alexander W. Hoffmaister, “International R&D Spillovers and
Institutions,” (working paper, International Monetary Fund, April 2008), 13, https://www.imf.org/external/pubs/ft/wp/2008/wp08104.pdf.
24. Chris Papageorgiou, Andreas Savvides, and Marios Zachariadis, “International Medical R&D Spillovers,” October 2004, http://citeseerx.ist.psu.edu/viewdoc/download?rep=rep1&type=pdf&doi=10.1.1.216.9207.
25. Organization for Economic Development and Cooperation, Key Characteristics of the Pharmaceutical Sector in OECD Economies (OECD, September 2008), 189, http://www.oecd-ilibrary.org/social-issues-migration-health/pharmaceutical-pricing-policies-in-a-global-market/key-characteristics-of-the-pharmaceutical-sector-in-oecd-economies_9789264044159-2-en.
26. Ibid., 190. 27. R. Henderson and I.M. Cockburn, “Scale, Scope, and Spillovers: The Determinants of Research Productivity in the Pharmaceutical Industry” RAND Journal of Economics Vol. 27, No. 1 (1996): 32-59. 28. Alfonso Gambardella, Science and Innovation: The US Pharmaceutical Industry During the 1980s
(Cambridge, England: Cambridge University Press, 1995). 29. Henderson and Cockburn, “Scale, Scope, and Spillovers.” 30. G. Symeonidis, “Innovation, Firm Size and Market Structure: Schumpeterian Hypotheses and Some New Themes” OECD Economic Studies No. 27, (1996). 31. Atkinson et al., “Leadership in Decline.” 32. DeVol, Bedroussian, and Yeo, The Global Biomedical Industry: Preserving U.S. Leadership, 5. 33. Joseph H. Golec and John A. Vernon, “European Pharmaceutical Price Regulation, Firm Profitability,
and R&D Spending” NBER Working Paper No. 12676, (November 2006), http://www.nber.org/papers/w12676.
34. Joseph H. Golec and John A. Vernon, “Financial Effects of Pharmaceutical Price Regulation on R&D Spending by EU versus US Firms” Pharmacoeconomics, Vol. 28, No. 8, (2010): 615-628, http://www.ncbi.nlm.nih.gov/pubmed/20617857.
35. Margaret K. Kyle, “Pharmaceutical Price Controls and Entry Strategies,” The Review of Economics and Statistics 89, No. 1 (February 7, 2007), http://www.mitpressjournals.org/doi/abs/10.1162/rest.89.1.88?journalCode=rest#.Vvtc2_krKUk.
36. Ibid. 37. Patricia M. Danzon, Y. Richard Wang, and Liang Wang, “The Impact of Price Regulation on the
Launch Delay of New Drugs - Evidence from Twenty-Five Major Markets in the 1990s,” NBER Working Paper No. 9874, (July 2003), http://www.nber.org/papers/w9874.
38. Patricia M. Danzon and Jonathan D. Ketcham, “Reference Pricing of Pharmaceuticals for Medicare: Evidence from Germany, the Netherlands, and New Zealand,” NBER Working Paper No. 10007, (October 2003), http://www.nber.org/papers/w10007.
39. The World Bank, Data (Population, total and GDP at market prices (current US$); accessed April 1, 2016), http://data.worldbank.org/indicator/SP.POP.TOTL, http://data.worldbank.org/indicator/NY.GDP.MKTP.CD; Justin Chakma, et al., “Asia’s Ascent – Global Trends in Biomedical R&D Expenditures” The New England Journal of Medicine 370, January 2, 2014; Deloitte, “2015 Global life science outlook: Adapting in an era of transformation,” (Deloitte, 2014), https://www2.deloitte.com/content/dam/Deloitte/global/Documents/Life-Sciences-Health-Care/gx-lshc-2015-life-sciences-report.pdf.
40. Organization for Economic Development and Co-operation, Key Characteristics of the Pharmaceutical Sector in OECD Economies.
PAGE 24 INFORMATION TECHNOLOGY & INNOVATION FOUNDATION | APRIL 2016
41. Rutger Daems, Edith Maes, and Shyama V. Ramani, Global Framework for Differential Pricing of
Pharmaceuticals (United Nations University—Masstricht Economic and Social Research Institute on Innovation and Technology (MERIT), Working Paper 54, 2011), https://ideas.repec.org/p/unm/unumer/2011054.html#biblio.
42. Linda Gorman, “Patent Expiration and Pharmaceutical Prices,” The National Bureau of Economic Research (September 2014), http://www.nber.org/digest/sep14/w20016.html.
43. Henry Grabowski and John Vernon, “A New Look at the Returns and Risks to Pharmaceutical R&D” Management Science 36, no. 7 (July, 1990): 804–21.
44. Pharmaceutical Research and Manufacturers of America (PhRMA), “2013 Medicines in Development Report: Biologics” (PhRMA, 2013), http://www.phrma.org/sites/default/files/pdf/biologics2013.pdf.
45. Stephen J. Ezell, “Ensuring the Trans-Pacific Partnership Becomes a Gold-Standard Trade Agreement” (Information Technology and Innovation Foundation, August 2012), http://www. Information Technology and Innovation Foundation.org/publications/ensuring-trans-pacific-partnership-becomes-gold-standard-trade-agreement.
46. Stephen J. Ezell, “The Imperative of Protecting Life Sciences Innovation in the TPP” (Information Technology and Innovation Foundation, March 2015), http://www2.itif.org/2015-life-science-tpp.pdf.
47. R. Guildford-Blake and D. Strickland “Guide to Biotechnology 2008,” (Biotechnology Industry Organization, 2008), http://www.bio.org/sites/default/files/BiotechGuide2008.pdf.
48. Jon Entine, “FDA Balances Costs, Patient Safety in the Biologics Personalized Medicine Revolution,” Forbes, July 23, 2012, http://www.forbes.com/sites/jonentine/2012/07/23/fda-balances-costs-patient-safety-in-the-biologics-and-personalized-medicine-revolution-will-it-get-it-right-or-damage-the-miracle-industry/print/.
49. Hearing on Biologics and Biosimilars: Balancing Incentives for Innovation, Before the House Comm. on the Judiciary and Subcomm. on Courts and Competition Policy, 111th Cong. (July 14, 2009) (statement of Congresswoman Anna G. Eshoo), http://judiciary.house.gov/hearings/pdf/Eshoo090714.pdf.
50. Dr. Kristina Lybecker, “Protecting Data Exclusivity, Protecting the Future of Medicine,” IPWatchdog, November 10, 2013, http://www.ipwatchdog.com/2013/11/10/protecting-data-exclusivity-protecting-the-future-of-medicine/id=46136/.
51. Inside U.S. Trade, “BIO Increases Effort To Promote 12-Year Data Exclusivity in TPP,” May 13, 2012. 52. Henry Grabowski, Genia Long, and Richard Mortimer, “Data exclusivity for biologics,” Nature Reviews
10 (January 2011), https://fds.duke.edu/db/attachment/1592. 53. Shirley Redpath, “Trade in illegal medicine hits pharmaceutical sector,” World Finance, April 20, 2012,
http://www.worldfinance.com/home/special-reports-home/trade-in-illegal-medicine-hits-pharmaceutical-sector.
54. Erwin A. Blackstone, Joseph P. Fuhr Jr., and Steve Pociask, “The Health and Economic Effects of Counterfeit Drugs” American Health and Drug Benefits 7, no. 4 (June 2014), http://www.ahdbonline.com/issues/2014/june-2014-vol-7-no-4/1756-the-health-and-economic-effects-of-counterfeit-drugs.
55. Jeremy M. Wilson and Roy Fenoff, “The Health and Economic Effects of Counterfeit Pharmaceuticals in Africa,” A-CAPPP Backgrounder, March 2011, http://a-capp.msu.edu/sites/default/files/files/AFRICABACKGROUNDERfinal.pdf.
56. “Bad medicine,” The Economist, October 13, 2012, http://www.economist.com/node/21564546. 57. Lancet Commission, “Global Health 2035 Policy Brief #5: Opportunities for the International
Community,” December 2013, http://globalhealth2035.org/sites/default/files/policy-briefs/policy-brief-5-english.pdf.
ERRATA Table 2 was updated on April 11, 2016, to correct a transposition error. See endnote 10 for details.
PAGE 25 INFORMATION TECHNOLOGY & INNOVATION FOUNDATION | APRIL 2016
ACKNOWLEDGMENTS The authors wish to thank the following individuals for providing input into this report: Robert Atkinson, Alex Key, and Sue Wunder. Any errors or omissions are the authors’ alone. ABOUT THE AUTHORS J. John Wu is an economic research assistant at ITIF. His research interests include green technologies, labor economics, and time use. He graduated from the College of Wooster with a bachelor of arts in economics and sociology, with a minor in environmental studies. Stephen J. Ezell is vice president, global innovation policy, at ITIF. He focuses on innovation policy as well as international competitiveness and trade policy issues. He is coauthor of Innovating in a Service-Driven Economy: Insights, Application, and Practice (Palgrave MacMillan, 2015) and Innovation Economics: The Race for Global Advantage (Yale, 2012). Ezell holds a B.S. from the School of Foreign Service at Georgetown University. ABOUT ITIF The Information Technology and Innovation Foundation (ITIF) is a nonprofit, nonpartisan research and educational institute focusing on the intersection of technological innovation and public policy. Recognized as one of the world’s leading science and technology think tanks, ITIF’s mission is to formulate and promote policy solutions that accelerate innovation and boost productivity to spur growth, opportunity, and progress. FOR MORE INFORMATION, VISIT US AT WWW.ITIF.ORG.