how libraries add value to communities
DESCRIPTION
How libraries add value to communities. Lee Rainie, Director, Pew Internet Project 3.23.11 Computers in Libraries – Washington, D.C. Email: [email protected] Twitter: @ Lrainie. Internet and Broadband Revolution. 70%. 66%. Broadband adoption by community type. - PowerPoint PPT PresentationTRANSCRIPT

PewInternet.org
How libraries add value to communities
Lee Rainie, Director, Pew Internet Project3.23.11Computers in Libraries – Washington, D.C. Email: [email protected]: @Lrainie

2
Internet and Broadband Revolution


70% 66%

Broadband adoption by community type

Demographic factors correlated w/ broadband adoption
Positive correlation(in order of importance)
Negative correlation(in order of importance)
Household income of $75,000 or more per year
Having high school degree or less
College degree Senior citizen (age 65+)
Parent with minor child at home
Prefers speaking Spanish in our interviews
Married or living with partner Disabled
Employed full time African-American
10/5/2010 6Trends in Home Broadband Adoption

Consequences for info ecosystem
Volume Velocity
Vibrance Valence /Relevance
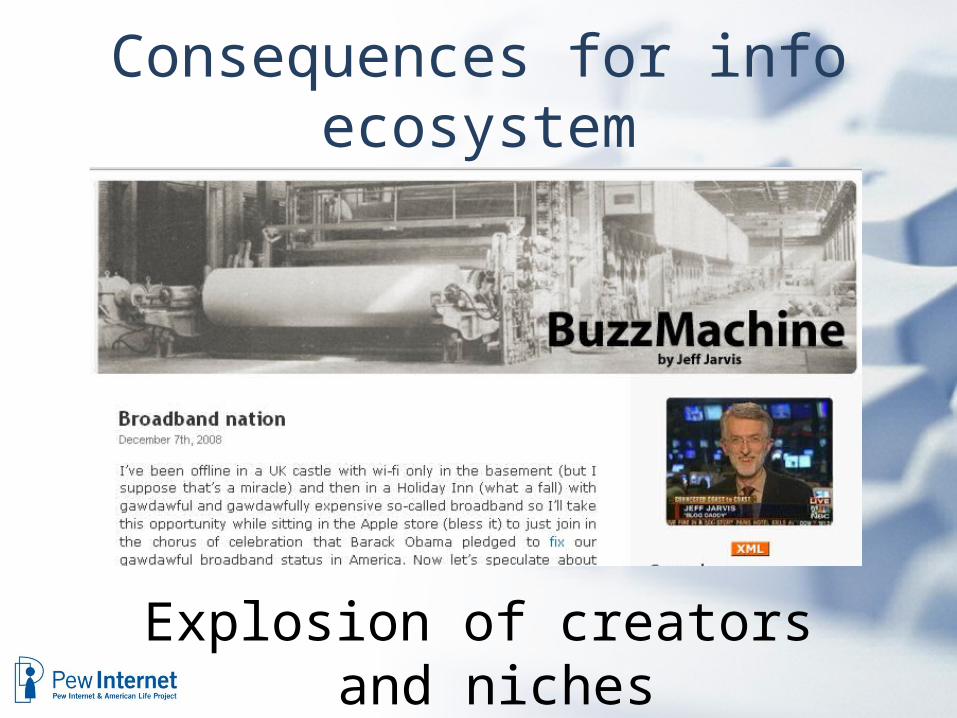
Consequences for info ecosystem
Explosion of creators and niches

Networked creators among internet users• 62% are social networking site users• 55% share photos• 33% create content tags • 32% contribute rankings and ratings• 30% share personal creations • 26% post comments on sites and blogs• 15% have personal website• 15% are content remixers • 14% are bloggers• 12% use Twitter• 4%-17%??? use location-sharing services

Big challenge for librariesAtoms bits
Collections are
disrupted

Big value-add by libraries1 – Cover access divides
• 44% of those living below the poverty line used library connections• 61% of those ages 14-24 used them for
school• 54% of poor senior citizens used library
connections for health/wellness needs• 63% used library connections to help others
Source: Opportunity for All, Univ. of Washingon, Gates Foundation, IMLS http://cis.washington.edu/usimpact/documents/OPP4ALL_FinalReport.pdf

Big value-add by libraries2 – Cover participatory divides
• 2/3 of library connection users sought assistance from library staff
• 60% of library connectors use them for social purposes
• 42% for education purposes• 40% for jobs/career purposes• 37% health and wellness purposes• 33% for community engagement
Source: Opportunity for All, Univ. of Washingon, Gates Foundation, IMLS http://cis.washington.edu/usimpact/documents/OPP4ALL_FinalReport.pdf

But there is more libraries can do: Relevance & digital literacy are primary factors for not going online
Source: Pew Internet Project, May 2010 tracking survey
10/5/2010 13Trends in Home Broadband Adoption

14
Wireless Connectivity Revolution

Cell phone owners – 85% adults
96% 90% 85%
58%
Urban-84% Suburban-86% Rural-77%

2/22/2011 16

Mobile internet connectors – 57% adults
62% 59% 55%
Urban-60% Suburban-60% Rural-43%

Demographic factors related to mobile connectivity
Positive correlation Negative correlation
College grad Less than high school education
$75,000+ household income
<$30,000 household income
Parent of minor child Rural
Republican ??? Spanish dominant in language preference
10/5/2010 18Trends in Home Broadband Adoption

Cell phones as social tools
2/22/2011 20
% of cell owners
• 54% send photo or video • 23% access a social networking
site• 20% watch a video • 15% post a photo/video online • 11% have purchased a product• 11% charitable donation by text • 10% status update service such
as Twitter

What about apps?
2/22/2011 21
Just two-thirds of this group actually uses the apps on their phone
App User Profile:• Male• Young• Well
educated/affluent

55% of adults own laptops – up from 30% in 2006
45% of adults own MP3 players – up from 11% in 2005
50% of adults own DVRs – up from 3% in 2002
42% of adults own game consoles
7% of adults own e-book readers - Kindle
7% of adults own tablet computer – iPaddoubled in 6 months

Consequences for info ecosystem
Anywhere Any device
PresencePlace
Any time
Alone together

Big challenge for librariesPeople come to us We go to people
The library as
place becomes the library as placeless
resource

Big value-add by librariesHelp navigate and “make peace” with info
• Apps vs. web vs. traditional resource locators
• Access to real-time information• Context of information – augmented
reality• Sanctuary – quiet space

26
Social Networking Revolution

The social networking population is more diverse than you might think
2/22/2011 27
5x
5x
7x5x

Demographic factors correlated w/ SNS use
Positive correlation Negative correlation
Under age 30 Senior citizen (age 65+)
Female (overall)Male (frequency)
Rural
Parent with minor child at home
Non-cell user
Some college Disability
Urban
10/5/2010 28Trends in Home Broadband Adoption

Online video
2/22/2011 29
What You Need to Know:• 69% of internet users (half of all US
adults) watch videos online – and not just funny cat videos
• 14% of internet users have uploaded their own video content (up from 8% in 2007); sharing as likely to occur on social networking sites as specialized video sites

Video creation
2/22/2011 30
What You Need to Know:
• 14% of adult internet users have posted video online
• Up from 8% in 2007
• Biggest growth among older adults, women

Online social networks + ubiquitous mobility
• Allows for immediate, spontaneous creation of networks
• Gives people a sense that there are more “friends” in their networks that they can access when they have needs
2/22/2011 31
Social Dashboard
Pervasive Awareness

Big shift for librariesExpertise and influence shifts to networks
Share the stage with amateur experts

Big value-add by libraries1 - Can be embedded in …
Attention zonesContinuous
partial attentionDeep divesInfo-snackingDay dreaming???
Media zonesSocial streamsImmersive Creative /
participatoryStudy / work

Big value-add by libraries2 – Can be nodes in social networks
• As sentries – word of mouth matters more• As information evaluators – they vouch
for/discredit a business’s credibility and authenticity
• As forums for action – everybody’s a broadcaster/publisher

Cosmic big value-add by libraries1 – Can be teachers of new literacies
- screen literacy - graphics and symbols - navigation literacy - connections and context literacy - skepticism - value of contemplative time - how to create content - ethical behavior in new world
Cosmic big value-add by libraries2 – Can help fill in civic gaps
- the big sort among institutions: public, private, non-profit reimagining roles
- the big sort on news and information landscape
- the big empowerment and move to networked individuals

Be not afraid