how big are atoms and molecules?downloads.wavefun.com/spartanstudentlabs.pdfthe “sizes” of atoms...
TRANSCRIPT
1
1How Big are Atoms
and Molecules?The “sizes” of atoms and molecules depend not on the nuclei but rather on the distribution of electrons. Molecules with more electrons will tend to be larger (require more space) than comparable molecules with fewer electrons. Molecules in which electrons are “loosely bound” will tend to be larger than molecules with the same number of “more tightly bound” electrons.
Electron distribution, or electron density as it is commonly referred to, is obtained as part of a quantum chemical calculation. The electron density is a “molecular property” which can actually be measured experimentally (using X-ray diffraction). X-ray diffraction is almost exclusively used to locate (only) the regions in a molecule of highest electron density, which in turn locates the nuclei. A surface of electron density with a value of 0.002 electrons/au3 (enclosing about 99% of the electrons in the molecule) provides a measure of overall molecular size and in most cases closely resembles a conventional space-filling (CPK) model.
In this lab activity, you will explore relationships between number of electrons and atomic/molecular size and between the “looseness” of the electron distribution and size.
1. “Build” lithium cation, atom and anion in a single document. Specify calculation of Energy using the wB97X-D/6-31G* model. Submit the calculation.
Inside the inorganic model kit, select the appropriate element from the Periodic Table and one coordinate from the available hybrids, and click on screen. Then select (Delete) from the bottom of the Model Kit or from the Build menu and click on the free valence. To group the atoms, select (Build New Molecule) instead of New
2
Build after you have built the first. Set Total Charge inside the Calculations dialog to Cation (+1) for lithium cation and to Anion (-1) for lithium anion, and Unpaired Electrons to 1 for lithium atom. Also, remove the checkmark beside Global Calculations at the bottom of the dialog.
When the calculations have completed, request density surfaces by selecting Add and choosing density from the Surfaces dialog (Display menu). Place all three density surfaces side-by-side on screen:
Bring up the spreadsheet (Spreadsheet from the Display menu). Check the box to the left of “Label” (first column) for all three atoms. Also, deselect (uncheck) Coupled from the Model menu (to turn it “off”), so that the three atoms can be moved independently.
Compare the three surfaces. Which is smallest? Which is largest? How does “size” relate to the number of electrons? Which surface most closely resembles a conventional space-filling model? What does this tell you about the kinds of molecules which were used to establish the space-filling radius of lithium?
2. Build methyl anion, CH3–, ammonia, NH3, and hydronium cation,
H3O+, in a single document.
To build hydronium cation, start from ammonia, move to the inorganic model kit, select oxygen from the Periodic Table and double click on nitrogen.
Specify calculation of Equilibrium Geometry using the wB97X-D/ 6-31G* model. Adjust the total charge for methyl anion and hydronium cation. Finally, request calculation of a density surface for all three molecules. When the calculations have completed, place all three density surfaces side-by-side on screen. Which is smallest? Which is largest? How does size relate to the total number of electrons? How does it relate to the total nuclear charge?

3
2The Changing Nature
of HydrogenWhat is the charge on hydrogen in a molecule? We tend to think of hydrogen as “neutral” or nearly so in hydrocarbons, while we give it a partial positive charge in a molecule like hydrogen fluoride and a partial negative charge in a molecule like sodium hydride. This is conveyed in our chemical nomenclature “sodium hydride”, meaning like H–.
Is hydrogen unique among the elements in that it is able (and willing) to change its “personality” to reflect its chemical environment? Are the changes as large as the nomenclature suggests “protic to hydridic” or are they much more subtle? Can we detect and “measure” any changes with the tools available to us? These are questions which you will explore in this lab activity.
1. One after another, build hydrogen molecule and the one-heavy-atom hydrides of first-row elements: LiH, BeH2 (linear), BH3 (trigonal planar), CH4 (tetrahedral), NH3 (trigonal pyramidal), H2O (bent) and HF in a single document, and obtain Equilibrium Geometries using the HF/6-31G* model.
Use the inorganic model kit to construct LiH, BeH2 and BH3.
Is there a correlation between the calculated charges on hydrogen in the first-row hydrides and the difference in electronegativity between hydrogen and the first-row element? Use the electronegativities tabulated below.
H 2.2 Li 1.0 Be 1.6 B 2.0C 2.6 N 3.0 O 3.4 F 4.0

4
2. Request an electron density surface for each of the molecules. This reflects the overall “size” of the molecule as well as the size of hydrogen inside the molecule. Display the surfaces side-by-side on screen to allow visual comparison. Do you see a trend in the size of hydrogen as you move from lithium hydride to hydrogen fluoride? If so, for which molecule is hydrogen the smallest? For which is it the largest? Are your results consistent with the previous characterization of hydrogen as taking on “protic” or “hydridic” identity depending on the environment? Elaborate.
While you cannot calculate the electron density for proton (there are no electrons), you can for the hydride anion, H–. “Build” H–, calculate its Energy using the HF/6-31G* model as well as surface of electron density. How does the size of hydride anion compare with the “largest hydrogen” in your compounds? What does this say about the extent to which the bond in this compound has dissociated into ions?
3. Request an electrostatic potential map for each of the molecules. This reflects the distribution of charge, the color red meaning excess negative charge and the color blue meaning excess positive charge. Display the maps side-by-side on screen to allow visual comparison. “Measure” the maximum (or minimum) value of the electrostatic potential at hydrogen in each of the compounds.
Bring up the Surface Properties dialog by selecting Properties from the Display menu and clicking on a surface. Click the Reset M/M button to examine the min. and max. values for range rather than the default range.
Is there a correlation between maximum (minimum) potential at hydrogen and difference in electronegativity between the two atoms which make up the bond?
5
3Too Few Electrons
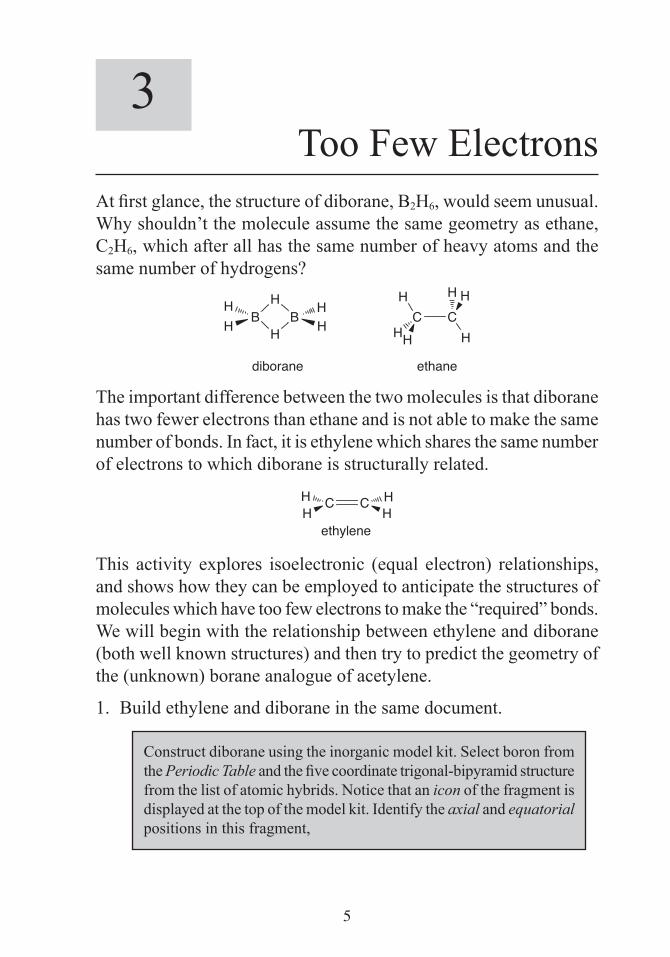
At first glance, the structure of diborane, B2H6, would seem unusual. Why shouldn’t the molecule assume the same geometry as ethane, C2H6, which after all has the same number of heavy atoms and the same number of hydrogens?
HB
HB
HHH
HC C
diborane
H
H
H
HH
H
ethane
The important difference between the two molecules is that diborane has two fewer electrons than ethane and is not able to make the same number of bonds. In fact, it is ethylene which shares the same number of electrons to which diborane is structurally related.
C C
ethyleneH H
HH
This activity explores isoelectronic (equal electron) relationships, and shows how they can be employed to anticipate the structures of molecules which have too few electrons to make the “required” bonds. We will begin with the relationship between ethylene and diborane (both well known structures) and then try to predict the geometry of the (unknown) borane analogue of acetylene.
1. Build ethylene and diborane in the same document.
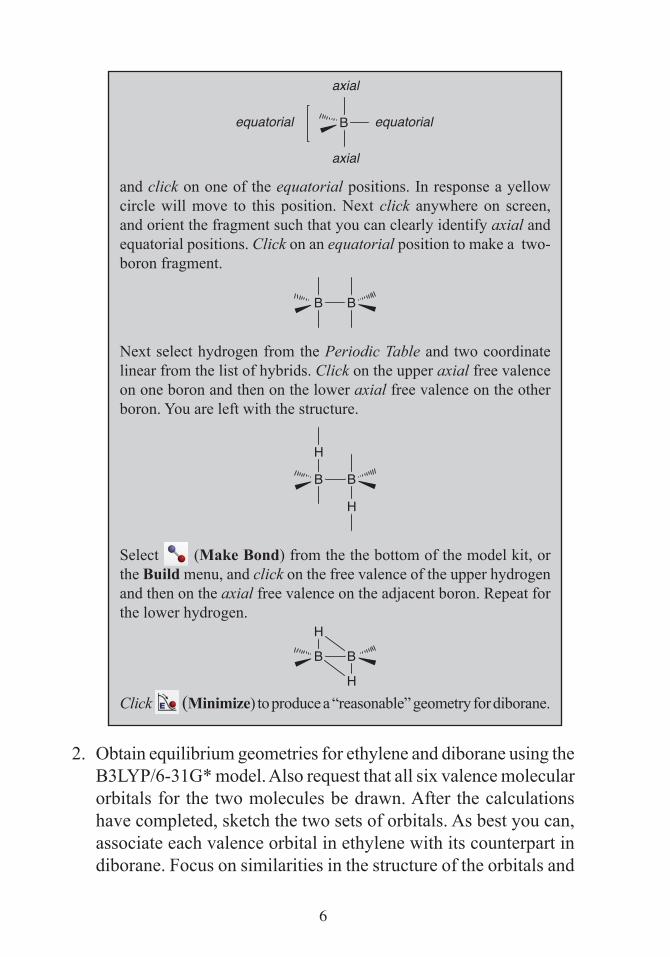
Construct diborane using the inorganic model kit. Select boron from the Periodic Table and the five coordinate trigonal-bipyramid structure from the list of atomic hybrids. Notice that an icon of the fragment is displayed at the top of the model kit. Identify the axial and equatorial positions in this fragment,
6
B
axial
equatorial
axial
equatorial
and click on one of the equatorial positions. In response a yellow circle will move to this position. Next click anywhere on screen, and orient the fragment such that you can clearly identify axial and equatorial positions. Click on an equatorial position to make a two-boron fragment.
B B
Next select hydrogen from the Periodic Table and two coordinate linear from the list of hybrids. Click on the upper axial free valence on one boron and then on the lower axial free valence on the other boron. You are left with the structure.
B
H
B
H
Select (Make Bond) from the the bottom of the model kit, or the Build menu, and click on the free valence of the upper hydrogen and then on the axial free valence on the adjacent boron. Repeat for the lower hydrogen.
B
H
B
HClick (Minimize) to produce a “reasonable” geometry for diborane.
2. Obtain equilibrium geometries for ethylene and diborane using the B3LYP/6-31G* model. Also request that all six valence molecular orbitals for the two molecules be drawn. After the calculations have completed, sketch the two sets of orbitals. As best you can, associate each valence orbital in ethylene with its counterpart in diborane. Focus on similarities in the structure of the orbitals and
7
not on their “position” in the lists of orbitals. To what orbital in diborane does the π orbital in ethylene (the HOMO) best relate? How would you describe this orbital in diborane? Is it BB bonding, BH bonding or both?
3. Build acetylene, C2H2, and optimize its geometry using the B3LYP/ 6-31G* model. Request all valence molecular orbitals be drawn. On the basis of the orbital shapes (for acetylene) and on your experience with diborane, suggest at least two “plausible” geometries for the hypothetical molecule B2H4. Build each, (use techniques similar to those you used to build diborane) calculate its Equilibrium Geometry using the B3LYP/6-31G* model and request all valence molecular orbitals. Also request calculation of the infrared spectrum.
Of the possible geometries you suggested, which is favored energetically? Is this structure actually a minimum on the energy surface? To tell, examine the infrared spectrum for the existence of imaginary frequencies (see the topic “Potential Energy Surfaces”). Are any or all of your other selections also energy minima? Sketch the molecular orbitals of your preferred B2H4 geometry alongside those of acetylene and, as best you can, pair them up. Pay particular attention to the orbitals relating to the two π bonds in acetylene.
8
4Too Many Electrons
What happens to electron pairs which are “left over” after all bonds have been formed? Is each electron pair primarily associated with a single atom and directed tetrahedrally from this atom as implied by Lewis structures, or is it “spread out”? Are these extra pairs (“lone pairs”) just “hangers on”, or do they contribute to (or even dominate) the “chemistry”.
In this lab activity you will examine molecules with “too many electrons” (the exact opposite you did in the previous activity “Too Few Electrons”). You will use electrostatic potential surfaces to probe where these extra (non-bonded) electrons reside and try to associate what you find with conventional (Lewis) structures.
1. Build ammonia, water and hydrogen fluoride in the same document. Request Equilibrium Geometries using the wB97X-D/6-31G* model. Before you submit for calculation, also request calculation of electrostatic potential surfaces for the three molecules (add potential from More Surfaces dialog from the Surfaces dialog). The requested isosurfaces correspond to an electrostatic potential isovalue of -80 kJ/mol. These will demark the highly electron-rich regions for the three molecules.
After the calculations have completed, display all three potential surfaces side-by-side on screen.
Bring up the spreadsheet. Check the box to the left of the first (“Label”) column for each molecule. You also need to deselect (uncheck) Coupled from the Model menu in order to “uncouple” the motions of the three molecules so that you can move them independently.
Describe the three surfaces and relate them to the conventional Lewis structures.
9
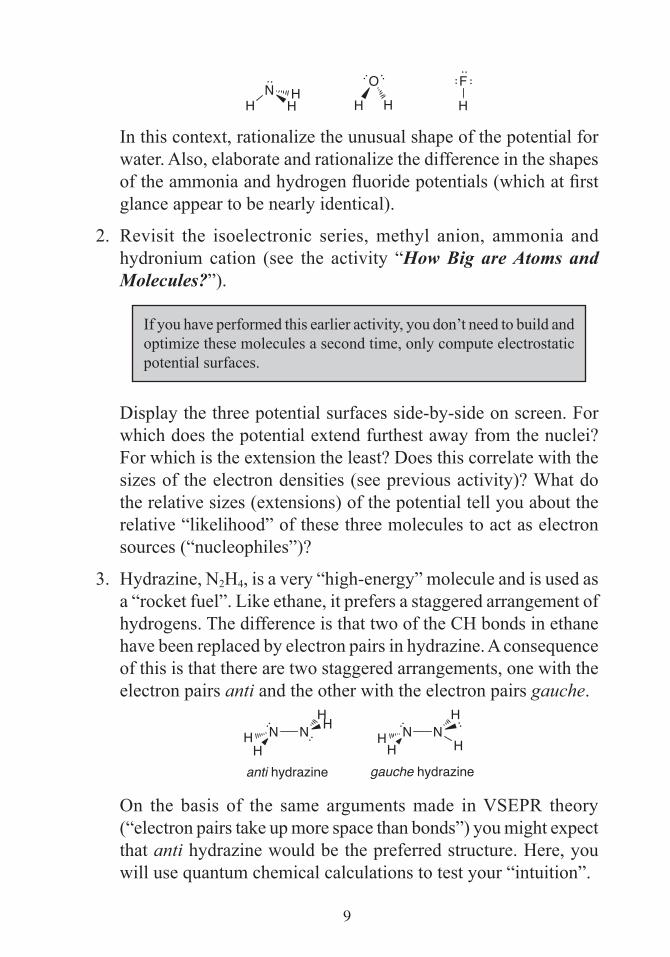
N O
HHH HH
F
H
In this context, rationalize the unusual shape of the potential for water. Also, elaborate and rationalize the difference in the shapes of the ammonia and hydrogen fluoride potentials (which at first glance appear to be nearly identical).
2. Revisit the isoelectronic series, methyl anion, ammonia and hydronium cation (see the activity “How Big are Atoms and Molecules?”).
If you have performed this earlier activity, you don’t need to build and optimize these molecules a second time, only compute electrostatic potential surfaces.
Display the three potential surfaces side-by-side on screen. For which does the potential extend furthest away from the nuclei? For which is the extension the least? Does this correlate with the sizes of the electron densities (see previous activity)? What do the relative sizes (extensions) of the potential tell you about the relative “likelihood” of these three molecules to act as electron sources (“nucleophiles”)?
3. Hydrazine, N2H4, is a very “high-energy” molecule and is used as a “rocket fuel”. Like ethane, it prefers a staggered arrangement of hydrogens. The difference is that two of the CH bonds in ethane have been replaced by electron pairs in hydrazine. A consequence of this is that there are two staggered arrangements, one with the electron pairs anti and the other with the electron pairs gauche.
N NHHH N N
HH
H
H
anti hydrazine gauche hydrazineH
On the basis of the same arguments made in VSEPR theory (“electron pairs take up more space than bonds”) you might expect that anti hydrazine would be the preferred structure. Here, you will use quantum chemical calculations to test your “intuition”.
10
Build both anti and gauche hydrazine in the same document. Request Equilibrium Geometries using the wB97X-D/ 6-31G** model. Also request calculation of electrostatic potential surfaces.
With hydrazine on screen (in the builder), you can rotate about the NN bond by first clicking on it (a red arrow will ring the bond; if the ring disappears, click again), and then moving the mouse “up and down” inside the shaded area at the left of the screen. Rotate into the proper (anti or gauche) structure and then select Minimize from the Build menu to give a better geometry. The anti structure will have C2h symmetry and the gauche structure will have C2 symmetry.
After the calculations have completed, examine the energies for the two molecules from the Molecule Properties dialog. Which is favored? By how much? Is this result in accord with what you would expect from VSEPR theory?
The energy will be given in atomic units (au). To convert to kJ/mol, multiply by 2625. The HOMO energy (in eV) which will be needed below is also available in this dialog. To convert from eV (electron volts) to kJ/mol, multiply by 96.49.
Examine the two potential surfaces side-by-side on screen. Is there a noticeable difference in the extent to which the two electron pairs interact (“delocalize”) between the two conformers? If so, is the “more delocalized” conformer lower or higher in energy than the “less delocalized” conformer?
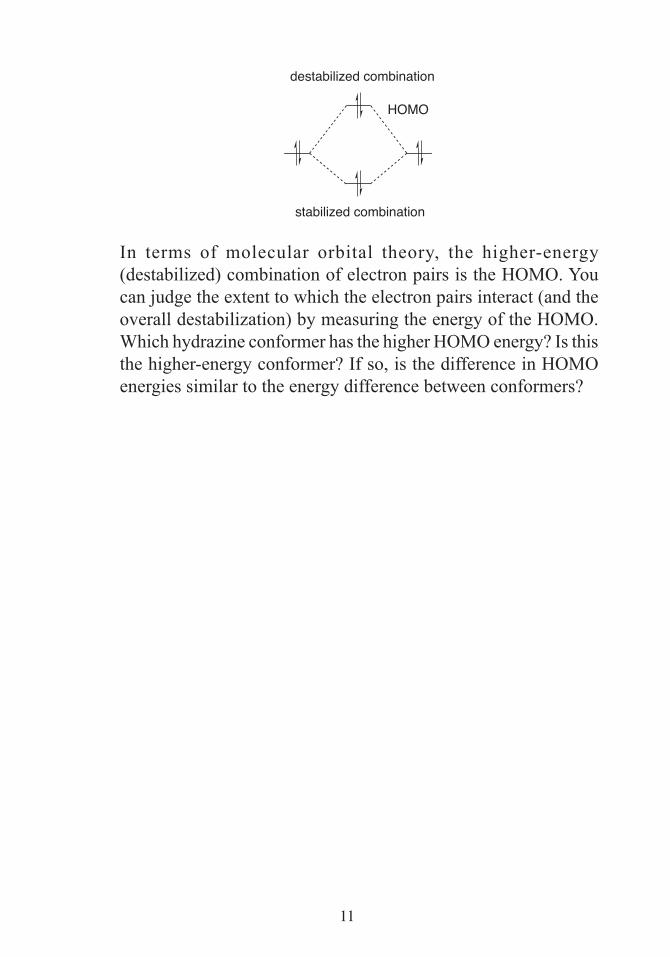
You can rationalize your result by recognizing that when electron pairs interact they form combinations, one of which is stabilized (relative to the original electron pairs) and one of which is destabilized. Destabilization is greater than stabilization, meaning that overall interaction of two electron pairs is unfavorable energetically.
11
HOMO
stabilized combination
destabilized combination
In terms of molecular orbital theory, the higher-energy (destabilized) combination of electron pairs is the HOMO. You can judge the extent to which the electron pairs interact (and the overall destabilization) by measuring the energy of the HOMO. Which hydrazine conformer has the higher HOMO energy? Is this the higher-energy conformer? If so, is the difference in HOMO energies similar to the energy difference between conformers?
12
5Removing and
Adding ElectronsMolecular orbital theory leads to a description of a molecule in which electrons are assigned (in pairs) to functions called molecular orbitals, which in turn are made up of combinations of atom-centered functions called atomic orbitals. Except where “core” electrons are involved, molecular orbitals are typically delocalized throughout the molecule and show distinct bonding or antibonding character. Loss of an electron from a specific molecular orbital (from excitation by light or by ionization) would, therefore, be expected to lead to distinct changes in bonding and changes in molecular geometry.
Not all molecular orbitals are occupied. This is because there are more than enough atomic orbitals to make the number of molecular orbitals needed to hold all the electrons. “Left-over combinations” or unoccupied molecular orbitals are also delocalized and also show distinct bonding or antibonding character. Normally, this is of no consequence. However, were these orbitals to become occupied (from excitation or from capture of an electron), then changes in molecular geometry would also be expected.
In this lab activity, you will examine the highest-occupied molecular orbital (the HOMO) and the lowest-unoccupied molecular orbital (the LUMO) for a number of simple molecules and try to “guess” what changes in geometry would occur from electron removal from the former and electron addition to the latter. You will then obtain geometries for the radical cation (electron removal) and radical anion (electron addition) for each of the molecules to see how successful your guesses were. Finally, you will attempt to rationalize the observed geometry of the first excited state of a simple molecule.
1. Build ethylene, H2C=CH2, formaldimine, H2C=NH, and
13
formaldehyde, H2C=O in a single document. Obtain Equilibrium Geometries using the wB97X-D/6-31G* model and following this request HOMO and LUMO surfaces.
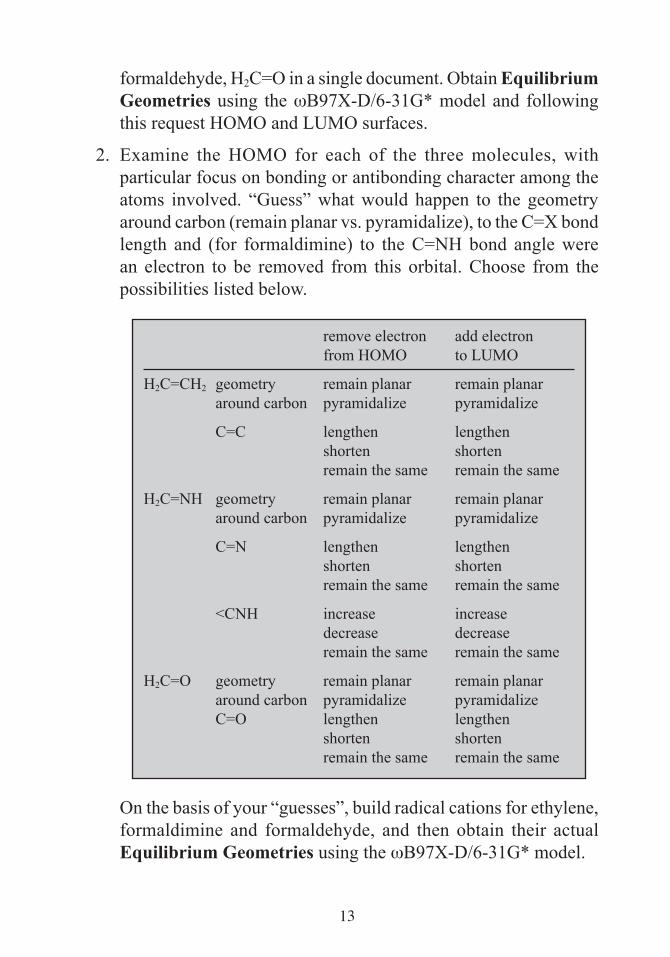
2. Examine the HOMO for each of the three molecules, with particular focus on bonding or antibonding character among the atoms involved. “Guess” what would happen to the geometry around carbon (remain planar vs. pyramidalize), to the C=X bond length and (for formaldimine) to the C=NH bond angle were an electron to be removed from this orbital. Choose from the possibilities listed below.
remove electron add electron from HOMO to LUMO
H2C=CH2 geometry remain planar remain planar around carbon pyramidalize pyramidalize
C=C lengthen lengthen shorten shorten remain the same remain the same
H2C=NH geometry remain planar remain planar around carbon pyramidalize pyramidalize
C=N lengthen lengthen shorten shorten remain the same remain the same
<CNH increase increase decrease decrease remain the same remain the same
H2C=O geometry remain planar remain planar around carbon pyramidalize pyramidalize C=O lengthen lengthen shorten shorten remain the same remain the same
On the basis of your “guesses”, build radical cations for ethylene, formaldimine and formaldehyde, and then obtain their actual Equilibrium Geometries using the wB97X-D/6-31G* model.

14
Inside the Calculations dialog, set Total Charge to Cation (+1) and Unpaired Electrons to 1.
Are the calculated structures in line with what you expect? Elaborate.
3. Examine the LUMO for each of the three molecules. Guess what would happen to the geometry around carbon, C=X bond length and (for formaldimine) the C=NH bond angle were an electron to be added to this orbital. Choose from the possibilities listed on the previous page.
On the basis of your “guesses”, build radical anions for ethylene, formaldimine and formaldehyde, and then obtain their actual equilibrium geometries using the wB97X-D/6-31G* model.
Inside the Calculations dialog, set Total Charge to Anion (-1) and Unpaired Electrons to 1.
Are the calculated structures in line with what you expect? Elaborate.
4. The first excited state of formaldehyde (the so-called n→π* state) can be thought of as arising from the “promotion” of one electron from the HOMO (in the ground-state of formaldehyde) to the LUMO. The experimental equilibrium geometry of the molecule shows lengthening of the CO bond and a pyramidal carbon geometry (ground-state values in parentheses).
C O
HH
1.32Å (1.21Å)
154° (180°)
Rationalize this experimental result on the basis of what you know about the HOMO and LUMO in formaldehyde and your experience with calculations on the radical cation and radical anion of formaldehyde.
15
6Water
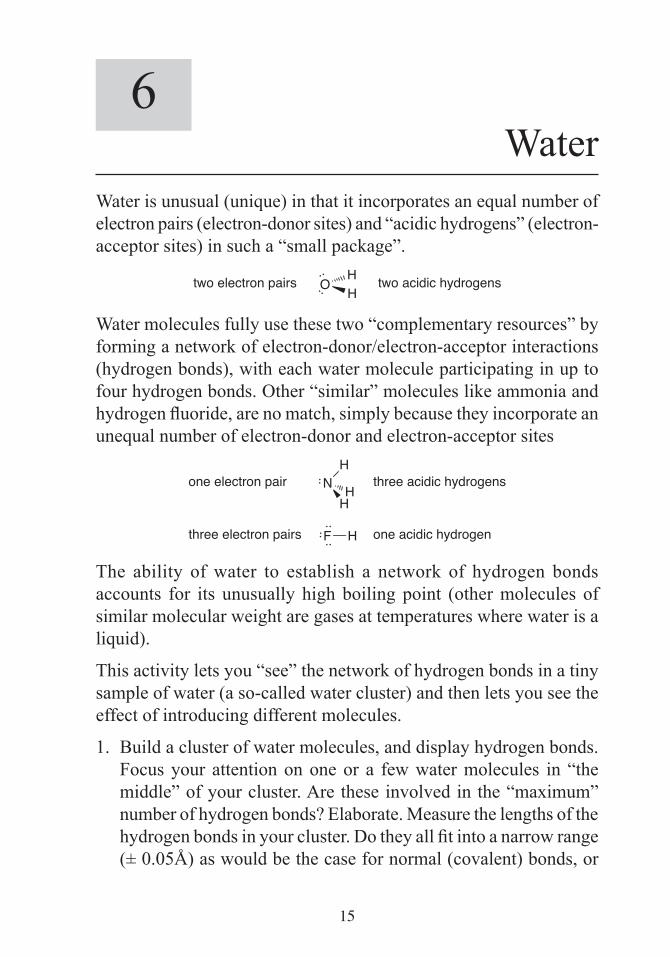
Water is unusual (unique) in that it incorporates an equal number of electron pairs (electron-donor sites) and “acidic hydrogens” (electron-acceptor sites) in such a “small package”.
two electron pairs OHH
two acidic hydrogens
Water molecules fully use these two “complementary resources” by forming a network of electron-donor/electron-acceptor interactions (hydrogen bonds), with each water molecule participating in up to four hydrogen bonds. Other “similar” molecules like ammonia and hydrogen fluoride, are no match, simply because they incorporate an unequal number of electron-donor and electron-acceptor sites
one electron pair N three acidic hydrogensH
HH
three electron pairs F one acidic hydrogenH
The ability of water to establish a network of hydrogen bonds accounts for its unusually high boiling point (other molecules of similar molecular weight are gases at temperatures where water is a liquid).
This activity lets you “see” the network of hydrogen bonds in a tiny sample of water (a so-called water cluster) and then lets you see the effect of introducing different molecules.
1. Build a cluster of water molecules, and display hydrogen bonds. Focus your attention on one or a few water molecules in “the middle” of your cluster. Are these involved in the “maximum” number of hydrogen bonds? Elaborate. Measure the lengths of the hydrogen bonds in your cluster. Do they all fit into a narrow range (± 0.05Å) as would be the case for normal (covalent) bonds, or
16
do they show more widely ranging behavior? Is what you observe consistent with the fact that hydrogen bonds are much weaker than covalent bonds? Elaborate.
Display your water cluster as a space-filling model. This provides an alternative view of hydrogen bonding (spheres representing hydrogens “interpenatrating” into spheres representing oxygens). It also gives an “impression” of how much “space” is left in a sample of liquid water. Describe what you see (with regard to spacing).
2. Add a molecule of ammonia into (the center of) your cluster and minimize the energy. How many hydrogen bonds are there to the ammonia molecule which you added? On average, how many hydrogen bonds are there to the water molecules immediately surrounding the ammonia molecule? Does the situation appear to be similar or different from that for the “pure” water cluster? Has your cluster noticeably expanded or contracted in the vicinity of ammonia? (Look at a space-filling model.) Would you expect water to dissolve ammonia? Elaborate.
3. Replace ammonia by methane and minimize the energy.
Select sp3 carbon from the organic model kit and double click on the nitrogen of ammonia in your cluster.
Has the cluster noticeably expanded or contracted in the vicinity of methane? Rationalize your result in terms of changes in hydrogen bonding (relative to the “pure” water cluster). Would you expect water to dissolve methane?
17
7Beyond VSEPR Theory
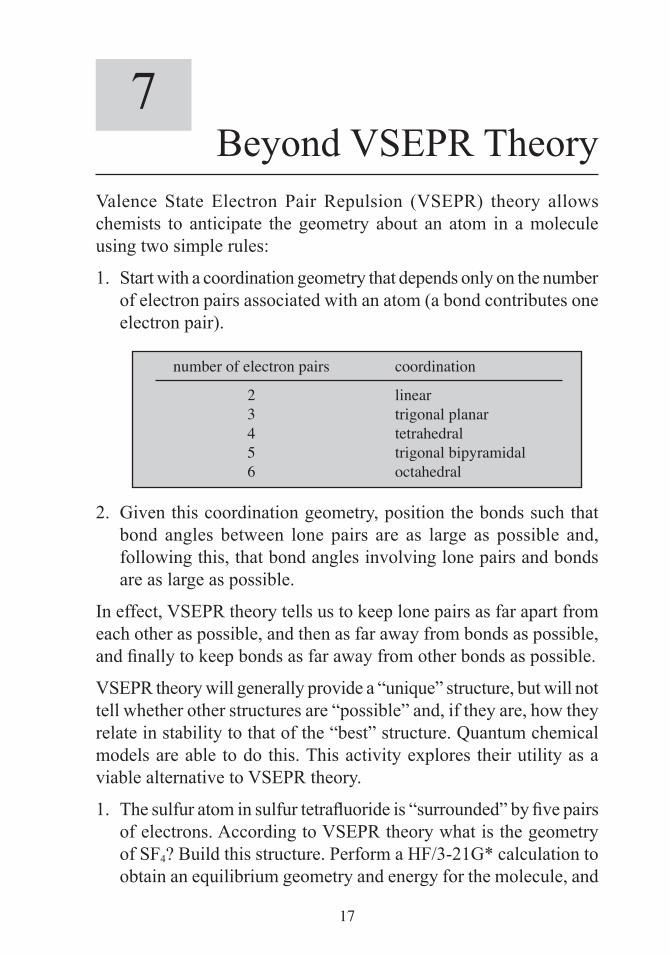
Valence State Electron Pair Repulsion (VSEPR) theory allows chemists to anticipate the geometry about an atom in a molecule using two simple rules:
1. Start with a coordination geometry that depends only on the number of electron pairs associated with an atom (a bond contributes one electron pair).
number of electron pairs coordination
2 linear 3 trigonal planar 4 tetrahedral 5 trigonal bipyramidal 6 octahedral
2. Given this coordination geometry, position the bonds such that bond angles between lone pairs are as large as possible and, following this, that bond angles involving lone pairs and bonds are as large as possible.
In effect, VSEPR theory tells us to keep lone pairs as far apart from each other as possible, and then as far away from bonds as possible, and finally to keep bonds as far away from other bonds as possible.
VSEPR theory will generally provide a “unique” structure, but will not tell whether other structures are “possible” and, if they are, how they relate in stability to that of the “best” structure. Quantum chemical models are able to do this. This activity explores their utility as a viable alternative to VSEPR theory.
1. The sulfur atom in sulfur tetrafluoride is “surrounded” by five pairs of electrons. According to VSEPR theory what is the geometry of SF4? Build this structure. Perform a HF/3-21G* calculation to obtain an equilibrium geometry and energy for the molecule, and

18
request an infrared spectrum.
While you are waiting for the calculation to complete, propose an additional structure for SF4 which satisfies the “first rule” (good coordination geometry), but which does not fully satisfy the “second rule”. Note that the alternative structure dealt within the Inorganic and Organometallic Molecules tutorial does not even satisfy the first rule. Build your alternative structure and obtain its geometry, energy and infrared spectrum using the HF/3-21G model.
Examine the energies of both your preferred and alternative SF4 structures. Is the geometry of SF4 preferred by VSEPR theory that with the lower (more negative) total energy according to the calculations? If not, what is the HF/3-21G structure of sulfur tetrafluoride? If VSEPR and HF/3-21G models are in agreement with regard to the “best” structure for SF4, is the higher-energy alternative structure actually an energy minimum? Elaborate. Hint: look at the calculated infrared spectrum for imaginary frequencies (see the topic “Potential Energy Surfaces” for a discussion). If the second structure is an energy minimum, what would be the composition of an equilibrium mixture of the two forms at room temperature? Use a special case of the Boltzmann equation for only two molecules “in equilibrium” (see the topic “Total Energies and Thermodynamic and Kinetic Data” for a discussion).
A B
[A]/[B] = e–1060(E – E )A B
where [A]/[B] is the ratio of molecules A and B in equilibrium and EA and EB are their energies in atomic units.
2. The chlorine atom in chlorine trifluoride, like the sulfur in sulfur tetrafluoride, is “surrounded” by five pairs of electrons. Repeat the analysis you performed on SF4 for this molecule. Start with the structure that VSEPR theory suggests and look for stable alternatives. Do the VSEPR and quantum chemical models reach the same conclusion with regard to preferred structure? Does a stable alternative structure exist?

19
3. The xenon atom in xenon tetrafluoride (XeF4) is surrounded by six pairs of electrons. Repeat the analysis you performed on SF4 for this molecule. Start with the structure that VSEPR theory suggests and look for a stable alternative. Do the two models reach the same conclusion with regard to preferred structure? Is there a stable alternative structure?
4. According to VSEPR theory, xenon hexafluoride, XeF6, is not octahedral. Why not? How many pairs of electrons are associated with xenon in XeF6? Does VSEPR theory tell you what the structure should actually be? “Ask” the quantum chemical calculations by starting out with a six-coordinate structure which has been distorted from octahedral.
Build octahedral XeF6 using the inorganic model kit. Set several of the FXeF bond angles to “non 90º” values. For each, select Measure Angle from the Geometry menu, select a FXeF bond angle, replace the 90° value which appears at the bottom of the screen by a different value and press the Enter key (return key for the Mac). Do not minimize in the builder or your structure will revert back to octahedral symmetry.
Obtain an equilibrium geometry using the HF/3-21G model. This may require several minutes as your “guess” is likely not very close to the real equilibrium structure. Is the resulting XeF6 geometry distorted from octahedral in accord with the prediction of VSEPR theory?
To get an estimate of the energy gained by distorting XeF6, build octahedral XeF6 and obtain its equilibrium geometry using the HF/3-21G model. Also request an infrared spectrum. This calculation will also require several minutes. When completed, compare the energy of this structure with that of the non-octahedral form above. How much stabilization has been gained as a result of distortion? How does this energy difference compare with those you obtained earlier in examining different structures of SF4, ClF3 and XeF4?
20
Examine the infrared spectrum of octahedral XeF6. Does it show any imaginary frequencies? What does this tell you about whether octahedral XeF6 is an energy minimum on the overall energy surface? If there are imaginary frequencies, animate their motions. Is the direction of the vibrational motion (away from an octahedral geometry) consistent with the non-octahedral structure you located?

21
8Bond Angles in
Main-Group HydridesThe HNH bond angles in ammonia are 106.7°, somewhat less than the tetrahedral values (109.5°). So too is the HOH bond angle in water (104.5°). These data are usually rationalized by suggesting that the lone pair on nitrogen and the two lone pairs on oxygen “take up more space” than NH and OH bonds, respectively (see the activity “Too Many Electrons”). As seen from the experimental data in the table below, HXH bond angles in second-row and heavier main-group analogies of ammonia and water deviate even more from “ideal” tetrahedral values.
NH3 106.7 H2O 104.5PH3 93.3 H2S 92.1AsH3 92.1 H2Se 90.6SbH3 91.6 H2Te 90.3
Is this further reduction in bond angle due to increased size of lone pairs on the heavy elements or are other factors involved? You will explore the question in this activity.
1. Build the eight hydrides listed above and obtain the equilibrium geometry of each using the HF/6-31G* model. Do the calculations show the same trend in bond angles as seen in the experimental data? Point out any significant exceptions.
2. Calculate and display electrostatic potential surfaces for all the hydrides. Select Surfaces from the Display menu. Click on More Surfaces... and choose the Surface of potential. Click the OK button. Click on the graphical surface and select Properties from the Display menu. Set the isovalue to -40 kJ/mol. What is the ordering of sizes of lone pairs (as indicated by the electrostatic potential surfaces) in the series NH3, PH3, AsH3, SbH3? In the series H2O, H2S, H2Se, H2Te?
22
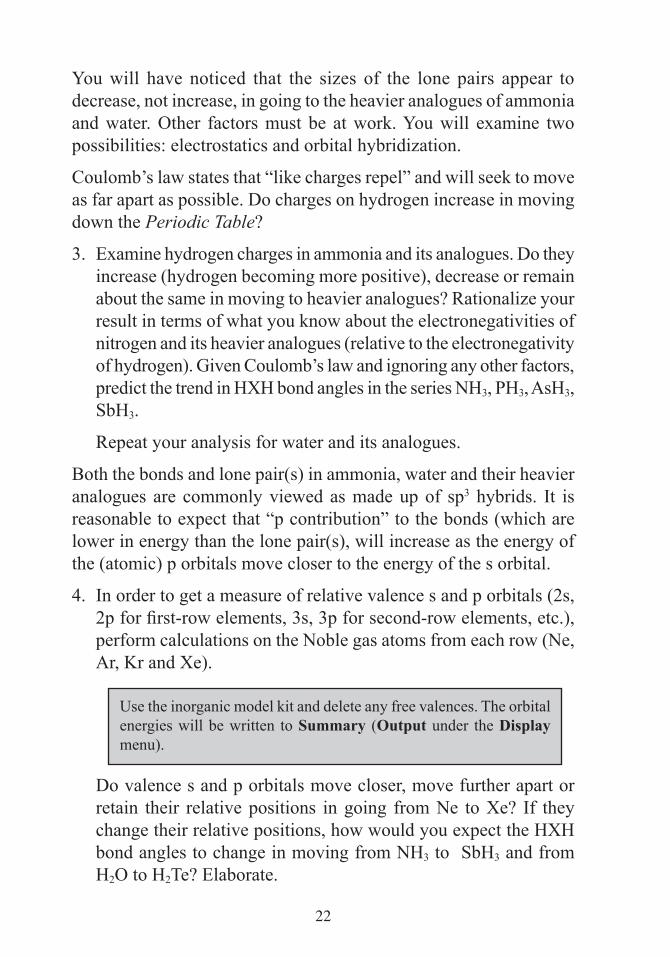
You will have noticed that the sizes of the lone pairs appear to decrease, not increase, in going to the heavier analogues of ammonia and water. Other factors must be at work. You will examine two possibilities: electrostatics and orbital hybridization.
Coulomb’s law states that “like charges repel” and will seek to move as far apart as possible. Do charges on hydrogen increase in moving down the Periodic Table?
3. Examine hydrogen charges in ammonia and its analogues. Do they increase (hydrogen becoming more positive), decrease or remain about the same in moving to heavier analogues? Rationalize your result in terms of what you know about the electronegativities of nitrogen and its heavier analogues (relative to the electronegativity of hydrogen). Given Coulomb’s law and ignoring any other factors, predict the trend in HXH bond angles in the series NH3, PH3, AsH3, SbH3.
Repeat your analysis for water and its analogues.
Both the bonds and lone pair(s) in ammonia, water and their heavier analogues are commonly viewed as made up of sp3 hybrids. It is reasonable to expect that “p contribution” to the bonds (which are lower in energy than the lone pair(s), will increase as the energy of the (atomic) p orbitals move closer to the energy of the s orbital.
4. In order to get a measure of relative valence s and p orbitals (2s, 2p for first-row elements, 3s, 3p for second-row elements, etc.), perform calculations on the Noble gas atoms from each row (Ne, Ar, Kr and Xe).
Use the inorganic model kit and delete any free valences. The orbital energies will be written to Summary (Output under the Display menu).
Do valence s and p orbitals move closer, move further apart or retain their relative positions in going from Ne to Xe? If they change their relative positions, how would you expect the HXH bond angles to change in moving from NH3 to SbH3 and from H2O to H2Te? Elaborate.
23
9Bond Lengths
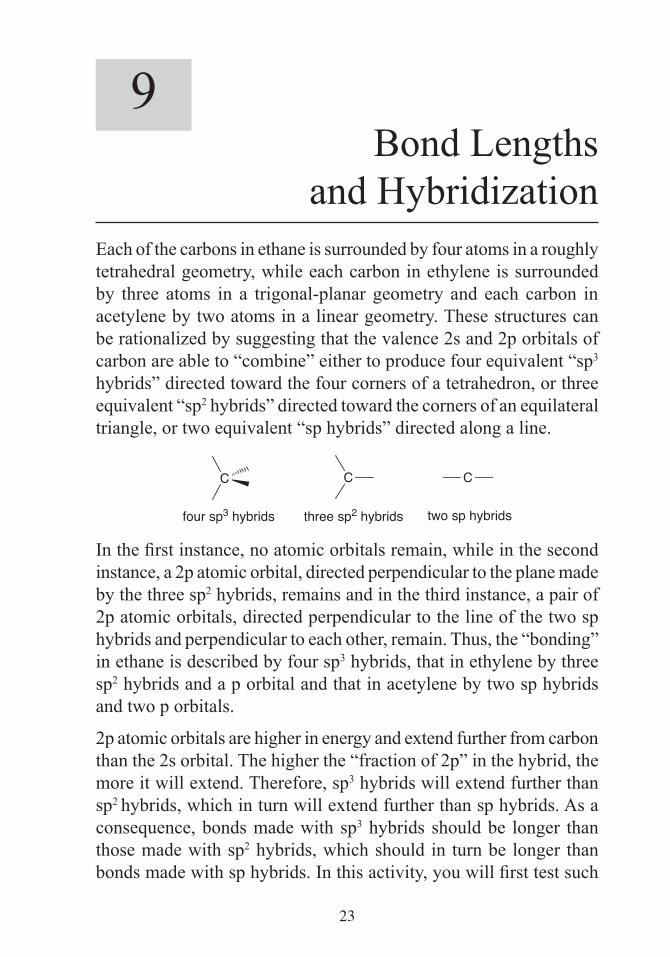
and HybridizationEach of the carbons in ethane is surrounded by four atoms in a roughly tetrahedral geometry, while each carbon in ethylene is surrounded by three atoms in a trigonal-planar geometry and each carbon in acetylene by two atoms in a linear geometry. These structures can be rationalized by suggesting that the valence 2s and 2p orbitals of carbon are able to “combine” either to produce four equivalent “sp3 hybrids” directed toward the four corners of a tetrahedron, or three equivalent “sp2 hybrids” directed toward the corners of an equilateral triangle, or two equivalent “sp hybrids” directed along a line.
C C C
four sp3 hybrids three sp2 hybrids two sp hybrids
In the first instance, no atomic orbitals remain, while in the second instance, a 2p atomic orbital, directed perpendicular to the plane made by the three sp2 hybrids, remains and in the third instance, a pair of 2p atomic orbitals, directed perpendicular to the line of the two sp hybrids and perpendicular to each other, remain. Thus, the “bonding” in ethane is described by four sp3 hybrids, that in ethylene by three sp2 hybrids and a p orbital and that in acetylene by two sp hybrids and two p orbitals.
2p atomic orbitals are higher in energy and extend further from carbon than the 2s orbital. The higher the “fraction of 2p” in the hybrid, the more it will extend. Therefore, sp3 hybrids will extend further than sp2 hybrids, which in turn will extend further than sp hybrids. As a consequence, bonds made with sp3 hybrids should be longer than those made with sp2 hybrids, which should in turn be longer than bonds made with sp hybrids. In this activity, you will first test such
24
an hypothesis and explore its generality. Finally, you will search for a molecule with a very short carbon-carbon single bond.
1. Build ethane, ethylene, and acetylene in a single document. Obtain B3LYP/6-31G* equilibrium geometries for all three molecules. Is the ordering in CH bond lengths what you expect on the basis of the hybridization arguments presented above? Using the CH bond length in ethane as a standard, what is the % reduction in CH bond lengths in ethylene? In acetylene? Is there a rough correlation between % reduction in bond length and % of 2p in the hybrid?
2. Obtain the B3LYP/6-31G* equilibrium geometry for cyclopropane and measure the CH bond length. Based on your experience from #1 (above), would you say that the carbons are sp3 hybridized? Elaborate.
3. Choose one or more of the following sets of molecules: propane, propene and propyne or fluoroethane, fluoroethylene and fluoroacetylene or chloroethane, chloroethylene and chloroacetylene. Build all molecules in the set and again obtain B3LYP/ 6-31G* equilibrium geometries. When completed, measure the C–C (C–F or C–Cl) bond lengths.
Is the ordering of bond lengths the same as that observed for the CH bond lengths in ethane, ethylene and acetylene? Are the % reductions in bond lengths from the appropriate standards (propane, fluorethane and chloroethane) similar (±10%) to those seen for ethylene and acetylene (relative to ethane)?
4. How short can a carbon-carbon single bond be? Propose one or more “shortest bond” candidates and perform wB97X-D/6-31G* calculations. (You might find several of your “candidates” in the spectra and properties database (SSPD) supplied with Spartan. Look for the molecule name at the bottom of the screen.) Is your shortest carbon-carbon single bond shorter or longer than the typical carbon-carbon double bond?
25
10Dipole Moments
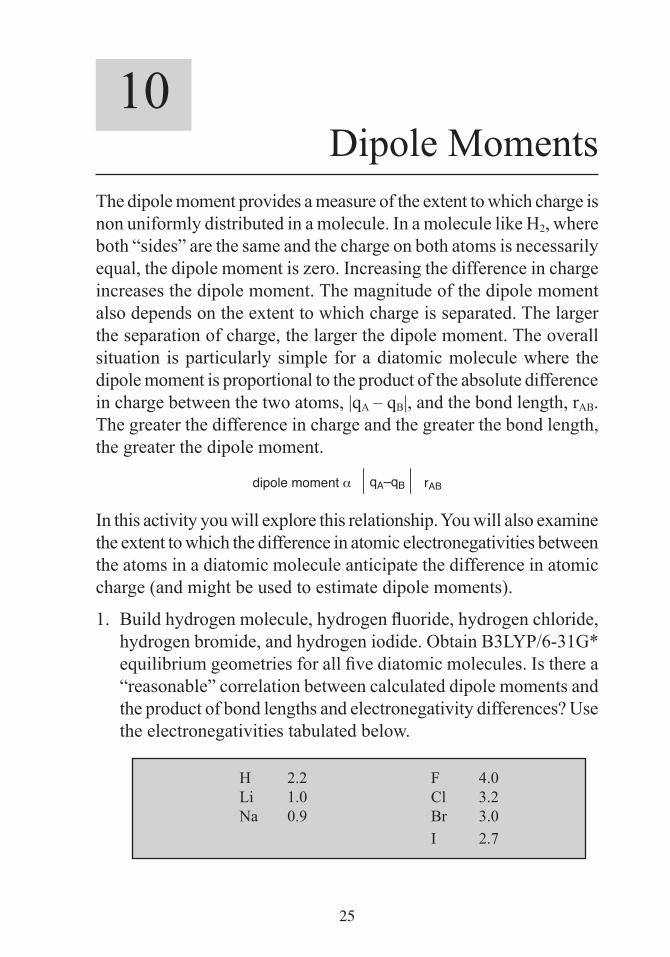
The dipole moment provides a measure of the extent to which charge is non uniformly distributed in a molecule. In a molecule like H2, where both “sides” are the same and the charge on both atoms is necessarily equal, the dipole moment is zero. Increasing the difference in charge increases the dipole moment. The magnitude of the dipole moment also depends on the extent to which charge is separated. The larger the separation of charge, the larger the dipole moment. The overall situation is particularly simple for a diatomic molecule where the dipole moment is proportional to the product of the absolute difference in charge between the two atoms, |qA – qB|, and the bond length, rAB. The greater the difference in charge and the greater the bond length, the greater the dipole moment.
dipole moment α qA–qB rAB
In this activity you will explore this relationship. You will also examine the extent to which the difference in atomic electronegativities between the atoms in a diatomic molecule anticipate the difference in atomic charge (and might be used to estimate dipole moments).
1. Buildhydrogenmolecule,hydrogenfluoride,hydrogenchloride,hydrogen bromide, and hydrogen iodide. Obtain B3LYP/6-31G* equilibriumgeometriesforallfivediatomicmolecules.Istherea“reasonable” correlation between calculated dipole moments and the product of bond lengths and electronegativity differences? Use the electronegativities tabulated below.
H 2.2 F 4.0 Li 1.0 Cl 3.2 Na 0.9 Br 3.0 I 2.7

26
If so, does the correlation properly reproduce the fact that the dipole moment in hydrogen is zero?
2. Repeat your analyses for the series: lithium hydride, lithium fluoride, lithium chloride, lithium bromide and lithium iodide and for the series: sodium hydride, sodium fluoride, sodium chloride, sodium bromide and sodium iodide.
You can use the inorganic model kit to build these molecules.

27
11Charges on Atoms
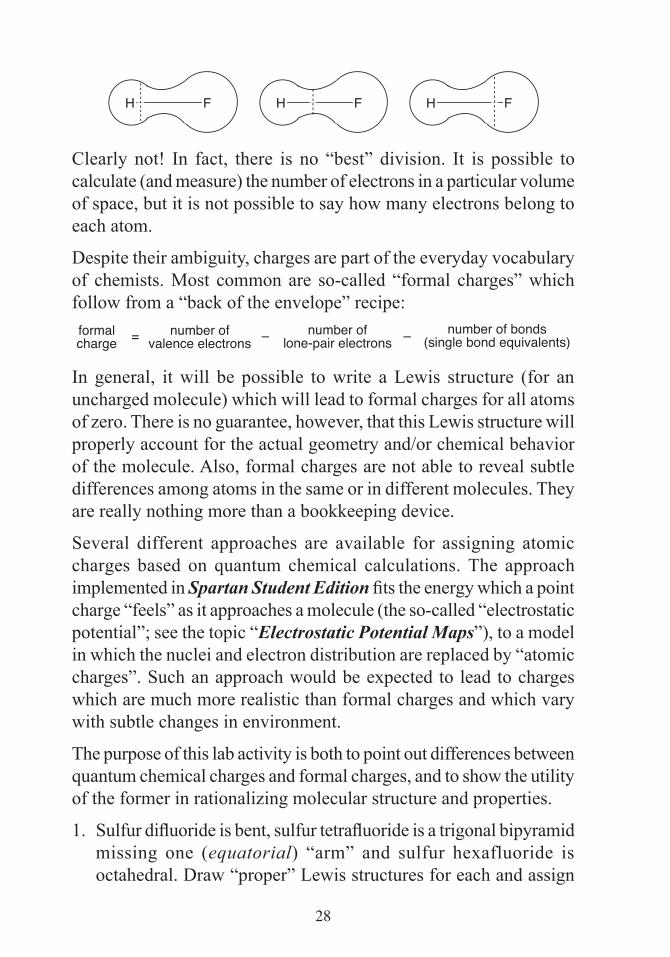
in MoleculesWhat is the charge on an individual atom in a molecule? Surprisingly, this is not a simple question. While the total charge on a molecule is well defined, being given as the sum of the nuclear charges (atomic numbers) minus the total number of electrons, defining charges on individual atoms requires accounting both for the nuclear charge and for the charge of any electrons uniquely “associated” with the particular atom. It is certainly reasonable to expect that the nuclear contribution to the total charge on an atom is simply the atomic number, but it is not at all obvious how to partition the total electron distribution by atoms. Consider, for example, the electron distribution for a simple diatomic molecule like hydrogen fluoride.
H F
Here, the surrounding “line” is a particular “isodensity surface” (see the topic “Electron Densities: Sizes and Shapes of Molecules”), that corresponding to a van der Waals surface and enclosing a large percentage of the total electron density. In this picture, the surface has been drawn to suggest that more electrons are associated with fluorine than with hydrogen. This is entirely reasonable, given the known polarity of the molecule, i.e., δ+H-Fδ-, and is evidenced experimentally by the direction of its dipole moment.
H F
However, it is not at all apparent how to divide this surface between the two nuclei. Are any of the divisions shown below better than the others?
28
H F H F H F
Clearly not! In fact, there is no “best” division. It is possible to calculate (and measure) the number of electrons in a particular volume of space, but it is not possible to say how many electrons belong to each atom.
Despite their ambiguity, charges are part of the everyday vocabulary of chemists. Most common are so-called “formal charges” which follow from a “back of the envelope” recipe:formalcharge
number ofvalence electrons
number oflone-pair electrons
number of bonds(single bond equivalents)= – –
In general, it will be possible to write a Lewis structure (for an uncharged molecule) which will lead to formal charges for all atoms of zero. There is no guarantee, however, that this Lewis structure will properly account for the actual geometry and/or chemical behavior of the molecule. Also, formal charges are not able to reveal subtle differences among atoms in the same or in different molecules. They are really nothing more than a bookkeeping device.
Several different approaches are available for assigning atomic charges based on quantum chemical calculations. The approach implemented in Spartan Student Edition fits the energy which a point charge “feels” as it approaches a molecule (the so-called “electrostatic potential”; see the topic “Electrostatic Potential Maps”), to a model in which the nuclei and electron distribution are replaced by “atomic charges”. Such an approach would be expected to lead to charges which are much more realistic than formal charges and which vary with subtle changes in environment.
The purpose of this lab activity is both to point out differences between quantum chemical charges and formal charges, and to show the utility of the former in rationalizing molecular structure and properties.
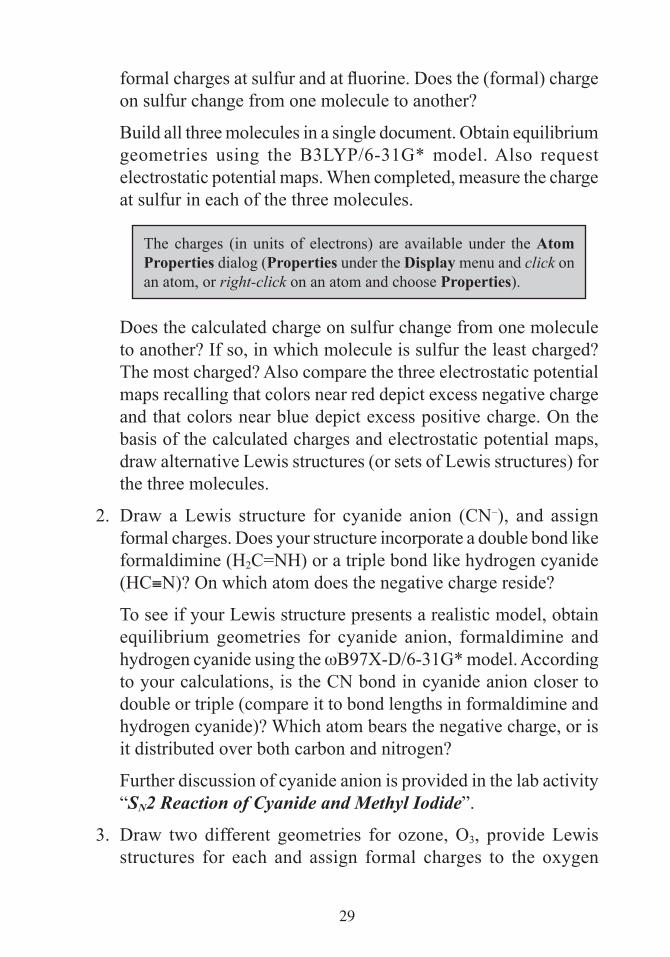
1. Sulfur difluoride is bent, sulfur tetrafluoride is a trigonal bipyramid missing one (equatorial) “arm” and sulfur hexafluoride is octahedral. Draw “proper” Lewis structures for each and assign
29
formal charges at sulfur and at fluorine. Does the (formal) charge on sulfur change from one molecule to another?
Build all three molecules in a single document. Obtain equilibrium geometries using the B3LYP/6-31G* model. Also request electrostatic potential maps. When completed, measure the charge at sulfur in each of the three molecules.
The charges (in units of electrons) are available under the Atom Properties dialog (Properties under the Display menu and click on an atom, or right-click on an atom and choose Properties).
Does the calculated charge on sulfur change from one molecule to another? If so, in which molecule is sulfur the least charged? The most charged? Also compare the three electrostatic potential maps recalling that colors near red depict excess negative charge and that colors near blue depict excess positive charge. On the basis of the calculated charges and electrostatic potential maps, draw alternative Lewis structures (or sets of Lewis structures) for the three molecules.
2. Draw a Lewis structure for cyanide anion (CN–), and assign formal charges. Does your structure incorporate a double bond like formaldimine (H2C=NH) or a triple bond like hydrogen cyanide (HC≡N)? On which atom does the negative charge reside?
To see if your Lewis structure presents a realistic model, obtain equilibrium geometries for cyanide anion, formaldimine and hydrogen cyanide using the wB97X-D/6-31G* model. According to your calculations, is the CN bond in cyanide anion closer to double or triple (compare it to bond lengths in formaldimine and hydrogen cyanide)? Which atom bears the negative charge, or is it distributed over both carbon and nitrogen?
Further discussion of cyanide anion is provided in the lab activity “SN2 Reaction of Cyanide and Methyl Iodide”.
3. Draw two different geometries for ozone, O3, provide Lewis structures for each and assign formal charges to the oxygen
30
atoms in each. Build both (in the same document) and obtain their equilibrium geometry using the wB97X-D/6-31G* model. Which of your structures is lower in energy? Is it in accord with the experimentally known equilibrium geometry? (Because ozone is important in the production of smog, it is well studied and its structure has been determined.) If the preferred structure has two (or three) distinct oxygen atoms, which is most positively charged? Most negatively charged? Is your result consistent with formal charges?

31
12What Makes A Strong Acid?
HF is a much stronger acid than H2O, which in turn is a stronger acid than NH3. This parallels a decrease in the electronegativity of the atom bonded to hydrogen (F > O > N) and presumably to a decrease in bond polarity. In other words, the hydrogen in HF is more positive than the hydrogens in H2O, which are in turn more positive than the hydrogens in NH3. It might be expected, therefore, that acid strength would decrease in moving from HF to HI, paralleling the decrease in electronegativity of the halogen.
F > Cl > Br > I 4.0 3.2 3.0 2.7
In fact the opposite is true, and HI is the strongest acid in the series and HF is the weakest. Clearly, factors other than differences in bond polarity caused by differences in electronegativity are at work.
The key is recognizing that acid strength directly relates to the energy of bond fracture into separated positive and negative ions, the so-called heterocyclic bond dissociation energy.
HX → H+ + X–
The present activity relates only to acidity in the gas phase. Gas phase heterolytic bond dissociation energies are much larger than the corresponding energies in a solvent such as water. This is because the solvent acts to stabilize the charged dissociation products much more than it does the uncharged reactants. See the lab activity “Is a Strong Base Always a Strong Base?” for a discussion of solvent effects on acid/base properties.
In this lab activity, you will compute heterolytic bond dissociation energies for HF, HCl, HBr and HI to establish whether or not these reflect the observed ordering of acidities.
32
1. Build HI, HCl, HBr and HI and calculate their equilibrium geometries using the B3LYP/6-31G* model. Also “build” F–, Cl–, Br– and I– and perform energy calculations on each. Put these in a single document.
To build an atom, first build the associated hydride and delete the free valence. Make certain that you set Total Charge to Anion in the Calculations dialog.
Compute heterolytic bond dissociation energies for the four molecules. (The energy of the proton is 0).
Is the ordering of calculated bond dissociation energies the same as the ordering of acidities observed for these compounds?
Heterolytic bond dissociation in these compounds leads to separated ions, one of which, H+, is common to all. Is it reasonable to expect that bond dissociation energy will follow the ability of the anion to stabilize the negative charge. One measure is provided by an electrostatic potential map.
2. Calculate electrostatic potential maps for the four anions and display side-by-side on screen in the same color scale.
Which ion, F–, Cl–, Br– or I–, best accommodates the negative charge? Which most poorly accommodates the charge? Elaborate. Is there a correlation between the size of the ion and its ability to accommodate charge? Elaborate. Overall, does the ability to accommodate charge in the atomic anion reflect the heterolytic bond dissociation energy of the corresponding hydride?
33
13Is a Strong Base
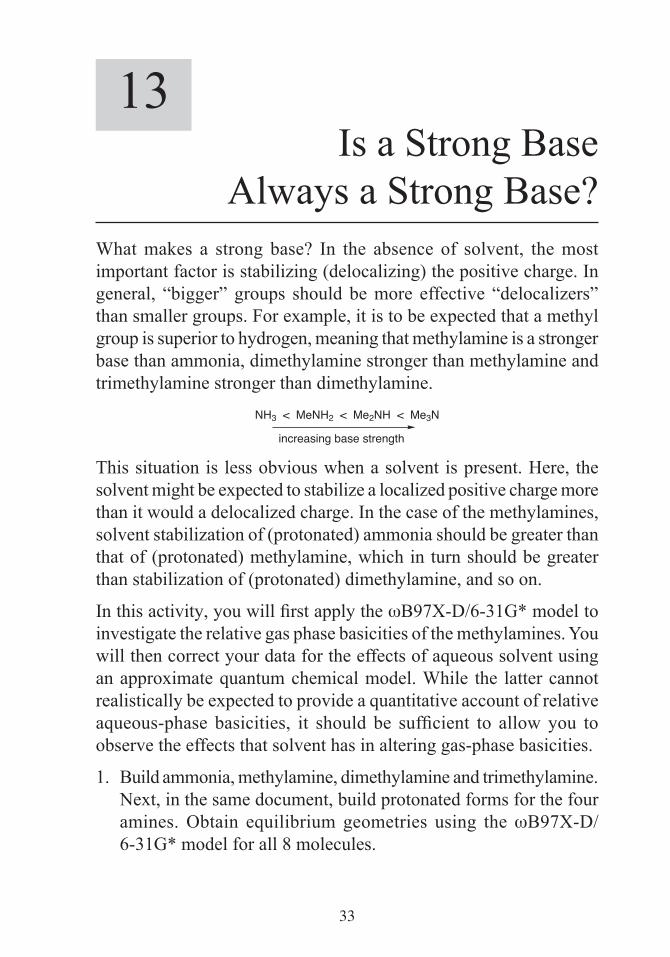
Always a Strong Base?What makes a strong base? In the absence of solvent, the most important factor is stabilizing (delocalizing) the positive charge. In general, “bigger” groups should be more effective “delocalizers” than smaller groups. For example, it is to be expected that a methyl group is superior to hydrogen, meaning that methylamine is a stronger base than ammonia, dimethylamine stronger than methylamine and trimethylamine stronger than dimethylamine.
NH3 < MeNH2 < Me2NH < Me3N
increasing base strength
This situation is less obvious when a solvent is present. Here, the solvent might be expected to stabilize a localized positive charge more than it would a delocalized charge. In the case of the methylamines, solvent stabilization of (protonated) ammonia should be greater than that of (protonated) methylamine, which in turn should be greater than stabilization of (protonated) dimethylamine, and so on.
In this activity, you will first apply the wB97X-D/6-31G* model to investigate the relative gas phase basicities of the methylamines. You will then correct your data for the effects of aqueous solvent using an approximate quantum chemical model. While the latter cannot realistically be expected to provide a quantitative account of relative aqueous-phase basicities, it should be sufficient to allow you to observe the effects that solvent has in altering gas-phase basicities.
1. Build ammonia, methylamine, dimethylamine and trimethylamine. Next, in the same document, build protonated forms for the four amines. Obtain equilibrium geometries using the wB97X-D/ 6-31G* model for all 8 molecules.

34
To build the protonated amines, build the analogous hydrocarbons (methane, ethane, propane and isobutane), bring up the inorganic model kit, select N from the Periodic Table and double click on the appropriate carbon.
Work out the energies of the following reactions:
MeNH2 + NH4+ MeNH3
+ + NH3
Me2NH + NH4+ Me2NH2
+ + NH3
Me3N + NH4+ Me3NH+ + NH3
What is the ordering of methylamine basicities in the gas phase? Is the effect of methyl substitution in altering basicity consistent throughout the series? Hint, use the Reactions calculator.
2. Repeat your analysis this time in water instead of gas. What is the ordering of basicities in water? Is the range of basicity smaller, greater or about the same as the range you observed in the gas phase? Rationalize your result. Compare the changes in aqueous basicity in moving from ammonia to trimethylamine with the analogous changes in gas-phase basicity.
3. Experimental gas and aqueous-phase basicities (in kJ/mol) for the methylamines (relative to ammonia) are tabulated below.
∆Hgas ∆Haq
ammonia 0 0 methylamine 38 8 dimethylamine 67 8 trimethylamine 79 3
How well do these compare with your results both insofar as absolute numbers and with regard to “trends”?
35
14Which Lewis Structure
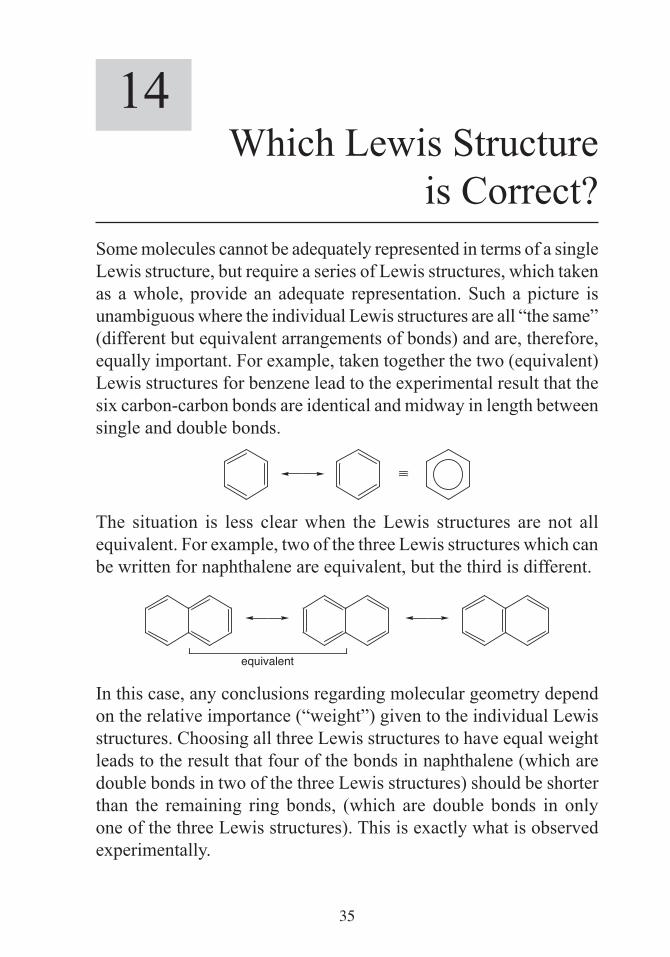
is Correct?Some molecules cannot be adequately represented in terms of a single Lewis structure, but require a series of Lewis structures, which taken as a whole, provide an adequate representation. Such a picture is unambiguous where the individual Lewis structures are all “the same” (different but equivalent arrangements of bonds) and are, therefore, equally important. For example, taken together the two (equivalent) Lewis structures for benzene lead to the experimental result that the six carbon-carbon bonds are identical and midway in length between single and double bonds.
The situation is less clear when the Lewis structures are not all equivalent. For example, two of the three Lewis structures which can be written for naphthalene are equivalent, but the third is different.
equivalent
In this case, any conclusions regarding molecular geometry depend on the relative importance (“weight”) given to the individual Lewis structures. Choosing all three Lewis structures to have equal weight leads to the result that four of the bonds in naphthalene (which are double bonds in two of the three Lewis structures) should be shorter than the remaining ring bonds, (which are double bonds in only one of the three Lewis structures). This is exactly what is observed experimentally.
36
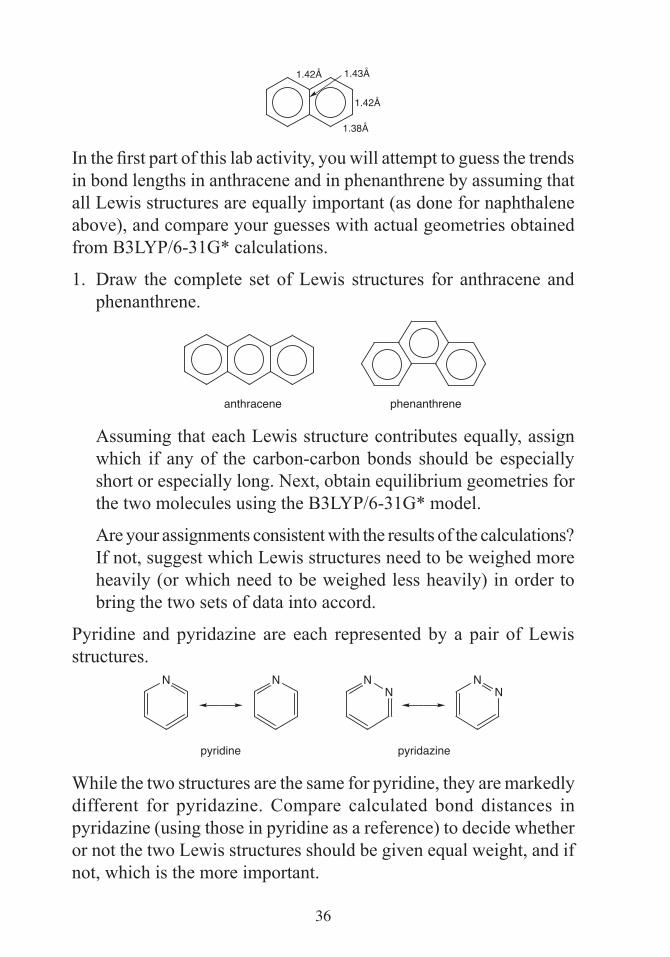
1.42Å 1.43Å
1.42Å
1.38Å
In the first part of this lab activity, you will attempt to guess the trends in bond lengths in anthracene and in phenanthrene by assuming that all Lewis structures are equally important (as done for naphthalene above), and compare your guesses with actual geometries obtained from B3LYP/6-31G* calculations.
1. Draw the complete set of Lewis structures for anthracene and phenanthrene.
anthracene phenanthrene
Assuming that each Lewis structure contributes equally, assign which if any of the carbon-carbon bonds should be especially short or especially long. Next, obtain equilibrium geometries for the two molecules using the B3LYP/6-31G* model.
Are your assignments consistent with the results of the calculations? If not, suggest which Lewis structures need to be weighed more heavily (or which need to be weighed less heavily) in order to bring the two sets of data into accord.
Pyridine and pyridazine are each represented by a pair of Lewis structures.
pyridine
NN
pyridazine
NN
NN
While the two structures are the same for pyridine, they are markedly different for pyridazine. Compare calculated bond distances in pyridazine (using those in pyridine as a reference) to decide whether or not the two Lewis structures should be given equal weight, and if not, which is the more important.

37
2. Obtain equilibrium geometries for pyridine and pyridazine using the Hartree-Fock 3-21G model.
To build pyridine, start with benzene, select aromatic nitrogen and double click on one carbon. To build pyrazine, start with benzene, select aromatic nitrogen and double click on two adjacent carbons.
Using the calculated geometry of pyridine as a reference, would you conclude that the two Lewis structures for pyridazine are equally important? If not, which should be given more weight?
Finally, perform the same analyses of a pair of more complex heterocyclic compounds.
3. Draw all Lewis structures for quinoline and for isoquinoline.
quinoline isoquinolineN
N
Given what you know about the geometry of pyridine (see previous part) and assuming that each of the Lewis structures contributes equally, assign which if any of the carbon-carbon bonds in the two molecules should be especially short or especially long. Obtain B3LYP/6-31G* geometries for quinoline and isoquinoline to support or refute your conclusions.
38
15Is Azulene Aromatic?
Aromatic molecules are (thermodynamically) more stable than anticipated. The famous case is benzene. Here, the first step in its complete hydrogenation (to cyclohexane) is endothermic, while both of the remaining steps are exothermic.
+H2
H = 25 kJ/mol
+H2
H = –109 kJ/mol
+H2
H = –117 kJ/mol
The difference in the hydrogenation energy between the first step and either the second or third steps (134 kJ/mol and 142 kJ/mol, respectively) provides a measure of the aromatic stabilization.
Aromatic molecules may also be distinguished in that they incorporate bonds intermediate in length between normal (single and double) linkages. For example, all carbon-carbon bond lengths in benzene are 1.39Å, which is longer than a double bond (1.30 to 1.34Å) but shorter than a single bond (1.48 to 1.55Å).
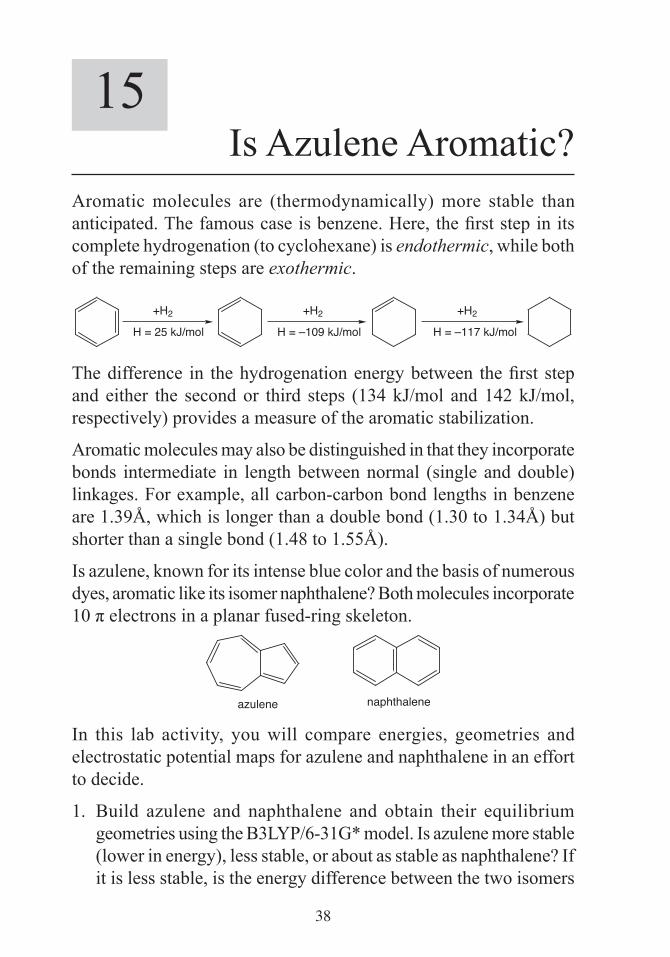
Is azulene, known for its intense blue color and the basis of numerous dyes, aromatic like its isomer naphthalene? Both molecules incorporate 10 π electrons in a planar fused-ring skeleton.
naphthaleneazulene
In this lab activity, you will compare energies, geometries and electrostatic potential maps for azulene and naphthalene in an effort to decide.
1. Build azulene and naphthalene and obtain their equilibrium geometries using the B3LYP/6-31G* model. Is azulene more stable (lower in energy), less stable, or about as stable as naphthalene? If it is less stable, is the energy difference between the two isomers
39
much less, much greater or about the same as the “aromatic stabilization” of benzene? On the basis of energy, would you conclude that azulene is aromatic?
Calculate an average carbon-carbon bond length in azulene. Is this average similar to the carbon-carbon bond length in benzene? Next, calculate the mean absolute deviation from the average to provide a measure of the uniformity of bond lengths. Is this deviation similar to the corresponding quantity for naphthalene? On the basis of uniformity in bond lengths alone, would you conclude that azulene is aromatic?
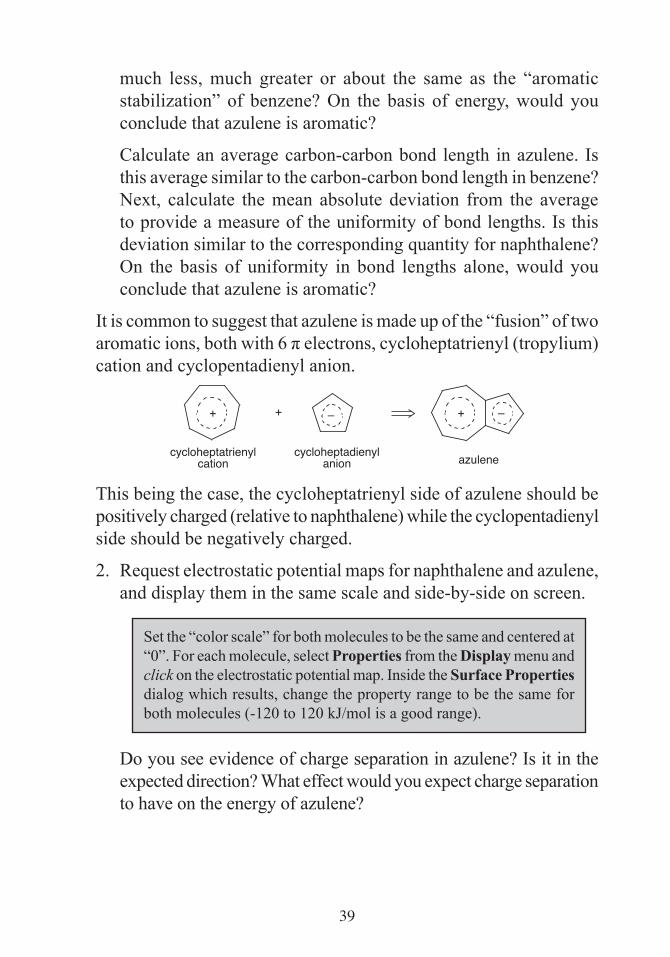
It is common to suggest that azulene is made up of the “fusion” of two aromatic ions, both with 6 π electrons, cycloheptatrienyl (tropylium) cation and cyclopentadienyl anion.
+ +
cycloheptatrienylcation
cycloheptadienylanion azulene
+ ––
This being the case, the cycloheptatrienyl side of azulene should be positively charged (relative to naphthalene) while the cyclopentadienyl side should be negatively charged.
2. Request electrostatic potential maps for naphthalene and azulene, and display them in the same scale and side-by-side on screen.
Set the “color scale” for both molecules to be the same and centered at “0”. For each molecule, select Properties from the Display menu and click on the electrostatic potential map. Inside the Surface Properties dialog which results, change the property range to be the same for both molecules (-120 to 120 kJ/mol is a good range).
Do you see evidence of charge separation in azulene? Is it in the expected direction? What effect would you expect charge separation to have on the energy of azulene?
40
16Why is Pyrrole a Weak Base?
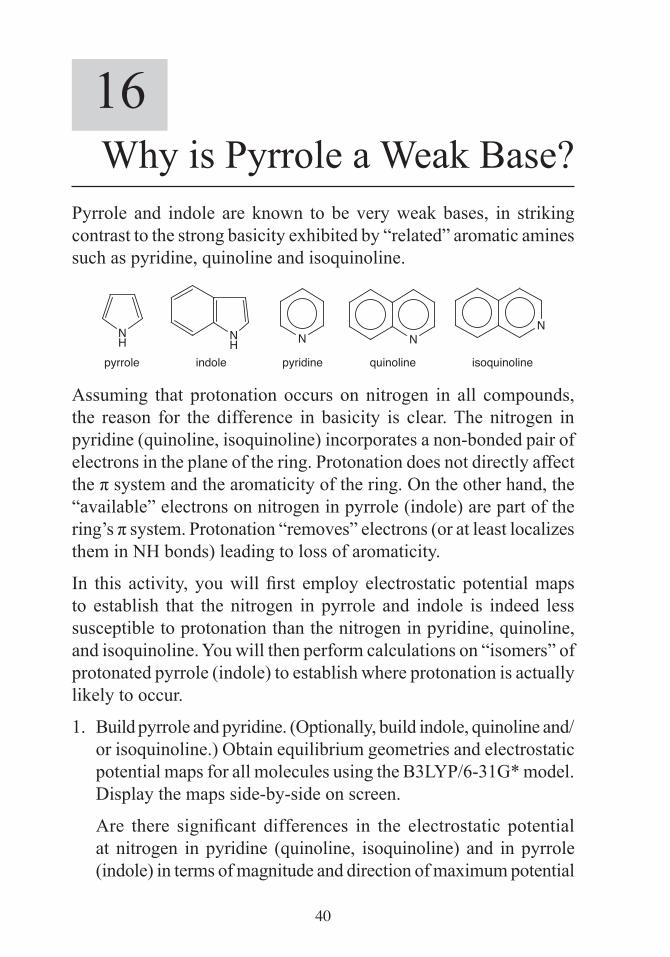
Pyrrole and indole are known to be very weak bases, in striking contrast to the strong basicity exhibited by “related” aromatic amines such as pyridine, quinoline and isoquinoline.
NH N
H N NN
pyrrole indole pyridine quinoline isoquinoline
Assuming that protonation occurs on nitrogen in all compounds, the reason for the difference in basicity is clear. The nitrogen in pyridine (quinoline, isoquinoline) incorporates a non-bonded pair of electrons in the plane of the ring. Protonation does not directly affect the π system and the aromaticity of the ring. On the other hand, the “available” electrons on nitrogen in pyrrole (indole) are part of the ring’s π system. Protonation “removes” electrons (or at least localizes them in NH bonds) leading to loss of aromaticity.
In this activity, you will first employ electrostatic potential maps to establish that the nitrogen in pyrrole and indole is indeed less susceptible to protonation than the nitrogen in pyridine, quinoline, and isoquinoline. You will then perform calculations on “isomers” of protonated pyrrole (indole) to establish where protonation is actually likely to occur.
1. Build pyrrole and pyridine. (Optionally, build indole, quinoline and/or isoquinoline.) Obtain equilibrium geometries and electrostatic potential maps for all molecules using the B3LYP/6-31G* model. Display the maps side-by-side on screen.
Are there significant differences in the electrostatic potential at nitrogen in pyridine (quinoline, isoquinoline) and in pyrrole (indole) in terms of magnitude and direction of maximum potential
41
(most negative)? Are any differences consistent with the observed difference in basicities of pyridine and pyrrole and with the qualitative rationale used to explain these differences? Elaborate. On the basis of its electrostatic potential map, would you expect the nitrogen in pyridine (quinoline, isoquinoline) to be the most basic site? If not, where is the most basic site? Is the nitrogen in pyrrole (indole) the most basic site? If not, where is that site?
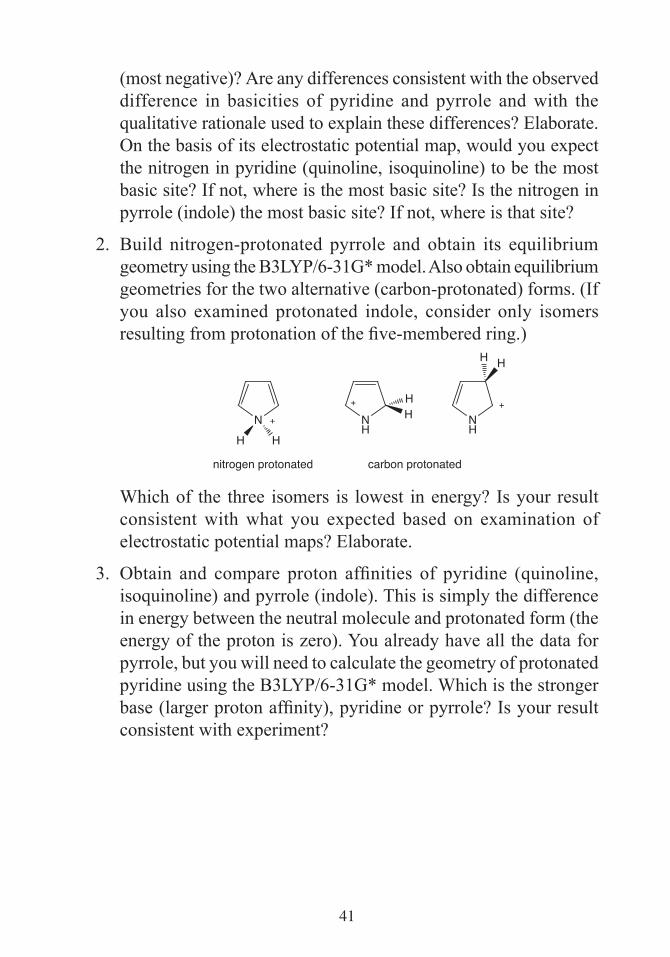
2. Build nitrogen-protonated pyrrole and obtain its equilibrium geometry using the B3LYP/6-31G* model. Also obtain equilibrium geometries for the two alternative (carbon-protonated) forms. (If you also examined protonated indole, consider only isomers resulting from protonation of the five-membered ring.)
N
nitrogen protonated
H H
+ NH
+
NH
+
carbon protonated
HH
H H
Which of the three isomers is lowest in energy? Is your result consistent with what you expected based on examination of electrostatic potential maps? Elaborate.
3. Obtain and compare proton affinities of pyridine (quinoline, isoquinoline) and pyrrole (indole). This is simply the difference in energy between the neutral molecule and protonated form (the energy of the proton is zero). You already have all the data for pyrrole, but you will need to calculate the geometry of protonated pyridine using the B3LYP/6-31G* model. Which is the stronger base (larger proton affinity), pyridine or pyrrole? Is your result consistent with experiment?

42
17Not the Sum of the Parts
N,N-dimethylaniline is more basic than pyridine, which leads to the expectation that the aniline nitrogen in 4-(dimethylamino)pyridine will be more basic than the pyridine nitrogen.
NMe2
N,N-dimethylaniline pyridine
N
N
N(CH3)2
4-(dimethylamino)pyridine
While the site of protonation (the more basic site) in 4-(dimethylamino) pyridine is unknown, there is evidence to suggest that the reverse is true and that the pyridine nitrogen is actually the more basic of the two. Specifically, addition of methyl iodide to 4-(dimethylamino) pyridine leads exclusively to the pyridine adduct.
N
N(CH3)2
CH3Inot
N
N(CH3)2
N
N(CH3)3
CH
+
I – I –
+
In this activity, you will first confirm (or refute) that the preferred site of protonation in 4-(dimethylamino)pyridine is the pyridine nitrogen. If it is, you will then examine the interaction of the dimethylamino substituent with pyridine in both neutral and protonated 4-(dimethylamino)pyridine for clues to its behavior.
1. Build both forms of protonated 4-(dimethylamino)pyridine and obtain the geometry of each using the B3LYP/6-31G* model. Which protonated form is the more stable? Is your result consistent with the product observed upon addition of methyl iodide? Is the energy of the other protonated form close enough so that one might
43
expect to see both methyl cation adducts? Elaborate.
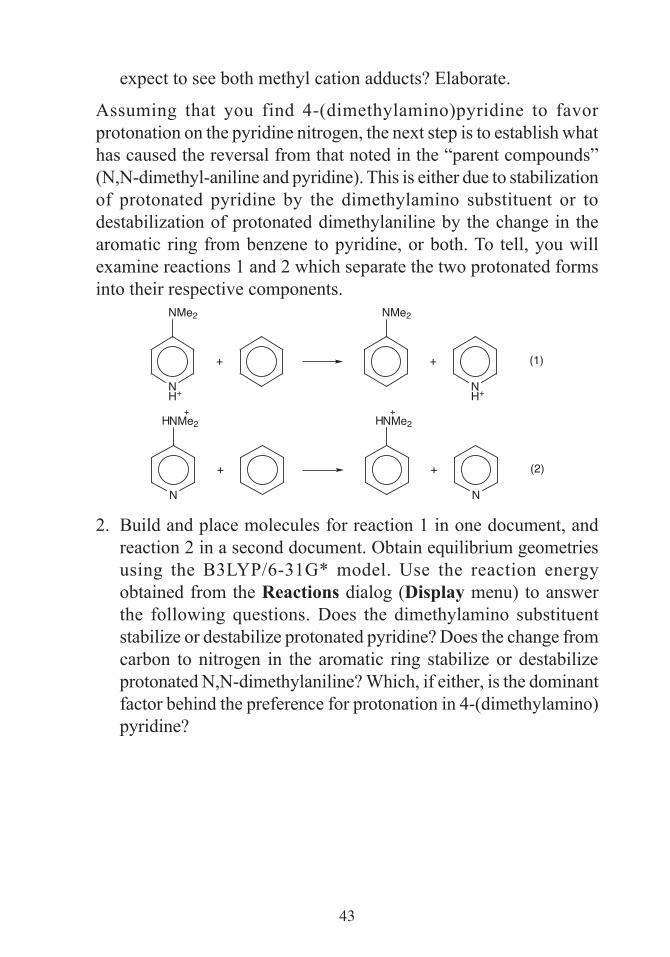
Assuming that you find 4-(dimethylamino)pyridine to favor protonation on the pyridine nitrogen, the next step is to establish what has caused the reversal from that noted in the “parent compounds” (N,N-dimethyl-aniline and pyridine). This is either due to stabilization of protonated pyridine by the dimethylamino substituent or to destabilization of protonated dimethylaniline by the change in the aromatic ring from benzene to pyridine, or both. To tell, you will examine reactions 1 and 2 which separate the two protonated forms into their respective components.
NH+
NMe2
+
NMe2
+
NH+
(1)
N
NMe2
+
NMe2
+
N
(2)
+H H
+
2. Build and place molecules for reaction 1 in one document, and reaction 2 in a second document. Obtain equilibrium geometries using the B3LYP/6-31G* model. Use the reaction energy obtained from the Reactions dialog (Display menu) to answer the following questions. Does the dimethylamino substituent stabilize or destabilize protonated pyridine? Does the change from carbon to nitrogen in the aromatic ring stabilize or destabilize protonated N,N-dimethylaniline? Which, if either, is the dominant factor behind the preference for protonation in 4-(dimethylamino) pyridine?

44
18Stereoisomers vs. Conformers.
A Matter of DegreeStereoisomers are molecules with the same molecular formula in which the constituent atoms are connected to each other (bonded) in the same way but differ in their three-dimensional arrangement. For example, cis and trans-2-butene are stereoisomers but 2-methyl propene and cis (or trans) 2-butene are not.
C CCH3
HH
CH3
C CH
CH3H
CH3
C CH
HCH3
CH3
cis-2-butene trans-2-butene 2-methylpropene
C CCH3
CH3
anti-n-butane gauche-n-butane
HH
HHC C
H
CH3
HH
HCH3
anti and gauche-n-butane like cis and trans-2-butene have the same molecular formula, the same arrangement of bonds but different three-dimensional geometry, but are not considered to be stereoisomers. Rather, they are referred to as conformers.
The difference is one of degree. Interconversion of cis and trans-2-butene is “difficult” because it requires fracture of a π bond, whereas interconversion of anti and gauche n-butane is “easy” as it only involves rotation about a carbon-carbon single bond. In more quantitative terms, cis-2-butene needs to surmount an activation barrier of roughly 210 kJ/mol in order to isomerize to trans-2-butene, while gauche n-butane needs only to climb a 10 kJ/mol “hill” in order to yield the anti conformer. Isomerization of cis-2-butene to trans-2-butene will be very slow, while rotation of gauche-n-butane to anti-n-butane will be fast.
This activity explores a situation where it is not clear whether the term “isomer” and “conformer” is the more appropriate.
While amides, such as formamide, may be represented in terms of a
45
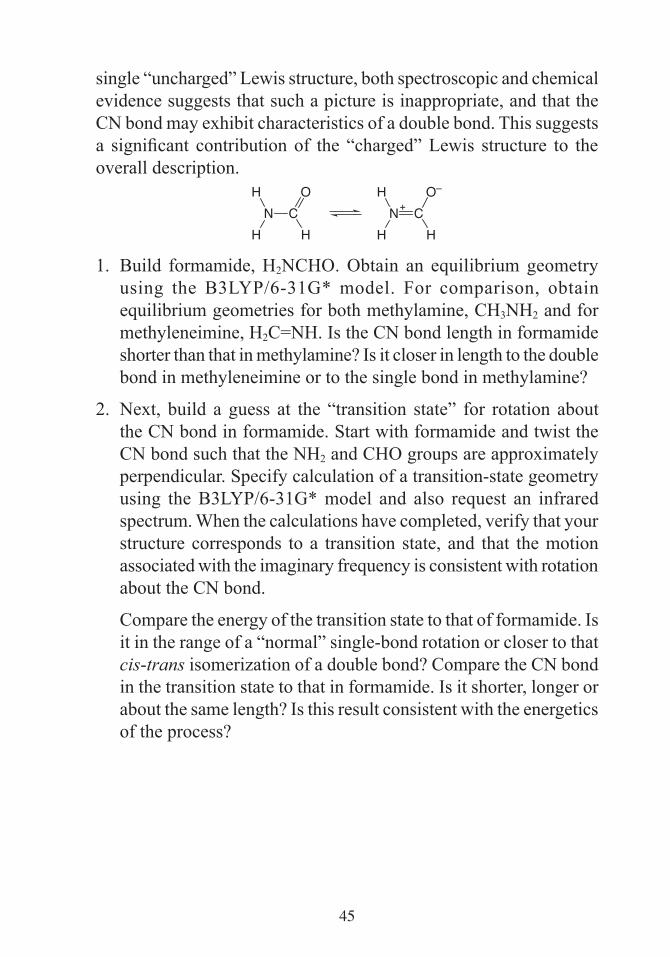
single “uncharged” Lewis structure, both spectroscopic and chemical evidence suggests that such a picture is inappropriate, and that the CN bond may exhibit characteristics of a double bond. This suggests a significant contribution of the “charged” Lewis structure to the overall description.
N CO
HH
HN C
O–
HH
H+
1. Build formamide, H2NCHO. Obtain an equilibrium geometry using the B3LYP/6-31G* model. For comparison, obtain equilibrium geometries for both methylamine, CH3NH2 and for methyleneimine, H2C=NH. Is the CN bond length in formamide shorter than that in methylamine? Is it closer in length to the double bond in methyleneimine or to the single bond in methylamine?
2. Next, build a guess at the “transition state” for rotation about the CN bond in formamide. Start with formamide and twist the CN bond such that the NH2 and CHO groups are approximately perpendicular. Specify calculation of a transition-state geometry using the B3LYP/6-31G* model and also request an infrared spectrum. When the calculations have completed, verify that your structure corresponds to a transition state, and that the motion associated with the imaginary frequency is consistent with rotation about the CN bond.
Compare the energy of the transition state to that of formamide. Is it in the range of a “normal” single-bond rotation or closer to that cis-trans isomerization of a double bond? Compare the CN bond in the transition state to that in formamide. Is it shorter, longer or about the same length? Is this result consistent with the energetics of the process?

46
19Enantiomers.
The Same and Not the SameEnantiomers are non-superimposible mirror images. While they necessarily have identical physical properties, “under the right conditions” they may exhibit entirely different chemical behavior. The usual analogy is the human hand. Left and right hands are non-superimposible mirror images (they are enantiomers) and are identical in all respects. However, a right hand “shaking” another right hand provides an entirely different “experience” than the same right hand shaking a left hand.
1. One of the enantiomers of carvone occurs naturally in caraway while the other is found in spearmint oil. These enantiomers are responsible for the characteristic odors of these materials. Ibuprofen is an analgesic sold under various names, including Advil, Motrin, and Nuprin. The material is sold as a mixture, but only one enantiomer acts as an analgesic. The other enantiomer is inactive. This means that 800 mg of ibuprofen contains only 400 mg of analgesic. The two enantiomers of limonene have completely different tastes. One has the taste of lemon (as the name implies) and the other tastes of orange.
Ocarvone ibuprofen
CO2H
limonene
Each of these molecules incorporates a single chiral center. Identify it, and draw R and S forms of each compound.
2. Select one (or more) molecule and bring it onto the screen.
47
Select carvone, ibuprofen and/or limonene from the files in the “activities” directory. Both R and S forms will be placed in a single document.
Add R/S labels to your model to confirm that your assignments in the previous step are correct.
R/S Chirality from the Model menu.
3. Compare total energies and dipole moments for the two enantiomers of the compound you selected. Are the energies and dipole moments for the two enantiomers of carvone (ibuprofen and limonene) the same or are they different?
You could have performed this activity by building and calculating the enantiomers of carvone (ibuprofen or limonene) instead of retrieving them from the “labs” directory. In this case, you would need to examine the different possible conformers available for each and selecting the lowest-energy conformer.
48
20Diastereomers
and Meso CompoundsWe have seen in the previous activity that molecules with a single chiral center exist as a pair of enantiomers, the properties of which are identical. The situation is different where there are two chiral centers. In the case where the two chiral centers are different, as for example in 2-chloro-3-fluorobutane, there are four different chirality assignments; RR, RS, SR and SS, leading to four distinct molecules. However, there are two distinct kinds of relationships between the four molecules, enantiomeric relationships (as in the previous activity) and diasteriomeric relationships.
1. On a piece of paper, draw all four forms of 2-chloro-3-fluorobutane and assign R/S chirality for each center.
2. Bring 2-chloro-3-fluorobutane onto the screen.
Select 2-chloro-3-fluorobutane from the files in the “labs” directory. All four forms will be placed in a single document.
Attach R/S labels to your models to confirm that your assignments in the previous step are correct.
R/S Chirality from the Model menu.
3. Compare total energies and dipole moments among the four molecules. How many different sets of energies and dipole moments are there? Are molecules with the same energy and dipole moment enantiomers (non-superimposible mirror images) or do they bear a different relationship to each other? Try to superimpose to find out what is the relationship between molecules with different charges and dipole moments.
49
In the case where the two chiral centers are the same, as for example in 2,3-difluorobutane, there are also four different chirality assignments: RR, RS, SR and SS. Two of these lead to molecules which are enantiomers. The other two are the same (a meso compound) but are different from the first two.
4. On paper, draw all four forms of 2,3-difluorobutane and assign R/S chirality to each center.
5. Bring 2,3-difluorobutane onto the screen (all four forms will be placed in a single group).
Select 2,3-difluorobutane from the files in the “labs” directory.
Attach R/S label to your models to confirm that your assignments in the previous step are correct.
6. Compare total energies and dipole moments among the four molecules. How many different sets of energies and dipole moments are there? Are molecules with the same energy and dipole moment enatiomers or do they bear a different relationship. Try to superimpose to find out. What is the relationship between molecules with different energies and dipole moments?
You could have performed this activity by building and calculating the different stereoisomers of 2-chloro-3-fluorobutane and of 2,3-difluorobutane instead of retrieving them from the “activities” directory. In this case, you would need to examine the different possible conformers available for each, which would entail performing a series of different equilibrium geometry calculations (the Equilibrium Conformer or Conformer Distribution task) and, following that, optimizing the geometry for the lowest-energy conformer with a better model (wB97X-D/6-31G* for example).
50
21Are Reactive Intermediates
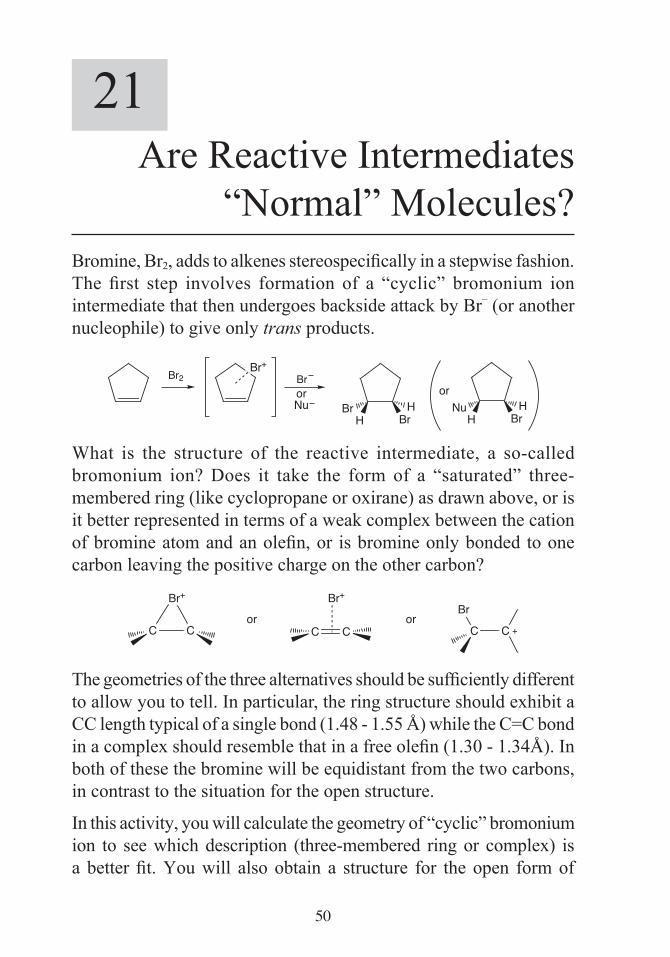
“Normal” Molecules?Bromine, Br2, adds to alkenes stereospecifically in a stepwise fashion. The first step involves formation of a “cyclic” bromonium ion intermediate that then under goes backside attack by Br– (or another nucleophile) to give only trans products.
Br2 BrorNu
H BrBr H
or
H BrNu H
Br+
What is the structure of the reactive intermediate, a so-called bromonium ion? Does it take the form of a “saturated” three-membered ring (like cyclopropane or oxirane) as drawn above, or is it better represented in terms of a weak complex between the cation of bromine atom and an olefin, or is bromine only bonded to one carbon leaving the positive charge on the other carbon?
Br+
or
Br+
C C C Cor
C C
Br+
The geometries of the three alternatives should be sufficiently different to allow you to tell. In particular, the ring structure should exhibit a CC length typical of a single bond (1.48 - 1.55 Å) while the C=C bond in a complex should resemble that in a free olefin (1.30 - 1.34Å). In both of these the bromine will be equidistant from the two carbons, in contrast to the situation for the open structure.
In this activity, you will calculate the geometry of “cyclic” bromonium ion to see which description (three-membered ring or complex) is a better fit. You will also obtain a structure for the open form of
51
bromonium ion to see whether it is more or less stable than the cyclic form. You will then obtain a |LUMO| map for your best structure to see where a nucleophile would most likely attack. Finally, you will examine “ring” and “open” structures for analogous reactive intermediates in which bromine cation “attaches” to benzene rather than to the alkene.
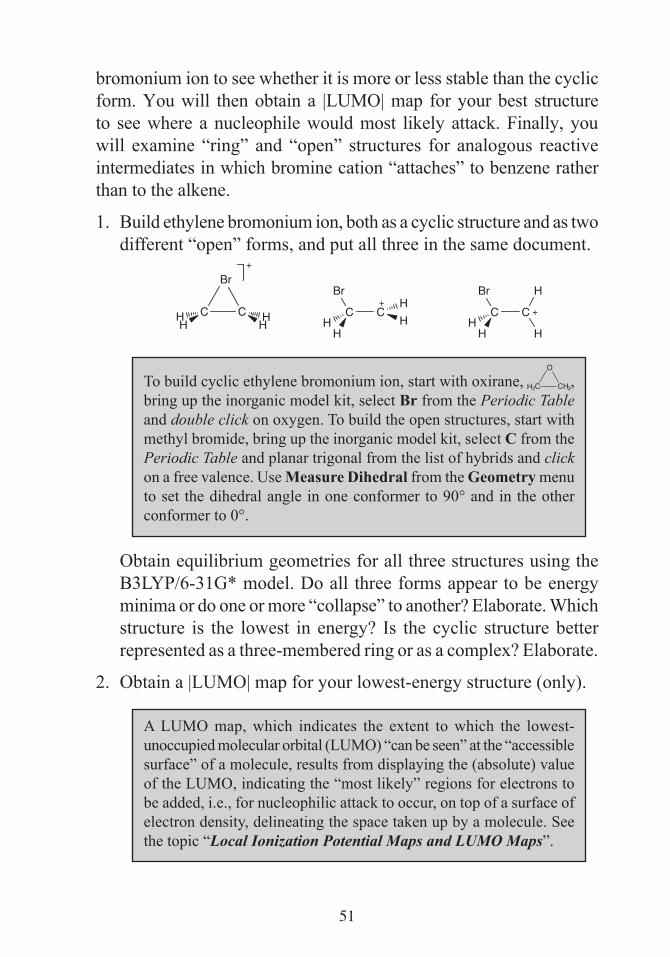
1. Build ethylene bromonium ion, both as a cyclic structure and as two different “open” forms, and put all three in the same document.
Br
C CH HH HC C
H
Br H
H
+H
+
C C
H
Br
HHH
+
To build cyclic ethylene bromonium ion, start with oxirane, O
H2C CH2,
bring up the inorganic model kit, select Br from the Periodic Table and double click on oxygen. To build the open structures, start with methyl bromide, bring up the inorganic model kit, select C from the Periodic Table and planar trigonal from the list of hybrids and click on a free valence. Use Measure Dihedral from the Geometry menu to set the dihedral angle in one conformer to 90° and in the other conformer to 0°.
Obtain equilibrium geometries for all three structures using the B3LYP/6-31G* model. Do all three forms appear to be energy minima or do one or more “collapse” to another? Elaborate. Which structure is the lowest in energy? Is the cyclic structure better represented as a three-membered ring or as a complex? Elaborate.
2. Obtain a |LUMO| map for your lowest-energy structure (only).
A LUMO map, which indicates the extent to which the lowest-unoccupied molecular orbital (LUMO) “can be seen” at the “accessible surface” of a molecule, results from displaying the (absolute) value of the LUMO, indicating the “most likely” regions for electrons to be added, i.e., for nucleophilic attack to occur, on top of a surface of electron density, delineating the space taken up by a molecule. See the topic “Local Ionization Potential Maps and LUMO Maps”.
52
Where is the LUMO most concentrated? Given that nucleophilic attack should occur here, is this consistent with the observed stereochemistry of Br2 addition? Elaborate.
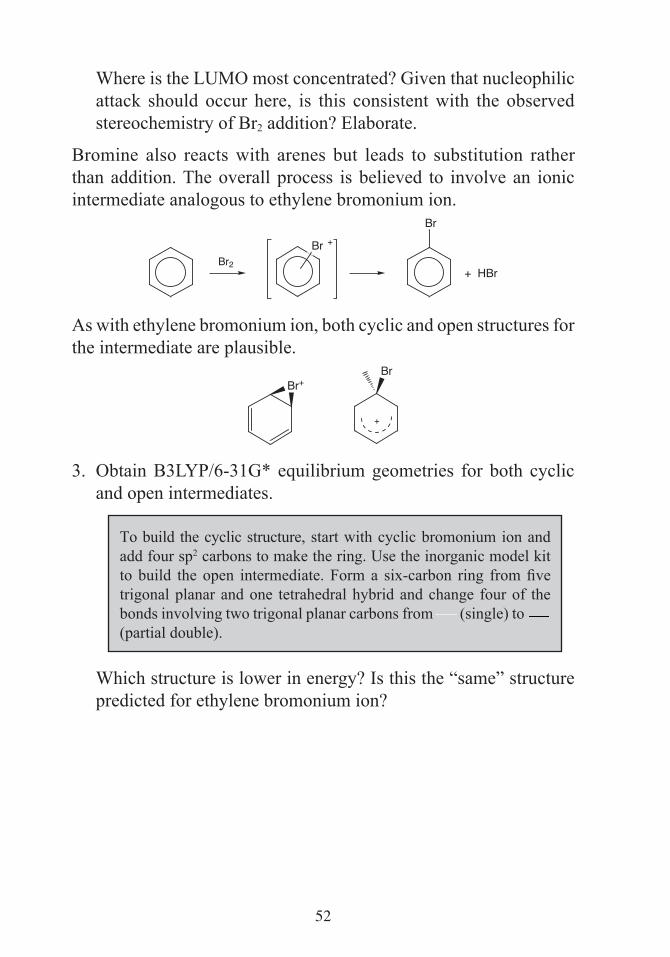
Bromine also reacts with arenes but leads to substitution rather than addition. The overall process is believed to involve an ionic intermediate analogous to ethylene bromonium ion.
Br2
Br
Br
+ HBr
+
As with ethylene bromonium ion, both cyclic and open structures for the intermediate are plausible.
+
Br+Br
3. Obtain B3LYP/6-31G* equilibrium geometries for both cyclic and open intermediates.
To build the cyclic structure, start with cyclic bromonium ion and add four sp2 carbons to make the ring. Use the inorganic model kit to build the open intermediate. Form a six-carbon ring from five trigonal planar and one tetrahedral hybrid and change four of the bonds involving two trigonal planar carbons from (single) to (partial double).
Which structure is lower in energy? Is this the “same” structure predicted for ethylene bromonium ion?
53
22Molecular Shapes I.
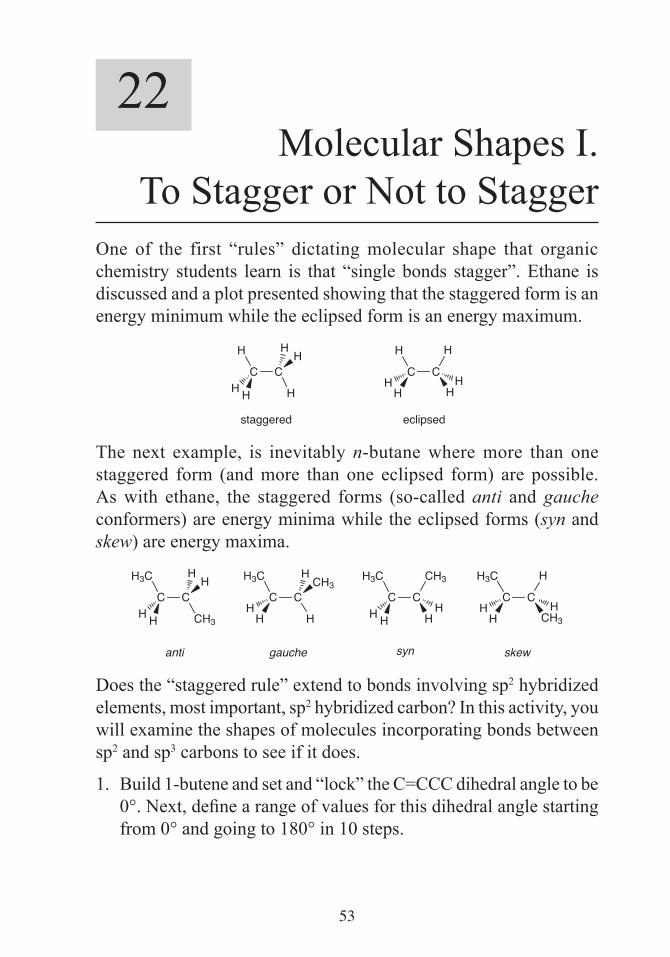
To Stagger or Not to StaggerOne of the first “rules” dictating molecular shape that organic chemistry students learn is that “single bonds stagger”. Ethane is discussed and a plot presented showing that the staggered form is an energy minimum while the eclipsed form is an energy maximum.
C C
H
H
staggered eclipsed
HH
H H
C C
H H
HHH
H
The next example, is inevitably n-butane where more than one staggered form (and more than one eclipsed form) are possible. As with ethane, the staggered forms (so-called anti and gauche conformers) are energy minima while the eclipsed forms (syn and skew) are energy maxima.
C C
H3C
CH3
anti gauche
HH
H H
C C
H3C
HH
C C
H3C
syn skew
H H
C C
H3C H
CH3HH
H
CH3
HH
H
CH3H
Does the “staggered rule” extend to bonds involving sp2 hybridized elements, most important, sp2 hybridized carbon? In this activity, you will examine the shapes of molecules incorporating bonds between sp2 and sp3 carbons to see if it does.
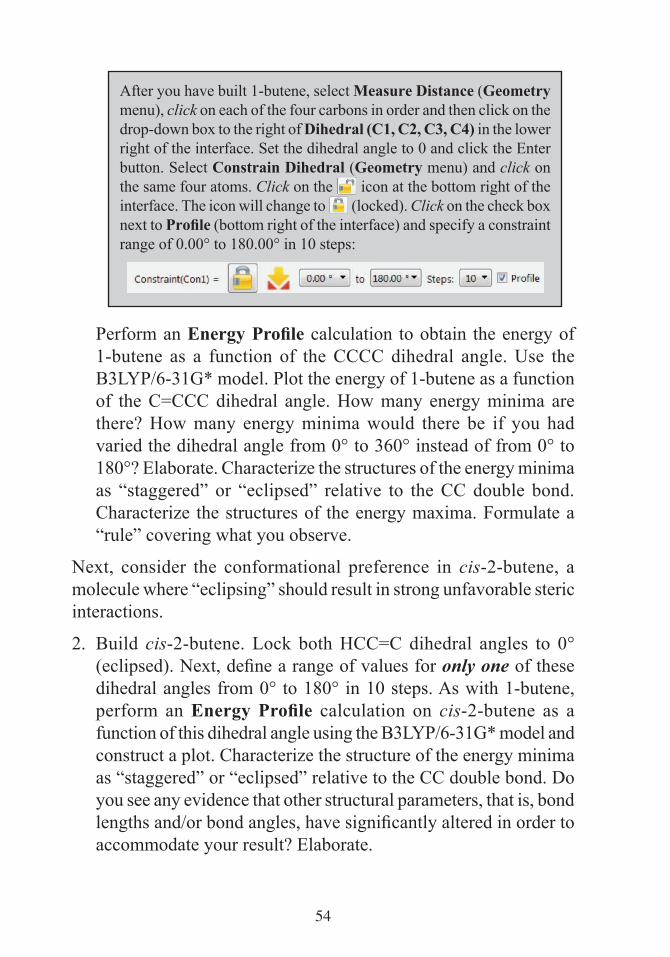
1. Build 1-butene and set and “lock” the C=CCC dihedral angle to be 0°. Next, define a range of values for this dihedral angle starting from 0° and going to 180° in 10 steps.
54
After you have built 1-butene, select Measure Distance (Geometry menu), click on each of the four carbons in order and then click on the drop-down box to the right of Dihedral (C1, C2, C3, C4) in the lower right of the interface. Set the dihedral angle to 0 and click the Enter button. Select Constrain Dihedral (Geometry menu) and click on the same four atoms. Click on the icon at the bottom right of the interface. The icon will change to (locked). Click on the check box next to Profile (bottom right of the interface) and specify a constraint range of 0.00° to 180.00° in 10 steps:
Perform an Energy Profile calculation to obtain the energy of 1-butene as a function of the CCCC dihedral angle. Use the B3LYP/6-31G* model. Plot the energy of 1-butene as a function of the C=CCC dihedral angle. How many energy minima are there? How many energy minima would there be if you had varied the dihedral angle from 0° to 360° instead of from 0° to 180°? Elaborate. Characterize the structures of the energy minima as “staggered” or “eclipsed” relative to the CC double bond. Characterize the structures of the energy maxima. Formulate a “rule” covering what you observe.
Next, consider the conformational preference in cis-2-butene, a molecule where “eclipsing” should result in strong unfavorable steric interactions.
2. Build cis-2-butene. Lock both HCC=C dihedral angles to 0° (eclipsed). Next, define a range of values for only one of these dihedral angles from 0° to 180° in 10 steps. As with 1-butene, perform an Energy Profile calculation on cis-2-butene as a function of this dihedral angle using the B3LYP/6-31G* model and construct a plot. Characterize the structure of the energy minima as “staggered” or “eclipsed” relative to the CC double bond. Do you see any evidence that other structural parameters, that is, bond lengths and/or bond angles, have significantly altered in order to accommodate your result? Elaborate.

55
23Molecular Shapes II.
cis 1,3-DienesIn order for 1,3-butadiene to undergo Diels-Alder cycloaddition, it needs to be in a cis (or nearly cis) conformation.
O+ O
O
OO
O
Is this a minimum energy shape for the diene? Certainly it benefits from having the two double bonds coplanar. However, it also places the pair of “inside” hydrogens in close proximity presumably resulting in unfavorable steric repulsion.
H
H
H
H steric repulsion
In this activity, you will first examine the energy profile for rotation around the central carbon-carbon (single) bond in 1,3-butadiene to see if the syn form is an energy minimum and if not what the “closest” minimum-energy form actually is.
1. Build 1,3-butadiene and “lock” the C=CC=C dihedral angle to be 0°. Next, define a range of values for this dihedral angle starting from 0° and going to 180° in 10° steps. Obtain and plot the energy of 1,3-butadiene as a function of the C=CC=C dihedral angle using the B3LYP/6-31G* model.
56
Instructions for carrying out these operations with Spartan have been provided in the previous activity “Molecular Shapes I. To Stagger or Not to Stagger”.
Describe the lowest energy minima. Are the double bonds coplanar? Is it suitable for Diels-Alder cycloaddition? If not, is there a second energy minima? Are the double bonds coplanar in this structure? If not, what is the difference in energy between this structure and the “closest” structure in which the double bonds are coplanar?
2. Suggest one or more 1,3-dienes which have C=CC=C dihedral angles close to 0°. Test your suggestions by structures obtained from the B3LYP/6-31G* model.
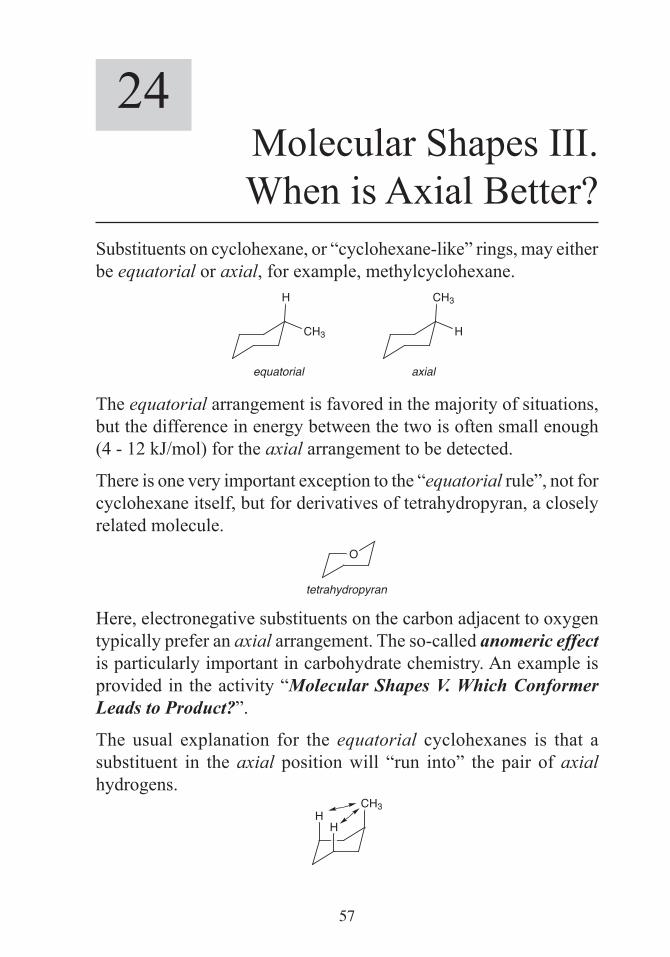
57
24Molecular Shapes III. When is Axial Better?
Substituents on cyclohexane, or “cyclohexane-like” rings, may either be equatorial or axial, for example, methylcyclohexane.
CH3
equatorial axial
H
H
CH3
The equatorial arrangement is favored in the majority of situations, but the difference in energy between the two is often small enough (4 - 12 kJ/mol) for the axial arrangement to be detected.
There is one very important exception to the “equatorial rule”, not for cyclohexane itself, but for derivatives of tetrahydropyran, a closely related molecule.
tetrahydropyran
O
Here, electronegative substituents on the carbon adjacent to oxygen typically prefer an axial arrangement. The so-called anomeric effect is particularly important in carbohydrate chemistry. An example is provided in the activity “Molecular Shapes V. Which Conformer Leads to Product?”.
The usual explanation for the equatorial cyclohexanes is that a substituent in the axial position will “run into” the pair of axial hydrogens.
CH3H
H

58
This is a “steric” (crowding) argument. Do non-steric considerations also play a role? In this lab activity, you will look for substituted cyclohexanes that prefer to be axial. Specifically, you will draw on Coulomb’s Law “charge separation requires energy” as a means to override (or at least reduce) unfavorable sterics. Dipole moment will be employed as a measure of charge separation. A reasonable starting point is fluorocyclohexane. The carbon fluorine bond is highly polar (C+–F–), giving rise to the possibility of a large Coulombic contribution, while fluorine is normally viewed as a “small” substituent, thereby minimizing steric factors.
1. Build both equatorial and axial fluorocyclohexane and obtain equilibrium geometries using the B3LYP/6-31G* model. As a reference, also perform B3LYP/6-31G* calculations on equatorial and axial methylcyclohexane.
Which arrangement, equatorial or axial is predicted to be lower in energy? How does this result compare with that found for methylcyclohexane? Is the favored fluorocyclohexane structure also the one with the lower dipole moment? If so, what is the difference in dipole moments between the two structures? How does this difference compare with the difference in dipole moments between the two methylcyclohexane structures? Given what you observe, for which system, fluorocyclohexane or methylcyclohexane, would you expect “charge separation effects” to be more significant?
2. trans-1,2-difluorocyclohexane can exist as either a diaxial or a diequatorial structure. Build both and examine the relative orientation of the two CF bonds. For which would you expect the dipole moment to be smaller? Elaborate. Given your prediction about the relative magnitudes of the dipole moments in the two structures and your results from the first part of this activity, would you expect trans-1,2-difluorocyclohexane to be diaxial or diequatorial?
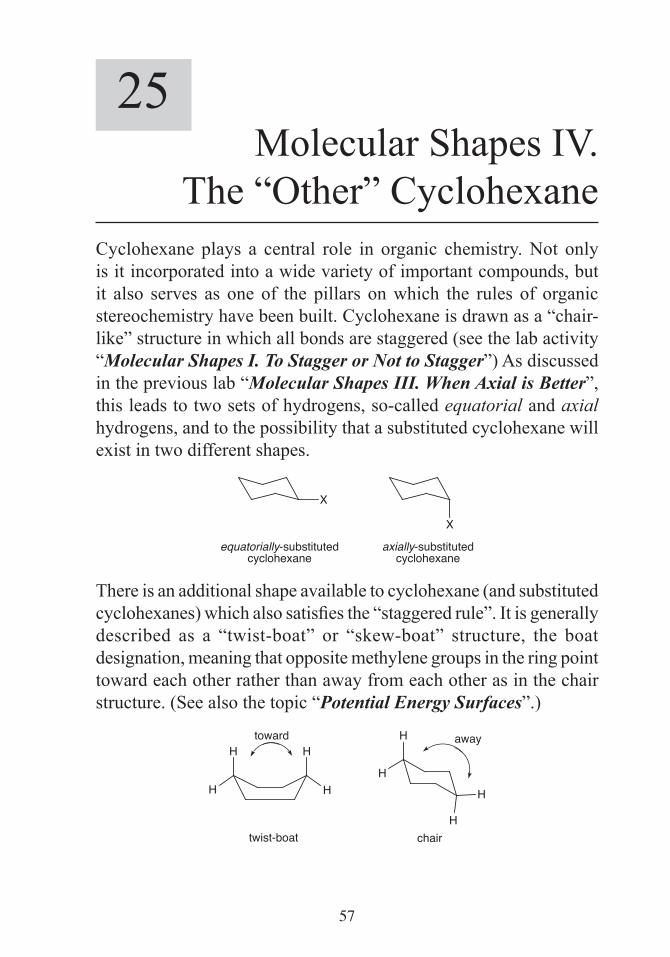
57
25Molecular Shapes IV.
The “Other” CyclohexaneCyclohexane plays a central role in organic chemistry. Not only is it incorporated into a wide variety of important compounds, but it also serves as one of the pillars on which the rules of organic stereochemistry have been built. Cyclohexane is drawn as a “chair-like” structure in which all bonds are staggered (see the lab activity “Molecular Shapes I. To Stagger or Not to Stagger”) As discussed in the previous lab “Molecular Shapes III. When Axial is Better”, this leads to two sets of hydrogens, so-called equatorial and axial hydrogens, and to the possibility that a substituted cyclohexane will exist in two different shapes.
X
X
equatorially-substitutedcyclohexane
axially-substitutedcyclohexane
There is an additional shape available to cyclohexane (and substituted cyclohexanes) which also satisfies the “staggered rule”. It is generally described as a “twist-boat” or “skew-boat” structure, the boat designation, meaning that opposite methylene groups in the ring point toward each other rather than away from each other as in the chair structure. (See also the topic “Potential Energy Surfaces”.)
H
H
H
H
H
H
H
H
awaytoward
twist-boat chair
58
In this lab activity, you will locate the twist-boat form of cyclohexane and then attempt to rationalize why it is seldom given notice.
1. Build a form of cyclohexane which “looks like” a twisted boat. The easiest way to do this is start with a chain of six sp3 carbons and to rotate around individual carbon-carbon bonds. Make certain that minimization in the builder does not lead either to the chair structure or to a “non-twisted” boat structure.* When you are satisfied, obtain an equilibrium geometry using the B3LYP/6-31G* model. Also perform a B3LYP/6-31G* geometry optimization on “normal” (chair) cyclohexane. Examine your alternative cyclohexane structure. Does it appear to satisfy the requirement that single bonds stagger each other? Examine the energy of the alternative relative to that of chair cyclohexane. Is it about the same (within 1-2 kJ/mol) or significantly higher? What would you expect the relative equilibrium populations of the two forms to be at room temperature (use the Boltzmann equation)?
2. Identify that site in your alternative cyclohexane structure which you believe to be the least “crowded”. One after the other, substitute this site with methyl, fluoro and cyano groups and calculate the equilibrium geometry of each. Also obtain equilibrium geometries for the corresponding equatorially- substituted chair cyclohexanes. Are any of the alternative substituted cyclohexanes close enough in energy to the “normal” chair structures to be detectable in an equilibrium mixture at room temperature (> 1%)?
* Even though the non-twisted boat is an energy maximum, if you start with a C2v symmetry structure, it will be maintained in the optimization procedure. A futher example of this is given in the lab activity “Transition States are Molecules Too”.

61
26Molecular Shapes V. Which
Conformer Leads to Product?Successful application of molecular modeling to the description of reactivity and product selectivity assumes knowledge of the structure of the reactant. As many, indeed most, molecules will have more than one conformation, this means knowledge of the “best” (lowest energy) conformation. A simple example is provided by reaction of sodium borohydride with the spiroketal 1 which proceeds with high stereospecificity.*
O O
O
1
O O
OH
13
O O
OH
1:
NaBH4CeCl3
In order to model the process (which “face” of the carbonyl reacts fastest) it is necessary to know which of the four possible confomers of 1, which differ in whether the oxygen in each ring is equatorially or axially disposed relative to the other ring, is most abundant.
In this activity, you will use B3LYP/6-31G* calculations to determine which of the four different conformers of 1 is lowest in energy and then model the selectivity of borohydride addition to this conformer using a LUMO map.
1. One after the other, build all four conformers of 1 and obtain an equilibrium geometry for each using the B3LYP/6-31G* model. Which conformer is the lowest in energy? Are any other conformers close enough in energy to contribute significantly (>1%) to an equilibrium mixture at room temperature? Can you
* De Shong et al. J. Org. Chem. 1991, 56, 3207.

62
offer any precedents to your assignment of favored conformer? Can you offer an explanation?
2. Obtain a LUMO map for the lowest-energy conformer (only).
A LUMO map, which indicates the extent to which the lowest-unoccupied molecular orbital (LUMO) “can be seen” at the “accessible surface” of a molecule, results from displaying the (absolute) value of the LUMO, indicating the most likely regions for electrons to be added, i.e., for nucleophilic attack to occur, on top of a surface of electron density, delineating the space taken up by a molecule. See the topic “Local Ionization Potential Maps and LUMO Maps” for additional insight.
3. When the calculation has completed, display the LUMO map. In this particular case, the LUMO will be localized on the carbonyl carbon, and the question of interest will be at which “face” of the carbonyl group is the LUMO more visible, that is the face where nucleophilic attack is likely to occur. At which face of the carbonyl carbon is the LUMO more visible? Is this result consistent with the experimental stereochemistry for nucleophilic addition? Elaborate.
4. Obtain LUMO maps for the remaining three conformers of 1. Which (if any) give the same preference for nucleophilic addition as the lowest-energy conformer? Which (if any) give the opposite preference?

63
27SN2 Reaction of Cyanide
and Methyl IodideSN2 is often the first reaction encountered by a beginning student of organic chemistry. The reaction of cyanide with methyl iodide, leading to acetonitrile and iodide is typical.
N C– + CH3I CH3CN + I–
It proceeds via an inversion mechanism in which the nucleophile (cyanide) approaches the substrate (methyl iodide) “under the umbrella” made by carbon and its three hydrogens. In response, the umbrella opens (flattens out), leading to a five-coordinate carbon center (the transition state) with partially-formed bonds involving both the nucleophile (cyanide) and the leaving group (iodide).
H
C IC
HH
N
–
Inversion continues and finally leads back to a four-coordinate tetrahedral carbon in which the cyanide has replaced iodide. The importance of the SN2 reaction, aside from the fact that it substitutes one group on carbon for another, is that the inversion of chiral carbon center leads to change of chirality at this center.
A great deal of effort is expended talking about SN2 as it relates to the inversion of carbon. While this is, for the most part, warranted (synthesis of chiral molecules is a challenging enterprise), there are other important questions which could be . . . and should be . . . asked in order to truly understand what is going on in a simple SN2 reaction. Two questions form the basis of this lab activity.
Why does cyanide react at carbon and not at nitrogen?
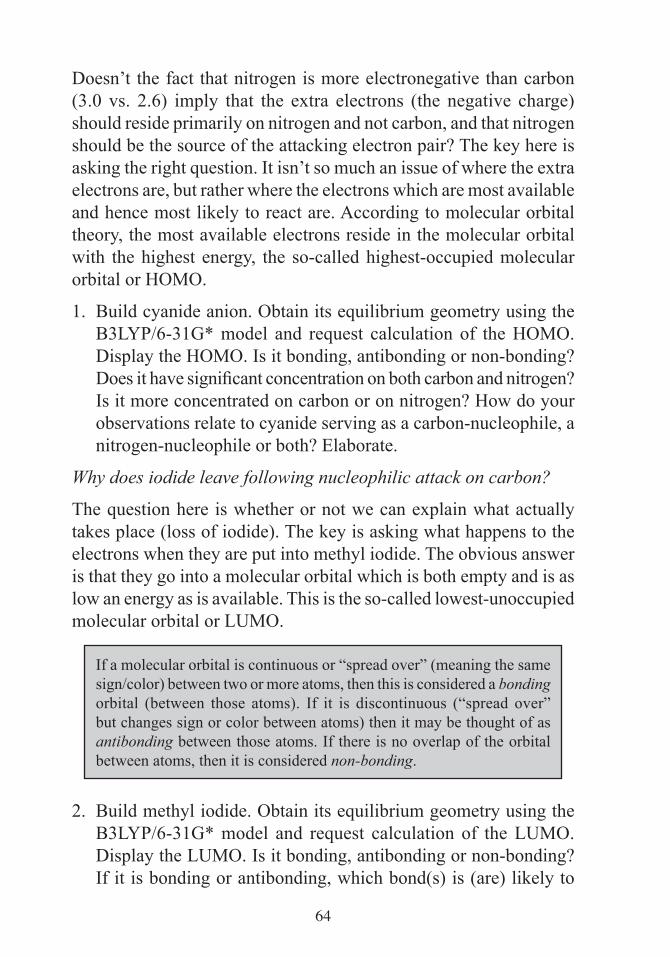
64
Doesn’t the fact that nitrogen is more electronegative than carbon (3.0 vs. 2.6) imply that the extra electrons (the negative charge) should reside primarily on nitrogen and not carbon, and that nitrogen should be the source of the attacking electron pair? The key here is asking the right question. It isn’t so much an issue of where the extra electrons are, but rather where the electrons which are most available and hence most likely to react are. According to molecular orbital theory, the most available electrons reside in the molecular orbital with the highest energy, the so-called highest-occupied molecular orbital or HOMO.
1. Build cyanide anion. Obtain its equilibrium geometry using the B3LYP/6-31G* model and request calculation of the HOMO. Display the HOMO. Is it bonding, antibonding or non-bonding? Does it have significant concentration on both carbon and nitrogen? Is it more concentrated on carbon or on nitrogen? How do your observations relate to cyanide serving as a carbon-nucleophile, a nitrogen-nucleophile or both? Elaborate.
Why does iodide leave following nucleophilic attack on carbon?
The question here is whether or not we can explain what actually takes place (loss of iodide). The key is asking what happens to the electrons when they are put into methyl iodide. The obvious answer is that they go into a molecular orbital which is both empty and is as low an energy as is available. This is the so-called lowest-unoccupied molecular orbital or LUMO.
If a molecular orbital is continuous or “spread over” (meaning the same sign/color) between two or more atoms, then this is considered a bonding orbital (between those atoms). If it is discontinuous (“spread over” but changes sign or color between atoms) then it may be thought of as antibonding between those atoms. If there is no overlap of the orbital between atoms, then it is considered non-bonding.
2. Build methyl iodide. Obtain its equilibrium geometry using the B3LYP/6-31G* model and request calculation of the LUMO. Display the LUMO. Is it bonding, antibonding or non-bonding? If it is bonding or antibonding, which bond(s) is (are) likely to
65
be affected by the addition of electrons (from the nucleophile)? What changes in bond length(s) would you expect? How does your observation relate to what actually happens in the SN2 reaction?
66
28Transition States
are Molecules TooHow can you tell a transition state from a stable molecule? The “reaction coordinate diagram” discussed in the topic “Potential Energy Surfaces” gives you the answer: “a transition state is an energy maximum along the reaction coordinate while a stable molecule is an energy minimum”, but how exactly are you to put this information to use in classifying a particular molecule? The key is detailed knowledge of the way molecules vibrate as a result of their absorbing low-energy (infrared) light.
A diatomic molecule exhibits a single vibrational motion corresponding to expansion and contraction of the bond away from its equilibrium position. The frequency (energy) of vibration is proportional to the square root of the ratio of the “force constant” and the “reduced mass” (see also the topic “Calculating Infrared Spectra”).
force constantreduced massαfrequency
The force constant corresponds to the curvature of the energy surface in the vicinity of the minimum (it is the second derivative of the energy with respect to change in distance away from the equilibrium value). In effect, the magnitude of the force constant tells us whether the motion is “easy” (shallow energy surface meaning a low force constant) or “difficult” (steep energy surface meaning a high force constant).
Analysis of vibrational motions and energies (frequencies) in polyatomic molecules is more complicated, but follows from the same general principles. The main difference is that the vibrational motions in polyatomic molecules seldom correspond to changes in individual bond lengths, bond angles, etc., but rather to combinations of these motions. These combinations are called vibrational modes
67
or normal modes. A particularly simple example of this has already been provided for water molecule in the tutorial “Walking Through Spartan Student”.
This lab is intended to help you draw connections between the “formalism” and the motions which polyatomic molecules actually undergo when they vibrate. It is also intended to show you how knowledge of a molecule’s vibrational frequencies will allow you to say with confidence that a molecule is or is not a minimum energy species, and (if it is not) to say whether it could or could not be a transition state.
1. Build ammonia, NH3, and specify calculation of equilibrium geometry and infrared spectrum using the wB97X-D/6-31G* model. Display the vibrational frequencies and one after the other, animate the vibrational motions. Describe the motion associated with each frequency, and characterize each as being primarily bond stretching, angle bending or a combination of the two. Is bond stretching or angle bending “easier”? Do the stretching motions each involve a single NH bond or do they involve combinations of all three bonds?
All but a few elements occur naturally as a mixture of isotopes, which share the same number of protons and electrons but differ in the number of neutrons and so differ in overall mass. You are likely familiar with the isotopes of uranium. The common “stable” isotope, 238U, has 92 protons and 92 electrons in addition to 146 neutrons, while the “radioactive” isotope 235U has the same number of protons and electrons but only 143 neutrons.
Aside from their difference in mass, isotopes have virtually identical physical and chemical properties. Except for the lightest elements they are very difficult to distinguish and very difficult to separate. In addition, the electronic Schrödinger equation upon which the quantum chemical models in Spartan are based does not contain nuclear mass, meaning that potential energy surfaces for molecules with different isotopes are identical. However, nuclear mass does figure into a variety of physical properties, most important among them being vibrational frequencies (see equation at the beginning of this activity and also the

68
topic “Potential Energy Surfaces”), and thermodynamic quantities such as entropy which depend on the vibrational frequencies.
2. Replace the three hydrogens in ammonia by three deuteriums, the isotope of hydrogen which contains one neutron (the “normal” isotope of hydrogen has no neutrons).
Select Properties from the Display menu and click on a hydrogen. Change Mass Number in the Atom Properties dialog which appears from “1” to “2 (deuterium)”. Repeat for the other hydrogens.
Repeat the calculations and compare the resulting vibrational frequencies (for ND3) with those obtained above for NH3. Rationalize any differences in terms of the expression provided earlier for the vibrational frequency of a diatomic molecule.
3. Next, build ammonia as a planar molecule (as opposed to a “pyramidal”) molecule.
Use trigonal planar nitrogen ( ) instead of tetrahedral nitrogen in the organic model kit.
Calculate its equilibrium geometry and infrared spectrum using the wB97X-D/6-31G* model just as you did for pyramidal ammonia.
The first frequency listed is preceded by an “i”. This indicates that it is an “imaginary” (as opposed to a “real”) number. Given what you know from diatomic molecules, and given that reduced mass is necessarily a positive quantity, what does this tell you the sign of the force constant for this particular vibrational motion? What does this tell you about the position of planar ammonia on the potential energy surface? Describe the motion. Identify the analogous motion in pyramidal ammonia. Is it a low or high frequency (energy) motion?
A transition state, like a “stable molecule”, is a well-defined point on the overall potential energy surface. It differs from a stable molecule in that not all of its “coordinates” are at minimum energy positions on the surface. Rather, one and only one coordinate is at an energy

69
maximum on the surface. Liken the situation to a mountain pass, which is both a minimum (look to the left and right to see the mountain peaks towering above) and a maximum (look forward and backward to see the valleys below).
It is the “easiest way” to cross over a mountain range, just like a transition state in a chemical reaction is the easiest (lowest-energy) way to go between reactants and products.
Not all transition states are as simple as planar ammonia, connecting the two equivalent forms of pyramidal ammonia, but all are characterized by a single imaginary vibrational frequency.
4. Bring the boat form of cyclohexane onto the screen. This corresponds to a possible transition state connecting the chair and twist boat forms of cyclohexane (see the topic “Potential Energy Surfaces” as well as the lab activity “Molecular Shapes IV. The “Other” Cyclohexane”).
Select “boat cyclohexane” from the files in the “labs” directory.
Locate the imaginary frequency and describe the motion of atoms as best as you can.

70
29What Do Transition States
Look Like?There is an enormous body of experimental knowledge about molecular geometry. The structures of upwards of a million crystalline solids have been determined, primarily through X-ray crystallography. The diversity is enormous, ranging from small inorganic and organic molecules to proteins, polymers and materials. In addition, the geometries of more than 3000 small molecules have been determined, either in the gas phase or in solution. While not as diverse a collection, included are structures for a variety of highly-reactive species. Taken all together, this information has given chemists a clear picture of what is normal and what is not, and enabled them to accurately guess the geometries of molecules that are not yet known.
What is completely missing from this picture is experimental information about transition states. The reason is simple. A transition state is not a minimum on a potential energy surface and therefore cannot serve as a “trap” (see the previous lab “Transition States are Molecules Too” as well as the topic “Potential Energy Surfaces”). In other words, transition states do not exist in the sense of being able to put a collection of them into a bottle. This is not a problem for quantum chemical calculations. Any molecule, real or imaginary, in fact, any collection of nuclei and electrons, may be calculated, and the results of the calculations can be used to show that the molecule could exist or could be a transition state.
The purpose of this activity is to show you how to calculate transition states for simple chemical reactions, and to have you relate their structures to those of normal (stable) molecules. You will first examine the rearrangement of methyl isocyanide, CH3NC, to acetonitrile, CH3CN. This is an example of a unimolecular process in which a
71
molecule remains intact, but reorganizes to give rise to a lower-energy geometry. You will confirm that the process is energetically “downhill”, and then identify and characterize the transition state. Following this, you will look at a somewhat more complicated bimolecular reaction involving the splitting of ethyl formate into formic acid and ethylene.
1. Build both acetonitrile, CH3C≡N and methyl isocyanide, CH3N≡C.
To construct methyl isocyanide, first build propyne, CH3C≡CH and delete the alkyne hydrogen (Delete from the Build menu). Next, bring up the inorganic model kit (click on the Inorganic tab at the top of the organic model kit), select N from the Periodic Table and double click on the central carbon.
Obtain B3LYP/6-31G* equilibrium geometries for both molecules. Which molecule, methyl isocyanide or acetonitrile is more stable (lower in energy) according to your calculations? How does the calculated energy difference between the two compare with the experimental enthalpy difference of 86 kJ/mol in favor of acetonitrile?
2. Build a guess at the transition state for geometrical rearrangement.
Start with acetonitrile. Select Transition States from the Search menu ( ), click on the CC bond, next click on the methyl carbon and on the nitrogen. Finally, click on at the bottom of the screen to produce a guess at the transition state.
Specify calculation of transition-state geometry using the B3LYP/6-31G* model and also request an infrared spectrum. The calculations may require several minutes.
When complete, first examine the vibrational (infrared) frequencies. Is there one imaginary frequency? If so, animate the vibrational motion associated with this frequency to convince yourself that it corresponds to a reasonable reaction coordinate (connecting

72
methyl isocyanide and acetonitrile).
Next, examine the geometry of the transition state. Does it incorporate a “full” triple bond (as do both reactant and product)? Is the migrating methyl group midway between reactant and product or is it closer to either the reactant or product? Elaborate. Given the thermodynamics of the reaction, is this result consistent with the Hammond Postulate?
The Hammond Postulate states that the transition state for an exothermic reaction will more closely resemble reactants than products.
A somewhat more complicated reaction is that involving “splitting’ of ethyl formate into formic acid and ethylene in response to heat (a so-called pyrolysis reaction). This reaction is quite similar to the “ene” reaction of 1-pentene (leading to propene and ethylene) already discussed in the tutorial “Chemical Reactions”. Both reactions involve single bond cleavage and transfer of a hydrogen.
C
CO
C
O C
CH
HO
CHHH
H
ethyl formate ethylene formic acid
H
O
H
H
+
HH H
C
CO
C
O
HHH
HH H
3. Build ethyl formate, ethylene and formic acid. Obtain equilibrium geometries for all three molecules using the B3LYP/6-31G* model. Is the reaction as written above exothermic or endothermic (see the topic “Total Energies and Thermodynamic and Kinetic Data”)? Based on this and on the Hammond Postulate, would you expect the transition state to more closely resemble reactants or products?
4. Build a guess at the pyrolysis transition state.
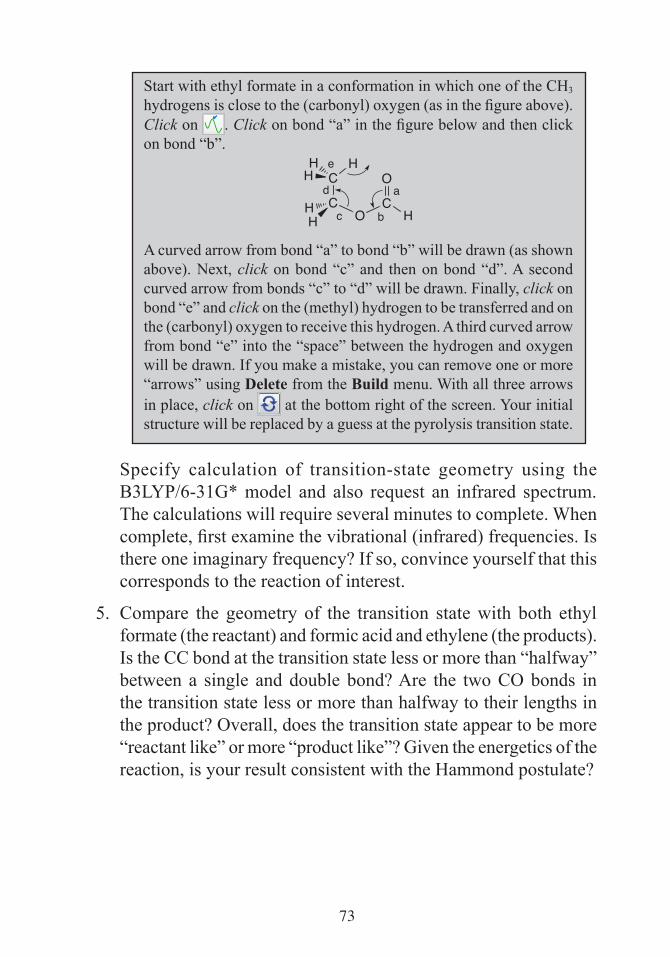
73
Start with ethyl formate in a conformation in which one of the CH3 hydrogens is close to the (carbonyl) oxygen (as in the figure above). Click on . Click on bond “a” in the figure below and then click on bond “b”.
C
CO
C
O
HHH
a
bc
d
eHH
H
A curved arrow from bond “a” to bond “b” will be drawn (as shown above). Next, click on bond “c” and then on bond “d”. A second curved arrow from bonds “c” to “d” will be drawn. Finally, click on bond “e” and click on the (methyl) hydrogen to be transferred and on the (carbonyl) oxygen to receive this hydrogen. A third curved arrow from bond “e” into the “space” between the hydrogen and oxygen will be drawn. If you make a mistake, you can remove one or more “arrows” using Delete from the Build menu. With all three arrows in place, click on at the bottom right of the screen. Your initial structure will be replaced by a guess at the pyrolysis transition state.
Specify calculation of transition-state geometry using the B3LYP/6-31G* model and also request an infrared spectrum. The calculations will require several minutes to complete. When complete, first examine the vibrational (infrared) frequencies. Is there one imaginary frequency? If so, convince yourself that this corresponds to the reaction of interest.
5. Compare the geometry of the transition state with both ethyl formate (the reactant) and formic acid and ethylene (the products). Is the CC bond at the transition state less or more than “halfway” between a single and double bond? Are the two CO bonds in the transition state less or more than halfway to their lengths in the product? Overall, does the transition state appear to be more “reactant like” or more “product like”? Given the energetics of the reaction, is your result consistent with the Hammond postulate?

74
30Reactions that
“Twist and Turn”Carbenes are reactive intermediates in which one carbon atom is surrounded by only six valence electrons instead of the normal complement of eight. Triplet carbenes, for example, methylene (CH2), have two half-filled molecular orbitals, one in the plane of the molecule and the other perpendicular to the plane.
CHH
methylene
Their chemistry closely resembles that of radicals. Singlet carbenes, for example, difluorocarbene (CF2) have two electrons in an in-plane molecular orbital, leaving the out-of-plane molecular orbital vacant.*
CFF
difluorocarbene
This suggests that singlet carbenes should, in principle, either be able to act as nucleophiles by “donating” their electron pair, or as electrophiles, by “accepting” an electron pair.
In the first part of this lab activity, you will compare the HOMO and LUMO of difluorocarbene with the qualitative descriptions provided above.
* The molecular orbitals of singlet methylene are described in the topic “Atomic and Molecular Orbitals”.
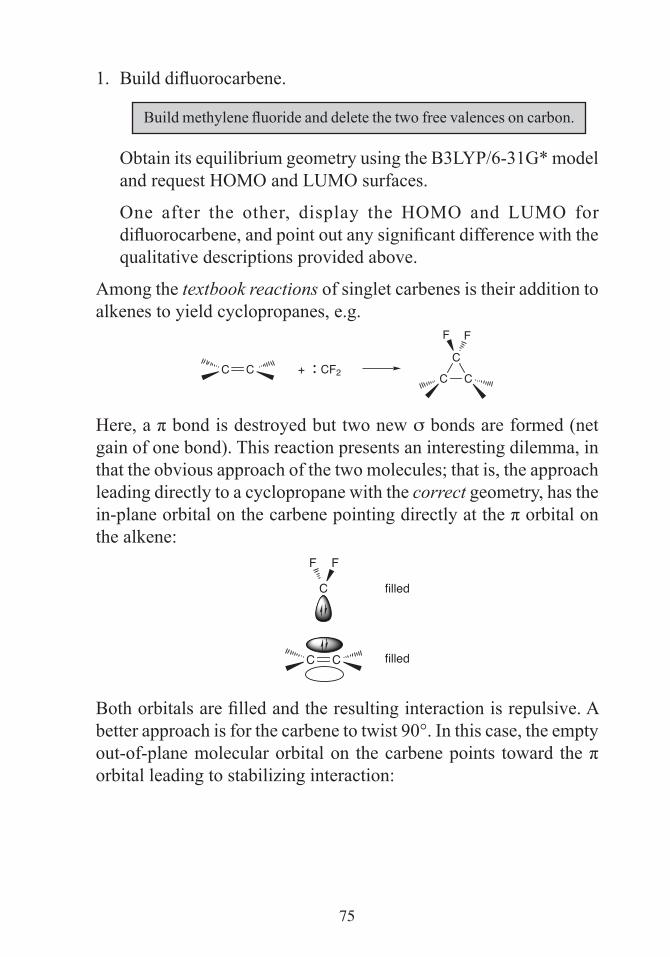
75
1. Build difluorocarbene.
Build methylene fluoride and delete the two free valences on carbon.
Obtain its equilibrium geometry using the B3LYP/6-31G* model and request HOMO and LUMO surfaces.
One after the other, display the HOMO and LUMO for difluorocarbene, and point out any significant difference with the qualitative descriptions provided above.
Among the textbook reactions of singlet carbenes is their addition to alkenes to yield cyclopropanes, e.g.
C C + CF2••C
C C
FF
Here, a π bond is destroyed but two new σ bonds are formed (net gain of one bond). This reaction presents an interesting dilemma, in that the obvious approach of the two molecules; that is, the approach leading directly to a cyclopropane with the correct geometry, has the in-plane orbital on the carbene pointing directly at the π orbital on the alkene:
C C
C
FF
filled
filled
Both orbitals are filled and the resulting interaction is repulsive. A better approach is for the carbene to twist 90°. In this case, the empty out-of-plane molecular orbital on the carbene points toward the π orbital leading to stabilizing interaction:
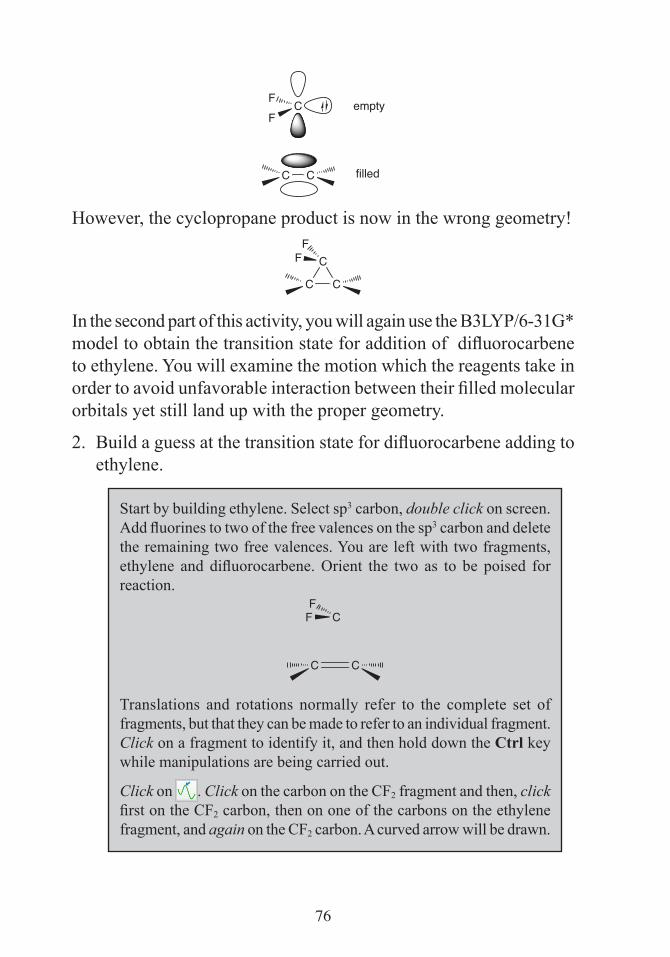
76
CFF
C C
empty
filled
However, the cyclopropane product is now in the wrong geometry!
C C
CF
F
In the second part of this activity, you will again use the B3LYP/6-31G* model to obtain the transition state for addition of difluorocarbene to ethylene. You will examine the motion which the reagents take in order to avoid unfavorable interaction between their filled molecular orbitals yet still land up with the proper geometry.
2. Build a guess at the transition state for difluorocarbene adding to ethylene.
Start by building ethylene. Select sp3 carbon, double click on screen. Add fluorines to two of the free valences on the sp3 carbon and delete the remaining two free valences. You are left with two fragments, ethylene and difluorocarbene. Orient the two as to be poised for reaction.
C
C C
FF
Translations and rotations normally refer to the complete set of fragments, but that they can be made to refer to an individual fragment. Click on a fragment to identify it, and then hold down the Ctrl key while manipulations are being carried out.
Click on . Click on the carbon on the CF2 fragment and then, click first on the CF2 carbon, then on one of the carbons on the ethylene fragment, and again on the CF2 carbon. A curved arrow will be drawn.
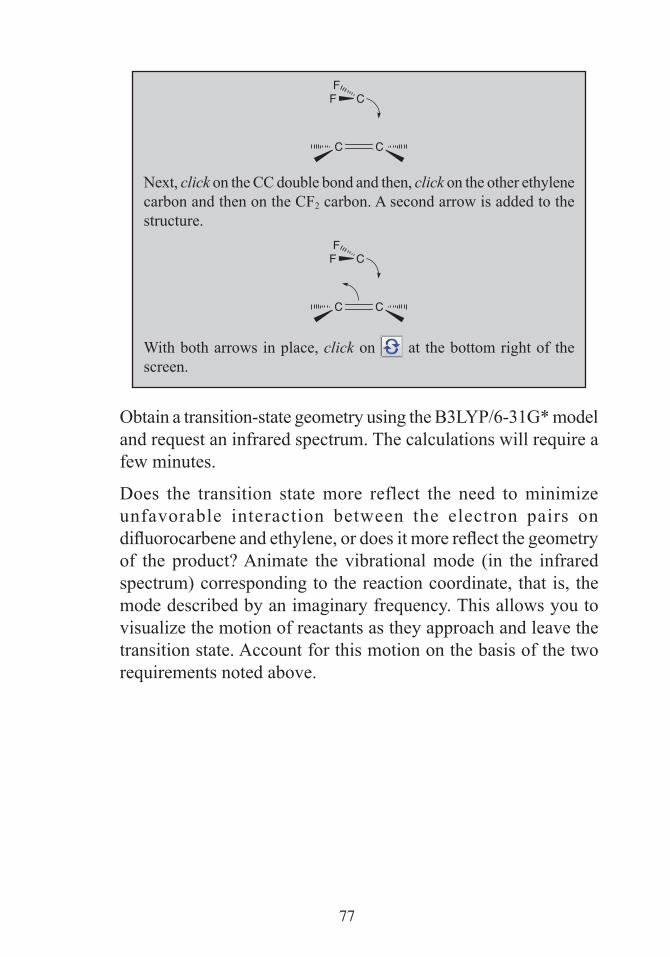
77
C
C C
FF
Next, click on the CC double bond and then, click on the other ethylene carbon and then on the CF2 carbon. A second arrow is added to the structure.
C
C C
FF
With both arrows in place, click on at the bottom right of the screen.
Obtain a transition-state geometry using the B3LYP/6-31G* model and request an infrared spectrum. The calculations will require a few minutes.
Does the transition state more reflect the need to minimize unfavorable interaction between the electron pairs on difluorocarbene and ethylene, or does it more reflect the geometry of the product? Animate the vibrational mode (in the infrared spectrum) corresponding to the reaction coordinate, that is, the mode described by an imaginary frequency. This allows you to visualize the motion of reactants as they approach and leave the transition state. Account for this motion on the basis of the two requirements noted above.
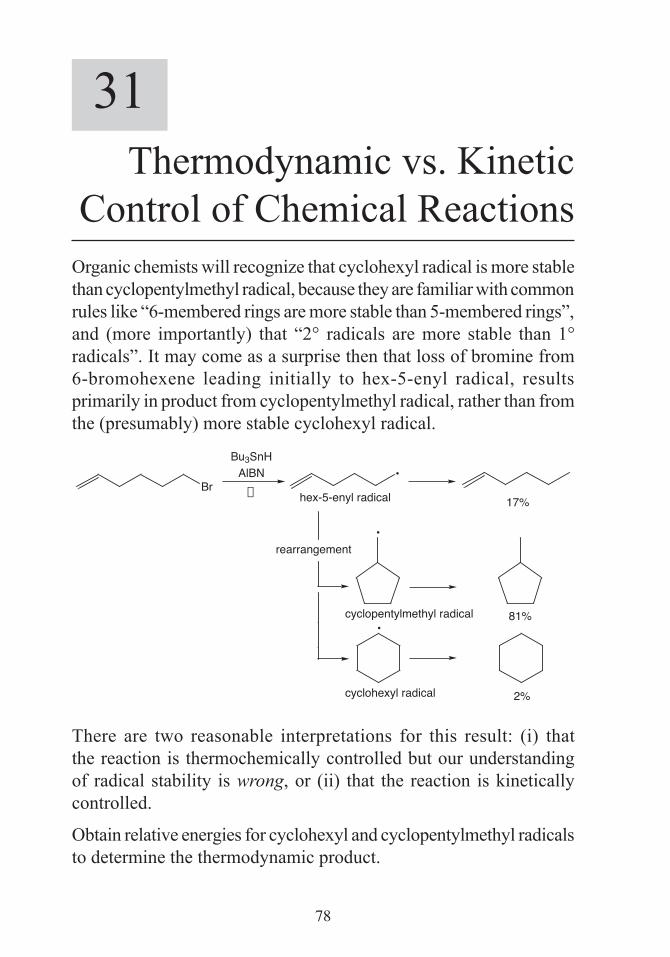
78
31Thermodynamic vs. Kinetic
Control of Chemical ReactionsOrganic chemists will recognize that cyclohexyl radical is more stable than cyclopentylmethyl radical, because they are familiar with common rules like “6-membered rings are more stable than 5-membered rings”, and (more importantly) that “2° radicals are more stable than 1° radicals”. It may come as a surprise then that loss of bromine from 6-bromohexene leading initially to hex-5-enyl radical, results primarily in product from cyclopentylmethyl radical, rather than from the (presumably) more stable cyclohexyl radical.
Br•
•
17%
Bu3SnHAlBN
2%
81%
rearrangement•
hex-5-enyl radical
cyclopentylmethyl radical
cyclohexyl radical
There are two reasonable interpretations for this result: (i) that the reaction is thermochemically controlled but our understanding of radical stability is wrong, or (ii) that the reaction is kinetically controlled.
Obtain relative energies for cyclohexyl and cyclopentylmethyl radicals to determine the thermodynamic product.
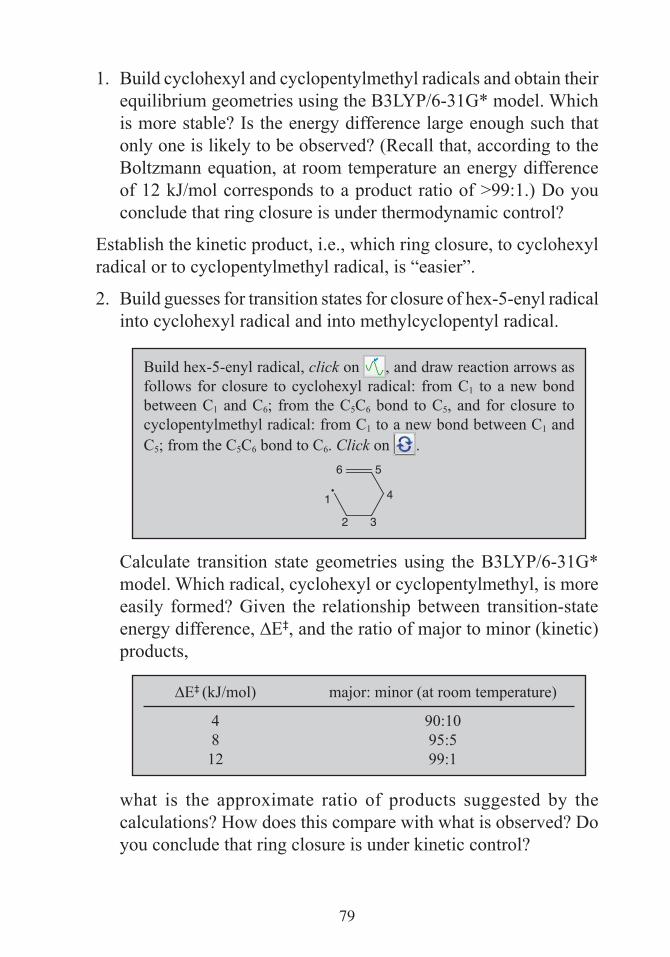
79
1. Build cyclohexyl and cyclopentylmethyl radicals and obtain their equilibrium geometries using the B3LYP/6-31G* model. Which is more stable? Is the energy difference large enough such that only one is likely to be observed? (Recall that, according to the Boltzmann equation, at room temperature an energy difference of 12 kJ/mol corresponds to a product ratio of >99:1.) Do you conclude that ring closure is under thermodynamic control?
Establish the kinetic product, i.e., which ring closure, to cyclohexyl radical or to cyclopentylmethyl radical, is “easier”.
2. Build guesses for transition states for closure of hex-5-enyl radical into cyclohexyl radical and into methylcyclopentyl radical.
Build hex-5-enyl radical, click on , and draw reaction arrows as follows for closure to cyclohexyl radical: from C1 to a new bond between C1 and C6; from the C5C6 bond to C5, and for closure to cyclopentylmethyl radical: from C1 to a new bond between C1 and C5; from the C5C6 bond to C6. Click on .
5
4
32
1•
6
Calculate transition state geometries using the B3LYP/6-31G* model. Which radical, cyclohexyl or cyclopentylmethyl, is more easily formed? Given the relationship between transition-state energy difference, ∆E‡, and the ratio of major to minor (kinetic) products,
∆E‡ (kJ/mol) major: minor (at room temperature)
4 90:10 8 95:5 12 99:1
what is the approximate ratio of products suggested by the calculations? How does this compare with what is observed? Do you conclude that ring closure is under kinetic control?

80
32Anticipating Rates of
Chemical ReactionsThe rate of Diels-Alder reactions generally increases with π-donor ability of the electron-donor group (EDG) on the diene, and with π-acceptor ability of the electron-withdrawing group (EWG) on the dienophile.
EDG
EWG
Y
X
+ EDG = R, OR
EWG = CN, CHO, CO2H
The usual interpretation is that donors will push up the energy of the HOMO on the diene and acceptors will push down the energy of the LUMO on the dienophile. Any decrease in so-called “HOMO-LUMO gap” should lead to stronger interaction between diene and dienophile and to a decrease in reaction barrier.
HOMO
LUMO
dienophilediene
OrbitalEnergy
In this lab, you will first test such a hypothesis using the following rate data for Diels-Alder cycloadditions involving cyclopentadiene as a diene and cyano-substituted alkenes as dienophiles (expressed in log units relative to the rate of cyclopentadiene and acrylonitrile).
acrylonitrile 0 1,1-dicyanoethylene 4.64trans-1,2-dicyanoethylene 1.89 tricyanoethylene 5.66cis-1,2-dicyanoethylene 1.94 tetracyanoethylene 7.61
You will then obtain transition states for reactions of cyclopentadiene and both acrylonitrile and tetracyanoethylene.
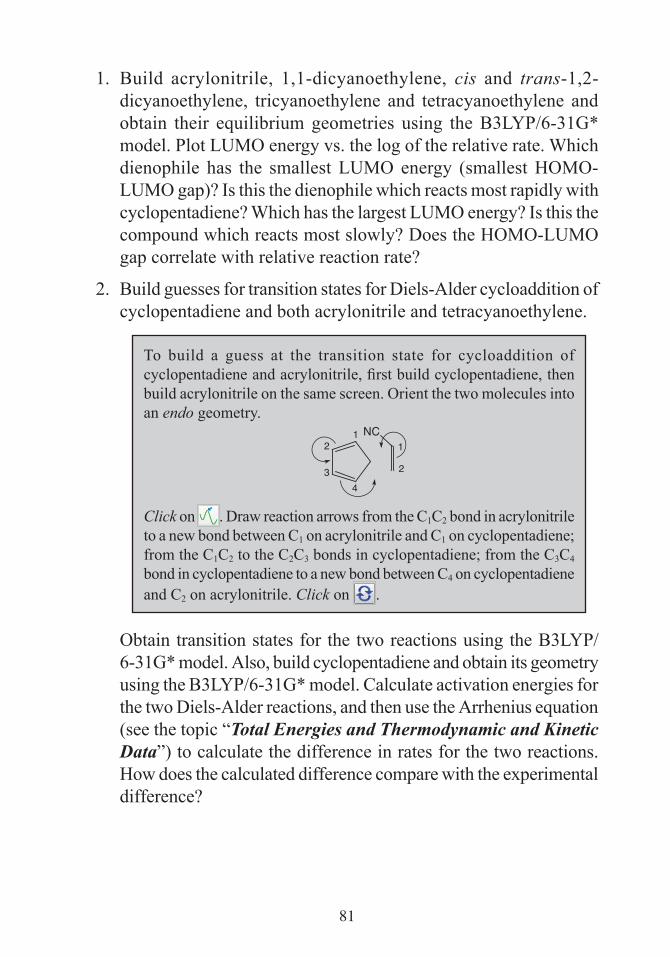
81
1. Build acrylonitrile, 1,1-dicyanoethylene, cis and trans-1,2-dicyanoethylene, tricyanoethylene and tetracyanoethylene and obtain their equilibrium geometries using the B3LYP/6-31G* model. Plot LUMO energy vs. the log of the relative rate. Which dienophile has the smallest LUMO energy (smallest HOMO-LUMO gap)? Is this the dienophile which reacts most rapidly with cyclopentadiene? Which has the largest LUMO energy? Is this the compound which reacts most slowly? Does the HOMO-LUMO gap correlate with relative reaction rate?
2. Build guesses for transition states for Diels-Alder cycloaddition of cyclopentadiene and both acrylonitrile and tetracyanoethylene.
To build a guess at the transition state for cycloaddition of cyclopentadiene and acrylonitrile, first build cyclopentadiene, then build acrylonitrile on the same screen. Orient the two molecules into an endo geometry.
NC1
2
12
34
Click on . Draw reaction arrows from the C1C2 bond in acrylonitrile to a new bond between C1 on acrylonitrile and C1 on cyclopentadiene; from the C1C2 to the C2C3 bonds in cyclopentadiene; from the C3C4 bond in cyclopentadiene to a new bond between C4 on cyclopentadiene and C2 on acrylonitrile. Click on .
Obtain transition states for the two reactions using the B3LYP/ 6-31G* model. Also, build cyclopentadiene and obtain its geometry using the B3LYP/6-31G* model. Calculate activation energies for the two Diels-Alder reactions, and then use the Arrhenius equation (see the topic “Total Energies and Thermodynamic and Kinetic Data”) to calculate the difference in rates for the two reactions. How does the calculated difference compare with the experimental difference?
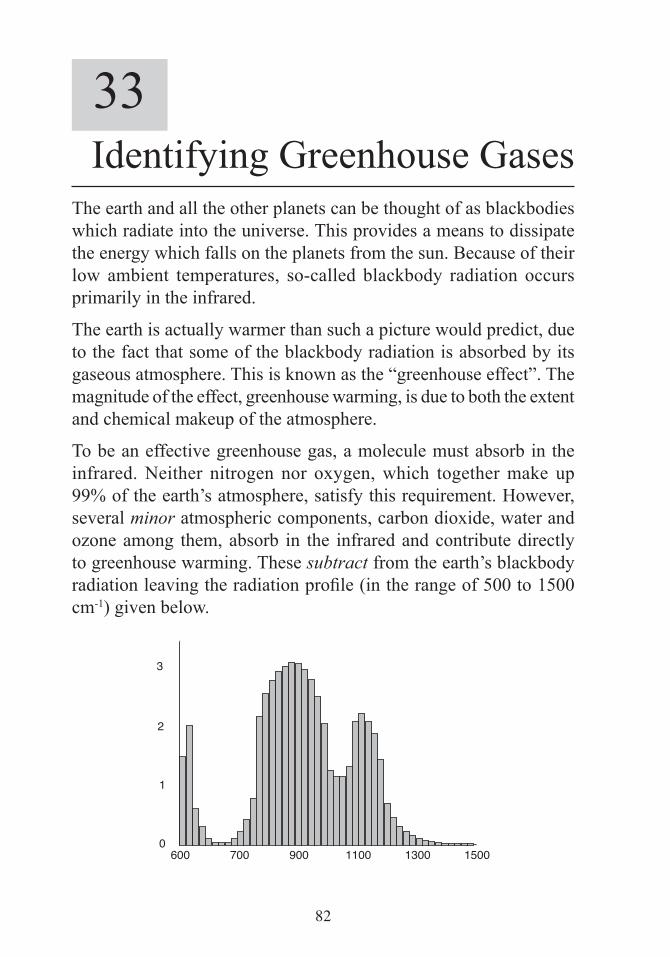
82
33Identifying Greenhouse Gases
The earth and all the other planets can be thought of as blackbodies which radiate into the universe. This provides a means to dissipate the energy which falls on the planets from the sun. Because of their low ambient temperatures, so-called blackbody radiation occurs primarily in the infrared.
The earth is actually warmer than such a picture would predict, due to the fact that some of the blackbody radiation is absorbed by its gaseous atmosphere. This is known as the “greenhouse effect”. The magnitude of the effect, greenhouse warming, is due to both the extent and chemical makeup of the atmosphere.
To be an effective greenhouse gas, a molecule must absorb in the infrared. Neither nitrogen nor oxygen, which together make up 99% of the earth’s atmosphere, satisfy this requirement. However, several minor atmospheric components, carbon dioxide, water and ozone among them, absorb in the infrared and contribute directly to greenhouse warming. These subtract from the earth’s blackbody radiation leaving the radiation profile (in the range of 500 to 1500 cm-1) given below.
1
2
3
0600 700 900 1100 1300 1500
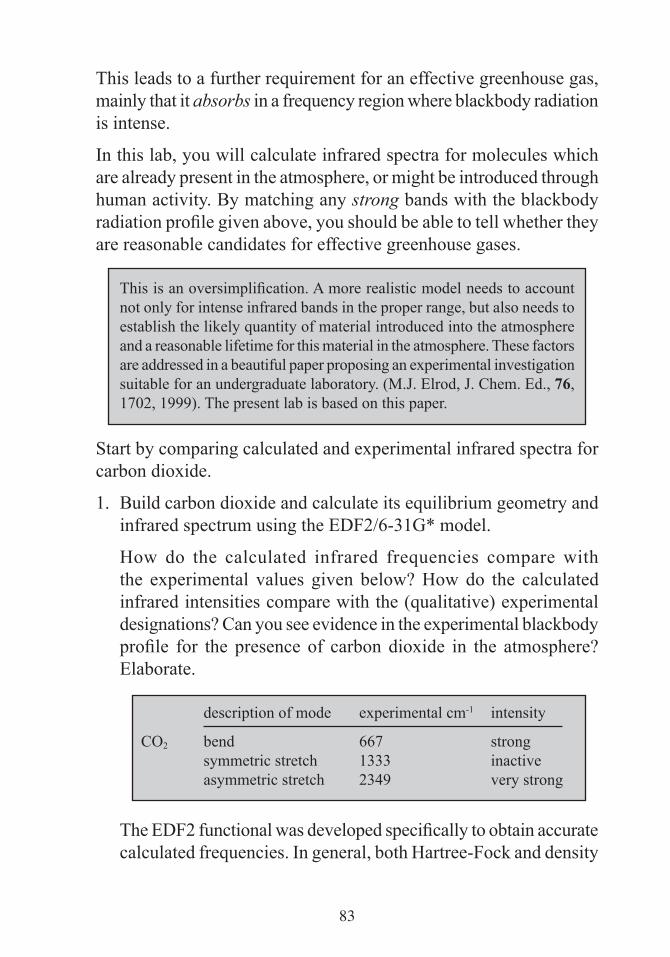
83
This leads to a further requirement for an effective greenhouse gas, mainly that it absorbs in a frequency region where blackbody radiation is intense.
In this lab, you will calculate infrared spectra for molecules which are already present in the atmosphere, or might be introduced through human activity. By matching any strong bands with the blackbody radiation profile given above, you should be able to tell whether they are reasonable candidates for effective greenhouse gases.
This is an oversimplification. A more realistic model needs to account not only for intense infrared bands in the proper range, but also needs to establish the likely quantity of material introduced into the atmosphere and a reasonable lifetime for this material in the atmosphere. These factors are addressed in a beautiful paper proposing an experimental investigation suitable for an undergraduate laboratory. (M.J. Elrod, J. Chem. Ed., 76, 1702, 1999). The present lab is based on this paper.
Start by comparing calculated and experimental infrared spectra for carbon dioxide.
1. Build carbon dioxide and calculate its equilibrium geometry and infrared spectrum using the EDF2/6-31G* model.
How do the calculated infrared frequencies compare with the experimental values given below? How do the calculated infrared intensities compare with the (qualitative) experimental designations? Can you see evidence in the experimental blackbody profile for the presence of carbon dioxide in the atmosphere? Elaborate.
description of mode experimental cm-1 intensity
CO 2 bend 667 strong symmetric stretch 1333 inactive asymmetric stretch 2349 very strong
The EDF2 functional was developed specifically to obtain accurate calculated frequencies. In general, both Hartree-Fock and density
84
functional models provide frequencies that are systematically higher than experimental values.
If necessary, propose a single multiplicative factor that will bring calculated frequencies in line with experimental values.
Methane and nitrous oxide (N2O) are both introduced into the atmosphere from agriculture. Methane is also released as a result of oil recovery and fuel production. 1,1,1,2-tetrafluoroethane is now widely used in automobile air conditioners and is likely also introduced into the atmosphere in significant quantities.
2. Build methane, nitrous oxide and 1,1,1,2-tetrafluoroethane, and calculate the equilibrium geometry and infrared spectrum of each.
Nitrous oxide is linear. To build it, start with Allene from the Groups menu and delete all four free valences. Then, bring up the inorganic model kit, select N from the Periodic Table and double click on two adjacent carbons. Finally, select O from the Periodic Table and double click on the remaining carbon.
One after the other, display the infrared spectrum for each of the three molecules. Using as a selection criterion the presence of a (modestly) strong infrared absorption in the range of 500 - 1500 cm-1, comment as to whether each might be an effective greenhouse gas.
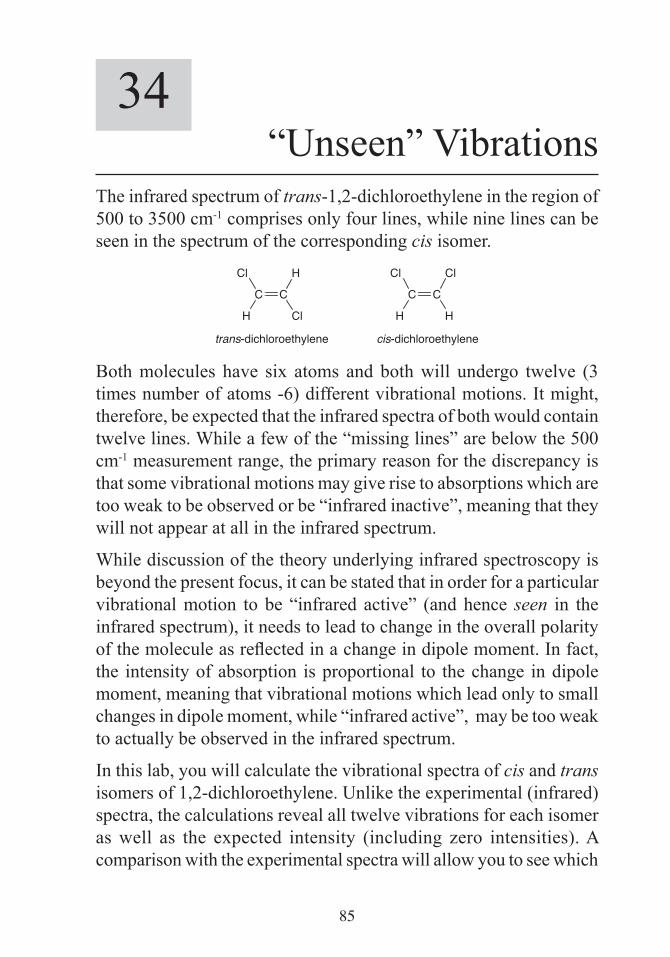
85
34“Unseen” Vibrations
The infrared spectrum of trans-1,2-dichloroethylene in the region of 500 to 3500 cm-1 comprises only four lines, while nine lines can be seen in the spectrum of the corresponding cis isomer.
C C
H
Cl H
Cl
C C
H
Cl Cl
H
trans-dichloroethylene cis-dichloroethylene
Both molecules have six atoms and both will undergo twelve (3 times number of atoms -6) different vibrational motions. It might, therefore, be expected that the infrared spectra of both would contain twelve lines. While a few of the “missing lines” are below the 500 cm-1 measurement range, the primary reason for the discrepancy is that some vibrational motions may give rise to absorptions which are too weak to be observed or be “infrared inactive”, meaning that they will not appear at all in the infrared spectrum.
While discussion of the theory underlying infrared spectroscopy is beyond the present focus, it can be stated that in order for a particular vibrational motion to be “infrared active” (and hence seen in the infrared spectrum), it needs to lead to change in the overall polarity of the molecule as reflected in a change in dipole moment. In fact, the intensity of absorption is proportional to the change in dipole moment, meaning that vibrational motions which lead only to small changes in dipole moment, while “infrared active”, may be too weak to actually be observed in the infrared spectrum.
In this lab, you will calculate the vibrational spectra of cis and trans isomers of 1,2-dichloroethylene. Unlike the experimental (infrared) spectra, the calculations reveal all twelve vibrations for each isomer as well as the expected intensity (including zero intensities). A comparison with the experimental spectra will allow you to see which

86
lines are unobserved because they are outside the measurement range and which are unobserved because they are weak or inactive.
1. Build both trans and cis-dichloroethylene. Calculate the equilibrium geometry for each along with the infrared spectrum using the EDF2/6-31G* model.
Examine the infrared spectrum for cis-dichloroethylene. (It is useful to look at the table of frequencies and intensities rather than the actual spectrum.) Associate each vibration falling between 500 and 3500 cm-1 and having an intensity 1% or greater of the maximum intensity with the experimental data provided below. Use the (experimentally assigned) “description of vibration” as well as the labels describing the “symmetry of vibration” to assist you.
description of vibration symmetry of vibration frequency
CCCl deformation b1 571CH bend b2 697CCl stretch a1 711CCl stretch b1 857CH bend a1 1179CH bend b1 1303CC stretch a1 1587CH stretch b1 3072CH stretch a1 3077
Repeat your analysis with trans-1,2-dichloroethylene.
description of vibration symmetry of vibration frequency
CCl stretch bu 828CH bend au 900CH bend bu 1200CH stretch bu 3090
Do the calculations provide a quantitatively correct description of the observed infrared spectra for cis and trans-dichloroethylene, that is, properly assign those lines which are intense enough to actually be observed?
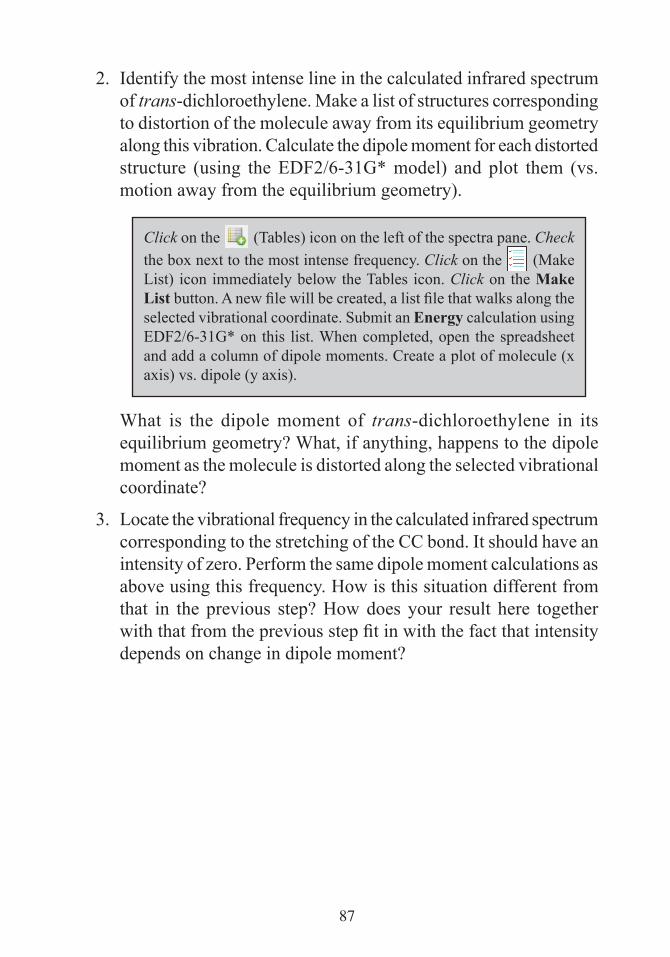
87
2. Identify the most intense line in the calculated infrared spectrum of trans-dichloroethylene. Make a list of structures corresponding to distortion of the molecule away from its equilibrium geometry along this vibration. Calculate the dipole moment for each distorted structure (using the EDF2/6-31G* model) and plot them (vs. motion away from the equilibrium geometry).
Click on the (Tables) icon on the left of the spectra pane. Check the box next to the most intense frequency. Click on the (Make List) icon immediately below the Tables icon. Click on the Make List button. A new file will be created, a list file that walks along the selected vibrational coordinate. Submit an Energy calculation using EDF2/6-31G* on this list. When completed, open the spreadsheet and add a column of dipole moments. Create a plot of molecule (x axis) vs. dipole (y axis).
What is the dipole moment of trans-dichloroethylene in its equilibrium geometry? What, if anything, happens to the dipole moment as the molecule is distorted along the selected vibrational coordinate?
3. Locate the vibrational frequency in the calculated infrared spectrum corresponding to the stretching of the CC bond. It should have an intensity of zero. Perform the same dipole moment calculations as above using this frequency. How is this situation different from that in the previous step? How does your result here together with that from the previous step fit in with the fact that intensity depends on change in dipole moment?
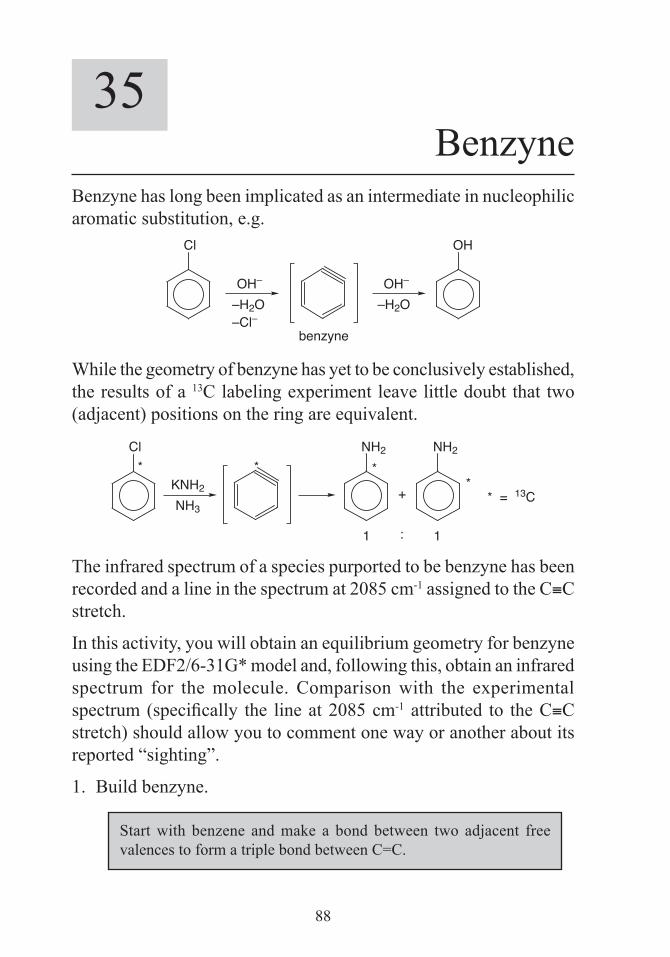
88
35Benzyne
Benzyne has long been implicated as an intermediate in nucleophilic aromatic substitution, e.g.
–H2O–Cl–
Cl
OH– OH–
–H2O
benzyne
OH
While the geometry of benzyne has yet to be conclusively established, the results of a 13C labeling experiment leave little doubt that two (adjacent) positions on the ring are equivalent.
Cl*
KNH2
NH3
*NH2
*NH2
*+
1 : 1
* = 13C
The infrared spectrum of a species purported to be benzyne has been recorded and a line in the spectrum at 2085 cm-1 assigned to the C≡C stretch.
In this activity, you will obtain an equilibrium geometry for benzyne using the EDF2/6-31G* model and, following this, obtain an infrared spectrum for the molecule. Comparison with the experimental spectrum (specifically the line at 2085 cm-1 attributed to the C≡C stretch) should allow you to comment one way or another about its reported “sighting”.
1. Build benzyne.
Start with benzene and make a bond between two adjacent free valences to form a triple bond between C=C.
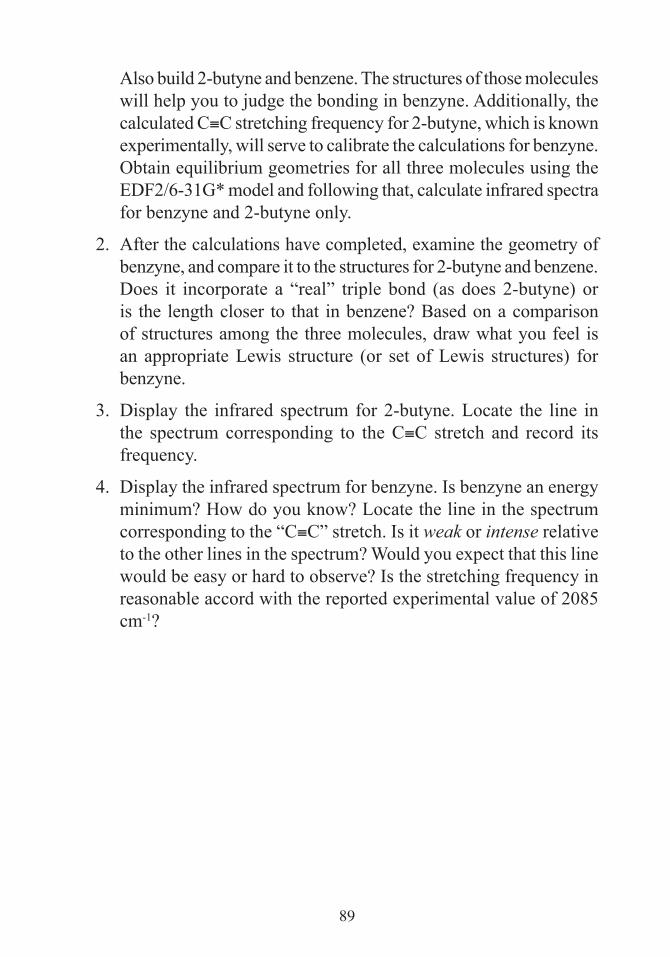
89
Also build 2-butyne and benzene. The structures of those molecules will help you to judge the bonding in benzyne. Additionally, the calculated C≡C stretching frequency for 2-butyne, which is known experimentally, will serve to calibrate the calculations for benzyne. Obtain equilibrium geometries for all three molecules using the EDF2/6-31G* model and following that, calculate infrared spectra for benzyne and 2-butyne only.
2. After the calculations have completed, examine the geometry of benzyne, and compare it to the structures for 2-butyne and benzene. Does it incorporate a “real” triple bond (as does 2-butyne) or is the length closer to that in benzene? Based on a comparison of structures among the three molecules, draw what you feel is an appropriate Lewis structure (or set of Lewis structures) for benzyne.
3. Display the infrared spectrum for 2-butyne. Locate the line in the spectrum corresponding to the C≡C stretch and record its frequency.
4. Display the infrared spectrum for benzyne. Is benzyne an energy minimum? How do you know? Locate the line in the spectrum corresponding to the “C≡C” stretch. Is it weak or intense relative to the other lines in the spectrum? Would you expect that this line would be easy or hard to observe? Is the stretching frequency in reasonable accord with the reported experimental value of 2085 cm-1?
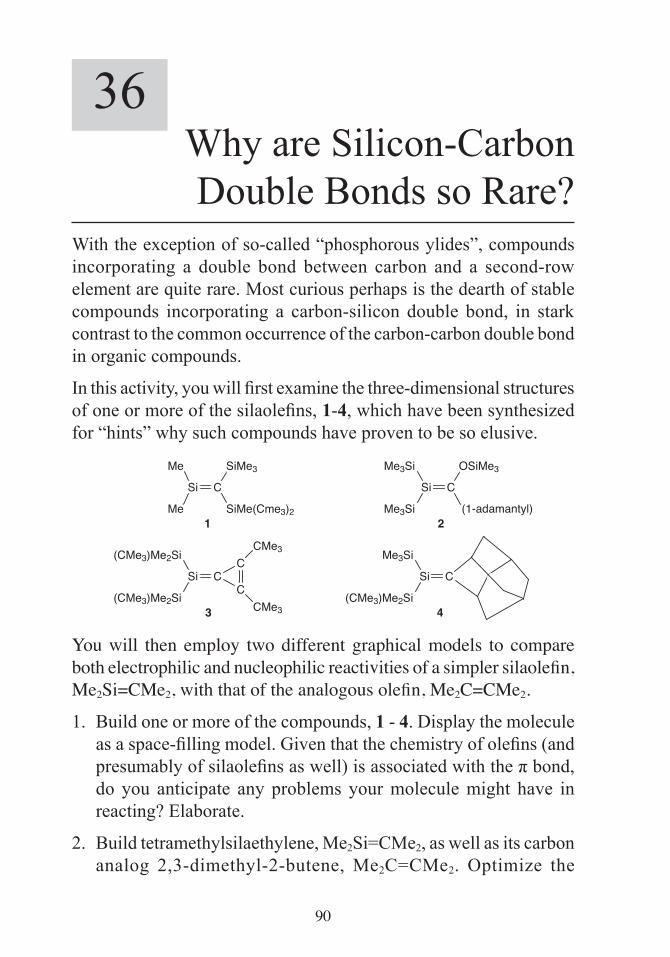
90
36Why are Silicon-Carbon Double Bonds so Rare?
With the exception of so-called “phosphorous ylides”, compounds incorporating a double bond between carbon and a second-row element are quite rare. Most curious perhaps is the dearth of stable compounds incorporating a carbon-silicon double bond, in stark contrast to the common occurrence of the carbon-carbon double bond in organic compounds.
In this activity, you will first examine the three-dimensional structures of one or more of the silaolefins, 1-4, which have been synthesized for “hints” why such compounds have proven to be so elusive.
Si C
SiMe3
Me SiMe(Cme3)2
Me
Si C
OSiMe3
Me3Si
Me3Si
1 2(1-adamantyl)
Si CC
(CMe3)Me2Si C
(CMe3)Me2Si
3
CMe3
CMe3
Si C
(CMe3)Me2Si
Me3Si
4
You will then employ two different graphical models to compare both electrophilic and nucleophilic reactivities of a simpler silaolefin, Me2Si=CMe2, with that of the analogous olefin, Me2C=CMe2.
1. Build one or more of the compounds, 1 - 4. Display the molecule as a space-filling model. Given that the chemistry of olefins (and presumably of silaolefins as well) is associated with the π bond, do you anticipate any problems your molecule might have in reacting? Elaborate.
2. Build tetramethylsilaethylene, Me2Si=CMe2, as well as its carbon analog 2,3-dimethyl-2-butene, Me2C=CMe2. Optimize the

91
geometries of both molecules using the B3LYP/6-31G* model and following this, obtain both a local ionization potential map and a |LUMO| map. A local ionization potential map indicates the relative ease of electron removal (ionization) at the accessible surface of a molecule. This would be expected to correlate with the relative ease of addition of an electrophile. A |LUMO| map indicates the extent to which the lowest-unoccupied molecular orbital (the LUMO) can be seen at the accessible surface of a molecule. This indicates the most likely regions for electrons to be added, and would be expected to correlate with the likelihood of nucleophilic attack. Both types of maps are described and illustrated in the topic “Local Ionization Potential Maps and |LUMO| Maps”.) Place both molecules side-by-side on screen, and one after the other display the local ionization potential and |LUMO| maps.
First, bring up the spreadsheet. Check the boxes to the left of each molecule. Uncouple the molecules so that they can be manipulated independently. Uncheck Coupled from the Model menu.
On the basis of comparison of local ionization potential maps, would you conclude that the silaolefin is likely to be more or less reactive than the olefin toward electrophiles? Elaborate. On the basis of comparison of the |LUMO| maps, would you conclude that the silaolefin is likely to be more or less reactive than the olefin toward nucleophiles? Elaborate. How do your conclusions fit with the known silaolefins? Elaborate.
92
37Carbon Monoxide and Metal-Ligand Bonding
Carbon monoxide is probably the single most common molecule to appear in organometallic compounds. Where a single metal is involved (or where two or more metals are involved but are widely separated), CO inevitably bonds “end on” from carbon, and contributes two electrons to the valence shell of the metal. Where two metals are close, carbon monoxide can alternatively bond to both, again from carbon (it can bridge). In this case, it contributes one electron to the valence shell of each metal.
O C M:2 electrons
O CM
:1 electron
1 electron M
At first glance, both bonding modes use only the lone pair on carbon and neither should have much effect on the structure and properties of free CO. However contrary evidence exists. Specifically, the infrared stretching frequency of CO complexed end-on to a metal is typically in the range of 1850 to 2100 cm-1, which is smaller than the frequency in free carbon monoxide (2143 cm-1). Changes are even greater in molecules where CO is a bridging group, typically falling in the range of 1700 - 1850 cm-1. It would appear that the simple bonding models above involving only the lone pair need to be modified. This is the subject of the present lab activity.
1. Build CO and optimize its geometry using the semi-empirical (PM3) model. Request the HOMO and LUMO. Display the HOMO. This corresponds to the molecular orbital in which the highest-energy pair of electrons are held. Is it consistent with the usual Lewis structure for CO? Is the HOMO bonding, antibonding or essentially non-bonding between carbon and oxygen? What, if anything, would you expect to happen to the CO bond strength as
93
electrons are donated from the HOMO to the metal? Elaborate. Is this consistent with the changes seen in the infrared stretching frequency of carbon monoxide?
Reduction in bond strength will generally be accompanied by increase in bond length and decrease in stretching frequency.
Display the LUMO. This corresponds to the molecular orbital in which the next (pair of) electrons will go.
The LUMO in CO is one of a set of two equivalent degenerate orbitals. You can base arguments on either the LUMO or the next orbital (LUMO+1).
Is the LUMO bonding, antibonding or essentially non-bonding between carbon and oxygen? What if anything would you expect to happen to the CO bond strength were electrons to be donated (from the metal) into this orbital? Elaborate. Is this consistent with the changes seen in the infrared stretching frequency of carbon monoxide?
To see if the metal center incorporates a high energy filled molecular orbital properly disposed to donate electrons into the LUMO of CO, you need to perform calculations on a simple organometallic from which a carbon monoxide ligand has been removed. You will use Fe(CO)4, arising from loss of CO from Fe(CO)5.
2. Build Fe(CO)5 and obtain its equilibrium geometry (a trigonal bipyramid) using the semi-empirical (PM3) model. When completed, delete one of the equatorial CO ligands to make iron tetracarbonyl and perform an energy calculation. Request the HOMO.
Does the HOMO have significant amplitude in the location where the next carbon monoxide ligand (the one you removed) will attach? If so, are signs (colors) of the orbital components consistent with the signs of the components for the LUMO in CO? Would you expect electron donation to occur?
94
38Ethylene and
Metal-Ligand BondingTwo limiting structures can be drawn to represent ethylene bonded to a metal center. The first may be thought of as a weak complex in that it maintains the CC double bond, while the second completely destroys the double bond in order to form two new metal-carbon σ bonds, leading to a three-membered ring (a so-called “metallacycle”).
M M
The difference between the two representations is one of degree and real metal-alkene complexes are expected to span the full range of possible structures. (A similar situation has already been described in the lab activity “Are Reactive Intermediates “Normal” Molecules?”.)
In this activity, you will first examine the HOMO and LUMO of ethylene to see where electrons may be drawn from and where they may be put back, and to understand the consequences these electron movements will have on its geometry.
1. Obtain an equilibrium geometry for ethylene using the semi-empirical PM3 model and request the HOMO and LUMO. Display the HOMO. Is it bonding, antibonding or essentially non-bonding between the two carbons? What if anything should happen to the CC bond as electrons are donated from the HOMO to the metal? Specifically, do you expect the carbon-carbon bond length to decrease, increase or remain about the same? Elaborate. Display the LUMO of ethylene. This corresponds to the molecular orbital where the next (pair of) electrons will go. Is this orbital bonding, antibonding or essentially non-bonding between the two carbons?
95
What, if anything, should happen to the CC bond as electrons are donated (from the metal) into the LUMO? Elaborate. Is the expected change in the CC bond due to this interaction in the same direction or in the opposite direction as any change due to interaction of the HOMO with the metal? Elaborate.
To see if the metal center incorporates appropriate unfilled and filled molecular orbitals to interact with the HOMO and LUMO of ethylene, respectively, perform calculations on Fe(CO)4, arising from loss of ethylene from ethylene iron tetracarbonyl, (CO)4FeC2H4.
2. Build ethylene iron tetracarbonyl and obtain its equilibrium geometry (a trigonal bipyramid with ethylene occupying an equatorial position with the CC bond in the equatorial plane) using the semi-empirical (PM3) model. When completed, delete the ethylene ligand and perform an energy calculation. Request both HOMO and LUMO.
Does the LUMO in Fe(CO)4 have significant amplitude in the equatorial region where ethylene will fit to accept electrons from the (ethylene) HOMO? If so, are the signs (colors) of the LUMO orbital components consistent with the signs of the components of the ethylene HOMO? Would you expect electron donation from ethylene to metal to occur? Does the HOMO in Fe(CO)4 have significant amplitude in the equatorial region where ethylene will fit? If so, are the signs of its components consistent with the signs of the components of the ethylene LUMO? Would you expect electron donation from the metal to ethylene to occur?
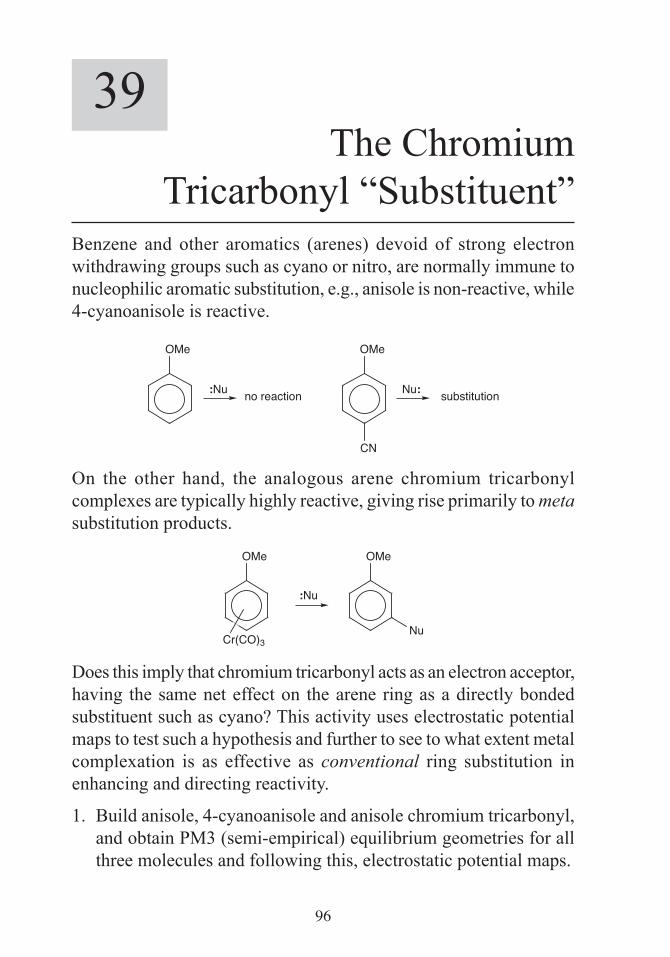
96
39The Chromium
Tricarbonyl “Substituent”Benzene and other aromatics (arenes) devoid of strong electron withdrawing groups such as cyano or nitro, are normally immune to nucleophilic aromatic substitution, e.g., anisole is non-reactive, while 4-cyanoanisole is reactive.
OMe
:Nu
OMe
Nu:
CN
substitutionno reaction
On the other hand, the analogous arene chromium tricarbonyl complexes are typically highly reactive, giving rise primarily to meta substitution products.
OMe
:Nu
Cr(CO)3
OMe
Nu
Does this imply that chromium tricarbonyl acts as an electron acceptor, having the same net effect on the arene ring as a directly bonded substituent such as cyano? This activity uses electrostatic potential maps to test such a hypothesis and further to see to what extent metal complexation is as effective as conventional ring substitution in enhancing and directing reactivity.
1. Build anisole, 4-cyanoanisole and anisole chromium tricarbonyl, and obtain PM3 (semi-empirical) equilibrium geometries for all three molecules and following this, electrostatic potential maps.

97
To build anisole chromium tricarbonyl, bring up the inorganic model kit, select Cr from the Periodic Table and four-coordinate tetrahedral from the list of hybrids and double click on screen. Add Carbon Monoxide (Ligands menu) to three of the free valences on chromium and Benzene (Ligands menu not Rings menu) to the remaining free valence. Bring up the organic model kit and introduce a methoxy group onto the (benzene) ring.
When the calculations have completed, put the molecules side-by-side on screen, and turn on the electrostatic potential maps.
First, bring up the spreadsheet. Check the boxes to the left of each molecule. Uncouple the molecules so that they can be manipulated independently. Uncheck Coupled from the Model menu.
The blue regions in the maps demark regions that are most electron deficient. Relative to anisole, is the (accessible) ring face in anisole chromium tricarbonyl more or less electron deficient? What does this suggest to you about the relative likelihood that the two molecules will undergo nucleophilic aromatic substitution? Is the complexed chromium tricarbonyl group more effective, less effective or comparably effective as a para cyano group in increasing the electron deficiency of the benzene ring? Is there any evidence in the electrostatic potential map for anisole chromium tricarbonyl that nucleophilic attack will occur meta to the methoxy substituent? Elaborate. Is there any evidence for this in calculated carbon charges? Elaborate.
To display the charge on an atom, select Properties from the Display menu and click on the atom. To “attach” charges to the model, select Configure... from the Model menu and check Charge.

98
40Vitamin E
Molecules with unpaired electrons (radicals) can cause biological damage through their reaction with the unsaturated fatty acids found in cellular membranes. Vitamin E may play an active role in defending cells from attack by reacting quickly with radicals to give stable products that can then be safely excreted. Such compounds are refered to as antioxidants.
HO
O
vitamin E
In order to be effective as a cellular antioxidant, vitamin E must be able to transfer a hydrogen atom to the offending radical, leading to a stable vitamin E radical, i.e.
R• + vitamin E RH + vitamin E•
Of course, vitamin E must also be soluble in the cellular membrane which presumably is hydrocarbon-like as opposed to water-like. The fact that vitamin E is an effective antioxidant implies that it both forms a stable radical and is soluble in the membrane.
In this lab, you will first examine the electrostatic potential map for vitamin E for evidence that it should be soluble in a cellular membrane. You will then look at the radical formed by hydrogen abstraction from vitamin E for evidence that it should be stable. Here, a map of spin density will be employed, revealing the extent to which the radical site remains localized or is delocalized. You will then examine an alternative to vitamin E and try to anticipate whether it too might be an effective antioxidant.
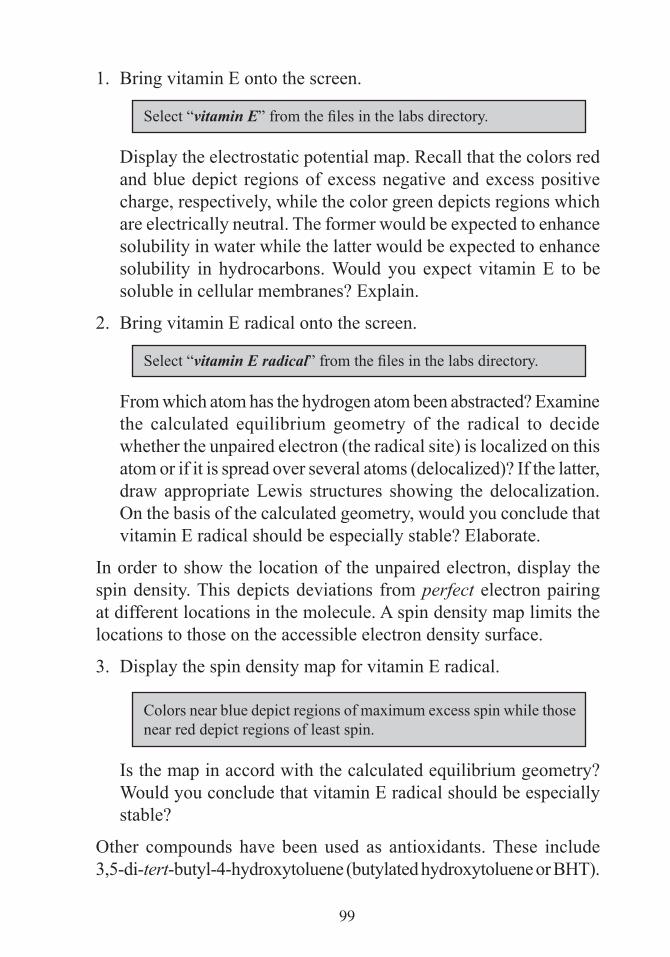
99
1. Bring vitamin E onto the screen.
Select “vitamin E” from the files in the labs directory.
Display the electrostatic potential map. Recall that the colors red and blue depict regions of excess negative and excess positive charge, respectively, while the color green depicts regions which are electrically neutral. The former would be expected to enhance solubility in water while the latter would be expected to enhance solubility in hydrocarbons. Would you expect vitamin E to be soluble in cellular membranes? Explain.
2. Bring vitamin E radical onto the screen.
Select “vitamin E radical” from the files in the labs directory.
From which atom has the hydrogen atom been abstracted? Examine the calculated equilibrium geometry of the radical to decide whether the unpaired electron (the radical site) is localized on this atom or if it is spread over several atoms (delocalized)? If the latter, draw appropriate Lewis structures showing the delocalization. On the basis of the calculated geometry, would you conclude that vitamin E radical should be especially stable? Elaborate.
In order to show the location of the unpaired electron, display the spin density. This depicts deviations from perfect electron pairing at different locations in the molecule. A spin density map limits the locations to those on the accessible electron density surface.
3. Display the spin density map for vitamin E radical.
Colors near blue depict regions of maximum excess spin while those near red depict regions of least spin.
Is the map in accord with the calculated equilibrium geometry? Would you conclude that vitamin E radical should be especially stable?
Other compounds have been used as antioxidants. These include 3,5-di-tert-butyl-4-hydroxytoluene (butylated hydroxytoluene or BHT).
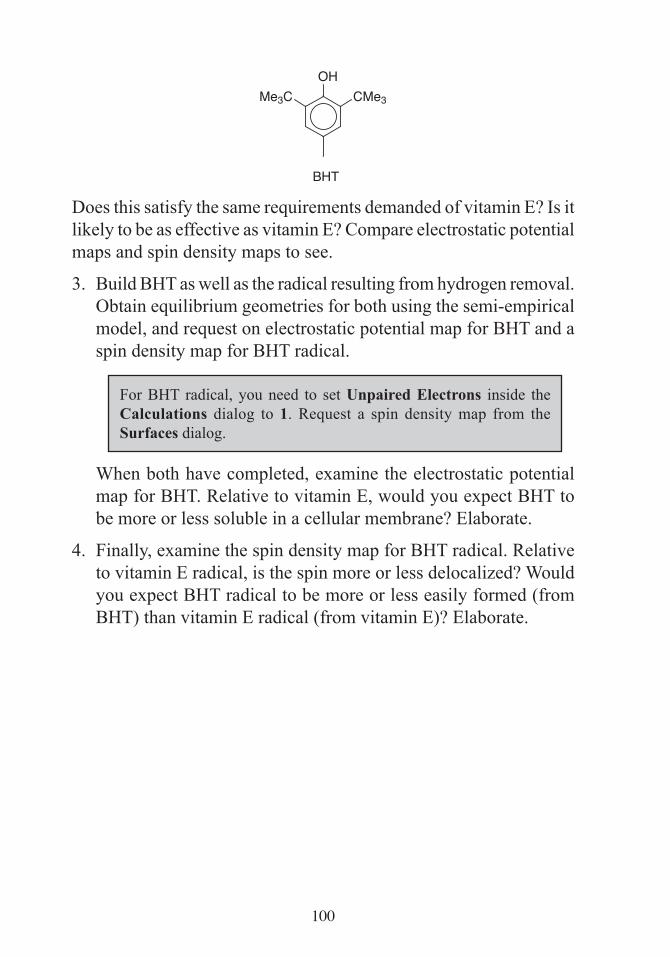
100
Me3COH
CMe3
BHT
Does this satisfy the same requirements demanded of vitamin E? Is it likely to be as effective as vitamin E? Compare electrostatic potential maps and spin density maps to see.
3. Build BHT as well as the radical resulting from hydrogen removal. Obtain equilibrium geometries for both using the semi-empirical model, and request on electrostatic potential map for BHT and a spin density map for BHT radical.
For BHT radical, you need to set Unpaired Electrons inside the Calculations dialog to 1. Request a spin density map from the Surfaces dialog.
When both have completed, examine the electrostatic potential map for BHT. Relative to vitamin E, would you expect BHT to be more or less soluble in a cellular membrane? Elaborate.
4. Finally, examine the spin density map for BHT radical. Relative to vitamin E radical, is the spin more or less delocalized? Would you expect BHT radical to be more or less easily formed (from BHT) than vitamin E radical (from vitamin E)? Elaborate.
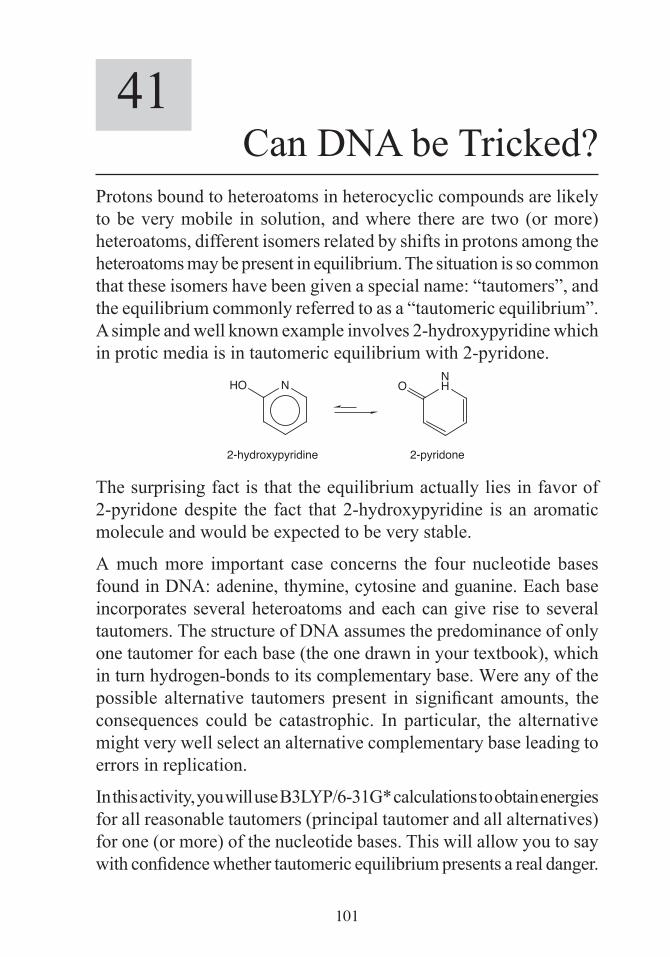
101
41Can DNA be Tricked?
Protons bound to heteroatoms in heterocyclic compounds are likely to be very mobile in solution, and where there are two (or more) heteroatoms, different isomers related by shifts in protons among the heteroatoms may be present in equilibrium. The situation is so common that these isomers have been given a special name: “tautomers”, and the equilibrium commonly referred to as a “tautomeric equilibrium”. A simple and well known example involves 2-hydroxypyridine which in protic media is in tautomeric equilibrium with 2-pyridone.
NNHHO O
2-hydroxypyridine 2-pyridone
The surprising fact is that the equilibrium actually lies in favor of 2-pyridone despite the fact that 2-hydroxypyridine is an aromatic molecule and would be expected to be very stable.
A much more important case concerns the four nucleotide bases found in DNA: adenine, thymine, cytosine and guanine. Each base incorporates several heteroatoms and each can give rise to several tautomers. The structure of DNA assumes the predominance of only one tautomer for each base (the one drawn in your textbook), which in turn hydrogen-bonds to its complementary base. Were any of the possible alternative tautomers present in significant amounts, the consequences could be catastrophic. In particular, the alternative might very well select an alternative complementary base leading to errors in replication.
In this activity, you will use B3LYP/6-31G* calculations to obtain energies for all reasonable tautomers (principal tautomer and all alternatives) for one (or more) of the nucleotide bases. This will allow you to say with confidence whether tautomeric equilibrium presents a real danger.
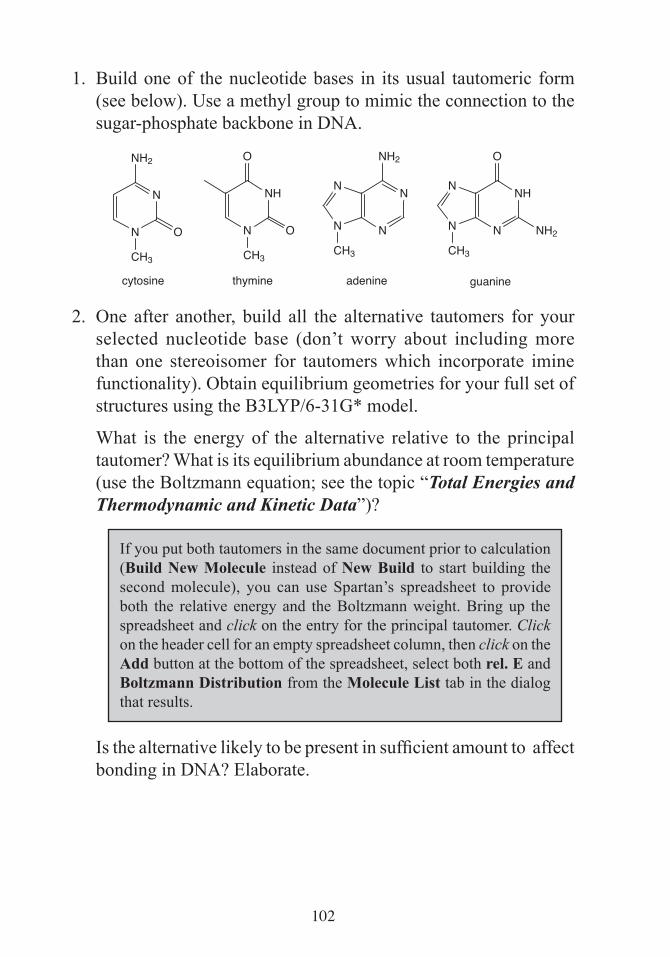
102
1. Build one of the nucleotide bases in its usual tautomeric form (see below). Use a methyl group to mimic the connection to the sugar-phosphate backbone in DNA.
N
N
N
NH
N
N
N
NHN
N
N
N
NH2
O
O
O
NH2 O
NH2
CH3 CH3CH3 CH3
cytosine thymine adenine guanine
2. One after another, build all the alternative tautomers for your selected nucleotide base (don’t worry about including more than one stereoisomer for tautomers which incorporate imine functionality). Obtain equilibrium geometries for your full set of structures using the B3LYP/6-31G* model.
What is the energy of the alternative relative to the principal tautomer? What is its equilibrium abundance at room temperature (use the Boltzmann equation; see the topic “Total Energies and Thermodynamic and Kinetic Data”)?
If you put both tautomers in the same document prior to calculation (Build New Molecule instead of New Build to start building the second molecule), you can use Spartan’s spreadsheet to provide both the relative energy and the Boltzmann weight. Bring up the spreadsheet and click on the entry for the principal tautomer. Click on the header cell for an empty spreadsheet column, then click on the Add button at the bottom of the spreadsheet, select both rel. E and Boltzmann Distribution from the Molecule List tab in the dialog that results.
Is the alternative likely to be present in sufficient amount to affect bonding in DNA? Elaborate.