household expenditure on education and implications...
TRANSCRIPT
1
Draft /Limited Distribution 12 May 2009
Household Expenditure on Education and Implications for Redefining the Poverty Line in India*
Jandhyala B G Tilak
This short paper is concerned with the following three questions:
1. Why consider education and expenditure on education, while redefining the official
poverty line?
2. What is the present level of household expenditure on education and what does a
review of estimates on household expenditure on education suggest?
3. What can be a reasonable estimate on household expenditure on education that can be
used in redefining the official poverty line?
1. Introduction
Poverty is conventionally defined in terms of income poverty, i.e., number of
people below the poverty line and it is measured in different ways, predominantly in
terms of inadequacy of income to procure a defined minimum level of calories. In
India the minimum level of calories required per person per day is defined as 2400 in
rural areas and 2100 in urban areas. The same is converted into financial terms and
the poverty line is defined as a minimum level of income or expenditure, which is
periodically updated. The latest updated poverty line is Rs.356.30 in rural areas and
Rs.538.60 in urban areas in 2004‐05 (Planning Commission, 2007). Using the same
method, poverty line is also defined for various states and union territories
separately for rural and urban areas. All the people, whose monthly expenditure
falls below these levels, are considered as poor. It has to be noted that the so‐defined
poor may be incurring expenditures, not just on food intake to get minimum number
of calories, but also on several other food and no‐food items. * Background Paper, prepared for the Expert Group on the Review of the Methodology for Estimation of Poverty (Planning Commission, May 2009).
2
Many scholars have highlighted the limitations of this concept of income
poverty, which is solely based on calorie intake, as a measure of the complex
phenomenon of poverty. An Expert Group of the Planning Commission (1993)
recommended the broadening of the concept of poverty, so as to include, inter alia,
education needs of the people. As the World Bank (1994, p. 9) recognised, ʺPoverty
is not only a problem of low incomes; rather, it is a multi‐dimensional problem that
includes low access to opportunities for developing human capital and to
education...ʺ The World Summit for Social Development (1995) also opted for a
broader definition of poverty and correspondingly for a broader integrated strategy
for its eradication. As UNDP (1996, p. 27) commented, ʺ ʹincome povertyʹ is only a
part of the picture. Just as human development encompasses aspects of life much
broader than income, so poverty should be seen as having many dimensionsʺ and
accordingly developed the concept of ʹhuman povertyʹ. It observed, ʺhuman poverty
is more than income poverty: it is a denial of choices and opportunities for living a
tolerable lifeʺ (UNDP, 1997, p. 2). In this sense, denial of human rights itself
constitutes poverty, and accordingly a rights‐based approach to poverty eradication
is being increasingly argued (see e.g., Speth, 1998).
According to Sen (1999, p. 87), ‘real’ poverty can be sensitively identified in
terms of capability deprivation: deprivations that are intrinsically important, unlike
low income, which is only instrumentally significant. Sen distinguishes between
income poverty and capability poverty; and argues that the later is obviously more
important. Capability poverty refers to deprivation of opportunities, and choices
and of entitlements. Education can very significantly influence both income poverty
and capability poverty and also the relationship between the two, besides
constituting itself a part of capability poverty. In fact, educational deprivation itself
is capability poverty and investing in education of the poor itself means reduction of
capability poverty.
In short, poverty is seen as deprivation of opportunities that enhance human
capabilities to lead a tolerable life. Education is one such important opportunity,
deprivation of which in itself represents poverty ‐‐ poverty of education or
ʹeducation povertyʹ (Tilak, 2002b). Poverty of education is an integral part of human
poverty, and it is widely argued that this should be an important constituent of any
3
meaningful and comprehensive definition of poverty line. The features of education
poverty include wide‐spread illiteracy, low levels of education of the population,
high rates of non‐participation or low rates of participation of children in schooling,
high rates of dropout and failures, low rates of continuation in schooling, low rates
of achievement and finally exclusion of the poor from education. Accordingly it
may be easy to identify and count the number of educationally poor people, as those
who are illiterate and who are less educated – educated below a defined level. If one
were to define poverty line in terms of income or expenditure, it may, thus become
important to estimate a minimum level of income required to obtain a minimum
level of education, defined in terms of both quantity and quality.
The scope of this short note is somewhat restricted: it is an attempt to present
an idea on the nature and magnitude of the household expenditures on education,
essentially based on published reports of the NSS, and to discuss how this
expenditure on education has to be incorporated into the official poverty line.
Why Consider Expenditure on Education, while Redefining the Poverty Line?
Education is a merit good, and it is also considered as a public good,
producing a huge set of externalities. Internationally education, particularly school
and more particularly elementary education is recognised as a basic need. In the
framework of Indian development planning, it is considered as one of the important
‘minimum needs’. United Nations and UNESCO resolutions also require it to be
provided free by the state to all its citizens. The Constitution of India has recognised
all this and resolved in 1950, as a part of the Directive Principles, as follows:
the State shall endeavor to provide, within a period of ten years from
the commencement of this Constitution, for free and compulsory
education for all children until they complete the age of fourteen years.
(Article 45) [emphasis added].
Recognising that we have not been sincere to the Directive Principle, an amendment
to the Constitution of India was made through the 86th amendment in 2002 that has
recognised education as a fundamental right, according the status to education
which is almost equivalent to basic rights such as the right to live. According to the
4
human development and human rights perspectives, education forms an essential
component of human living and this should be provided universally to everyone
without any discrimination, as an entitlement, and as a fundamental right.
Literature on education‐development relationships has also highlighted the
role of education in reducing income poverty, in the fulfillment of other basic needs,
in improving the quality of life etc., (Noor, 1980; Tilak, 1989), in addition to its direct
impact on labour productivity and earnings in the labour market (Schultz, 1961;
Becker, 1964; Mincer, 1972). Importantly the contribution of education to
development in terms of externalities it produces is argued to be immense (see e.g.,
McMahon, 1999). Educaiton significantly influences positively the health and
nutritional status of the population, contributes to reduction in fertility rates and to
improvement in population growth, to reduction in crime, etc. It also helps in
evening out some of the ills of the society such as child labour, exploitation of
children, child marriages, etc., and in socialisation of the children and in their
effective functioning in the modern societies. In short, education not only improves
efficiency in terms of labour productivity and personal and social development, it is
also found to be an effective instrument of reduction of poverty, upward social,
occupational and economic mobility, empowerment of people, redistribution of
resources and thereby of improvement of equity in the system, besides it itself
reducing inequalities in education. Also as it helps in fulfillment of other basic
needs, education might reduce, if not obviate, the need for public spending on
certain other basic needs.
That (a) education is a merit good and also a public good, (b) its direct
contribution and externalities are immense, (c) household expenditures on education
would restrict the access of the poor to education, (d) despite growth in private
schooling, there exist imperfections in capital markets and asymmetry in
information, (e) private markets in education cause and strengthen inequalities, and
(f) above all, a large numbers of people are illiterate and do not have any education,
many of them being economically poor – all compel us to consider education as an
important integral part of development planning, including specifically in any
analysis of poverty.
5
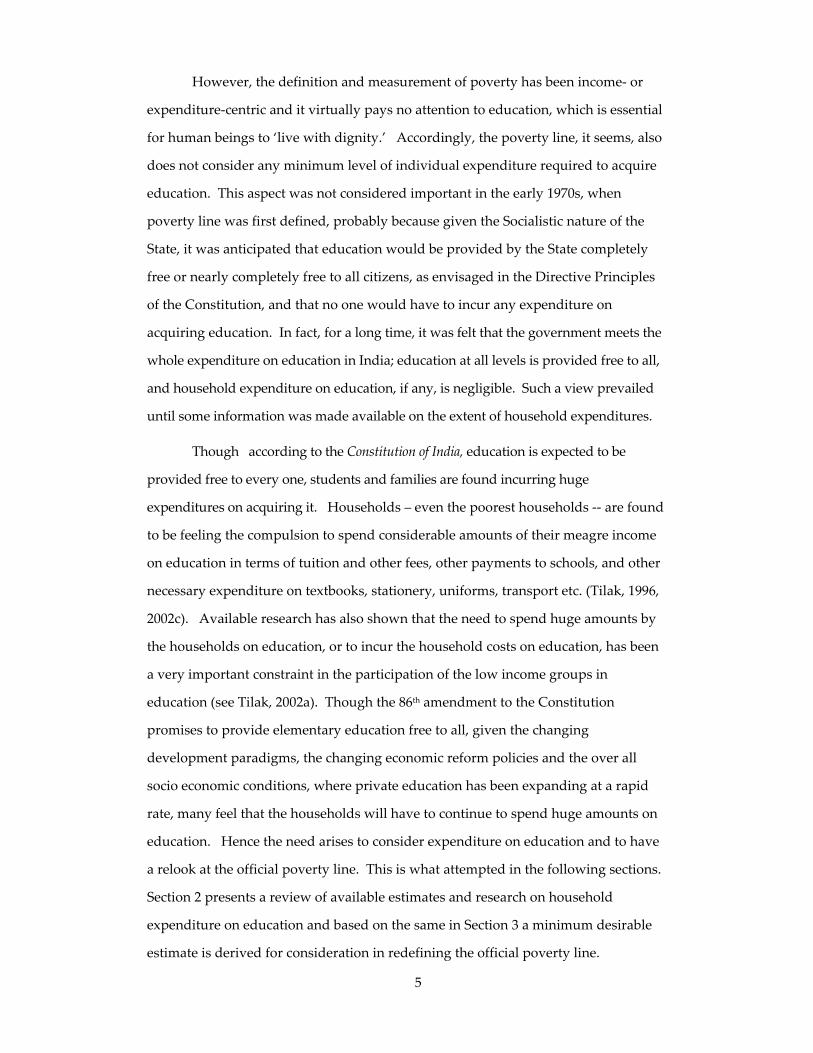
However, the definition and measurement of poverty has been income‐ or
expenditure‐centric and it virtually pays no attention to education, which is essential
for human beings to ‘live with dignity.’ Accordingly, the poverty line, it seems, also
does not consider any minimum level of individual expenditure required to acquire
education. This aspect was not considered important in the early 1970s, when
poverty line was first defined, probably because given the Socialistic nature of the
State, it was anticipated that education would be provided by the State completely
free or nearly completely free to all citizens, as envisaged in the Directive Principles
of the Constitution, and that no one would have to incur any expenditure on
acquiring education. In fact, for a long time, it was felt that the government meets the
whole expenditure on education in India; education at all levels is provided free to all,
and household expenditure on education, if any, is negligible. Such a view prevailed
until some information was made available on the extent of household expenditures.
Though according to the Constitution of India, education is expected to be
provided free to every one, students and families are found incurring huge
expenditures on acquiring it. Households – even the poorest households ‐‐ are found
to be feeling the compulsion to spend considerable amounts of their meagre income
on education in terms of tuition and other fees, other payments to schools, and other
necessary expenditure on textbooks, stationery, uniforms, transport etc. (Tilak, 1996,
2002c). Available research has also shown that the need to spend huge amounts by
the households on education, or to incur the household costs on education, has been
a very important constraint in the participation of the low income groups in
education (see Tilak, 2002a). Though the 86th amendment to the Constitution
promises to provide elementary education free to all, given the changing
development paradigms, the changing economic reform policies and the over all
socio economic conditions, where private education has been expanding at a rapid
rate, many feel that the households will have to continue to spend huge amounts on
education. Hence the need arises to consider expenditure on education and to have
a relook at the official poverty line. This is what attempted in the following sections.
Section 2 presents a review of available estimates and research on household
expenditure on education and based on the same in Section 3 a minimum desirable
estimate is derived for consideration in redefining the official poverty line.
6
2. Household Expenditure on Education: A Review of Available Estimates
Database
Reasonably reliable and sound database exists in case of public expenditure on
education in India. But data on household expenditure are scarce and hence most
analyses of expenditure on education are usually confined to the public expenditures
only. There are two main types of database on household expenditures on education
in India. First, the Central Statistical Organisation (CSO) publishes every year data on
household expenditures – ‘private final consumption expenditure’ ‐‐ on education
(and other non‐food and food items) based on estimates made by the National Sample
Survey Organisation (NSSO) in the National Accounts Statistics (NAS). But the NAS
does not give any details regarding the composition of the expenditure on education
by items, the levels of education, etc. NAS, however, enables time‐series comparisons,
besides being national in coverage.
The second important source is the household surveys of the National Sample
Survey (NSS). The several rounds of the NSS on Employment and Unemployment
and on Household Consumer Expenditure, regularly collect and provide data on
household expenditure on education (and other non‐food and food items). These
regular rounds also do not provide any additional details on the levels of education or
on the components of education expenditure. They are of course available for rural
and urban areas separately and also by expenditure (monthly per capita expenditure)
classes. More importantly, the NSSO occasionally conducts surveys concentrating on
education. One such round was the 42nd round conducted in 1986‐87.1 The survey
was repeated in the 52nd round (1995‐96).2 These surveys provide a lot of detailed
information that helps in estimation of the rate of participation of people in education,
and household expenditures on education, by levels of education, by items of
expenditures, by different characteristics of population – caste, region, gender etc., and
by household expenditure classes. Another similar survey was conducted in the 64th
1 Among others, Minhas (1992) and Tilak (1996) have analysed the 42nd round data extensively.
2 Using the 52nd round data, Tilak (2000, 2002a) has examined several dimensions relating to education.
7
round in 2007‐08 and the results are not yet available.
Another important source of information on household expenditure on
education is the surveys conducted by researchers and research organisations. Many
such surveys, particularly conducted by individual researchers and organisations, are
sample surveys conducted in small regions or on a smaller number of households in
the country ‐‐ and they were conducted in wider contexts of human development, or
in the specific contexts of estimation of household and social costs of education,
estimation of rates of return to education, etc. A few important statewide and even
nation‐wide sample surveys conducted include example, Panchamukhi (1990),3
NCAER (1994)4 and UNICEF (2007).5
Given the advantages of the national surveys conducted by the NSSO, we
confine our attempt here to an analysis of the data available in NAS and the reports of
the NSS which are based on household surveys.
Private Final Consumption Expenditure on Education in India
The National Accounts Statistics (NAS) presents estimates on ‘private final
consumption expenditure in the domestic market’ on education in current prices and
also in constant prices. They are also available as a proportion of the total private final
consumption expenditure. The ‘private final consumption expenditure’ on education
is regarded as the household expenditure on education.
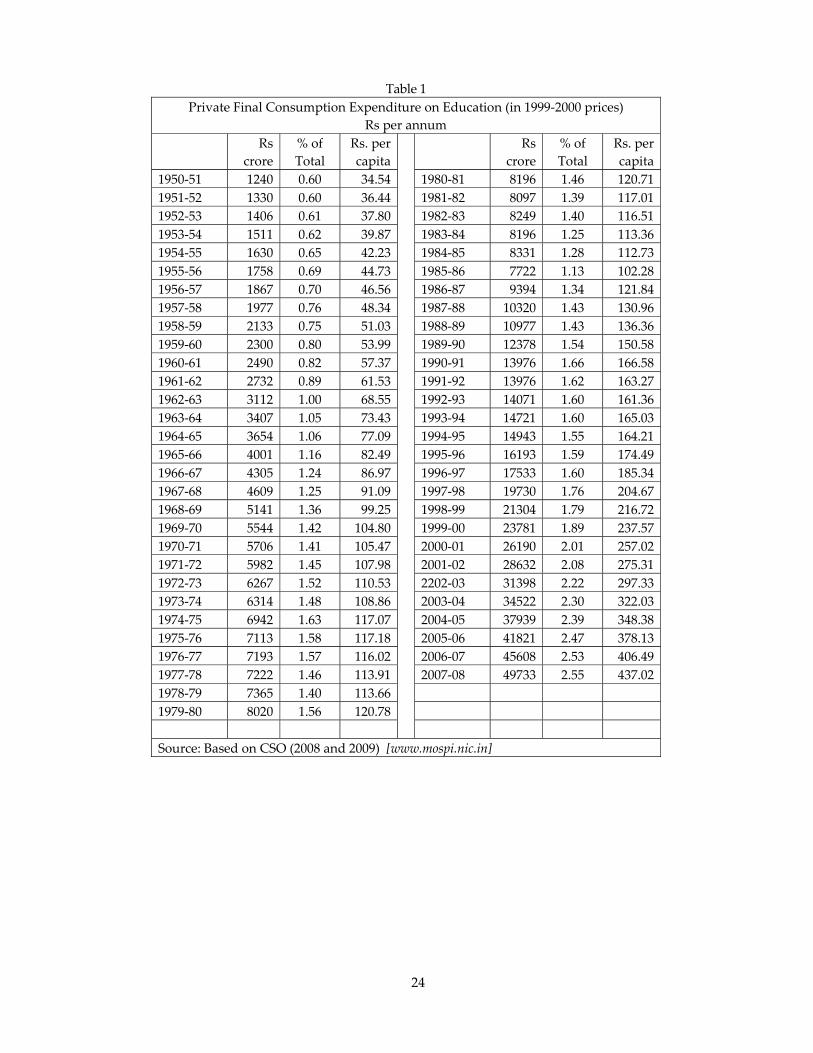
According to the latest estimates, household expenditure on education in India
is sizeable, Rs.62.7 thousand crore in 2007‐08; it increased from Rs. 59 crore in 1950‐51
(Table 1). The magnitude of household expenditure may be contrasted with the
3 This was a sample survey in Maharashtra, Rajasthan and Karnataka, based upon which estimates were generated on the extent of expenditures on school education made by the private sector ‐‐ households and private school management sector ‐‐ in various states in India in 1986‐87 and 1987‐88.
4 National survey on human development in India (HDI), conducted by the NCAER was confined to rural areas in as many as 16 major states. Among others, Tilak (2002c) used the NCAER data and examined the determinants of household expenditure on education. Tilak and Sudarshan (2001) have also examined the extent of private schooling in India, based on the same database.
5 It is a survey in eight major states in India aimed at estimating household expenditures on elementary education. See Mehrotra (2005) and Mehrotra et al (2005).
8
government expenditure on education, which was Rs.159 thousand crore (in 2007‐08
budget estimates). In other words, household expenditure constitutes nearly 30 per
cent of the total (household plus government) expenditure on education in the country
in 2007‐08. Household and government expenditures on education are in the ratio of
about 1:2.5. The household expenditure on education formed 1.4 per cent of GDP in
2007‐08 and 2.6 per cent of the total household expenditure on all items of
consumption.
There has been a phenomenal growth in the expenditure of the households on
education. It increased in real (1999‐2000) prices by 40 times between 1950‐51 and
2007‐08. In per capita terms, the increase has been by 12.7 times during the same
period. As a proportion of the total household expenditure, the share of education
increased from 0.6 per cent in 1950‐51 to 2.6 per cent in 2007‐08. The growth,
particularly in terms of percentage of the total expenditure is, however, not smooth
over the years. For example, it gradually increased to 1.5 per cent by 1972‐73, but
during the later period it went up and down, and reached a level of 1.1 in 1985‐86;
thereafter it registered a steady increase. These fluctuations may be suggestive of the
fluctuations in total consumption expenditure and more importantly in relative
priorities of the households. However, it is clear that (a) household expenditure on
education is sizeable, and (b) it is increasing rapidly over the years. Some view the
rapid increase as a rapid increase in ‘willingness to pay for education,’ while some feel
that it reflects the ‘compulsion’ the households feel to spend on education, as the
government expenditure on education is considered inadequate (Tilak, 2003).
Tilak (2000) has analysed the NAS estimates on private final consumption
expenditure on education, in comparison with the government expenditure on
education for the period referring to1950‐51 to 1996‐97. It has been also found that the
coefficient of elasticity6 of household expenditure on education to total income (in fact,
expenditure) of the households was positive, and greater than 1; it is 1.5. It means that
household expenditures on education are more elastic to household income. A one
per cent increase in total household income would result in 1.5 per cent increase in
household expenditures on education. When the figures are considered in per capita
6 Coefficient of elasticity is estimated by using double log regression equation.
9
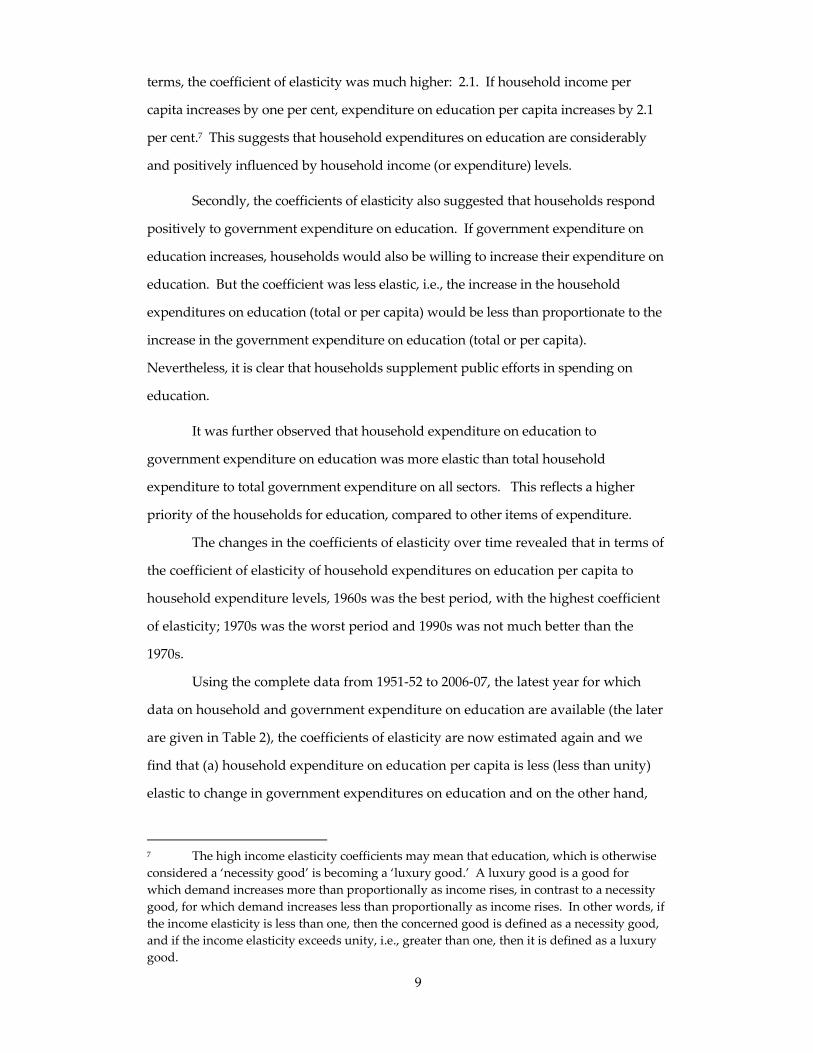
terms, the coefficient of elasticity was much higher: 2.1. If household income per
capita increases by one per cent, expenditure on education per capita increases by 2.1
per cent.7 This suggests that household expenditures on education are considerably
and positively influenced by household income (or expenditure) levels.
Secondly, the coefficients of elasticity also suggested that households respond
positively to government expenditure on education. If government expenditure on
education increases, households would also be willing to increase their expenditure on
education. But the coefficient was less elastic, i.e., the increase in the household
expenditures on education (total or per capita) would be less than proportionate to the
increase in the government expenditure on education (total or per capita).
Nevertheless, it is clear that households supplement public efforts in spending on
education.
It was further observed that household expenditure on education to
government expenditure on education was more elastic than total household
expenditure to total government expenditure on all sectors. This reflects a higher
priority of the households for education, compared to other items of expenditure.
The changes in the coefficients of elasticity over time revealed that in terms of
the coefficient of elasticity of household expenditures on education per capita to
household expenditure levels, 1960s was the best period, with the highest coefficient
of elasticity; 1970s was the worst period and 1990s was not much better than the
1970s.
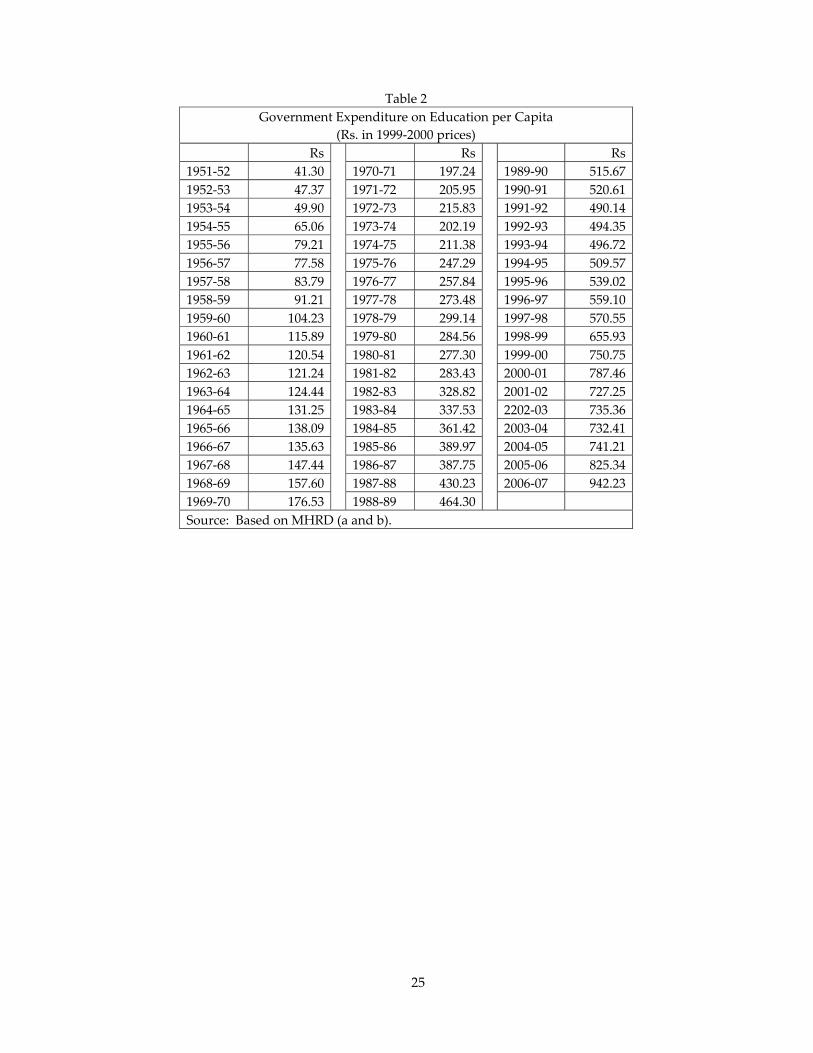
Using the complete data from 1951‐52 to 2006‐07, the latest year for which
data on household and government expenditure on education are available (the later
are given in Table 2), the coefficients of elasticity are now estimated again and we
find that (a) household expenditure on education per capita is less (less than unity)
elastic to change in government expenditures on education and on the other hand,
7 The high income elasticity coefficients may mean that education, which is otherwise considered a ‘necessity good’ is becoming a ‘luxury good.’ A luxury good is a good for which demand increases more than proportionally as income rises, in contrast to a necessity good, for which demand increases less than proportionally as income rises. In other words, if the income elasticity is less than one, then the concerned good is defined as a necessity good, and if the income elasticity exceeds unity, i.e., greater than one, then it is defined as a luxury good.
10
government expenditure on education is more elastic to changes in household
expenditure. 8
As already noted, NAS doses not provide any further details on household
expenditure on education.
Household Expenditure on Education
Having noted briefly the long term trends in private final consumption
expenditure on education, let us now look at the some of the latest rounds of NSS that
provide more details on household expenditure on education.
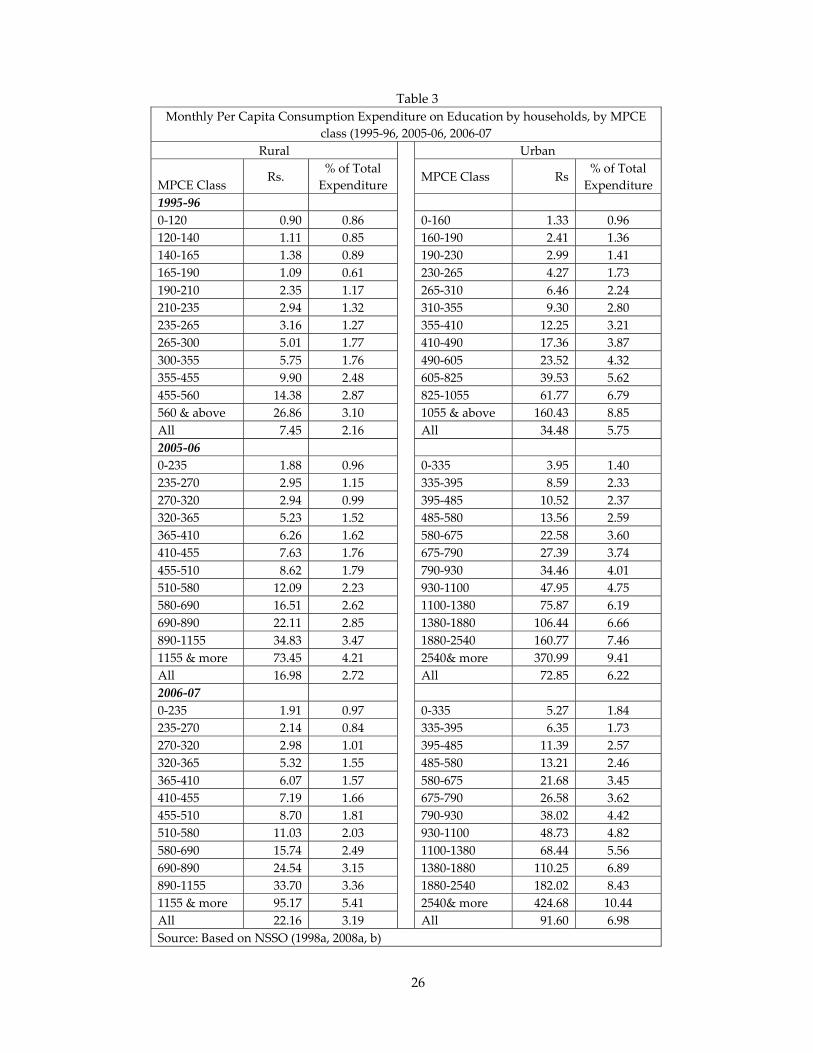
Detailed estimates separately for 12 MPCE classes for the years 2005‐06 and
2006‐07, based on the 62nd and 63rd rounds of NSS are given in Table 3. They are also
presented separately for rural and urban areas. Along with them, to look at over time
changes, the same for 1995‐96 based on the 52nd round are also given. It is clear that the
per capita expenditure on education incurred by the households increases for each
expenditure class over the years, and the increase seems to be rapid and high among
the middle and high expenditure classes. For example, in 1995‐96, the bottom
expenditure class in rural areas spent Re.0.90 per capita, which increased to Re.1.88
in 2005‐06, which further increased marginally within a year to Re.1.91 in 2006‐07. In
contrast, the expenditure of the highest expenditure class increased from Rs.27 in
1995‐96 to Rs.73 in 2005‐06 and further to Rs.95 in 2006‐07. We also note a few more
consistent trends and patterns: the expenditure on education systematically
increases by increasing levels of MPCE, both in rural and urban areas, without any
exception at each point of time. Thirdly, the proportion of the total monthly per
capita expenditure spent on education also increases systematically without any
exception by increasing levels of the expenditure class – the higher economic group
spending higher proportions of their total expenditures and low economic groups
spending less. Fourthly, the expenditure in urban areas is several times the
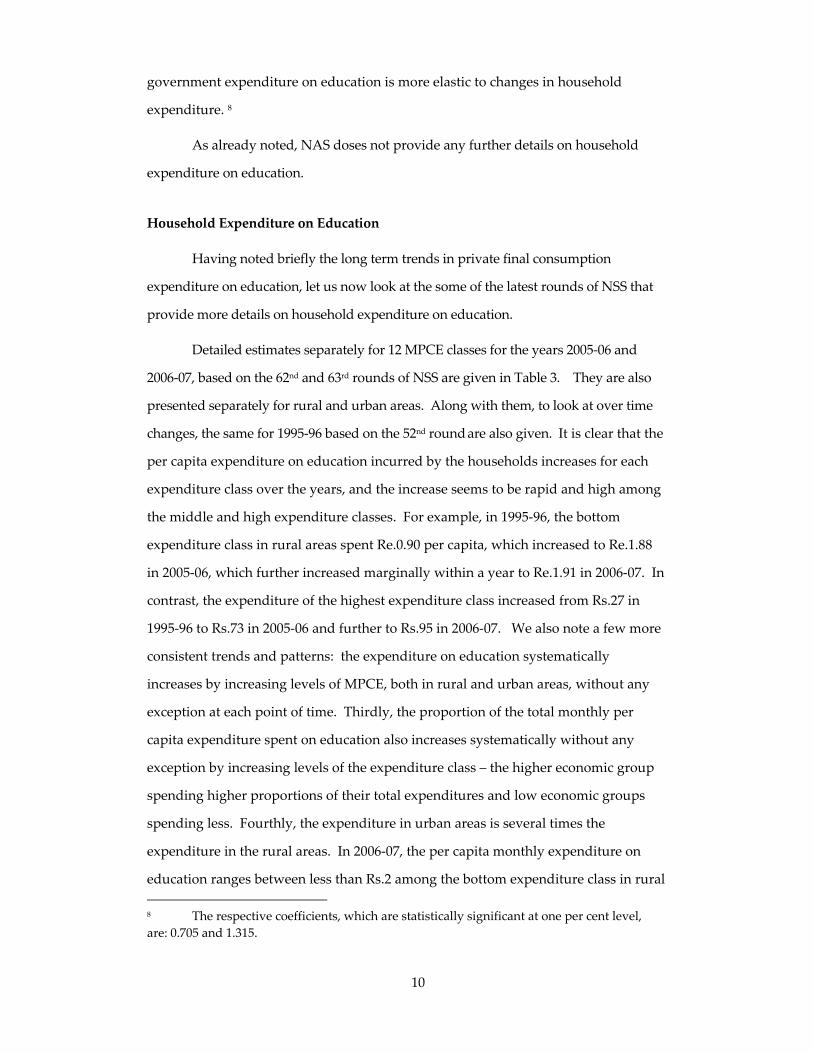
expenditure in the rural areas. In 2006‐07, the per capita monthly expenditure on
education ranges between less than Rs.2 among the bottom expenditure class in rural 8 The respective coefficients, which are statistically significant at one per cent level, are: 0.705 and 1.315.
11
areas to Rs. 425 in the top expenditure class in urban areas. As a percent of the total
monthly per capita expenditure also it ranges widely, between below one per cent
and above ten per cent. The consistent pattern of increase in expenditure on
education – both in absolute terms and as a percentage of total household
expenditure, by increasing economic category of population is striking in all cases.
The 61st round referring to 2004‐05 provides some additional important details
on education. Data on education were collected from a short additional questionnaire.
It provides valuable data on current attendance of children in educational institutions,
educational levels of total population and of the unorganized workers, and also the
consumption expenditure on education.
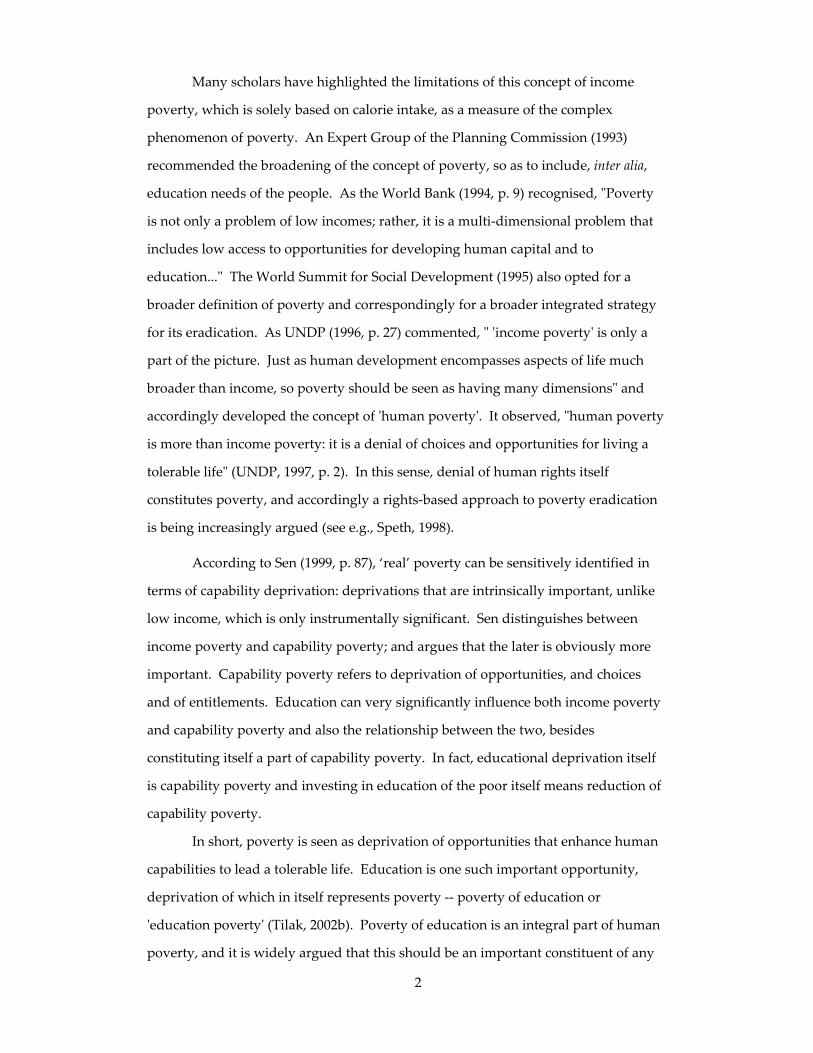
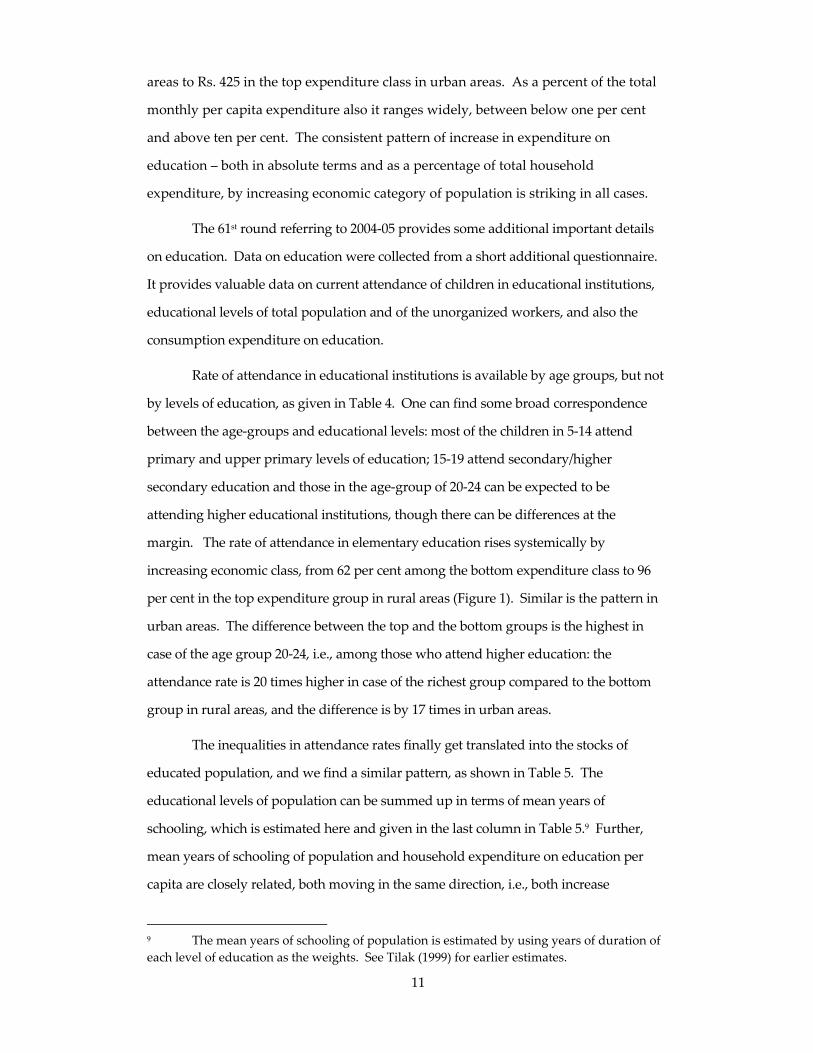
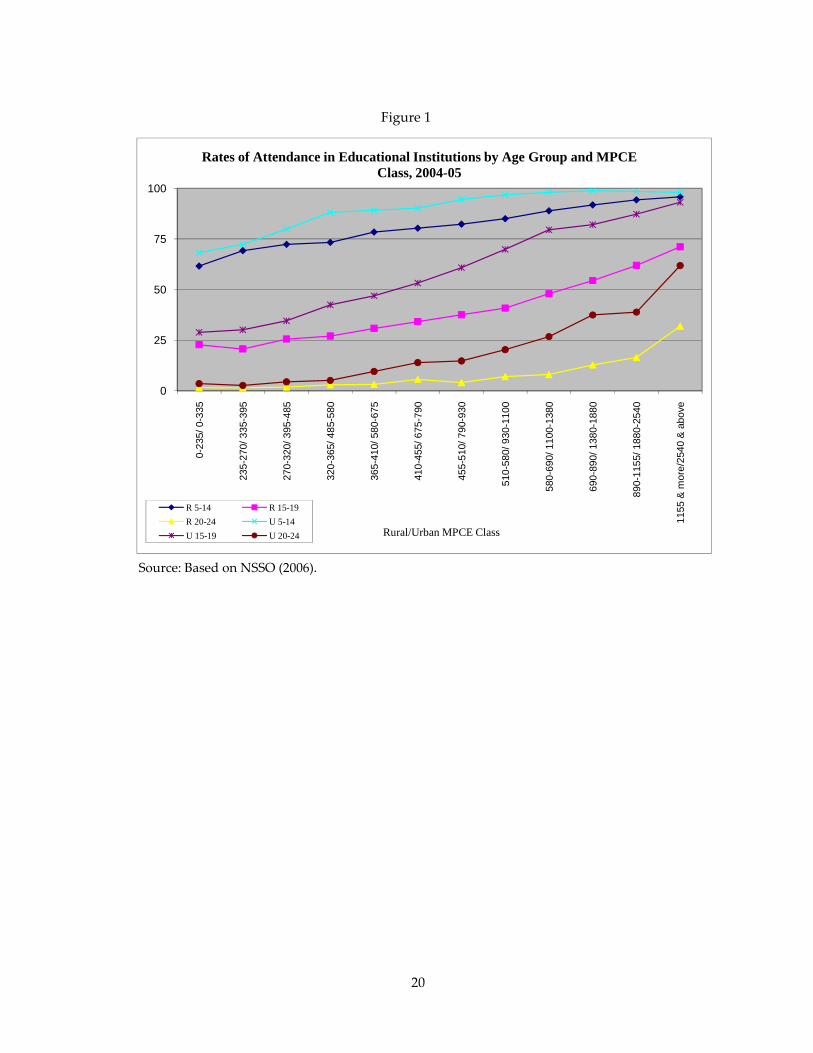
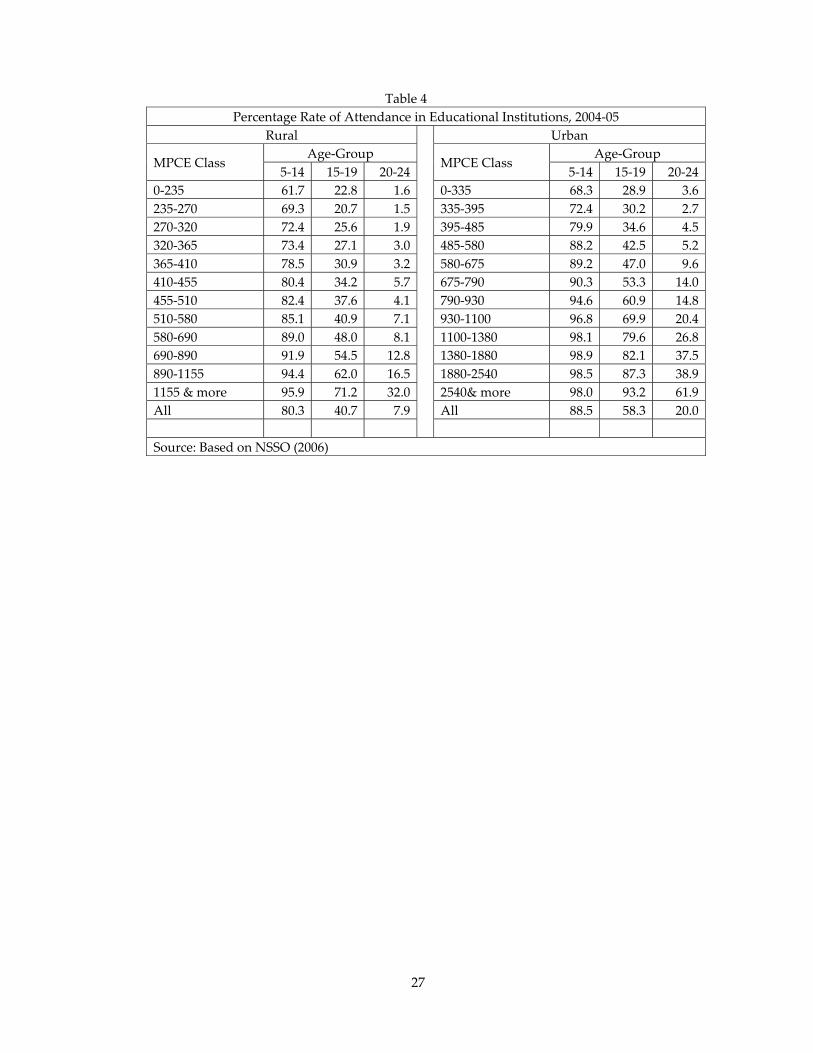
Rate of attendance in educational institutions is available by age groups, but not
by levels of education, as given in Table 4. One can find some broad correspondence
between the age‐groups and educational levels: most of the children in 5‐14 attend
primary and upper primary levels of education; 15‐19 attend secondary/higher
secondary education and those in the age‐group of 20‐24 can be expected to be
attending higher educational institutions, though there can be differences at the
margin. The rate of attendance in elementary education rises systemically by
increasing economic class, from 62 per cent among the bottom expenditure class to 96
per cent in the top expenditure group in rural areas (Figure 1). Similar is the pattern in
urban areas. The difference between the top and the bottom groups is the highest in
case of the age group 20‐24, i.e., among those who attend higher education: the
attendance rate is 20 times higher in case of the richest group compared to the bottom
group in rural areas, and the difference is by 17 times in urban areas.
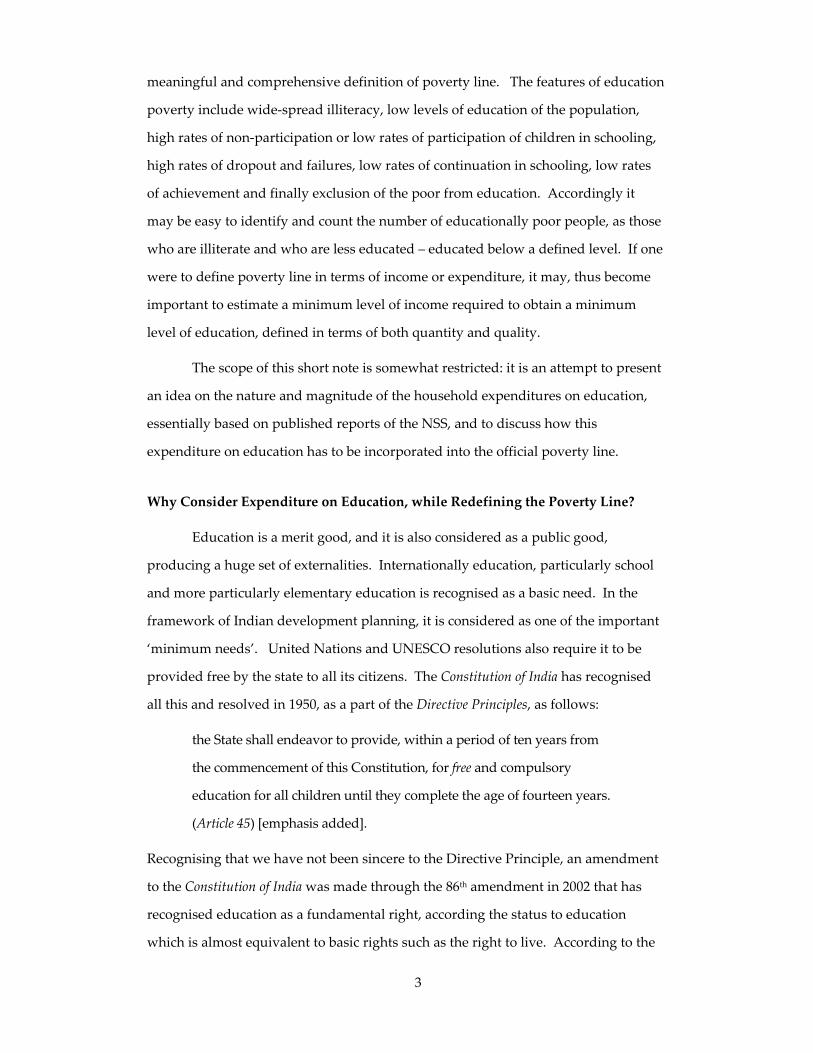
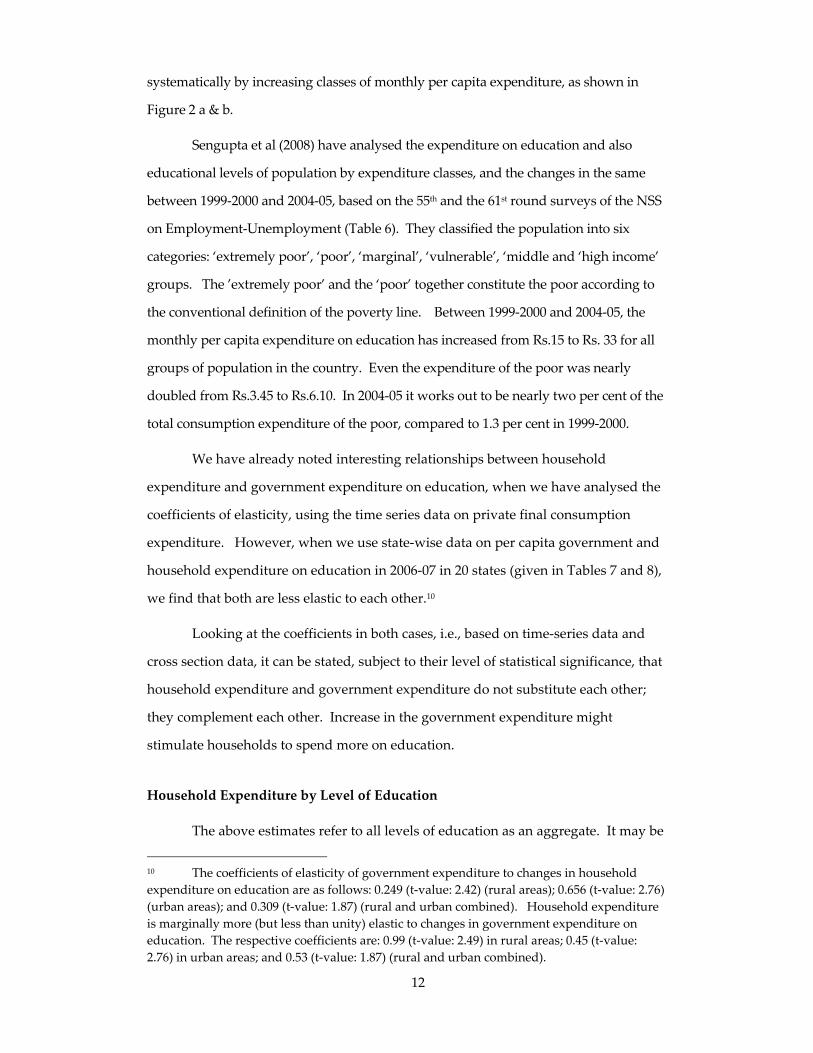
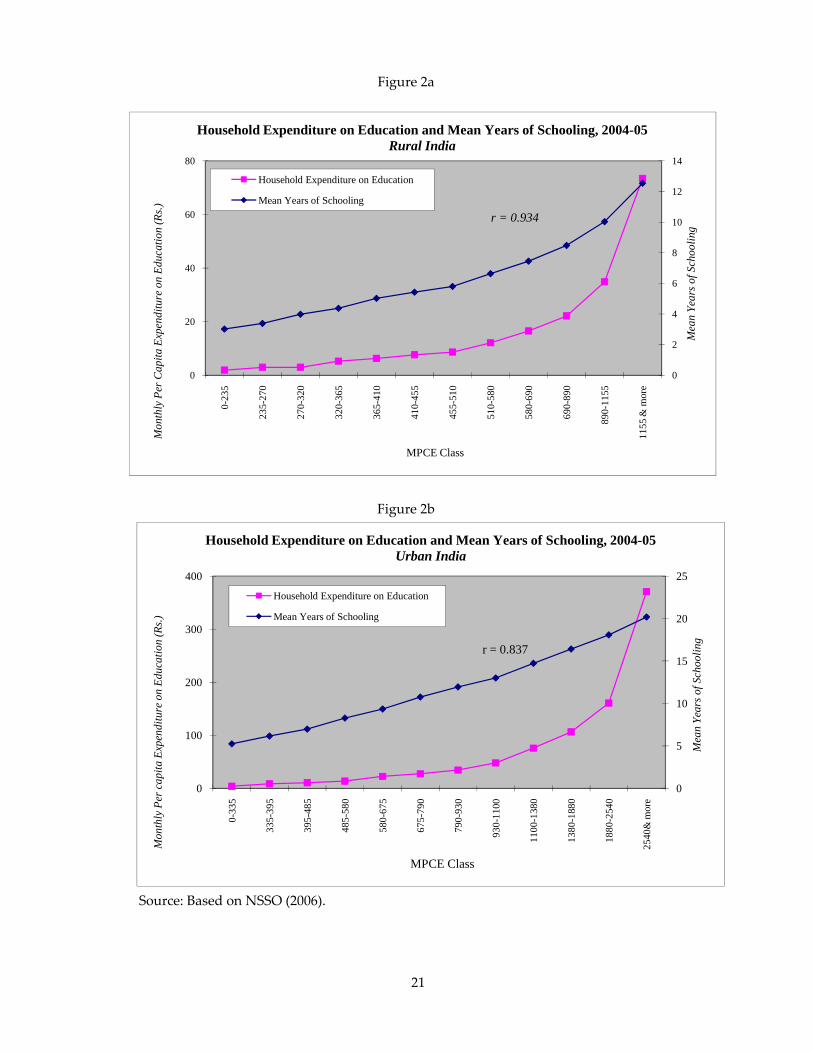
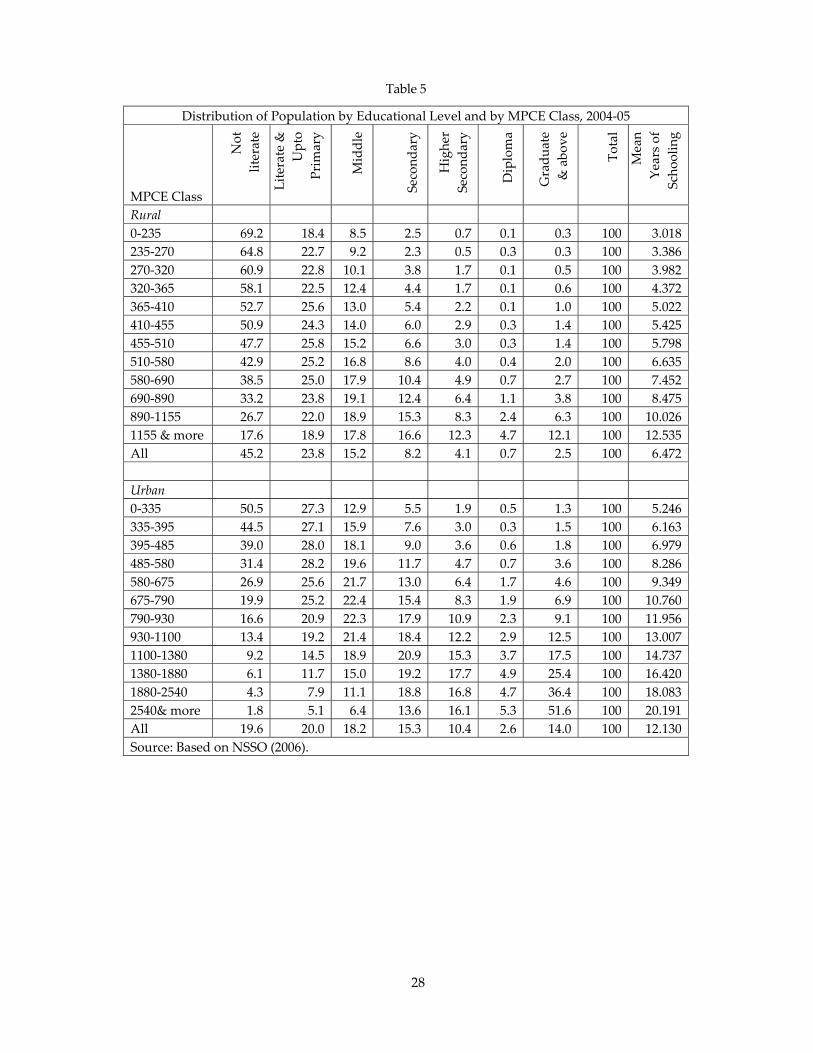
The inequalities in attendance rates finally get translated into the stocks of
educated population, and we find a similar pattern, as shown in Table 5. The
educational levels of population can be summed up in terms of mean years of
schooling, which is estimated here and given in the last column in Table 5.9 Further,
mean years of schooling of population and household expenditure on education per
capita are closely related, both moving in the same direction, i.e., both increase
9 The mean years of schooling of population is estimated by using years of duration of each level of education as the weights. See Tilak (1999) for earlier estimates.
12
systematically by increasing classes of monthly per capita expenditure, as shown in
Figure 2 a & b.
Sengupta et al (2008) have analysed the expenditure on education and also
educational levels of population by expenditure classes, and the changes in the same
between 1999‐2000 and 2004‐05, based on the 55th and the 61st round surveys of the NSS
on Employment‐Unemployment (Table 6). They classified the population into six
categories: ‘extremely poor’, ‘poor’, ‘marginal’, ‘vulnerable’, ‘middle and ‘high income’
groups. The ’extremely poor’ and the ‘poor’ together constitute the poor according to
the conventional definition of the poverty line. Between 1999‐2000 and 2004‐05, the
monthly per capita expenditure on education has increased from Rs.15 to Rs. 33 for all
groups of population in the country. Even the expenditure of the poor was nearly
doubled from Rs.3.45 to Rs.6.10. In 2004‐05 it works out to be nearly two per cent of the
total consumption expenditure of the poor, compared to 1.3 per cent in 1999‐2000.
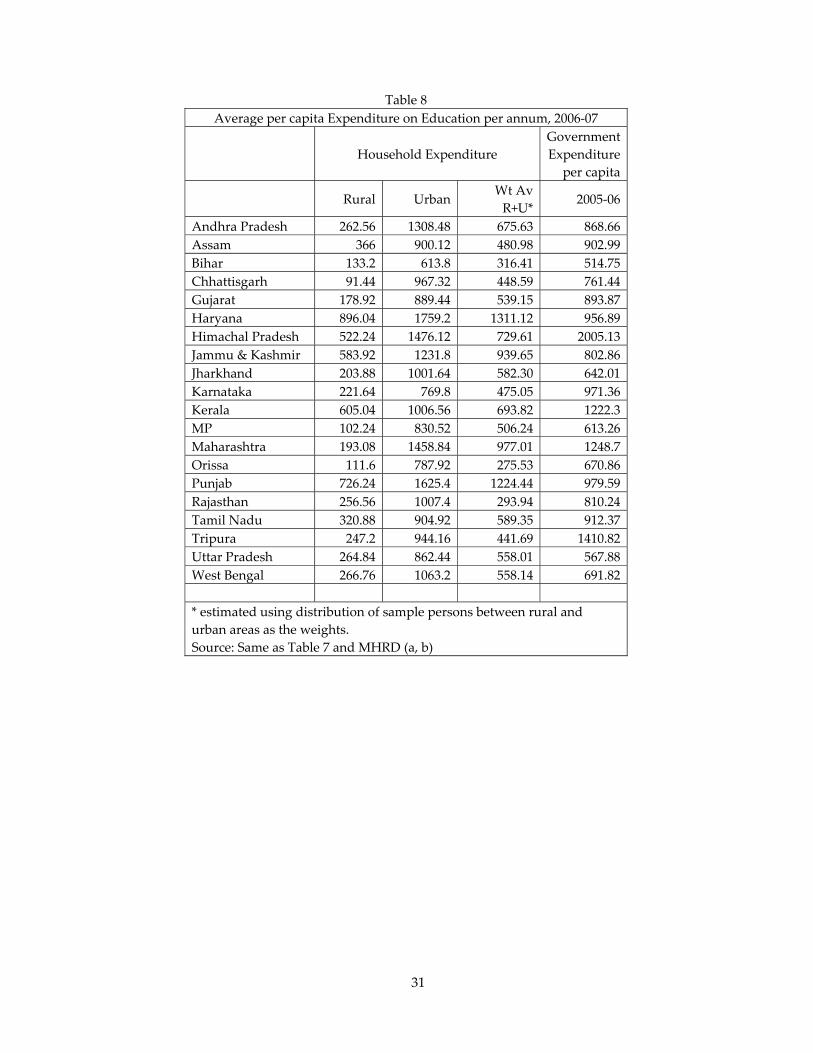
We have already noted interesting relationships between household
expenditure and government expenditure on education, when we have analysed the
coefficients of elasticity, using the time series data on private final consumption
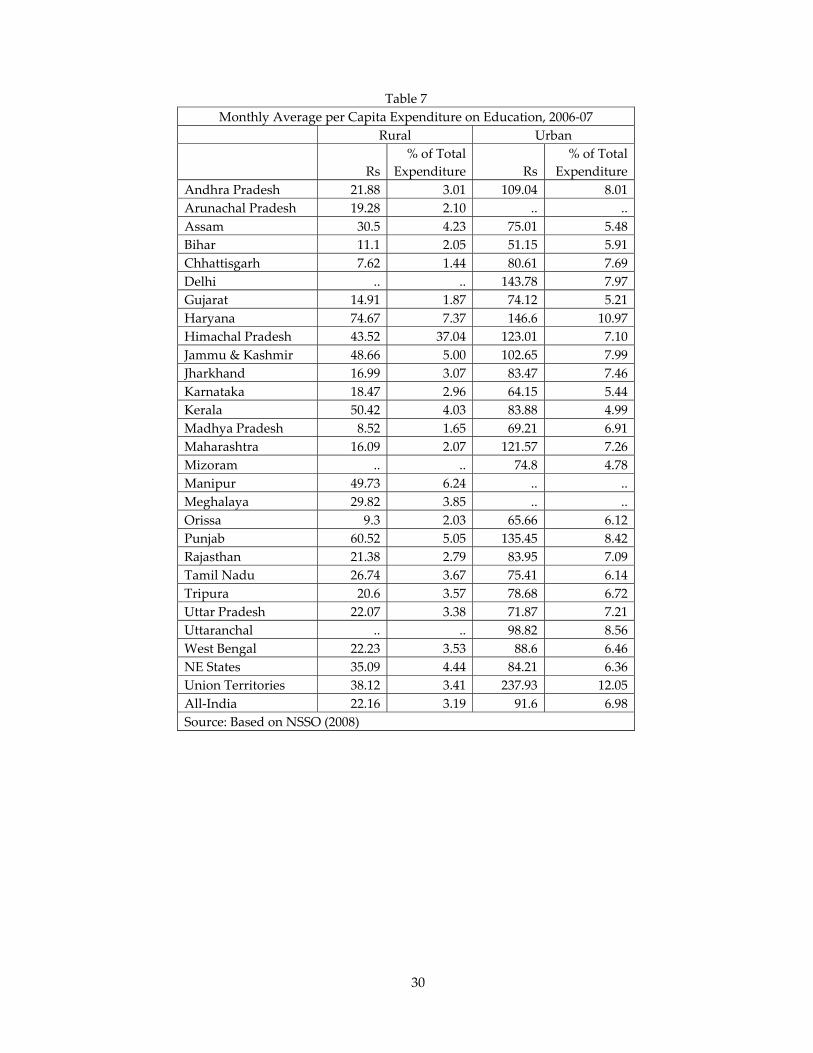
expenditure. However, when we use state‐wise data on per capita government and
household expenditure on education in 2006‐07 in 20 states (given in Tables 7 and 8),
we find that both are less elastic to each other.10
Looking at the coefficients in both cases, i.e., based on time‐series data and
cross section data, it can be stated, subject to their level of statistical significance, that
household expenditure and government expenditure do not substitute each other;
they complement each other. Increase in the government expenditure might
stimulate households to spend more on education.
Household Expenditure by Level of Education
The above estimates refer to all levels of education as an aggregate. It may be
10 The coefficients of elasticity of government expenditure to changes in household expenditure on education are as follows: 0.249 (t‐value: 2.42) (rural areas); 0.656 (t‐value: 2.76) (urban areas); and 0.309 (t‐value: 1.87) (rural and urban combined). Household expenditure is marginally more (but less than unity) elastic to changes in government expenditure on education. The respective coefficients are: 0.99 (t‐value: 2.49) in rural areas; 0.45 (t‐value: 2.76) in urban areas; and 0.53 (t‐value: 1.87) (rural and urban combined).

13
important to examine the expenditure by level of education. But only the special
rounds like the 52nd and the 64th rounds of NSS provide data on household
expenditure on education by levels. The 52nd round referring to 1995‐96 is still the
latest one, as the data on the other survey are not yet available. The estimates, based
on the special survey of the 52nd round (Report No. 439), which are used here, refer
to average household expenditure on education per student per annum in 2004‐05.
Let us examine the same.
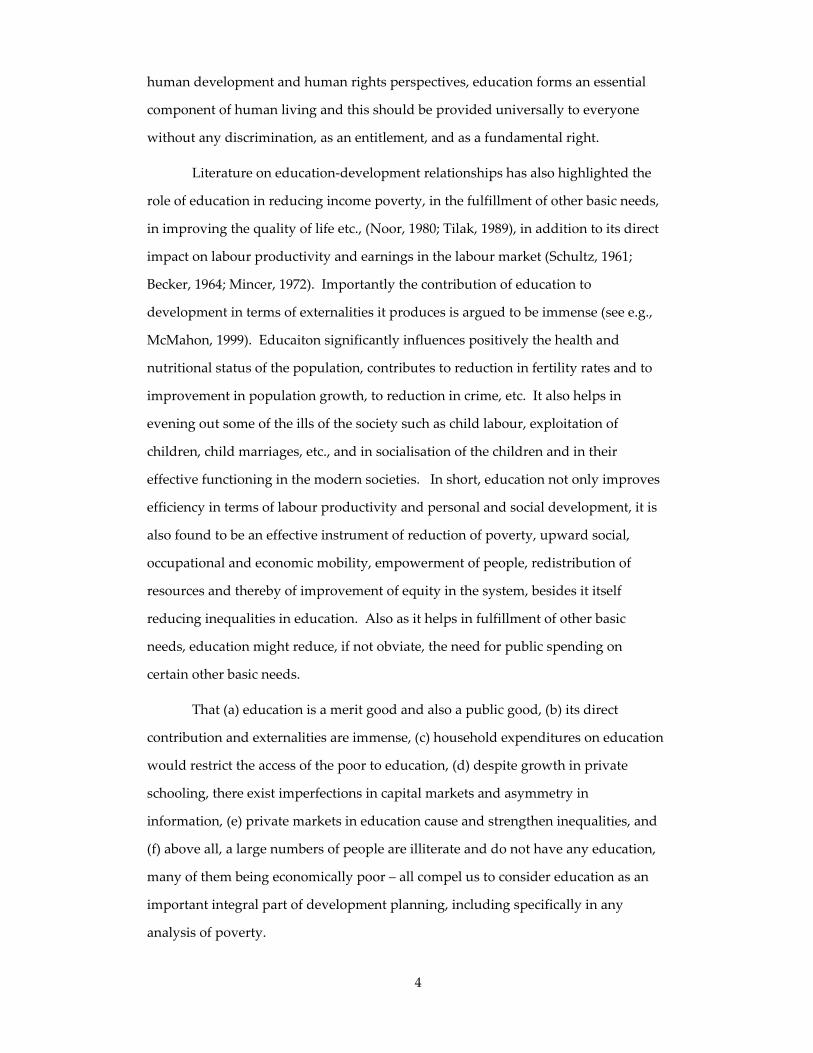
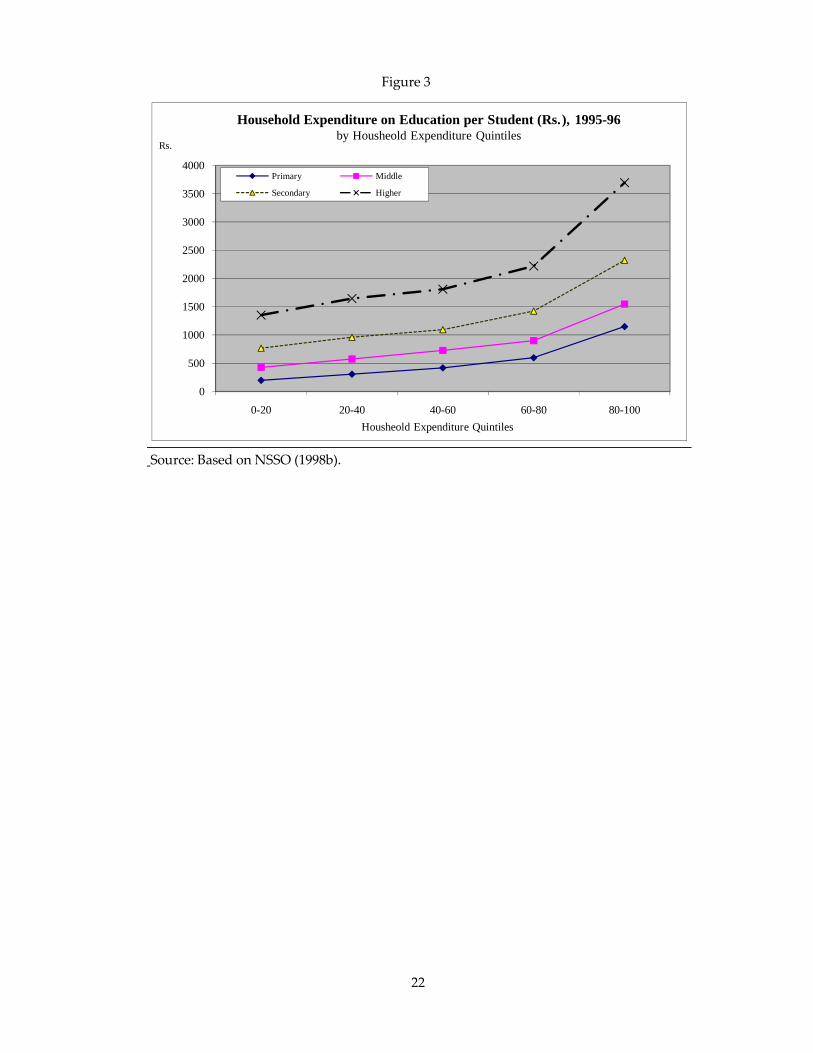
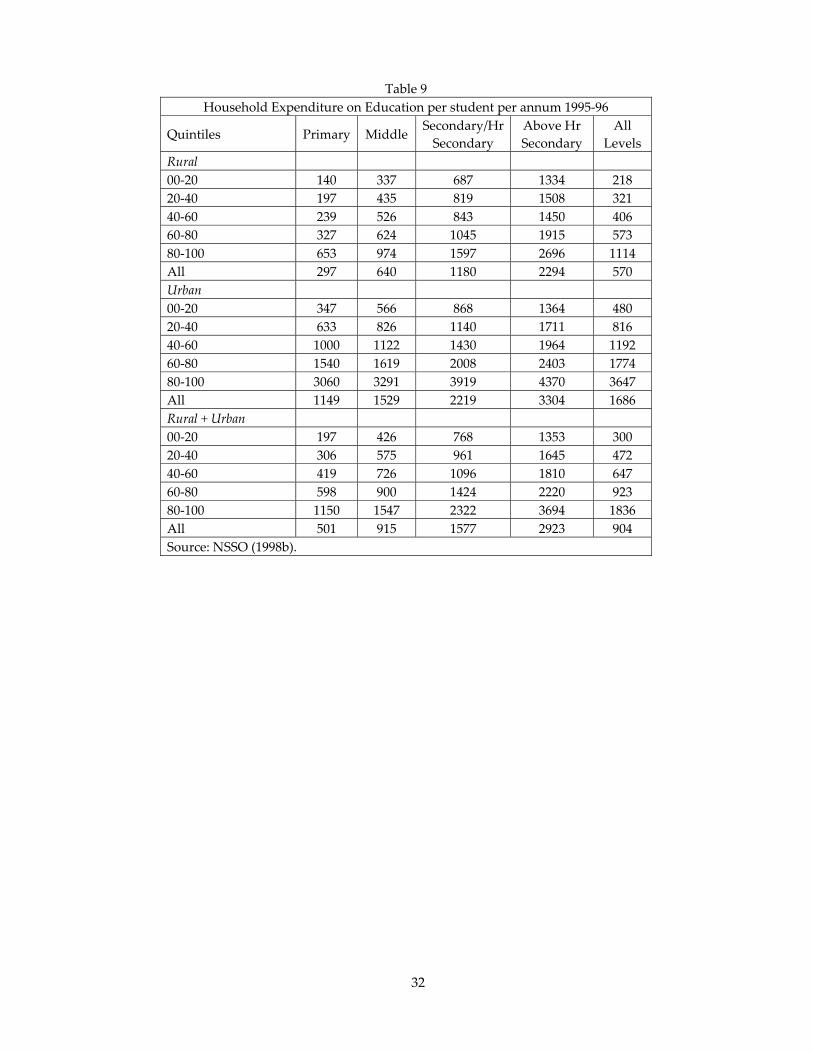
A close examination of the available estimates given in Table 9 reveals
several important features, some of which may be underscored here. Households in
every quintile incur huge expenditure on education of their children, both in rural and
urban areas. It is most generally felt that rich households spend more on education
than low income households. This is found to be true at every level of education, and
it also holds between every two successive expenditure groups. Average household
expenditure of the top expenditure group on education is 6.1 times the expenditure of
the bottom quintile. In fact, we notice a smooth upward increasing expenditure curve
of the different expenditure quintiles at every level of education. There is also no
intersection of curves between levels of education and the quintiles in Figure 3.
Households on average spend an amount of Rs.904 per student on all levels
of education on average. While the corresponding figure is Rs. 370 in rural areas, it
is nearly three times higher in urban areas. In both rural and urban areas, as noted
earlier, the level of household expenditure rises as the educational level rises. It
increases from Rs.218 for the bottom quintile in rural areas to Rs.1114 for the top
quintile. In urban areas it rises from Rs.480 to Rs.3447 – seven times higher between
the bottom and richest quintiles, compared to five times difference in rural areas.
The differences by levels of education are more striking. On average, a
household has to spend Rs.501 per child per annum for primary education. If the child
goes to middle or upper primary education, it increases to Rs.901; it further increases
to Rs.1577 in secondary11 schools and Rs.2923 in higher education.12 These figures
11 Secondary education/schools include senior secondary level as well.
12 Higher education here refers to what is described as ‘above higher secondary level’ in the NSSO (1998).
14
refer to 1995‐96. A quick comparison with the earlier set of estimates shows that there
has been a steep increase in the levels of household expenditures between 1986‐87 and
1995‐96. The expenditure on primary education per student in 1986‐87 varied between
Rs.84 in government schools in rural areas and Rs.569 in private schools in urban areas
(Tilak, 1996).13
Rural‐urban differences in household expenditures are striking. A household
in urban areas has to spend nearly four times the expenditure that a rural household
spends on the primary education of its child. Interestingly, the differences gradually
decline by increasing levels of education. Higher education in urban areas costs 1.4
times the cost of higher education in rural areas.
Interestingly, all types of inequalities in household expenditure on education
– by gender, rural‐urban, inequalities by household expenditure quintiles, and even
by type of education are the highest in primary education and the least in higher
education. Does this mean that primary education of the kind and form being
offered by several types of schools in the country, tends to accentuate inequalities,
and on the other hand, is it higher education that may provide cohesiveness bridging
gaps between different groups of population? While this may require more in‐depth
probing, this seems to at least tentatively true.
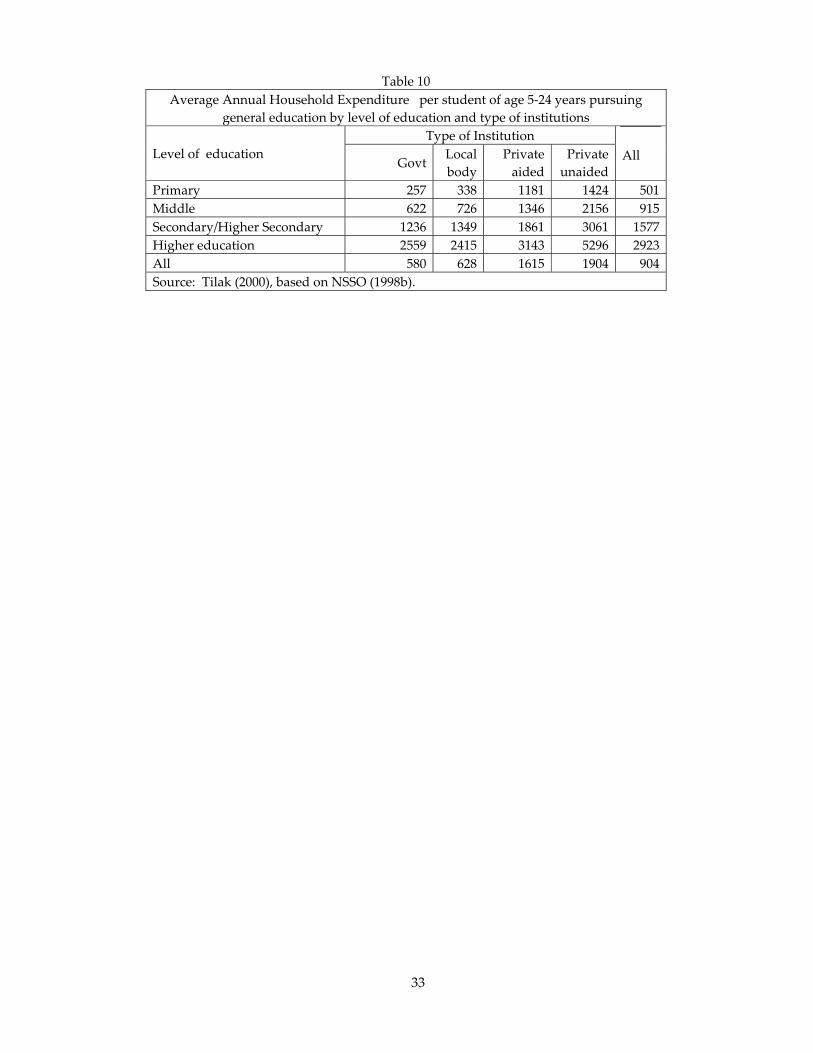
Contrary to the widely held belief that primary and upper primary education
in government, local body schools and even government aided schools is provided
rather ‘free’ and that households do not have to spend any significant amounts, it has
been found that even in government schools, children incur huge expenditures.
However, the household expenditure on education in government schools is the
lowest, followed by local body schools, which in turn was followed by government
aided schools. The corresponding figures are the highest in case of private schools.
What is interesting to note in Table 10 is that this is true in case of all levels of
education, with no exception at all. The difference between the private schools and the
government schools is as high as 5.5 times in primary schools, and the difference
comes down gradually to 2.1 in higher education.
13 These figures are based on the 42nd round of the National Sample Survey, conducted in 1986‐87.
15
The differences between several types of primary schools are vast, compared to
differences in higher levels of education. As a result, rich households spend a much
higher level of expenditure in primary education than poor households, but when it
comes to higher education, since differences between colleges are marginal, the
differences in household expenditures are also marginal; even the rich households do
not feel the need to spend significantly higher amounts on their children than what
poor households do.
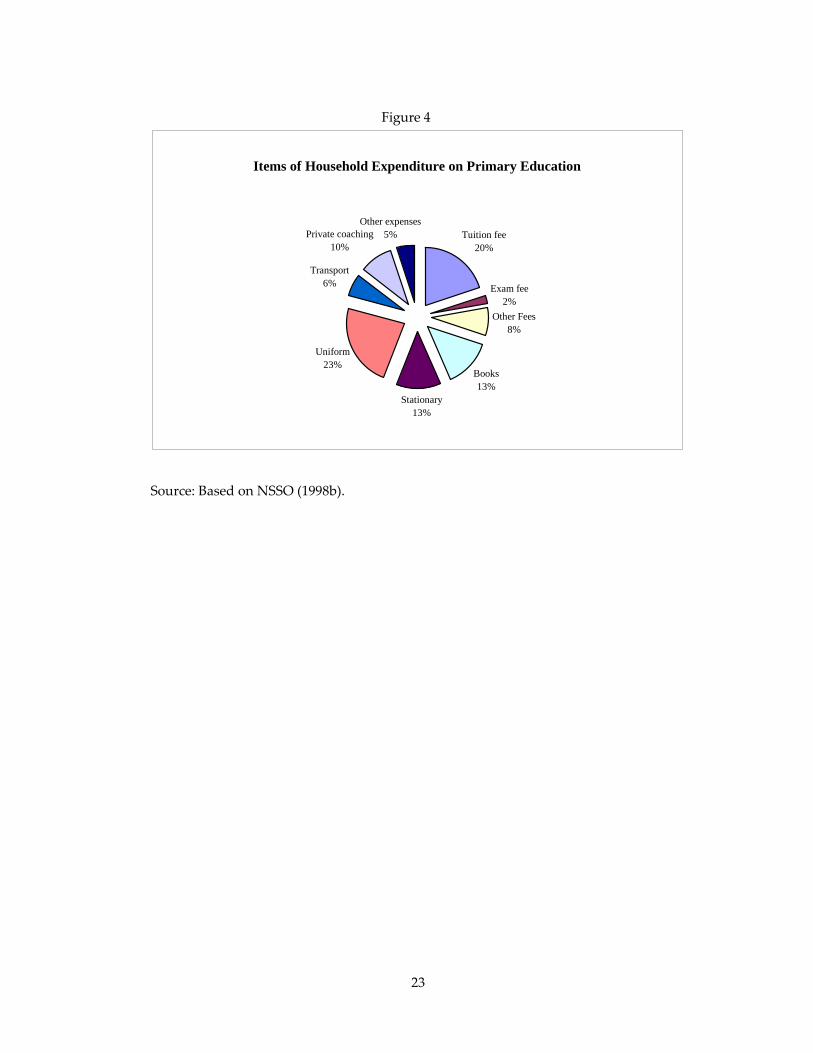
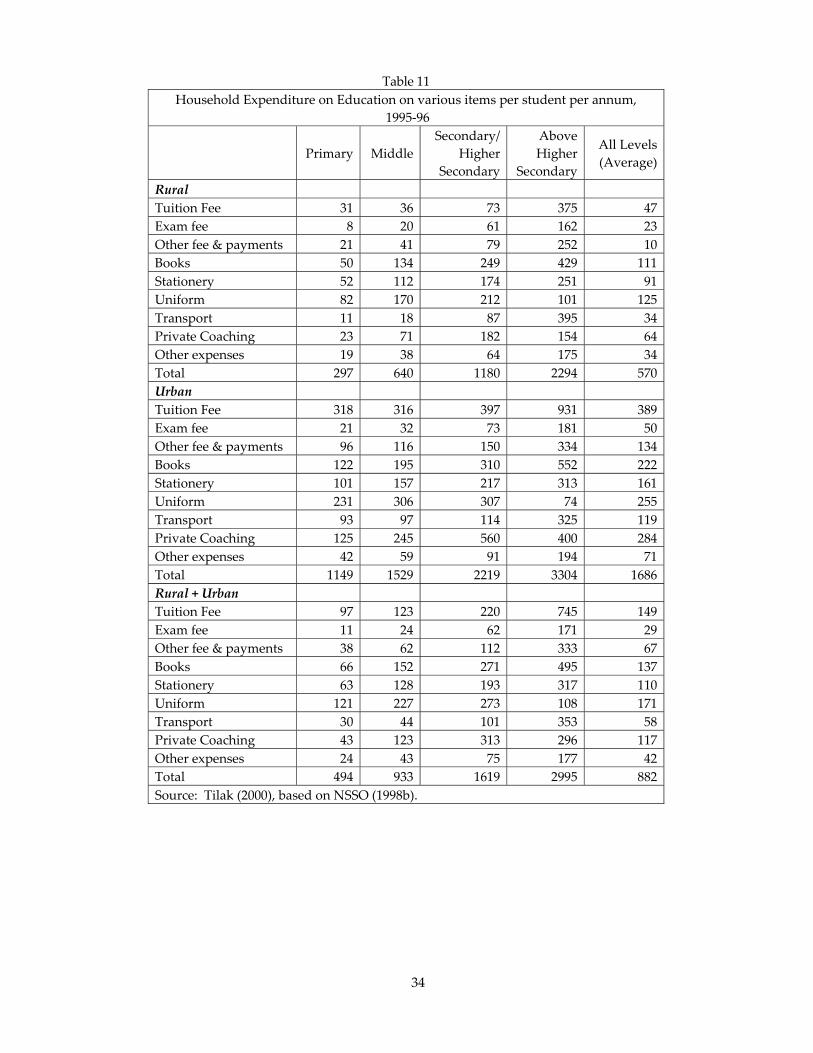
Of the several items of expenditure of the households on education, fees forms
the single most important item at any level of education, as shown in Table 11. Fee
includes tuition fee, examination fees and “‘other’ fees and ‘other’ payments”. Though
tuition fee is sizeable, other fees are not insignificant. Even in primary education, 20
per cent of the expenditure of the households on education goes in the form of tuition
fees, and another ten per cent in the form of other fees. In case of higher education,
the tuition fee forms 25 per cent and other fees 16 per cent. On the whole, all types of
fees forms 30 per cent of the household expenditure on education in primary
education, 23 per cent in middle and secondary education and 41 per cent in higher
education. So neither primary education nor any other level of education is even fee‐
free; it is not even tuition fee‐free.
The second most important item, after fees, is books and stationery. One‐
fourth to nearly 30 per cent of the total is accounted by books and stationery. This is
important even in case of primary education, where textbooks and stationery are
provided free to children. This may be because the provision by the government
could be highly inadequate. In elementary education the third important item is
uniforms, which is also said to be provided by the government free to many, if not all
children. Private coaching is found to be important only in case of secondary
education, and not necessarily in other levels of education, though the phenomenon
does exist in case of all levels of education. On average 14 per cent of children in rural
areas and 18 per cent in urban areas in all levels of education together, take private
coaching. High proportion of students going for private coaching obviously reflects
the poor quality of education and of the instructional process offered in schools,
whether they are government or private schools.
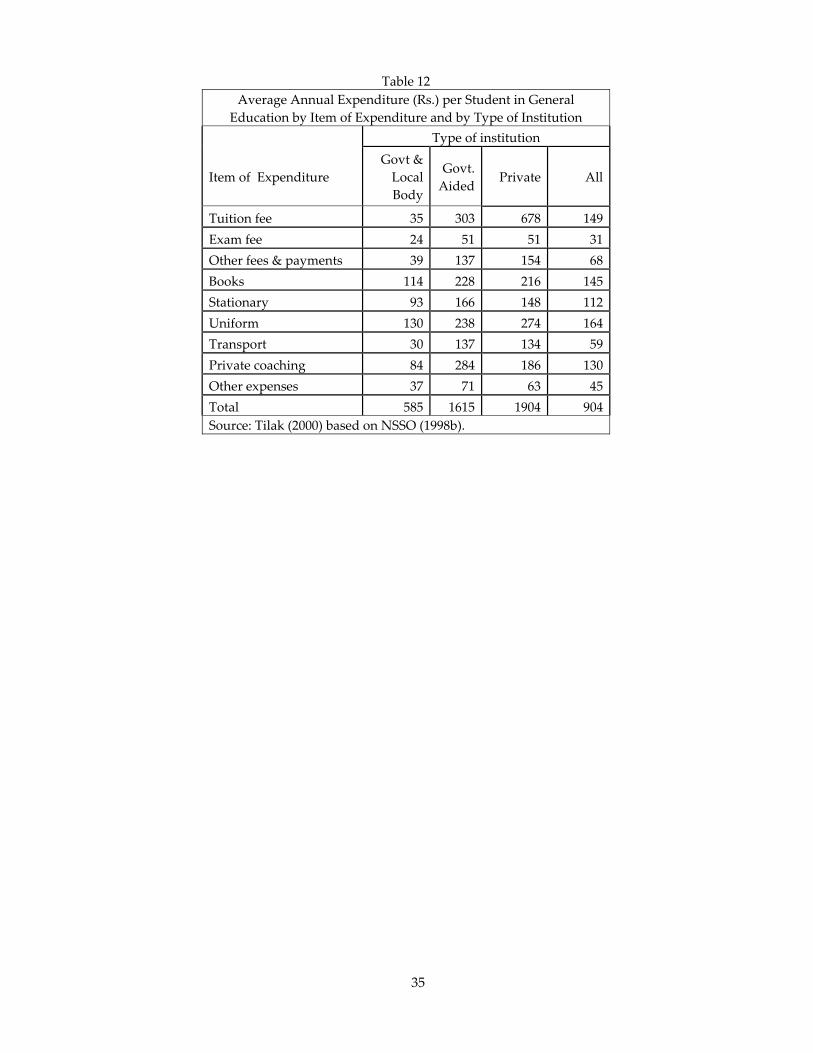
Figure 4 gives the distribution of expenditure on education by different items
16
for all levels of education taken together on average. Unfortunately these data are not
available in the published reports by type of school, i.e., the available information does
not help us to know the extent of say expenditure on fees in government primary
schools vis‐à‐vis other types of schools. Such information is available by type of
school and not at the same time by level of education. Considering all levels of
education together, it can be noted in Table 12 that it is not only fees, but also
expenditure on every item of expenditure is higher in government aided schools than
in government and local body schools, and is the highest in the private schools. The
exceptions are very few. Expenditure on private coaching, and also on books and
stationery is higher in case of children attending government aided schools than the
other schools. Further, except transport and to some extent private coaching in rural
areas, a majority of the students have to spend on all other items, including fees,
books, stationery, uniforms and ‘other’ expenses, and they have to spend, not
insignificant, but considerable amounts.
3. Household Expenditure on Education for Consideration for Re‐Estimation of
the Poverty Line
What constitutes a minim desirable level of expenditure on education that
needs to be considered in redefining the poverty line is a difficult exercise and
involves crucial choices. The simple way is to consider the actual expenditure
incurred by the poor on education and add it to the present poverty line. But the
current level of expenditure incurred by the poor may not constitute a desirable
minimum level. It may not be adequate for meaningful education, as the poor may
be under‐spending – spending less than required, and as a result, this would affect
their participation, continuation, and their attainment of a minimum level of
learning in schools, and their transition to the next level of education. As the
current level may not be adequate for a minimum desirable level of education of
acceptable quality, a normative estimate has to be made as a minimum household
cost of education for the poor to acquire a given level of education. But estimation
of a minimum desirable normative estimate is indeed difficult. It cannot but be
arbitrary. In all, there are four alternatives, including the current level of spending
of the poor, viz.,
17
a) Amount of expenditure currently incurred by the poor
b) Maximum level of expenditure incurred by the households, which is
generally the one incurred by the top expenditure/income group.
c) Expenditure incurred by the median households, and
d) Expenditure incurred by the average of all the households.
We have already noted that (a) may not be right. While (b) may ensure quality
education to the poor, comparable to what the richest get, this is also not proper, as
some part of the expenditure the rich incur could be spurious: the rich households
spend, simply because they have money, though it is not necessary, and also because
we are considering the minimum amount required to obtain a minimum level of
education with quality, and not what the richest spend. So of the four alternatives,
we are left with (c) and (d). While (c) may be good,14 (d) may be preferred to (c), as
after all, it is an average of all the economic groups, including the richest, an average,
that may even out differences between the poor and the rich and may enable the
poor to get meaningful and quality education.
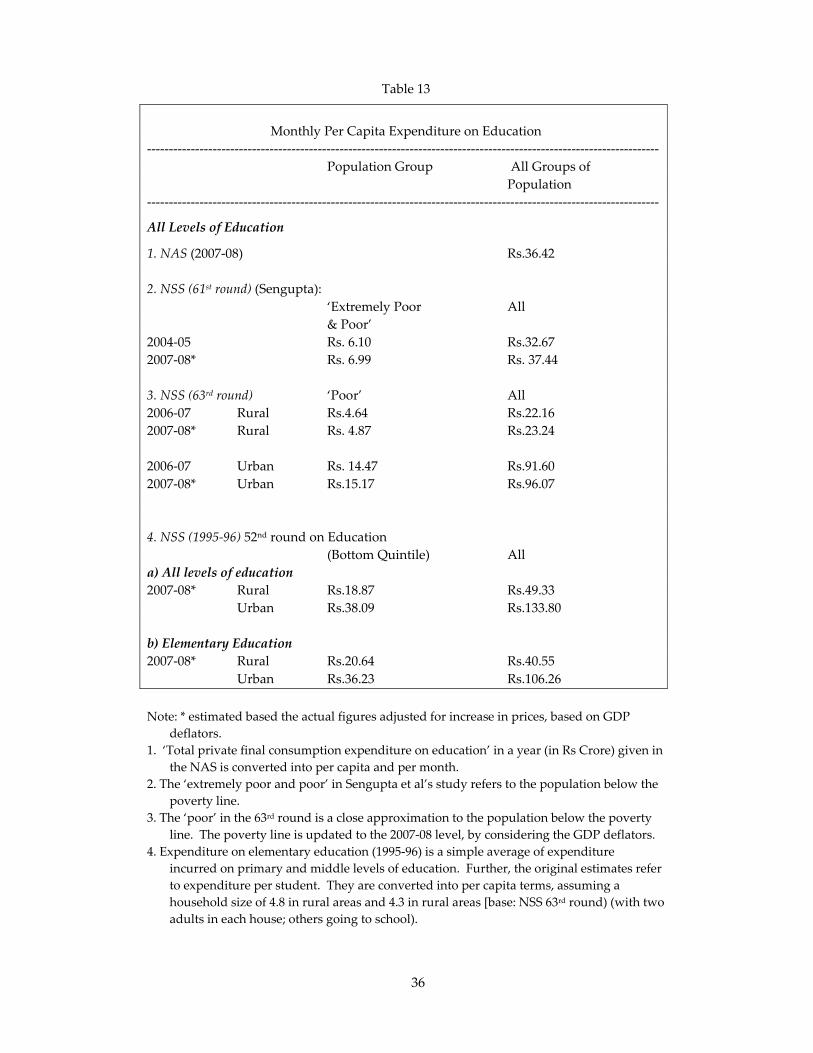
With regard to an average estimate, essentially two alternative sets of
estimates are available on household expenditure on education. They are estimates
i) based on the 63rd round of NSS (2006‐07) (Report No. 527); also those based on
the 61st round of NSS (2004‐05), and
ii) based on the 52nd round of NSS (1995‐96) (Report No. 439)
As already noted, the NSS Report No. 439 provides detailed estimates of
household expenditure on education by levels of education, and by household
expenditure quintile groups; but they are dated, as they refer to 1995‐96. Data based
on a similar survey conducted in 2007‐08 are not yet available. The several rounds
of Consumption Expenditure Surveys of NSS do provide similar data, the latest one
being the 63rd round. But the Employment‐Unemployment and the Social
Consumption Expenditure surveys provide aggregate data on household
expenditure on education, not disaggregated by levels, but disaggregated by
monthly per capita expenditure groups and they are also available for rural and 14 Dev and Ravi (2008) suggest the same.
18
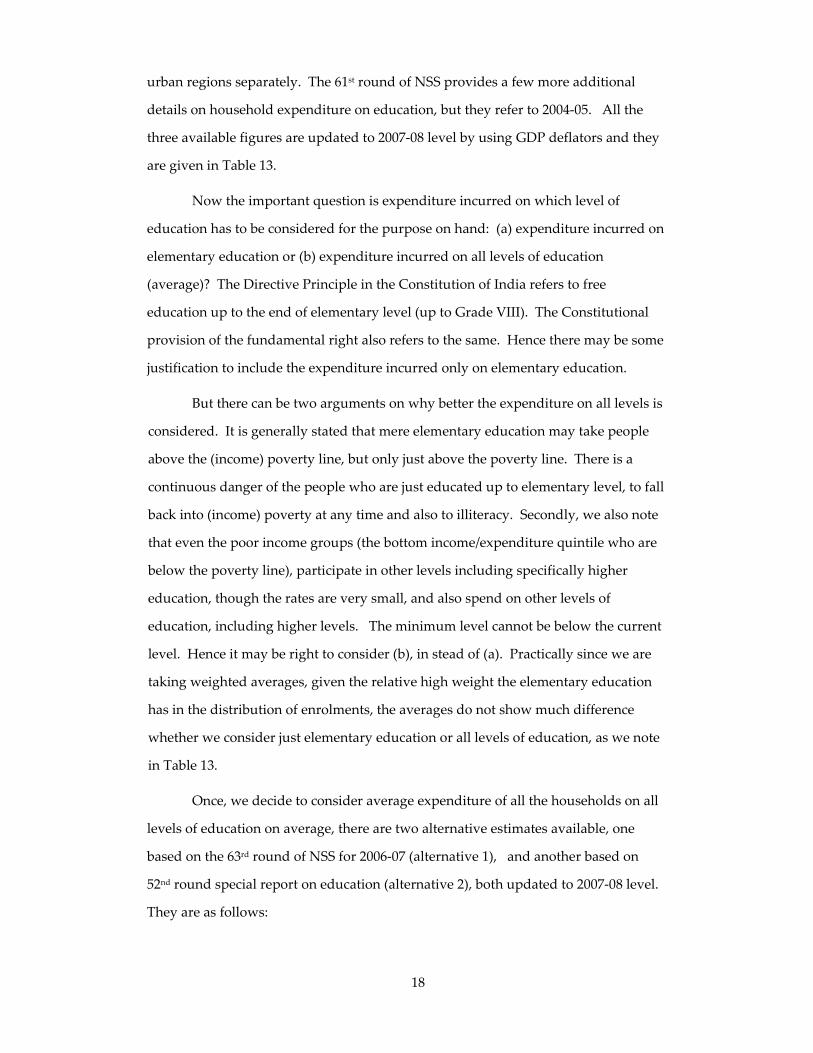
urban regions separately. The 61st round of NSS provides a few more additional
details on household expenditure on education, but they refer to 2004‐05. All the
three available figures are updated to 2007‐08 level by using GDP deflators and they
are given in Table 13.
Now the important question is expenditure incurred on which level of
education has to be considered for the purpose on hand: (a) expenditure incurred on
elementary education or (b) expenditure incurred on all levels of education
(average)? The Directive Principle in the Constitution of India refers to free
education up to the end of elementary level (up to Grade VIII). The Constitutional
provision of the fundamental right also refers to the same. Hence there may be some
justification to include the expenditure incurred only on elementary education.
But there can be two arguments on why better the expenditure on all levels is
considered. It is generally stated that mere elementary education may take people
above the (income) poverty line, but only just above the poverty line. There is a
continuous danger of the people who are just educated up to elementary level, to fall
back into (income) poverty at any time and also to illiteracy. Secondly, we also note
that even the poor income groups (the bottom income/expenditure quintile who are
below the poverty line), participate in other levels including specifically higher
education, though the rates are very small, and also spend on other levels of
education, including higher levels. The minimum level cannot be below the current
level. Hence it may be right to consider (b), in stead of (a). Practically since we are
taking weighted averages, given the relative high weight the elementary education
has in the distribution of enrolments, the averages do not show much difference
whether we consider just elementary education or all levels of education, as we note
in Table 13.
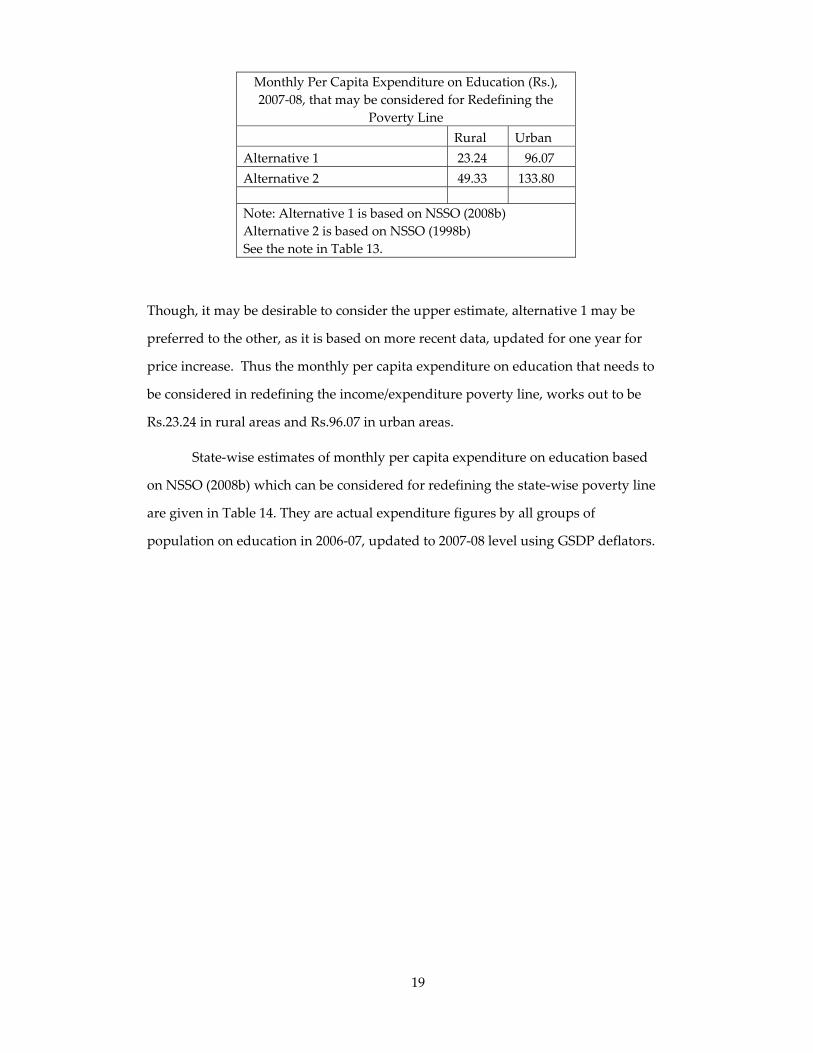
Once, we decide to consider average expenditure of all the households on all
levels of education on average, there are two alternative estimates available, one
based on the 63rd round of NSS for 2006‐07 (alternative 1), and another based on
52nd round special report on education (alternative 2), both updated to 2007‐08 level.
They are as follows:
19
Monthly Per Capita Expenditure on Education (Rs.), 2007‐08, that may be considered for Redefining the
Poverty Line Rural Urban Alternative 1 23.24 96.07 Alternative 2 49.33 133.80 Note: Alternative 1 is based on NSSO (2008b) Alternative 2 is based on NSSO (1998b) See the note in Table 13.
Though, it may be desirable to consider the upper estimate, alternative 1 may be
preferred to the other, as it is based on more recent data, updated for one year for
price increase. Thus the monthly per capita expenditure on education that needs to
be considered in redefining the income/expenditure poverty line, works out to be
Rs.23.24 in rural areas and Rs.96.07 in urban areas.
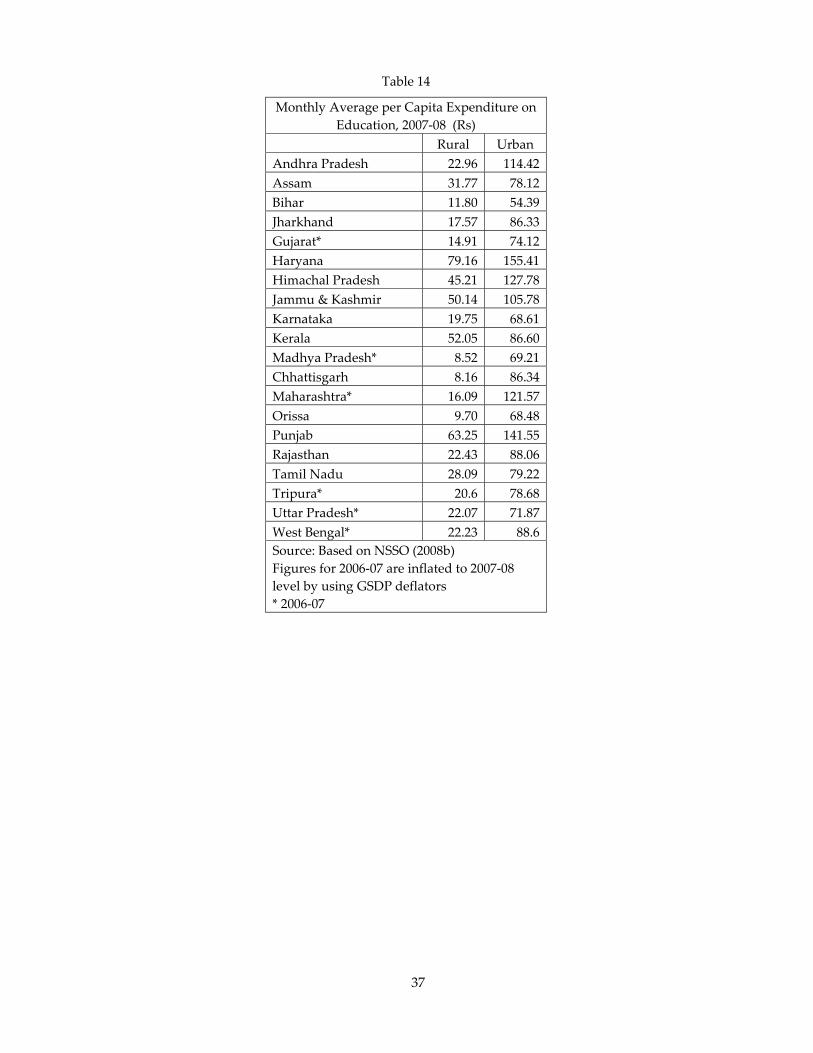
State‐wise estimates of monthly per capita expenditure on education based
on NSSO (2008b) which can be considered for redefining the state‐wise poverty line
are given in Table 14. They are actual expenditure figures by all groups of
population on education in 2006‐07, updated to 2007‐08 level using GSDP deflators.
20
Figure 1
0
25
50
75
1000-
235/
0-3
35
235-
270/
335
-395
270-
320/
395
-485
320-
365/
485
-580
365-
410/
580
-675
410-
455/
675
-790
455-
510/
790
-930
510-
580/
930
-110
0
580-
690/
110
0-13
80
690-
890/
138
0-18
80
890-
1155
/ 188
0-25
40
1155
& m
ore/
2540
& a
bove
Rural/Urban MPCE Class
Rates of Attendance in Educational Institutions by Age Group and MPCE Class, 2004-05
R 5-14 R 15-19R 20-24 U 5-14U 15-19 U 20-24
Source: Based on NSSO (2006).
21
Figure 2a
0
2
4
6
8
10
12
14
0
20
40
60
80
0-23
5
235-
270
270-
320
320-
365
365-
410
410-
455
455-
510
510-
580
580-
690
690-
890
890-
1155
1155
& m
ore
Mea
n Ye
ars o
f Sch
oolin
g
r = 0.934
Mon
thly
Per
Cap
ita E
xpen
ditu
re o
n Ed
ucat
ion
(Rs.)
MPCE Class
Household Expenditure on Education and Mean Years of Schooling, 2004-05 Rural India
Household Expenditure on Education
Mean Years of Schooling
Figure 2b
0
5
10
15
20
25
0
100
200
300
400
0-33
5
335-
395
395-
485
485-
580
580-
675
675-
790
790-
930
930-
1100
1100
-138
0
1380
-188
0
1880
-254
0
2540
& m
ore
Mea
n Ye
ars o
f Sch
oolin
g
r = 0.837
Mon
thly
Per
cap
ita E
xpen
ditu
re o
n Ed
ucat
ion
(Rs.)
MPCE Class
Household Expenditure on Education and Mean Years of Schooling, 2004-05 Urban India
Household Expenditure on Education
Mean Years of Schooling
Source: Based on NSSO (2006).
22
Figure 3
0
500
1000
1500
2000
2500
3000
3500
4000
0-20 20-40 40-60 60-80 80-100
Rs.
Housheold Expenditure Quintiles
Household Expenditure on Education per Student (Rs.), 1995-96by Housheold Expenditure Quintiles
Primary Middle
Secondary Higher
Source: Based on NSSO (1998b).
23
Figure 4
Items of Household Expenditure on Primary Education
Tuition fee20%
Exam fee2%
Other Fees8%
Books13%
Stationary13%
Uniform23%
Transport6%
Private coaching10%
Other expenses5%
Source: Based on NSSO (1998b).
24
Table 1 Private Final Consumption Expenditure on Education (in 1999‐2000 prices)
Rs per annum
Rs
crore % of Total
Rs. per capita
Rs crore
% of Total
Rs. per capita
1950‐51 1240 0.60 34.54 1980‐81 8196 1.46 120.711951‐52 1330 0.60 36.44 1981‐82 8097 1.39 117.011952‐53 1406 0.61 37.80 1982‐83 8249 1.40 116.511953‐54 1511 0.62 39.87 1983‐84 8196 1.25 113.361954‐55 1630 0.65 42.23 1984‐85 8331 1.28 112.731955‐56 1758 0.69 44.73 1985‐86 7722 1.13 102.281956‐57 1867 0.70 46.56 1986‐87 9394 1.34 121.841957‐58 1977 0.76 48.34 1987‐88 10320 1.43 130.961958‐59 2133 0.75 51.03 1988‐89 10977 1.43 136.361959‐60 2300 0.80 53.99 1989‐90 12378 1.54 150.581960‐61 2490 0.82 57.37 1990‐91 13976 1.66 166.581961‐62 2732 0.89 61.53 1991‐92 13976 1.62 163.271962‐63 3112 1.00 68.55 1992‐93 14071 1.60 161.361963‐64 3407 1.05 73.43 1993‐94 14721 1.60 165.031964‐65 3654 1.06 77.09 1994‐95 14943 1.55 164.211965‐66 4001 1.16 82.49 1995‐96 16193 1.59 174.491966‐67 4305 1.24 86.97 1996‐97 17533 1.60 185.341967‐68 4609 1.25 91.09 1997‐98 19730 1.76 204.671968‐69 5141 1.36 99.25 1998‐99 21304 1.79 216.721969‐70 5544 1.42 104.80 1999‐00 23781 1.89 237.571970‐71 5706 1.41 105.47 2000‐01 26190 2.01 257.021971‐72 5982 1.45 107.98 2001‐02 28632 2.08 275.311972‐73 6267 1.52 110.53 2202‐03 31398 2.22 297.331973‐74 6314 1.48 108.86 2003‐04 34522 2.30 322.031974‐75 6942 1.63 117.07 2004‐05 37939 2.39 348.381975‐76 7113 1.58 117.18 2005‐06 41821 2.47 378.131976‐77 7193 1.57 116.02 2006‐07 45608 2.53 406.491977‐78 7222 1.46 113.91 2007‐08 49733 2.55 437.021978‐79 7365 1.40 113.66 1979‐80 8020 1.56 120.78 Source: Based on CSO (2008 and 2009) [www.mospi.nic.in]
25
Table 2
Government Expenditure on Education per Capita (Rs. in 1999‐2000 prices)
Rs
Rs Rs 1951‐52 41.30 1970‐71 197.24 1989‐90 515.67 1952‐53 47.37 1971‐72 205.95 1990‐91 520.61 1953‐54 49.90 1972‐73 215.83 1991‐92 490.14 1954‐55 65.06 1973‐74 202.19 1992‐93 494.35 1955‐56 79.21 1974‐75 211.38 1993‐94 496.72 1956‐57 77.58 1975‐76 247.29 1994‐95 509.57 1957‐58 83.79 1976‐77 257.84 1995‐96 539.02 1958‐59 91.21 1977‐78 273.48 1996‐97 559.10 1959‐60 104.23 1978‐79 299.14 1997‐98 570.55 1960‐61 115.89 1979‐80 284.56 1998‐99 655.93 1961‐62 120.54 1980‐81 277.30 1999‐00 750.75 1962‐63 121.24 1981‐82 283.43 2000‐01 787.46 1963‐64 124.44 1982‐83 328.82 2001‐02 727.25 1964‐65 131.25 1983‐84 337.53 2202‐03 735.36 1965‐66 138.09 1984‐85 361.42 2003‐04 732.41 1966‐67 135.63 1985‐86 389.97 2004‐05 741.21 1967‐68 147.44 1986‐87 387.75 2005‐06 825.34 1968‐69 157.60 1987‐88 430.23 2006‐07 942.23 1969‐70 176.53 1988‐89 464.30 Source: Based on MHRD (a and b).
26
Table 3
Monthly Per Capita Consumption Expenditure on Education by households, by MPCE class (1995‐96, 2005‐06, 2006‐07
Rural
Urban
MPCE Class Rs. % of Total
Expenditure MPCE Class Rs % of Total
Expenditure 1995‐96 0‐120 0.90 0.86 0‐160 1.33 0.96 120‐140 1.11 0.85 160‐190 2.41 1.36 140‐165 1.38 0.89 190‐230 2.99 1.41 165‐190 1.09 0.61 230‐265 4.27 1.73 190‐210 2.35 1.17 265‐310 6.46 2.24 210‐235 2.94 1.32 310‐355 9.30 2.80 235‐265 3.16 1.27 355‐410 12.25 3.21 265‐300 5.01 1.77 410‐490 17.36 3.87 300‐355 5.75 1.76 490‐605 23.52 4.32 355‐455 9.90 2.48 605‐825 39.53 5.62 455‐560 14.38 2.87 825‐1055 61.77 6.79 560 & above 26.86 3.10 1055 & above 160.43 8.85 All 7.45 2.16 All 34.48 5.75 2005‐06 0‐235 1.88 0.96 0‐335 3.95 1.40 235‐270 2.95 1.15 335‐395 8.59 2.33 270‐320 2.94 0.99 395‐485 10.52 2.37 320‐365 5.23 1.52 485‐580 13.56 2.59 365‐410 6.26 1.62 580‐675 22.58 3.60 410‐455 7.63 1.76 675‐790 27.39 3.74 455‐510 8.62 1.79 790‐930 34.46 4.01 510‐580 12.09 2.23 930‐1100 47.95 4.75 580‐690 16.51 2.62 1100‐1380 75.87 6.19 690‐890 22.11 2.85 1380‐1880 106.44 6.66 890‐1155 34.83 3.47 1880‐2540 160.77 7.46 1155 & more 73.45 4.21 2540& more 370.99 9.41 All 16.98 2.72 All 72.85 6.22 2006‐07 0‐235 1.91 0.97 0‐335 5.27 1.84 235‐270 2.14 0.84 335‐395 6.35 1.73 270‐320 2.98 1.01 395‐485 11.39 2.57 320‐365 5.32 1.55 485‐580 13.21 2.46 365‐410 6.07 1.57 580‐675 21.68 3.45 410‐455 7.19 1.66 675‐790 26.58 3.62 455‐510 8.70 1.81 790‐930 38.02 4.42 510‐580 11.03 2.03 930‐1100 48.73 4.82 580‐690 15.74 2.49 1100‐1380 68.44 5.56 690‐890 24.54 3.15 1380‐1880 110.25 6.89 890‐1155 33.70 3.36 1880‐2540 182.02 8.43 1155 & more 95.17 5.41 2540& more 424.68 10.44 All 22.16 3.19 All 91.60 6.98 Source: Based on NSSO (1998a, 2008a, b)
27
Table 4
Percentage Rate of Attendance in Educational Institutions, 2004‐05 Rural
Urban
MPCE Class Age‐Group
MPCE Class Age‐Group
5‐14 15‐19 20‐24 5‐14 15‐19 20‐240‐235 61.7 22.8 1.6 0‐335 68.3 28.9 3.6235‐270 69.3 20.7 1.5 335‐395 72.4 30.2 2.7270‐320 72.4 25.6 1.9 395‐485 79.9 34.6 4.5320‐365 73.4 27.1 3.0 485‐580 88.2 42.5 5.2365‐410 78.5 30.9 3.2 580‐675 89.2 47.0 9.6410‐455 80.4 34.2 5.7 675‐790 90.3 53.3 14.0455‐510 82.4 37.6 4.1 790‐930 94.6 60.9 14.8510‐580 85.1 40.9 7.1 930‐1100 96.8 69.9 20.4580‐690 89.0 48.0 8.1 1100‐1380 98.1 79.6 26.8690‐890 91.9 54.5 12.8 1380‐1880 98.9 82.1 37.5890‐1155 94.4 62.0 16.5 1880‐2540 98.5 87.3 38.91155 & more 95.9 71.2 32.0 2540& more 98.0 93.2 61.9All 80.3 40.7 7.9 All 88.5 58.3 20.0 Source: Based on NSSO (2006)
28
Table 5
Distribution of Population by Educational Level and by MPCE Class, 2004‐05
MPCE Class
Not
literate
Literate &
Upto
Prim
ary
Middle
Second
ary
Higher
Second
ary
Diploma
Gradu
ate
& abo
ve
Total
Mean
Years of
Scho
oling
Rural 0‐235 69.2 18.4 8.5 2.5 0.7 0.1 0.3 100 3.018235‐270 64.8 22.7 9.2 2.3 0.5 0.3 0.3 100 3.386270‐320 60.9 22.8 10.1 3.8 1.7 0.1 0.5 100 3.982320‐365 58.1 22.5 12.4 4.4 1.7 0.1 0.6 100 4.372365‐410 52.7 25.6 13.0 5.4 2.2 0.1 1.0 100 5.022410‐455 50.9 24.3 14.0 6.0 2.9 0.3 1.4 100 5.425455‐510 47.7 25.8 15.2 6.6 3.0 0.3 1.4 100 5.798510‐580 42.9 25.2 16.8 8.6 4.0 0.4 2.0 100 6.635580‐690 38.5 25.0 17.9 10.4 4.9 0.7 2.7 100 7.452690‐890 33.2 23.8 19.1 12.4 6.4 1.1 3.8 100 8.475890‐1155 26.7 22.0 18.9 15.3 8.3 2.4 6.3 100 10.0261155 & more 17.6 18.9 17.8 16.6 12.3 4.7 12.1 100 12.535All 45.2 23.8 15.2 8.2 4.1 0.7 2.5 100 6.472 Urban 0‐335 50.5 27.3 12.9 5.5 1.9 0.5 1.3 100 5.246335‐395 44.5 27.1 15.9 7.6 3.0 0.3 1.5 100 6.163395‐485 39.0 28.0 18.1 9.0 3.6 0.6 1.8 100 6.979485‐580 31.4 28.2 19.6 11.7 4.7 0.7 3.6 100 8.286580‐675 26.9 25.6 21.7 13.0 6.4 1.7 4.6 100 9.349675‐790 19.9 25.2 22.4 15.4 8.3 1.9 6.9 100 10.760790‐930 16.6 20.9 22.3 17.9 10.9 2.3 9.1 100 11.956930‐1100 13.4 19.2 21.4 18.4 12.2 2.9 12.5 100 13.0071100‐1380 9.2 14.5 18.9 20.9 15.3 3.7 17.5 100 14.7371380‐1880 6.1 11.7 15.0 19.2 17.7 4.9 25.4 100 16.4201880‐2540 4.3 7.9 11.1 18.8 16.8 4.7 36.4 100 18.0832540& more 1.8 5.1 6.4 13.6 16.1 5.3 51.6 100 20.191All 19.6 20.0 18.2 15.3 10.4 2.6 14.0 100 12.130Source: Based on NSSO (2006).

29
Table 6 Monthly Per capita Expenditure on Education (Rs.)
1999‐2000 2004‐05
Rs % of Total Expenditure Rs.
% of Total Expenditure
Extremely Poor and Poor 3.45 1.3 6.10 1.9 Marginal & Vulnerable 9.78 2.1 17.05 3.1 Poor & Vulnerable (above two) 7.64 1.9 14.07 2.9 Middle & High Income Group 44.73 4.1 97.16 7.0 All 14.95 2.8 32.67 4.7 Source: Based on Sengupta et al (2008), Tables 14 and 17 (Based on NSS 55th and 61st rounds of Employment‐Unemployment Surveys)
30
Table 7
Monthly Average per Capita Expenditure on Education, 2006‐07 Rural Urban
Rs% of Total
Expenditure Rs% of Total
Expenditure Andhra Pradesh 21.88 3.01 109.04 8.01 Arunachal Pradesh 19.28 2.10 .. .. Assam 30.5 4.23 75.01 5.48 Bihar 11.1 2.05 51.15 5.91 Chhattisgarh 7.62 1.44 80.61 7.69 Delhi .. .. 143.78 7.97 Gujarat 14.91 1.87 74.12 5.21 Haryana 74.67 7.37 146.6 10.97 Himachal Pradesh 43.52 37.04 123.01 7.10 Jammu & Kashmir 48.66 5.00 102.65 7.99 Jharkhand 16.99 3.07 83.47 7.46 Karnataka 18.47 2.96 64.15 5.44 Kerala 50.42 4.03 83.88 4.99 Madhya Pradesh 8.52 1.65 69.21 6.91 Maharashtra 16.09 2.07 121.57 7.26 Mizoram .. .. 74.8 4.78 Manipur 49.73 6.24 .. .. Meghalaya 29.82 3.85 .. .. Orissa 9.3 2.03 65.66 6.12 Punjab 60.52 5.05 135.45 8.42 Rajasthan 21.38 2.79 83.95 7.09 Tamil Nadu 26.74 3.67 75.41 6.14 Tripura 20.6 3.57 78.68 6.72 Uttar Pradesh 22.07 3.38 71.87 7.21 Uttaranchal .. .. 98.82 8.56 West Bengal 22.23 3.53 88.6 6.46 NE States 35.09 4.44 84.21 6.36 Union Territories 38.12 3.41 237.93 12.05 All‐India 22.16 3.19 91.6 6.98 Source: Based on NSSO (2008)
31
Table 8
Average per capita Expenditure on Education per annum, 2006‐07
Household Expenditure
Government Expenditure
per capita
Rural Urban
Wt Av R+U*
2005‐06
Andhra Pradesh 262.56 1308.48 675.63 868.66 Assam 366 900.12 480.98 902.99 Bihar 133.2 613.8 316.41 514.75 Chhattisgarh 91.44 967.32 448.59 761.44 Gujarat 178.92 889.44 539.15 893.87 Haryana 896.04 1759.2 1311.12 956.89 Himachal Pradesh 522.24 1476.12 729.61 2005.13 Jammu & Kashmir 583.92 1231.8 939.65 802.86 Jharkhand 203.88 1001.64 582.30 642.01 Karnataka 221.64 769.8 475.05 971.36 Kerala 605.04 1006.56 693.82 1222.3 MP 102.24 830.52 506.24 613.26 Maharashtra 193.08 1458.84 977.01 1248.7 Orissa 111.6 787.92 275.53 670.86 Punjab 726.24 1625.4 1224.44 979.59 Rajasthan 256.56 1007.4 293.94 810.24 Tamil Nadu 320.88 904.92 589.35 912.37 Tripura 247.2 944.16 441.69 1410.82 Uttar Pradesh 264.84 862.44 558.01 567.88 West Bengal 266.76 1063.2 558.14 691.82 * estimated using distribution of sample persons between rural and urban areas as the weights. Source: Same as Table 7 and MHRD (a, b)
32
Table 9 Household Expenditure on Education per student per annum 1995‐96
Quintiles Primary Middle Secondary/Hr Secondary
Above Hr Secondary
All Levels
Rural 00‐20 140 337 687 1334 218 20‐40 197 435 819 1508 321 40‐60 239 526 843 1450 406 60‐80 327 624 1045 1915 573 80‐100 653 974 1597 2696 1114 All 297 640 1180 2294 570 Urban 00‐20 347 566 868 1364 480 20‐40 633 826 1140 1711 816 40‐60 1000 1122 1430 1964 1192 60‐80 1540 1619 2008 2403 1774 80‐100 3060 3291 3919 4370 3647 All 1149 1529 2219 3304 1686 Rural + Urban 00‐20 197 426 768 1353 300 20‐40 306 575 961 1645 472 40‐60 419 726 1096 1810 647 60‐80 598 900 1424 2220 923 80‐100 1150 1547 2322 3694 1836 All 501 915 1577 2923 904 Source: NSSO (1998b).
33
Table 10 Average Annual Household Expenditure per student of age 5‐24 years pursuing
general education by level of education and type of institutions
Level of education Type of Institution
All GovtLocal body
Private aided
Private unaided
Primary 257 338 1181 1424 501Middle 622 726 1346 2156 915Secondary/Higher Secondary 1236 1349 1861 3061 1577Higher education 2559 2415 3143 5296 2923All 580 628 1615 1904 904Source: Tilak (2000), based on NSSO (1998b).
34
Table 11 Household Expenditure on Education on various items per student per annum,
1995‐96
Primary Middle
Secondary/ Higher
Secondary
Above Higher
Secondary
All Levels (Average)
Rural Tuition Fee 31 36 73 375 47Exam fee 8 20 61 162 23Other fee & payments 21 41 79 252 10Books 50 134 249 429 111Stationery 52 112 174 251 91Uniform 82 170 212 101 125Transport 11 18 87 395 34Private Coaching 23 71 182 154 64Other expenses 19 38 64 175 34Total 297 640 1180 2294 570Urban Tuition Fee 318 316 397 931 389Exam fee 21 32 73 181 50Other fee & payments 96 116 150 334 134Books 122 195 310 552 222Stationery 101 157 217 313 161Uniform 231 306 307 74 255Transport 93 97 114 325 119Private Coaching 125 245 560 400 284Other expenses 42 59 91 194 71Total 1149 1529 2219 3304 1686Rural + Urban Tuition Fee 97 123 220 745 149Exam fee 11 24 62 171 29Other fee & payments 38 62 112 333 67Books 66 152 271 495 137Stationery 63 128 193 317 110Uniform 121 227 273 108 171Transport 30 44 101 353 58Private Coaching 43 123 313 296 117Other expenses 24 43 75 177 42Total 494 933 1619 2995 882Source: Tilak (2000), based on NSSO (1998b).
35
Table 12 Average Annual Expenditure (Rs.) per Student in General
Education by Item of Expenditure and by Type of Institution Type of institution
Item of Expenditure Govt & Local Body
Govt. Aided
Private All
Tuition fee 35 303 678 149 Exam fee 24 51 51 31 Other fees & payments 39 137 154 68 Books 114 228 216 145 Stationary 93 166 148 112 Uniform 130 238 274 164 Transport 30 137 134 59 Private coaching 84 284 186 130 Other expenses 37 71 63 45 Total 585 1615 1904 904 Source: Tilak (2000) based on NSSO (1998b).
36
Table 13
Monthly Per Capita Expenditure on Education ‐‐‐‐‐‐‐‐‐‐‐‐‐‐‐‐‐‐‐‐‐‐‐‐‐‐‐‐‐‐‐‐‐‐‐‐‐‐‐‐‐‐‐‐‐‐‐‐‐‐‐‐‐‐‐‐‐‐‐‐‐‐‐‐‐‐‐‐‐‐‐‐‐‐‐‐‐‐‐‐‐‐‐‐‐‐‐‐‐‐‐‐‐‐‐‐‐‐‐‐‐‐‐‐‐‐‐‐‐‐‐‐‐‐‐‐‐ Population Group All Groups of
Population ‐‐‐‐‐‐‐‐‐‐‐‐‐‐‐‐‐‐‐‐‐‐‐‐‐‐‐‐‐‐‐‐‐‐‐‐‐‐‐‐‐‐‐‐‐‐‐‐‐‐‐‐‐‐‐‐‐‐‐‐‐‐‐‐‐‐‐‐‐‐‐‐‐‐‐‐‐‐‐‐‐‐‐‐‐‐‐‐‐‐‐‐‐‐‐‐‐‐‐‐‐‐‐‐‐‐‐‐‐‐‐‐‐‐‐‐‐
All Levels of Education
1. NAS (2007‐08) Rs.36.42 2. NSS (61st round) (Sengupta): ‘Extremely Poor All & Poor’ 2004‐05 Rs. 6.10 Rs.32.67 2007‐08* Rs. 6.99 Rs. 37.44 3. NSS (63rd round) ‘Poor’ All 2006‐07 Rural Rs.4.64 Rs.22.16 2007‐08* Rural Rs. 4.87 Rs.23.24 2006‐07 Urban Rs. 14.47 Rs.91.60 2007‐08* Urban Rs.15.17 Rs.96.07 4. NSS (1995‐96) 52nd round on Education (Bottom Quintile) All a) All levels of education 2007‐08* Rural Rs.18.87 Rs.49.33 Urban Rs.38.09 Rs.133.80 b) Elementary Education 2007‐08* Rural Rs.20.64 Rs.40.55 Urban Rs.36.23 Rs.106.26 Note: * estimated based the actual figures adjusted for increase in prices, based on GDP
deflators. 1. ‘Total private final consumption expenditure on education’ in a year (in Rs Crore) given in
the NAS is converted into per capita and per month. 2. The ‘extremely poor and poor’ in Sengupta et al’s study refers to the population below the
poverty line. 3. The ‘poor’ in the 63rd round is a close approximation to the population below the poverty
line. The poverty line is updated to the 2007‐08 level, by considering the GDP deflators. 4. Expenditure on elementary education (1995‐96) is a simple average of expenditure
incurred on primary and middle levels of education. Further, the original estimates refer to expenditure per student. They are converted into per capita terms, assuming a household size of 4.8 in rural areas and 4.3 in rural areas [base: NSS 63rd round) (with two adults in each house; others going to school).
37
Table 14
Monthly Average per Capita Expenditure on Education, 2007‐08 (Rs)
Rural Urban Andhra Pradesh 22.96 114.42Assam 31.77 78.12Bihar 11.80 54.39Jharkhand 17.57 86.33Gujarat* 14.91 74.12Haryana 79.16 155.41Himachal Pradesh 45.21 127.78Jammu & Kashmir 50.14 105.78Karnataka 19.75 68.61Kerala 52.05 86.60Madhya Pradesh* 8.52 69.21Chhattisgarh 8.16 86.34Maharashtra* 16.09 121.57Orissa 9.70 68.48Punjab 63.25 141.55Rajasthan 22.43 88.06Tamil Nadu 28.09 79.22Tripura* 20.6 78.68Uttar Pradesh* 22.07 71.87West Bengal* 22.23 88.6Source: Based on NSSO (2008b) Figures for 2006‐07 are inflated to 2007‐08 level by using GSDP deflators * 2006‐07
38
References
Becker, Gary S. (1964) Human Capital. New York: National Bureau of Economic Research.
Central Statistical Organisation (2008) National Accounts Statistics 1950‐51 to 1999‐2000. New Delhi: Department of Statistics. [www.mospi.nic.in]
Central Statistical Organisation (2009) Important Statements of NAS 2009. New Delhi: Department of Statistics. [www.mospi.nic.in/nas_2009_10feb09.pdf]
Dev, S Mahendra and C. Ravi (2008) Revising Estimates of Poverty, Economic and Political Weekly (March 8): 8‐10.
McMahon, W.W. (1999) Education and Development: Measuring the Social Benefits, Clarendon Press/Oxford University Press, Oxford
Mehrotra, Santosh (ed.) (2005) The Economics of Elementary Education: The Challenge of Public Finance, Private Provision and Household Costs. New Delhi: Sage,
Mehrtora, S., P.R. Panchamukhi, Ranjana Srivastava and Ravi Srivastava (2005) Universalizing Elementary Education in India: Uncaging the ‘Tiger’ Economy. New Delhi: Oxford.
MHRD [a] (various years) Analysis of Budgeted Expenditure on Education in India. New Delhi: Department of Education, Government of India.
MHRD [b] (various years) Selected Educational Statistics in Iiida. New Delhi: Department of Education, Government of India.
Mincer, Jacob (1972) Education, Experience and Earnings. New York: National Bureau of Economic Research
Minhas, B.S. (1992) Educational Deprivation and its Role as a Spoiler of Access to Better Life in India, in: The Quality of Life (eds. A Dutta and M.M. Agrawal), Shimla: Indian Institute of Advanced Study/B.R. Publishing Co., pp. 81‐98.
Noor, A. (1980) Education and Basic Needs. Staff working paper no. 450. Washington D.C.
NSSO (1998a) Household Consumer Expenditure and Employment Situation in India 1995‐96 (NSS 52nd Round). New Delhi: National Sample Survey Organisation.
NSSO (1998b) Attending an Educational Institution in India: Its Level, Nature and Cost (NSS 52nd Round 1996‐97) [Report no. 439]. New Delhi: Government of India.
NSSO (2006) Status of Education and Vocational Training in India 2004‐05. (NSS 61st Round) Report No. 517. New Delhi: National Sample Survey Organisation.
NSSO (2008a) Household Consumer Expenditure in India, 2005‐06. (NSS 62nd Round). Report No. 523. New Delhi: National Sample Survey Organisation.
NSSO (2008b) Household Consumer Expenditure in India, 2006‐07. (NSS 63rd Round). Report No. 527. New Delhi: National Sample Survey Organisation.
Panchamukhi, P.R. (1990) Private Expenditure on Education in India: An Empirical Study. Pune: Indian Institute of Education (unpublished).
Planning Commission (1993) Report of the Expert Group on Estimation of Proportion and
39
Number of Poor. New Delhi: Government of India.
Planning Commission (2007) Poverty Estimates for 2004‐05. New Delhi: Press Information Bureau.
Schultz, Theodore W. (1961) Investment in Human Capital, American Economic Review 51 (1) March: 1‐15.
Sen, A.K. (1999) Development as Freedom. New Delhi: Oxford University Press.
Speth, James Gustave (1998) Poverty: A Denial of Human Rights, Journal of International Affairs 52 (1) (Fall): 277‐92.
Tilak, J.B.G. (1989) Education and Basic Needs, in: Human Resource Development for Rural Development (eds. M K Rao and P P Sharma) Bombay: Himalaya, pp. 47‐67.
Tilak, J.B.G. (1996) How Free is ʹFreeʹ Primary Education in India? Economic and Political Weekly 31 (5 & 6) (3 & 10 February): 275‐82; and 355‐66.
Tilak, J.B.G. (1999) Investment in Human Capital in India: An Inter‐State Analysis of Stock and Flow of Human Capital, Journal of Indian School of Political Economy 11 (January‐March): 39‐75
Tilak, J.B.G. (2000) Household Expenditure on Education in India: A Preliminary Examination of the 52nd Round of the National Sample Survey. New Delhi: National Institute of Educational Planning and Administration
Tilak, J.B.G. (2001) Household Expenditure on Education in India: A Few Stylized Facts, in Social and Economic Security in India (eds. S. M. Dev, P. Antony, V. Gayathri and R.P. Mamgain). New Delhi: Institute for Human Development, pp. 191‐218.
Tilak, J.B.G. (2002a) Education Poverty in India, Review of Development and Change 7 (1) (January‐June): 1‐44
Tilak, J.B.G. (2002b) Education and Poverty, Journal of Human Development 3 (2) (July): 191‐207
Tilak, J.B.G. (2002c) Determinants of Household Expenditure on Education in Rural India: A Study based on the NCAER Survey on Human Development in India. Working Paper No. 88, New Delhi: National Council of Applied Economic Research[http://www.ncaer.org/WP88.pdf]
Tilak, J.B.G. (2003) State, Households and Markets in Education: Government’s Unwillingness and Households’ Compulsion to Pay for Education vis‐à‐vis the Exploitative Markets, Review of Development and Change 8 (2) (July‐December): 115‐44
Tilak, J.B.G., and R. Sudarshan (2001) Private Schooling in Rural India, Working Paper No. 76. New Delhi: National Council of Applied Economic Research (October 2001)
UNDP (1996, 1997) Human Development Report. New York: Oxford University Press.
World Bank (1994) Poverty Reduction in South Asia. Washington DC.
Tilak/Education and Poverty Line/ May 2009