hot mix plant report - **hot mix asphalt plants emission assessment report**
TRANSCRIPT

United States
Environmental Protection
Agency
Office Of Air Quality
Planning And Standards
Research Triangle Park, NC 27711
EPA-454/R-00-019
December 2000
Air
HOT MIX ASPHALT PLANTS
EMISSION ASSESSMENT REPORT

This page intentionally left blank.

EPA 454/R-00-019
HOT MIX ASPHALT PLANTS
EMISSION ASSESSMENT REPORT
This document was prepared by:
Emissions Monitoring and Analysis Division Office of Air Quality Planning and Standards
United States Environmental Protection Agency
Research Triangle Park, NC
and under contract, by:
Midwest Research Institute Kansas City, MO and Cary, NC
EPA Contract Number 68D-98-027
and
Eastern Research Group, Inc.
1600 Perimeter Park
P.O. Box 2010
Moorisville, NC
EPA Contract Number 68-D7-0068
U.S. ENVIRONMENTAL PROTECTION AGENCY Office of Air and Radiation
Office of Air Quality Planning and Standards Research Triangle Park, North Carolina 27711
December 2000

This page intentionally left blank.
ii

DISCLAIMER
The information in this document has been funded by the Office of Air Quality Planning and
Standards, U.S. Environmental Protection Agency (EPA) under contract 68-D-98-027 to Midwest
Research Institute and under contract 68-D-70-068 to Eastern Research Group, Inc. The EPA has made additions and revisions to the information submitted by the contractors. This final report has been subjected
to the Agency’s review, and it has been approved for publication as an EPA document. Mention of trade
names or commercial products is not intended to constitute endorsement or recommendation for use.
iii

Document Title EPA Document
Number
Publication
Date
Hot Mix Asphalt Plants
Emission Assessment Report EPA 454/R-00-019 December 2000
Hot Mix Asphalt Plants
Kiln Dryer Stack Instrumental Methods Testing
Asphalt Plant A, Cary, North Carolina EPA 454/R-00-020 April 2000
Hot Mix Asphalt Plants
Kiln Dryer Stack Manual Methods Testing Asphalt Plant A, Cary, North Carolina
Volume 1 of 2
Volume 2 of 2
EPA 454/R-00-021a
EPA 454/R-00-021b
April 2000
April 2000
Hot Mix Asphalt Plants
Kiln Dryer Stack Instrumental Methods Testing
Asphalt Plant B, Clayton, North Carolina EPA 454/R-00-022 April 2000
Hot Mix Asphalt Plants
Kiln Dryer Stack Manual Methods Testing Asphalt Plant B, Clayton, North Carolina
Volume 1 of 2
Volume 2 of 2
EPA 454/R-00-023a
EPA 454/R-00-023b
April 2000
April 2000
Hot Mix Asphalt Plants
Truck Loading and Silo Fillin g Instrumen ta l Methods Testing
Asphalt Plant C, Los Angeles, California
EPA 454/R-00-024 May 2000
Hot Mix Asphalt Plants
Truck Loading and Silo Filling Manual Methods Testing Asphalt Plant C, Los Angeles, California
Volume 1 of 8
Volume 2 of 8
Volume 3 of 8
Volume 4 of 8
Volume 5 of 8
Volume 6 of 8
Volume 7 of 8
Volume 8 of 8
EPA 454/R-00-025a
EPA 454/R-00-025b
EPA 454/R-00-025c
EPA 454/R-00-025d
EPA 454/R-00-025e
EPA 454/R-00-025f
EPA 454/R-00-025g
EPA 454/R-00-025h
May 2000
May 2000
May 2000
May 2000
May 2000
May 2000
May 2000
May 2000
Hot Mix Asphalt Plants
Technical Systems Audit of Testing at Asphalt Plant C
Asphalt Plant C, Los Angeles, California EPA 454/R-00-026 May 2000
PREFACE
This report was produced by the Source Measurement Technology Group of EPA’s Emissions Measurement Center located in Research Triangle Park, NC. It is one of a series of twelve reports prepared to document an EPA program to characterize emissions to the air from hot mix asphalt plants.
These twelve reports and their associated EPA document numbers and publication dates are:
iv

Document Title EPA Document
Number
Publication
Date
Hot Mix Asphalt Plants
Truck Loading Instrumental Methods Testing Asphalt Plant D, Barre, Massachusetts
EPA 454/R-00-027 May 2000
Hot Mix Asphalt Plants
Truck Loading Manual Methods Testing
Asphalt Plant D, Barre, Massachusetts EPA 454/R-00-028 May 2000
Hot Mix Asphalt Plants
Response to Comments on Testing Program for Asphalt Plants C and D
EPA 454/R-00-029 May 2000
Hot Mix Asphalt Plants
Stakeholders Opinions Report EPA 454/R-00-030
These documents, including this Emissions Assessment Report document, are available for downloading, on CD-ROM and in paper.
Downloads can be made from:
http//www.epa.gov/ttn/emc/asphalt.html
Copies of the CD ROM can be requested by mail at:
Emission Measurement Center, MD-19
US Environmental Protection Agency Research Triangle Park, NC 27711
Paper copies of the reports can be obtained from:
National Technical Information Service
5285 Port Royal Road
Springfield, VA 22161
Phone orders 1-800-553-6847 or (703) 605-6000; FAX orders (703) 605-6900 http://www.ntis.gov/products/environment.htm
v

ACKNOWLEDGMENTS
Many individuals contributed to the development of this report. Ron Myers of the Emission
Measurement Center’s Source Measurement Technology Group (SMTG), Brian Shrager, Scott Klamm,
Richard Marinshaw, and Amy Marshall of Midwest Research Institute (MRI), are the primary authors of the report. Bob McConnell of EPA’s Region I office, David Mobley, Acting Director of EPA’s Emissions
Monitoring and Analysis Division, Bill Lamason, Mike Toney, Gary McAlister, and Candace Sorrell of
EPA’s Emission Measurement Center, Ron Ryan and Dennis Beauregard of EPA’s Emission Factor and Inventory Group, Laura Autry of EPA’s Air Quality Trends Analysis Group, participated in the review.
We also acknowledge the contributions of numerous reviewers and advisors from PES, MRI and EPA.
vi

TABLE OF CONTENTS
Page
1. EXECUTIVE SUMMARY . . . . . . . . . . . . . . . . . . . . . . . . . . . . . . . . . . . . . . . . . . . . . . . . . . . . . . . .
1.1 INTRODU CTION . . . . . . . . . . . . . . . . . . . . . . . . . . . . . . . . . . . . . . . . . . . . . . . . . . . . . . . . . .
1.2 OVERVIEW OF HMA INDUSTR Y . . . . . . . . . . . . . . . . . . . . . . . . . . . . . . . . . . . . . . . . . . . . .
1.3 DEVELO PM ENT AND USE OF EMISSION FACTO RS FOR HMA FACILITIES . . . . . . . . 1.4 ESTIMATED ANNUAL EMISSIONS FROM TYPICAL HMA FACILITIES . . . . . . . . . . . . .
1 1
1
1 2
2. ASSESSMENT OF HOT MIX ASPHALT EMISSIONS . . . . . . . . . . . . . . . . . . . . . . . . . . . . . . . . . 9
2.1 INDUSTRY OVERVIEW AND PROCESS DESCRIPTION . . . . . . . . . . . . . . . . . . . . . . . . . . 9 2.1.1 Batch Mix Plants . . . . . . . . . . . . . . . . . . . . . . . . . . . . . . . . . . . . . . . . . . . . . . . . . . . . . . 9
2.1.2 Drum Mix Plants . . . . . . . . . . . . . . . . . . . . . . . . . . . . . . . . . . . . . . . . . . . . . . . . . . . . . 10 2.1.3 Recycle Processes . . . . . . . . . . . . . . . . . . . . . . . . . . . . . . . . . . . . . . . . . . . . . . . . . . . . . 10
2.1.4 Emissions and Controls . . . . . . . . . . . . . . . . . . . . . . . . . . . . . . . . . . . . . . . . . . . . . . . . . 11
2.2 EMISSION FACTOR DEVELOPMENT FOR AP-42 SECTION 11.1, HOT MIX ASPHALT PLANTS . . . . . . . . . . . . . . . . . . . . . . . . . . . . . . . . . . . . . . . . . . . . . . 11
2.2.1 Batch Mix and Drum Mix Dryers . . . . . . . . . . . . . . . . . . . . . . . . . . . . . . . . . . . . . . . . . 12 2.2.2 Hot Oil Heaters . . . . . . . . . . . . . . . . . . . . . . . . . . . . . . . . . . . . . . . . . . . . . . . . . . . . . . 13
2.2.3 Truck Load-Out . . . . . . . . . . . . . . . . . . . . . . . . . . . . . . . . . . . . . . . . . . . . . . . . . . . . . . 13 2.2.4 Silo Filling . . . . . . . . . . . . . . . . . . . . . . . . . . . . . . . . . . . . . . . . . . . . . . . . . . . . . . . . . . 14
2.2.5 Asphalt Storage Tanks . . . . . . . . . . . . . . . . . . . . . . . . . . . . . . . . . . . . . . . . . . . . . . . . . 14
2.2.6 Yard Emissions . . . . . . . . . . . . . . . . . . . . . . . . . . . . . . . . . . . . . . . . . . . . . . . . . . . . . . . 14 2.3 OTHER APPLICABLE AP-42 SECTIONS . . . . . . . . . . . . . . . . . . . . . . . . . . . . . . . . . . . . . . 15
2.4 EMISSION INVENTORY FOR TYPICAL HOT MIX ASPHALT PLANTS . . . . . . . . . . . . . 16 2.5 EMISSION ESTIMATES FOR TYPICAL HOT MIX ASPHALT PLANTS . . . . . . . . . . . . . 16
APPENDIX A
APPENDIX B
APPENDIX C
Number
AP-42 Section 11.1, Hot Mix Asphalt Plants, December 2000
Emission Factor Documentation for AP-42 Section 11.1, Hot Mix Asphalt Production, December 2000 Final Report
Chapter 3: Preferred and Alternative Methods for Estimating Air Emissions from Hot Mix Asphalt Plants. Emission Inventory Improvement Program (EIIP), July 1996.
LIST OF FIGURES
Page
1. General process flow diagram for batch mix asphalt plants . . . . . . . . . . . . . . . . . . . . . . . . . . . . . . . . 4 2. General process flow diagram for counter-flow drum mix asphalt plants . . . . . . . . . . . . . . . . . . . . . . 5
vii
LIST OF TABLES
Number
Page
1.
2.
3.
4.
5.
6.
7.
8.
9.
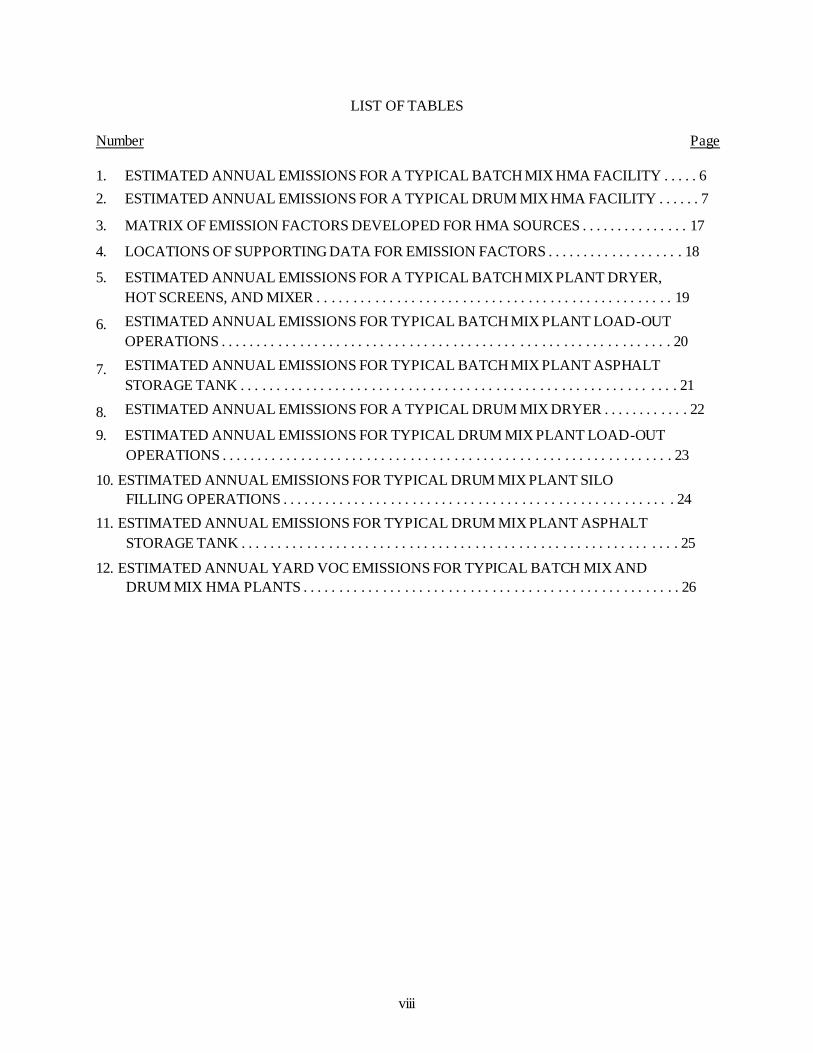
ESTIMATED ANNUAL EMISSIONS FOR A TYPICAL BATCH MIX HMA FACILITY . . . . . 6
ESTIMATED ANNUAL EMISSIONS FOR A TYPICAL DRUM MIX HMA FACILITY . . . . . . 7
MATRIX OF EMISSION FACTORS DEVELOPED FOR HMA SOURCES . . . . . . . . . . . . . . . 17
LOCATIONS OF SUPPORTING DATA FOR EMISSION FACTORS . . . . . . . . . . . . . . . . . . . 18
ESTIMATED ANNUAL EMISSIONS FOR A TYPICAL BATCH MIX PLANT DRYER,
HOT SCREENS, AND MIXER . . . . . . . . . . . . . . . . . . . . . . . . . . . . . . . . . . . . . . . . . . . . . . . . . 19
ESTIMATED ANNUAL EMISSIONS FOR TYPICAL BATCH MIX PLANT LOAD-OUT
OPERATIONS . . . . . . . . . . . . . . . . . . . . . . . . . . . . . . . . . . . . . . . . . . . . . . . . . . . . . . . . . . . . . . 20
ESTIMATED ANNUAL EMISSIONS FOR TYPICAL BATCH MIX PLANT ASPHALT
STORAGE TANK . . . . . . . . . . . . . . . . . . . . . . . . . . . . . . . . . . . . . . . . . . . . . . . . . . . . . . . . . . . . 21
ESTIMATED ANNUAL EMISSIONS FOR A TYPICAL DRUM MIX DRYER . . . . . . . . . . . . 22
ESTIMATED ANNUAL EMISSIONS FOR TYPICAL DRUM MIX PLANT LOAD-OUT
OPERATIONS . . . . . . . . . . . . . . . . . . . . . . . . . . . . . . . . . . . . . . . . . . . . . . . . . . . . . . . . . . . . . . 23
10. ESTIMATED ANNUAL EMISSIONS FOR TYPICAL DRUM MIX PLANT SILO
FILLING OPERATIONS . . . . . . . . . . . . . . . . . . . . . . . . . . . . . . . . . . . . . . . . . . . . . . . . . . . . . . 24
11. ESTIMATED ANNUAL EMISSIONS FOR TYPICAL DRUM MIX PLANT ASPHALT
STORAGE TANK . . . . . . . . . . . . . . . . . . . . . . . . . . . . . . . . . . . . . . . . . . . . . . . . . . . . . . . . . . . . 25
12. ESTIMATED ANNUAL YARD VOC EMISSIONS FOR TYPICAL BATCH MIX AND
DRUM MIX HMA PLANTS . . . . . . . . . . . . . . . . . . . . . . . . . . . . . . . . . . . . . . . . . . . . . . . . . . . . 26
viii

LIST OF ACRONYMS
ASTM Btu
CH4 CO
CO2 EPA HAP
HMA
NOx PAH PM PM-10
PM-2.5 RAP
RTFOT
SCC
SO2
SOx TOC VOC
American Society of Testing and Materials British thermal unit methane
carbon monoxide (as measured by EPA Method 10)
carbon dioxide (as measured by EPA Method 3) Environmental Protection Agency
hazardous air pollutant (listed in or pursuant to section 112(b) of the 1990 Clean Air Act Amendments)
hot mix asphalt nitrogen oxides (as measured by EPA Method 7)
polycyclic aromatic hydrocarbon (a class of HAPs) particulate matter (as measured by EPA Methods 5 or 17)
particulate matter less than 10 microns in diameter
particulate matter less than 2.5 microns in diameter reclaimed asphalt pavement
rolling thin film oven test (ASTM Method D2872-88) source classification code
sulfur dioxide (as measured by EPA Methods 6 or 8) sulfur oxides
total organic compounds (as measured by EPA Method 25A)
volatile organic compound (refer to 40 CFR 51.100); VOC is TOC plus formaldehyde, less methane, ethane, acetone, and other chemicals listed as negligibly photochemically reactive.
ix

This page intentionally left blank.
x
1. EXECUTIVE SUMMARY
1.1 INTRODUCTION
This report presents an assessment of emissions from hot mix asphalt (HMA) manufacturing
facilities. Included in the report is a description of the manufacturing process and the emissions associated
with HMA production; the procedures for developing emission factors and emission inventories for the
HMA industry; and estimated annual emissions for typical HMA facilities.
1.2 OVERVIEW OF HMA INDUSTRY
Hot mix asphalt is used primarily as paving material and consists of a mixture of aggregate and
liquid asphalt cement, which are heated and mixed in measured quantities. Hot mix asphalt facilities can be
broadly classified as either drum mix plants or batch mix plants, according to the process by which the raw materials are mixed. In a batch mix plant, the aggregate is dried first, then transferred to a mixer where it
is mixed with the liquid asphalt. In a drum mix plant, a rotary dryer serves to dry the aggregate and mix it
with the liquid asphalt cement. After mixing, the HMA generally is transferred to a storage bin or silo, where it is stored temporarily. From the silo, the HMA is emptied into haul trucks, which transport the
material to the job site. Figure 1 presents a diagram of a typical batch mix HMA plant; a typical drum mix HMA plant is depicted in Figure 2.
In 1996, approximately 500 million tons of HMA were produced at the 3,600 (estimated) active
asphalt plants in the United States. Of these 3,600 plants, approximately 2,300 are batch plants, and
1,300 are drum mix plants. The total 1996 HMA production from batch and drum mix plants is estimated at about 240 million tons and 260 million tons, respectively. Based on these figures, an average batch mix
plant produces approximately 100,000 tons of HMA annually, and an average drum mix plant produces about 200,000 tons of HMA per year. Natural gas fuel is used to produce 70 to 90 percent of the HMA.
The remainder of the HMA is produced using oil, propane, waste oil, or other fuels.
The primary emission sources associated with HMA production are the dryers, hot bins, and
mixers, which emit particulate matter (PM) and a variety of gaseous pollutants. Other emission sources found at HMA plants include storage silos, which temporarily hold the HMA; truck load-out operations, in
which the HMA is loaded into trucks for hauling to the job site; liquid asphalt storage tanks; hot oil heaters, which are used to heat the asphalt storage tanks; and yard emissions, which consist of fugitive
emissions from the HMA in truck beds. Emissions also result from vehicular traffic on paved and unpaved
roads, aggregate storage and handling operations, and vehicle exhaust.
The PM emissions associated with HMA production include the criteria pollutants PM-10 (PM
less than 10 micrometers in aerodynamic diameter) and PM-2.5, hazardous air pollutant (HAP) metals, and
HAP organic compounds. The gaseous emissions associated with HMA production include the criteria
pollutants sulfur dioxide (SO2), nitrogen oxides (NOx), carbon monoxide (CO), and volatile organic compounds (VOC), as well as volatile HAP organic compounds.
1.3 DEVELOPMENT AND USE OF EMISSION FACTORS FOR HMA FACILITIES
An emission factor relates the quantity (weight) of pollutants emitted to a unit of activity of the
source. Emission factors for the HMA industry are generally determined in units of pounds of pollutant emitted per ton of HMA produced. These emission factors typically are used to estimate area-wide
1

emissions for a large number of facilities and emissions for specific facilities where source-specific emissions data are not available or where source testing is cost prohibitive.
To develop emission factors for the HMA industry, data from more than 390 emission test reports
and other documents on the industry were compiled and reviewed. Through a careful screening process, the documents that were determined to be unusable for emission factor development were excluded from
further evaluation. The remaining reports were compiled by plant type, emission source, pollutant, and
emission control. For each emission test, emission factors were calculated by dividing the measured emission rates by the HMA production rate measured at the time of the emission test. These emission
factors were then grouped by source, pollutant, and control device, and an average emission factor was calculated for each group.
Emission factors can be used to estimate emissions from one or more HMA facilities by
multiplying the emission factor by the HMA production rate. For example, the emission factor for CO emissions from a natural gas-fired drum mix dryer is 0.13 pounds per ton (lb/ton). If the dryer produces
200,000 tons per year (ton/yr), the estimated CO emissions during that period would be: 200,000 ton/yr ×
0.13 lb/ton = 26,000 lb/yr or 13 tons/yr.
1.4 ESTIMATED ANNUAL EMISSIONS FROM TYPICAL HMA FACILITIES
Annual emissions for a facility can be estimated by summing up the emissions from each emission
source over the course of a year. Annual emissions for a specific source can be estimated by multiplying
the annual throughput or production rate for that source by its corresponding emission factors. For an
HMA facility, annual emissions can be estimated by multiplying the annual HMA production rate by the emission factors for each type of source at the facility. Table 1 summarizes annual emissions for a typical
HMA batch mix plant, and Table 2 summarizes annual emissions for a typical drum mix HMA plant. The estimates presented in these tables account for all of the identified emission sources at each type of facility.
For both batch mix plants (Table 1) and drum mix plants (Table 2), the estimate includes emissions from the dryer/mixer, load-out operations, asphalt storage, yard (fugitive emissions from loaded trucks), diesel
exhaust, paved and unpaved road dust, and aggregate processing (screening, conveyor transfer, and
reclaimed asphalt pavement [RAP] crushing). Additionally, for the drum mix plant (Table 2), the estimate includes emissions from silo filling operations. Estimates are presented for criteria pollutants (pollutants
for which national ambient air quality standards have been developed) and hazardous air pollutants (HAPs, as defined in section 112(b) of the 1990 Clean Air Act Amendments). Criteria pollutants include PM-10,
VOC, CO, SO2, and NOx. Emissions for three classes of HAPs are presented in Tables 1 and 2: polycyclic aromatic hydrocarbons (PAHs), volatile organic HAPs, and metal HAPs. The emissions were estimated using the emission factors developed for the HMA industry and the following assumptions:
·
· ·
·
· ·
Dryers are fueled with natural gas or No. 2 fuel oil (estimates are presented for both types). It is estimated that between 70 and 90 percent of HMA plants use natural gas, although some HMA plants use fuel oil as an alternative to natural gas.
Dryer emissions are controlled with fabric filters. PM emissions from load-out and silo filling are entirely PM-10.
Annual HMA production rate for a typical batch mix plant is 100,000 ton/yr.
Annual HMA production rate for a typical drum mix plant is 200,000 ton/yr. The typical HMA plant has two 18,000-gallon asphalt storage tanks.
As indicated in Table 1, a typical batch mix plant using a No. 2 fuel oil-fired dryer emits over
74,000 lb/yr of criteria pollutants, and a typical batch mix plant using a natural gas-fired dryer emits over
2

56,000 lb/yr of criteria pollutants, of which approximately 41,000 lb/yr are CO and approximately 10,700 lb/yr are PM-10; emissions of other criteria pollutants range from about 500 to about 12,000 lb/yr.
The same plant would emit about 770 lb/yr of HAPs. A typical drum mix plant using a No. 2 fuel oil-fired dryer emits about 83,000 lb/yr of criteria pollutants, and a typical drum mix plant using a natural gas-fired
dryer emits around 75,000 lb/yr of criteria pollutants, of which approximately 28,000 lb/yr are CO, about 10,000 lb/yr are VOC, and around 31,000 lb/yr are PM-10. A typical drum mix plant emits from 1,300 to
2,000 lb/yr of HAPs, depending on the fuel used in the dryer.
3

4
Figure 1. General process flow diagram for batch mix asphalt plants (source classification codes in parentheses).

5
Figure 2. General process flow diagram for counter-flow drum mix asphalt plants (source classification codes in parentheses).

Pollutant
Annual emissions by source, pounds per year
Mobile
sources
(diesel
exhaust)
Material
handling
and road
dust
No. 2 fuel oil-
fired dryer,
hot screens, b
and mixer
Natural gas-
fired dryer,
hot screens, c
and mixer
Load-
d out
Asphalt
e Storage
f
Yard
g
Total (oil-
fired)
g
Total (gas-
fired)
Criteria air pollutants
Particulate matter less than
10 micrometers (PM-10)
Volatile organic compounds (VOC)
Carbon monoxide (CO)
Sulfur dioxide (SO2)
Nitrogen oxides (NOx)
46
100
700
22
380
7,900 2,700
820
40,000
8,800
12,000
2,700
820
40,000
460
2,500
52
391
135
32
3
110
35
10,700
1,500
41,000
8,800
12,400
10,700
1,500
41,000
480
2,900
Hazardous air pollutants (HAPs)
Polycyclic aromatic hydrocarbons
(PAHs)
Phenol
Volatile HAPs
Metal HAPs
g
Total HAPs
0.035
1.9
1.9
11
751
1.4
760
11
751
1.4
760
2.0
0.40
6.2
8.6
0.12
140
140
1.6
1.6
13
0.40
760
1.4
770
13
0.40
760
1.4
770
6
TABLE 1. ESTIMATED ANNUAL EMISSIONS FOR A TYPICAL BATCH MIX HMA FACILITYa
a
b
c
d
e
f
g
Based on an annual HMA production rate of 100,000 tons per year. Between 10 and 30 percent of the HMA is produced using fuel oil.
Between 70 and 90 percent of the HMA is produced using natural gas.
Loading of HMA into haul trucks.
Includes emissions from oil-fired hot oil heaters.
Fugitive emissions from loaded trucks prior to departure to the job site.
Total expressed using two significant figures.

Pollutant
Annual emissions by source, pounds per year
Mobile
sources
(diesel
exhaust)
Material
handling
and road
dust
No. 2
fuel oil-
fired b
dryer
Natural
gas-fired c
dryer
Load-
d out
Silo
e filling
Asphalt
f storage
g
Yard
h
Total (oil-
fired)
h
Total (gas-
fired)
Criteria air pollutants
Particulate matter less than
10 micrometers (PM-10)
Volatile organic compounds (VOC)
Carbon monoxide (CO)
Sulfur dioxide (SO2)
Nitrogen oxides (NOx)
220
190
1,200
26
560
26,000 4,600
6,400
26,000
2,200
11,000
4,600
6,400
26,000
680
5,200
104
782
270
117
2,440
236
64
6
220
72
31,000
10,000
28,000
2,200
12,000
31,000
10,000
28,000
710
5,800
Hazardous air pollutants (HAPs)
Polycyclic aromatic hydrocarbons
(PAHs)
Phenol
Volatile HAPs
Metal HAPs
h
Total HAPs
0.13
6.6
6.7
176
1,560
19
1,800
37
1,020
16
1,100
4.0
0.80
12.4
17
5.8
31
37
0.12
140
140
3.3
3.3
190
0.80
1,800
19
2,000
50
0.80
1,200
16
1,300
7
TABLE 2. ESTIMATED ANNUAL EMISSIONS FOR A TYPICAL DRUM MIX HMA FACILITYa
a
b
c
d
e
f
g
h
Based on an annual HMA production rate of 200,000 tons per year. Between 10 and 30 percent of the HMA is produced using fuel oil.
Between 70 and 90 percent of the HMA is produced using natural gas.
Loading of HMA into haul trucks
Filling of temporary storage silo prior to load-out.
Includes emissions from oil-fired hot oil heaters.
Fugitive emissions from loaded trucks prior to departure to the job site.
Total expressed using two significant figures.

This page intentionally left blank.
8

2. ASSESSMENT OF HOT MIX ASPHALT EMISSIONS
This section presents the results of an assessment of emissions from HMA manufacturing. An
overview of the HMA industry and process operations is provided first (Section 2.1). Section 2.2
summarizes the methodology used to develop emission factors for the HMA industry. Section 2.3 identifies other sections of AP-42 that apply to HMA plants. An overview of the process for conducting an emission
inventory is presented in Section 2.4, and Section 2.5 presents estimates of annual emissions from typical
HMA facilities.
2.1 INDUSTRY OVERVIEW AND PROCESS DESCRIPTION1
Hot mix asphalt paving materials are a mixture of well-graded, high-quality aggregate and liquid
asphalt cement, which is heated and mixed in measured quantities. The aggregate often includes RAP.
Aggregate and RAP (if used) constitute over 92 percent by weight of the total mixture. Aside from the amount and grade of asphalt cement used, mix characteristics are determined by the relative amounts and
types of aggregate and RAP used. A certain percentage of fine aggregate (less than 74 micrometers [Fm] in
physical diameter) is required for the production of good quality HMA.
Hot mix asphalt plants can be classified by their mixing operation as one of the following:
(1) batch mix plants, (2) continuous mix (mix outside dryer drum) plants, (3) parallel flow drum mix
plants, and (4) counterflow drum mix plants. An HMA plant can be constructed as a permanent plant, a skid-mounted (easily relocated) plant, or a portable plant. All plants can have RAP processing capabilities.
In 1996, approximately 500 million tons of HMA were produced at the 3,600 (estimated) active
asphalt plants in the United States. Of these 3,600 plants, approximately 2,300 are batch plants, 1,000 are
parallel flow drum mix plants, and 300 are counterflow drum mix plants. The total 1996 HMA production from batch and drum mix plants is estimated at about 250 million tons and 260 million tons, respectively.
About 85 percent of new plants being constructed today are of the counterflow drum mix design, while batch plants and parallel flow drum mix plants account for 10 percent and 5 percent respectively.
Continuous mix plants represent a very small fraction of the plants in use (#0.5 percent) and, therefore, are
not discussed further. While most HMA plants have the capability to use both fuel oil and natural gas, it is estimated that between 70 and 90 percent of the HMA in the U. S. is produced using natural gas. The
process operations at typical batch mix and drum mix plants are described in the following paragraphs.
2.1.1 Batch Mix Plants2
Processing begins as the aggregate is hauled from onsite storage piles and is placed in the
appropriate hoppers of the cold feed unit. The material is metered from the hoppers onto a conveyer belt and is transported into a rotary dryer (typically gas- or oil-fired). As the hot aggregate leaves the dryer, it
drops into a bucket elevator, is transferred to a set of vibrating screens, then separated into as many as four different grades (sizes), and dropped into “hot” bins according to size. At newer facilities, RAP may be
transferred to a separate heated storage bin. At the same time, liquid asphalt cement is pumped from a heated storage tank to an asphalt bucket, where it is weighed to achieve the desired aggregate-to-asphalt
cement ratio in the final mix. To control the aggregate size distribution in the final batch mix, the operator
transfers material from various hot bins (and RAP bins, if used) to a weigh hopper until the desired mix
1 See Appendix A, Section 11.1.1, and Appendix B, Section 2.1, for more detailed information.
2 See Appendix A, Section 11.1.1.1, and Appendix B, Section 2.2.1, for more detailed information.
9

and weight are obtained. The aggregate from the weigh hopper is dropped into the mixer (pug mill) and dry-mixed for 6 to 10 seconds. The liquid asphalt is then dropped into the pug mill where it is mixed for an
additional period of time. At older plants, RAP typically is conveyed directly to the pug mill from a storage hopper and combined with the hot aggregate. Total mixing time usually is less than 60 seconds.
Then, the hot mix is conveyed to a hot storage silo or is dropped directly into a truck and hauled to the job site. Figure 1 depicts a typical batch mix plant.
2.1.2 Drum Mix Plants3
This process is a continuous mixing type process. The major difference between this process and
the batch process is that the dryer is used not only to dry the material but also to mix the heated and dried
aggregates with the liquid asphalt cement. In a parallel flow drum mixer, the aggregate is introduced to the drum at the burner end. As the drum rotates, the aggregate, as well as the combustion products from the
burner, move toward the other end of the drum in parallel. Liquid asphalt cement is introduced in the mixing zone midway down the drum in a lower temperature zone, along with any RAP and PM from
collectors. In a counterflow drum mixer, the material flow in the drum is opposite or counterflow to the
direction of exhaust gases. In addition, the liquid asphalt cement mixing zone is located behind the burner flame zone so as to remove the materials from direct contact with hot exhaust gases. After mixing, the
mixture is discharged at the end of the drum and is conveyed to either a surge bin or HMA storage silos. Figure 2 illustrates a counterflow drum mix plant.
In a parallel flow mixer, the exhaust gases also exit the end of the drum and pass on to the
collection system. Parallel flow drum mixers have an advantage, in that mixing in the discharge end of the
drum captures a substantial portion of the aggregate dust, therefore lowering the load on the downstream PM collection equipment. For this reason, most parallel flow drum mixers are followed only by primary
collection equipment (usually a baghouse or venturi scrubber). However, because the mixing of aggregate and liquid asphalt cement occurs in the hot combustion product flow, organic emissions (gaseous and liquid
aerosol) may be greater than in other processes.
Counterflow drum mix plants likely will have organic stack emissions (gaseous and liquid aerosol)
that are lower than parallel flow drum mix plants because the liquid asphalt cement, virgin aggregate, and RAP are mixed in a zone removed from the exhaust gas stream. A counterflow drum mix plant normally
can process RAP at ratios up to 50 percent with little or no observed effect upon emissions.
2.1.3 Recycle Processes4
Reclaimed asphalt pavement significantly reduces the amount of new aggregate and asphalt cement
needed to produce HMA. In the reclamation process, old asphalt pavement is removed from the road base. This material is then transported to the plant, and is crushed and screened to the appropriate size for further
processing. The paving material then is heated and mixed with new aggregate (if applicable), and the proper amount of new asphalt cement is added to produce HMA that meets the quality requirements of the
customer.
3 See Appendix A, Sections 11.1.1.2 and 11.1.1.3, and Appendix B, Sections 2.2.2 and 2.2.3, for more detailed information.
4 See Appendix A, Section 11.1.1.4, and Appendix B, Section 2.2.4, for more detailed information.
10

2.1.4 Emissions and Controls5
Hot mix asphalt plants have two major categories of emissions: ducted sources (those vented to the
atmosphere through some type of stack, vent, or pipe), and fugitive sources (those not confined to ducts and
vents but emitted directly from the source to the ambient air). Dryers are the most significant ducted sources of emissions from both batch mix and drum mix HMA plants. Emissions from these sources
consist of water (as steam evaporated from the aggregate); PM; products of combustion (carbon dioxide
[CO2], NOx, and sulfur oxides [SOx]); CO; and small amounts of organic compounds of various species
(including VOC, methane [CH4], and HAPs). The CO and organic compound emissions result from incomplete combustion of the fuel and also are released from the heated asphalt.
At batch mix plants, other potential process sources include the hot-side conveying, classifying,
and mixing equipment, which are vented to either the primary dust collector (along with the dryer gas) or to
a separate dust collection system. These emissions are mostly aggregate dust, but they also may contain gaseous organic compounds, CO, and a fine aerosol of condensed organic particles. This organic aerosol is
created by the condensation of gas into particles during cooling of organic vapors volatilized from the
asphalt cement in the mixer. The amount of organic aerosol produced depends to a large extent on the temperature of the asphalt cement and aggregate entering the mixer. Organic vapor and its associated
aerosol also are emitted directly to the atmosphere as process fugitives during truck load-out, from the bed of the truck itself during transport to the job site, and from the asphalt storage tank. Both the low
molecular weight organic compounds and the higher weight organic aerosol may contain small amounts of
HAP. The ducted emissions from the heated asphalt storage tanks may include gaseous and aerosol organic compounds and combustion products from the tank heater.
At most HMA facilities, fabric filters are used to control emissions from dryers. Other controls
used include mechanical collectors and scrubbers. Emissions from aggregate handling and transfer typically are controlled with fabric filters or scrubbers. Large diameter cyclones and settling chambers also
are used as product recovery devices. The material collected in those devices is recycled back into the
process.
There also are a number of fugitive dust sources associated with batch mix HMA plants, including
vehicular traffic generating fugitive dust on paved and unpaved roads, aggregate material handling, and
other aggregate processing operations.
2.2 EMISSION FACTOR DEVELOPMENT FOR AP-42 SECTION 11.1, HOT MIX ASPHALT
PLANTS
A detailed description of how the emission factors were developed for the HMA industry is
provided in Section 4 of Appendix B. The following paragraphs summarize the methodology used.
To develop emission factors for the HMA industry, data from about 390 emission test reports and
other documents on the industry were compiled and reviewed (a complete list of these references is
provided following Section 4 of Appendix B). The majority of these reports documented measurements of emissions from batch plant dryer/mixers and drum plant dryers. Through a careful screening process, 35
of the reports were determined to be unusable for emission factor development and were excluded from further evaluation. About 350 reports remained and were compiled by plant type, emission source,
pollutant, and emission control. These emission factors were then grouped by source, pollutant, and
5 See Appendix A, Section 11.1.2, and Appendix B, Section 2.3, for more detailed information.
11

control device, and an average emission factor was calculated for each group. Table 3 presents a matrix of all of the sources and pollutants for which emission factors are presented in AP-42 (Appendix A).
While the particulate, CO2, CO, and TOC emission factors are based on over 100 tests, most of the remaining criteria pollutant emission factors are based on between 5 and 10 tests. A few HAP emission factors are based on more than 5 tests, although the majority are based on between 2 and 5 tests. Information on the supporting data for specific emission factors and the quality rating assigned to the
emission factor is included in the section or table in Appendices A and B as indicated in Table 4. Column four of Table 4 references the tables in Appendix A that present the emission factors and quality ratings.
Column five of Table 4 references the paragraphs in Appendix B that discuss the basis for the emission factors developed for all of the sources and pollutants. Column six of Table 4 references the tables in
Appendix B that present the emission factors and the individual data used to develop the emission factors. Generally, the amount of supporting data is typical of many AP-42 sections. However, the amount of data
supporting the particulate, CO2, CO, and TOC emission factors is greater than most AP-42 sections. The following paragraphs summarize the procedures followed to develop the emission factors for HMA facilities.
2.2.1 Batch Mix and Drum Mix Dryers
The usable data on batch mix and drum mix plant dryer emissions were compiled according to
source type, emission control, and pollutant. Data on fuel types, the percentage of RAP used in the mix,
and the process operating rate (e.g., dryer production rate) also were recorded. The quality of the emission data was evaluated with respect to the level of documentation in the report, the test methods used, the
number of test runs, and any reported problems with the sampling procedures or the operation of the source during the test period. On the basis of this evaluation, data ratings of A, B, C, or D were assigned to each
data set. Specific procedures used to evaluate the data are specified in Procedures for Preparing Emission
Factor Documents (EPA-454/R-95-015).
For each emission test, an emission factor also was calculated for each pollutant sampled. These
test-specific emission factors then were grouped according to source type, emission control device,
pollutant, and, in the case of combustion sources, fuel type. At this stage in the process, D-rated data sets were discarded, provided there were higher quality data available for that particular group (i.e., that
specific combination of source, control, fuel, and pollutant). In addition, where there were data from multiple tests on the same specific emission source, the test-specific emission factors were averaged to yield
a source-specific emission factor. In subsequent calculations, this source-specific emission factor was used.
A statistical analysis of the data for batch and drum mix dryers was performed to determine the
effects of RAP content, fuel type, production rate on emissions of several pollutants. The analysis showed
no strong correlation between these parameters and emission factors. Details on the statistical analysis can be found in Section 4.3 of Appendix B.
To develop emission factors, the mean of the test-specific emission factors was calculated for each
of the emission factor groups discussed above. In some cases, the data for two or more groups were
combined and an overall mean emission factor was calculated. For example, if the data indicated that fuel type had no apparent effect on emissions of a specific pollutant, fuel type was ignored and all of the data
for that source type and pollutant were combined. The final step in developing emission factors is to assign a quality rating of A, B, C, D, or E. Quality ratings are a function primarily of the number of data points
12
from which a specific emission factor is calculated. Additional information on the rating system used is discussed in Section 3 of Appendix B.
2.2.2 Hot Oil Heaters
For hot oil heaters, only a single test report for an oil-fired hot oil heater was available. The report
was reviewed and the emission factors compiled using the procedures described previously. Appendix B,
Section 4.2.4.2, provides a detailed description of how these emission factors were developed. It should be noted that most hot oil heaters are gas-fired, and the emission factors developed from the available data
would not necessarily be representative of gas-fired heaters.
2.2.3 Truck Load-Out
Truck load-out emissions were developed from two emission tests sponsored by the U. S.
Environmental Protection Agency (EPA) (Appendix B References 355 and 356). In designing, performing and evaluating these two tests, EPA was involved with a number of groups. The groups included citizens,
State and local health agencies, State and local air pollution control agencies, and industry associations. These different groups provided input on the selection of facilities for emissions testing, the design of the
test program, reviewed the individual site-specific test plans, observed emissions testing, commented on the draft test reports and provided suggestions for analysis of the data to develop emission factors. The
procedures used to develop emission factors generally were the same as those described above. However,
additional steps were taken to ensure the quality and consistency of the data and the representativeness and universality of the emission factors developed from the data. For example, two quality assurance scientists
from Research Triangle Institute were employed to independently audit the test. These additional steps are summarized below. Detailed explanations of the methodology used are provided in Section 4.4 of
Appendix B.
At one of the facilities the sampling area was enclosed but did not meet EPA requirements for a
total enclosure. Consequently, the capture efficiency was quantitatively estimated and the data were corrected for capture efficiency.
At one facility, emissions due to diesel truck operation could not be segregated from emissions due
to truck load-out. Therefore, background concentrations also were sampled. To account for background levels of various pollutants emitted from truck operation, the as-measured background concentrations were
subtracted from the capture efficiency corrected load-out emission concentrations. For the most part,
values were treated as zero if the background concentration exceeded the capture-efficiency-adjusted run concentration.
Because the asphalt types and temperatures for the two facilities differed, adjustments also were
made to normalize the emission data. To account for differences in the volatility of the liquid asphalts used, samples of asphalt were collected during the emission tests and analyzed by ASTM Method D 2872-
88, Effects of Heat and Air on a Moving Film of Asphalt (Rolling Thin Film Oven Test - RTFOT) to
determine the “loss-on-heating” values for the asphalts. Additional loss-on-heating data also were obtained from several State departments of transportation laboratories in order to determine a common RTFOT
value to use as a default in those situations where no historical information is available. Based upon the RTFOT data collected and the desire to select a default which encourages the use of site-specific data, a
default of -0.5 percent was selected as a default value for use in the predictive emission factor equations developed from the data.
13

To account for differences in the load-out temperatures of the two facilities the data were adjusted using the Clausius-Clapeyron equation, which relates vapor pressure and temperature of a substance. This
equation and the asphalt laboratory data provide a mechanism to normalize the emissions to a temperature of 325EF, which is the maximum midpoint load-out temperature recommended by the Asphalt Pavement
Environmental Council’s Best Practices Guide dated March 2000.
Using the adjusted data and the temperature and volatility relationship described above, separate
predictive emission factor equations were developed for emissions of total PM, organic PM, total organic compounds (TOC), and CO from drum mix and batch mix load-out operations. Additionally, adjusted
data for a variety of HAP’s were used to develop ratios of the HAP pollutant to either organic PM or TOC (speciation profiles). These speciation profiles are applicable to load-out emissions and yard emissions.
2.2.4 Silo Filling
Silo filling emission factors were developed from one of the emission tests described in the previous
paragraphs for load-out emissions (Appendix B Reference 355). These data also were collected and
evaluated with stakeholder involvement. Additionally, the same basic methodology described in the previous paragraphs for load-out emissions was used to adjust the data on emissions from silo filling
operations. Predictive emission factor equations also were developed for total PM, organic PM, TOC, and CO. A detailed explanation of the methodology used to develop these equations is provided in
Section 4.4.4 of Appendix B. Speciation profiles for silo filling emissions were also developed using the
methodology described for load-out emissions. The speciation profiles from silo filling are applicable to asphalt storage tank emissions.
2.2.5 Asphalt Storage Tanks
To estimate emissions from heated organic liquid storage tanks, the methodologies described in
Chapter 7 of AP-42 and the TANKS software are generally used. The emissions from these types of tanks
depend on the contents of the tank, the volume of gas vented, and the operating temperature range of the liquid in the tank. Emissions during the filling of these tanks (working loss) are governed by the saturation
concentration of the liquid stored in the tank and the volume of gas displaced by the addition of liquid to the tank. Emissions during other periods (breathing losses) are governed by the saturation concentration of the
liquid stored in the tank and the changes in the volume of the gas caused by temperature variations. Although vapor pressure information on paving asphalt is not available to allow the use of the TANKS
program without additional information, information was available from the silo filling test report to infer
emissions during the filling of the asphalt storage tank and, by extension, the vapor pressure characteristics of paving asphalt at the typical operating temperatures. Using these data, input values for Antoine’s
equation and liquid and vapor molecular weight were developed for use with the TANKS program to calculate working and breathing losses for asphalt storage tanks. A detailed explanation of the
methodology used to develop these values is presented in Section 4.4.5 of Appendix B.
2.2.6 Yard Emissions
At one of the EPA-sponsored emission tests described in the previous paragraphs for load-out
emissions (Appendix B Reference 355), data also were collected on fugitive emissions from loaded trucks as they sat in the yard prior to departure for the job site. As with the other data from this reference, these
data were evaluated with stakeholder involvement. The data obtained were fitted to a power function in order to develop an equation for these yard emissions as a function of time. A specific emission factor for
cumulative emissions over an 8-minute period (which represents the maximum time represented by the
14

data) was calculated using the power function equation developed from the emission data. A detailed explanation of the methodology used to develop the equations and the emission factor is provided in Section
4.4.6 of Appendix B.
2.3 OTHER APPLICABLE AP-42 SECTIONS
Emission factors for other generic sources associated with HMA facilities can be found in other
sections of AP-42 (http://www.epa.gov/ttn/chief/ap42/index.html). As discussed above, methodologies for estimating emissions from asphalt storage tanks can be found in Chapter 7 of AP-42. Methods for
estimating fugitive dust emissions from vehicular traffic are presented in AP-42 Chapter 13 (Sections 13.2.1 and 13.2.2). Material handling emissions and storage pile emissions are addressed in AP-
42 Chapter 11 (Section 11.19.2) and Chapter 13 (Section 13.2.4). Emission factors for truck exhaust are provided in AP-42 Volume II: Mobile Sources (http://www.epa.gov/oms/ap42.htm).
To calculate the material handling and mobile source emission estimates presented in Tables 1 and
2 of this report, suitable emission factors for these material handling and mobile sources were determined.
The following paragraphs describe the basis for the emission factors that were used:
· Receipt of new aggregate – Used equation from AP-42 Section 13.2.4, assuming an average
moisture content of 1.5 percent and an average wind speed of 10 miles per hour (mph). The
resulting PM-10 emission factor is 0.0041 lb/ton of new aggregate. The resulting PM-2.5 emission factor is 0.0013 lb/ton of new aggregate.
· Transfer of aggregate from storage to conveyor belt or between conveyor belts – Used
controlled emission factor from AP-42 Section 11.19.2. The PM-10 emission factor is 0.000048 lb/ton of new aggregate.
· Screening of aggregate – Used controlled emission factor from AP-42 Section 11.19.2. PM-10 emission factor is 0.00084 lb/ton of new aggregate.
· RAP crushing – Used controlled tertiary crushing emission factor from AP-42 Section 11.19.2. PM-10 emission factor is 0.00059 lb/ton of new aggregate.
· Paved road dust emissions – Used paved roads equation from AP-42 Section 13.2.1, assuming
an average vehicle weight of 22 tons and a road silt content of 3 grams per square meter. The resulting PM-10 emission factor is 0.016 lb per vehicle mile traveled. The resulting PM-2.5
emission factor is 0.0040 lb per vehicle mile traveled. · Unpaved road dust emissions – Used unpaved roads equation from AP-42 Section 13.2.2,
assuming an average vehicle weight of 6 tons, a road silt percentage of 10 percent, a surface moisture content of 0.7 percent. The resulting PM-10 emission factor is 2.04 lb per vehicle
mile traveled. The resulting PM-2.5 emission factor is 0.29 lb per vehicle mile traveled.
· Diesel exhaust emissions – Used heavy duty diesel truck emission factors for idling and for an average speed of 10 mph with a 250 brake horsepower engine. The diesel engines get 10 miles
per gallon at 10 mph and burn 1 gallon per hour (gal/hr) of fuel at idle. The sulfur content of diesel fuel is 0.05 percent. At idle, the emissions factors for diesel engines are: VOC -
0.208 grams per minute (g/min) (0.00046 pound per minute [lb/min]), CO - 1.57 g/min
(0.0035 lb/min), NOx - 0.917 g/min (0.0020 lb/ min), SO2 - 0.157s pounds per gallon of fuel (lb/gal) (where s is fuel sulfur content) and PM - 0.043 g/min (0.000095 lb/min). When traveling at an average speed of 10 mph, the emission factors for diesel engines are: VOC - 3.18 grams per mile (g/mile) (0.0070 pounds per mile [lb/mile]), CO - 18.82 g/mile
(0.041 lb/mile), NOx - 8.50 g/mile (0.019 lb/mile), SO2 - 0.157s lb/gal fuel (where s is fuel sulfur content), and PM - 0.1011 grams per brake horsepower hour (0.00022 pounds per horsepower hour). For organic HAP emissions - Used medium duty diesel truck emission
15

factors from article by Schauer, et. al., in Environmental Science & Technology of May 15, 1999. The volatile HAP emission factors presented were 0.084 grams per kilometer (g/km)
(0.00030 lb/mile) and 0.0016 g/km (0.0000057 lb/mile) for PAHs.
The ducted and process fugitive emissions estimates presented in Tables 1, 2, 7, and 11 are based
on the following additional assumptions:
· ·
· ·
· ·
· ·
·
· ·
84,800 ton/yr of new aggregate for batch mix plant. 10,000 ton/yr of recycled pavement for batch plant.
1.25 million gallons (5,200 tons) of asphalt for batch plant. 150,900 ton/yr of new aggregate for drum mix plant.
40,000 ton/yr of recycled pavement for drum mix plant. 2.5 million gallons (10,400 tons) of asphalt for drum mix plant.
Two 18,000-gallon asphalt storage tanks. Five open conveyor transfer points for new aggregate.
Front end loader travel over unpaved roads of 0.25 mile per ton of RAP used.
Vehicle travel over paved roads of 1.5 miles per 25 tons of HMA produced. Vehicle idling time of 128,000 min (an average of 4 trucks in line during the average 8-minute
load-out time) for batch plant. · Vehicle idling time of 72,000 min (an average of 6 trucks in line during the average 1.5-minute
load-out time) for drum mix plant.
2.4 EMISSION INVENTORY FOR TYPICAL HOT MIX ASPHALT PLANTS
To perform an emission inventory for a typical HMA plant, the first step is to identify the types of
emission sources and to count the total number of each type of source. The next step is to identify the best emission estimation tools, which include: (1) facility-specific emissions test data; (2) source-specific
emission factors; (3) other types of source-specific data, such as mass balance data; (4) emission factors
for similar sources; (5) emission factors for sources that are believed to be somewhat similar to the source being considered; and (6) engineering estimates. After selecting appropriate emission estimation tools,
activity factors, such as production rates, should be determined for each source so that emissions can be estimated for a specified period of time. The emissions over the specified period of time for each source
and pollutant then are summed to complete the emission inventory. Appendix C provides more detailed information on procedures for performing an emission inventory at an HMA plant.
2.5 EMISSION ESTIMATES FOR TYPICAL HOT MIX ASPHALT PLANTS
Tables 1 and 2 present annual estimates of emissions of criteria pollutants and HAPs for typical
batch mix and drum mix HMA plants, respectively. The estimates presented in these tables account for the
most significant emission sources at each type of facility. Tables 5 through 12 present more detailed annual emission estimates for typical batch and drum mix HMA plants. Table 5 summarizes the estimated
emissions from a typical batch mix plant dryer, hot screens, and mixer. Included in the table are estimates
for criteria pollutants as well as specific PAHs, volatile HAPs, and metal HAPs for which emission factors were developed. Estimated annual criteria pollutant, PAH and volatile HAP emissions from typical batch
mix plant load-out operations and asphalt storage tank are summarized in Tables 6 and 7. Tables 8, 9, 10, and 11 summarize the estimated annual emissions from a typical drum mix plant dryer, load-out
operations, silo filling operations, and asphalt storage tank respectively. These tables includes estimates for criteria pollutants, PAHs, volatile HAPs, and metal HAPs for which emission factors were developed.
Finally, Table 12 presents estimates of fugitive emissions from loaded trucks (yard emissions) for a typical
16

Plant type Source Criteria pollutants HAPs Other pollutants
Batch mix Dryer, hot
screens, and
mixer
PM-10, CO, NOx,
VOC SO2,
24 organic HAPs
9 metal HAPs CO2 4 other organics 3 other metals
Hot oil heaters 22 organic HAPs
Load-out PM, CO, VOC, 41 organic HAPs 3 other organics
Yard emissions VOC 19 organic HAPs
Drum mix Dryer PM-10, CO, NOx,
VOC SO2,
58 organic HAPs
11 metal HAPs CO2 15 other organics, 6 other metals
Hot oil heaters 22 organic HAPs
Load-out PM, CO, VOC 41 organic HAPs 3 other organics
Silo filling PM, CO, VOC 28 organic HAPs 3 other organics
Yard emissions VOC 19 organic HAPs
batch mix and drum mix plant. The emissions estimates presented in Tables 5 through 12 are based on the emission factors developed for the HMA industry and the following assumptions:
·
·
·
· · ·
Batch mix plant and drum mix plant dryers are fueled with either natural gas or fuel oil. It is estimated that between 70 and 90 percent of HMA plants use natural gas, although some HMA plants use fuel oil as an alternative to natural gas. As shown in Tables 5 and 8, fuel oil-fired
mixers and dryers have higher emissions of SO2, NOx, and some HAPs. Batch mix plant dryer, hot screens, and mixer and drum mix plant dryer emissions are controlled with fabric filters.
PM emissions from load-out and silo filling are entirely PM-10. (However, the organic portion of these emissions also can be assumed to be PM-2.5. Information is available in AP-42
Appendix B.1, Particle Size Distribution Data and Sized Emission Factors for Selected Sources, for categorizing the inorganic or filterable PM into PM-10 and PM-2.5 fractions.)
Average asphalt loss on heating is -0.5 percent (asphalt volatility). Average HMA load-out temperature is 325°F.
The typical HMA plant has two asphalt storage tanks that are 50 feet long and 8 feet in
diameter. It is estimated that these storage tanks require a total heating capacity of about 200,000 Btu/hr, based on a heat loss of 60 Btu/ft2 of tank surface area. The asphalt storage
tanks are kept at 325°F continuously for the five months the HMA plant operates. As a result,
720 million Btu are used to maintain the temperature of the asphalt in the storage tank. For a gas-fired hot oil heater, 720,000 ft3 of gas is combusted. For an oil-fired hot oil heater,
5,100 gallons of fuel oil are combusted. It should be noted that this fuel usage is about 3 percent of the fuel used in a typical batch mix plant and 1.6 percent of the fuel used in a
typical drum mix plant.
TABLE 3. MATRIX OF EMISSION FACTORS DEVELOPED FOR HMA SOURCES
17

Plant
Type Source Pollutant Appendix A
Table Appendix B Section Appendix B
Table
Batch
Mix
Dryer,
hot screens, mixer
PM-10 11.1-1, 11.1-2 4.2.4.3.1-4.2.4.3.6 4-19
CO 11.1-5 4.2.4.3.7 4-20
CO2 11.1-5 4.2.4.3.8 4-20
NOx 11.1-5 4.2.4.3.9 4-20
SO2 11.1-5 4.2.4.3.10 4-20
TOC/VOC/methane 11.1-6 4.2.4.3.11, 4.2.4.3.12 4-20
Speciated organics 11.1-9 4.2.4.3.12-4.2.4.3.15 4-22
Trace metals 11.1-11 4.2.4.3.16 4-21
Drum
Mix
Dryer/mixer PM-10 11.1-3, 11.1-4 4.2.4.1.1-4.2.4.1.6 4-14
CO 11.1-7 4.2.4.1.7 4-15
CO2 11.1-7 4.2.4.1.8 4-15
NOx 11.1-7 4.2.4.1.9 4-15
SO2 11.1-7 4.2.4.1.10 4-15
TOC/VOC/methane 11.1-8 4.2.4.1.11 4-15
HCl 11.1-8 4.2.4.1.18 4-17
Speciated organics 11.1-10 4.2.4.1.12-4.2.4.1.1 5,
4.2.4.1.19
4-17
Dioxin/furans 11.1-10 4.2.4.1.17 4-17
Trace metals 11.1-12 4.2.4.1.16 4-16
Batch
or
Drum Mix
Hot oil
heater
Organic pollutants 11.1-13 4.2.4.2 4-18
Load-out PM, organic PM,
TOC, CO, speciated
organics
11.1-14
11.1-15
11.1-16
4.4.4 4-27 to 4-37,
4-43, 4-44
Silo filling PM, organic PM,
TOC, CO, speciated organics
11.1-14
11.1-15 11.1-16
4.4.4 4-38 to 4-44
Asphalt
storage
Speciated organics 11.1-15
11.1-16
4.4.5 4-43, 4-44
Yard
emissions
Speciated organics 11.1-15
11.1-16
4.4.6 4-45, 4-46
TABLE 4. LOCATIONS OF SUPPORTING DATA FOR EMISSION FACTORS
18

Pollutant Oil-fired dryer Natural gas-fired dryer
Emissions, lb/yr
Criteria Pollutants
PM-10
VOC
CO
SO2
NOx
2,700
820
40,000
8,800
12,000
2,700
820
40,000
460
2,500
PAHs (semi-volatile HAPs)
Naphthalene
2-Methylnaphthalene
Acenaphthene
Acenaphthylene
Anthracene
Benzo(a)anthracene
Benzo(a)pyrene
Benzo(b)fluoranthene
Benzo(g,h,i)perylene
Benzo(k)fluoranthene
Chrysene
Dibenz(a,h)anthracene
Fluoranthene
Fluorene
Indendo(1,2,3-cd)pyrene
Phenanthrene
Pyrene
Total PAHs
3.6
7.1
0.090
0.058
0.021
0.00046
0.000031
0.00094
0.00005
0.0013
0.00038
0.0000095
0.016
0.16
0.00003
0.26
0.0062
11
3.6
7.1
0.090
0.058
0.021
0.00046
0.000031
0.00094
0.00005
0.0013
0.00038
0.0000095
0.016
0.16
0.00003
0.26
0.0062
11
Volatile HAPs
Acetaldehyde
Benzene
Ethylbenzene
Formaldehyde
Quinone
Toluene
Xylene
Total Volatile HAPs
32
28
220
74
27
100
270
751
32
28
220
74
27
100
270
751
Metal HAPs
Arsenic
Beryllium
Cadmium
Chromium
Lead
Manganese
Mercury
Nickel
Selenium
Total metal HAPs
0.046
0.015
0.061
0.057
0.089
0.69
0.041
0.3
0.049
1.35
0.046
0.015
0.061
0.057
0.089
0.69
0.041
0.3
0.049
1.35
TABLE 5. ESTIMATED ANNUAL EMISSIONS FOR A TYPICAL BATCH MIX PLANT DRYER, HOT SCREENS, AND MIXERa
a
Dryer, hot screens, and mixer controlled by fabric filter producing 100,000 tons of hot
mix asphalt per year. Between 70 and 90 percent of HMA is produced using natural
gas; most of the remaining HMA is produced using fuel oil.
19

Pollutant Emissions, lb/yr
Criteria Pollutants
PM-10
VOC
CO
52
391
135
PAHs (semi-volatile HAPs)
Acenaphthene
Acenaphthylene
Anthracene
Benzo(a)anthracene
Benzo(b)fluoranthene
Benzo(k)fluoranthene
Benzo(g,h,i)perylene
Benzo(a)pyrene
Benzo(e)pyrene
Chrysene
Dibenz(a,h)anthracene
Fluoranthene
Fluorene
Indeno(1,2,3-cd)pyrene
2-Methylnaphthalene
Naphthalene
Perylene
Phenanthrene
Pyrene
Total PAHs
0.089
0.0095
0.0239
0.0065
0.0026
0.00075
0.00065
0.00078
0.0027
0.035
0.00013
0.017
0.26
0.00016
0.81
0.43
0.0075
0.28
0.051
2.02
Other semi-volatile HAPs
Phenol 0.40
Volatile HAPs
Benzene
Bromomethane
2-Butanone
Carbon disulfide
Chloroethane
Chloromethane
Cumene
Ethylbenzene
Formaldehyde
n-Hexane
Isooctane
Methylene chloride
Methyl tert-butyl ether
Styrene
Tetrachloroethene
Toluene
1,1,1-Trichloroethane
Trichloroethene
Trichlorofluoromethane
m-/p-Xylene
o-Xylene
Total volatile HAPs
0.22
0.040
0.20
0.054
0.00087
0.062
0.46
1.16
0.37
0.62
0.0075
0.00
0.00
0.030
0.032
0.87
0.00
0.00
0.0054
1.70
0.33
6.18
TABLE 6. ESTIMATED ANNUAL EMISSIONS FOR TYPICAL BATCH MIX PLANT LOAD-OUT OPERATIONSa
a
Uncontrolled emissions from 100,000 tons of hot mix asphalt per year.
20
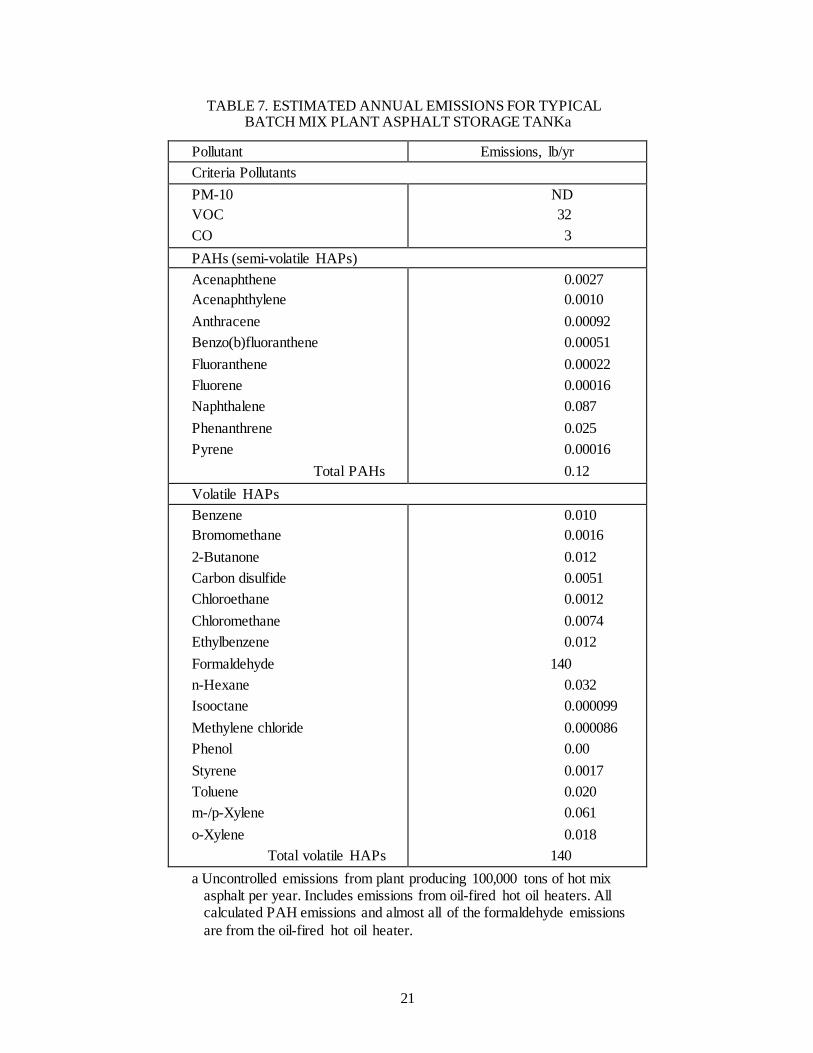
Pollutant Emissions, lb/yr
Criteria Pollutants
PM-10
VOC
CO
ND
32
3
PAHs (semi-volatile HAPs)
Acenaphthene
Acenaphthylene
Anthracene
Benzo(b)fluoranthene
Fluoranthene
Fluorene
Naphthalene
Phenanthrene
Pyrene
Total PAHs
0.0027
0.0010
0.00092
0.00051
0.00022
0.00016
0.087
0.025
0.00016
0.12
Volatile HAPs
Benzene
Bromomethane
2-Butanone
Carbon disulfide
Chloroethane
Chloromethane
Ethylbenzene
Formaldehyde
n-Hexane
Isooctane
Methylene chloride
Phenol
Styrene
Toluene
m-/p-Xylene
o-Xylene
Total volatile HAPs
0.010
0.0016
0.012
0.0051
0.0012
0.0074
0.012
140
0.032
0.000099
0.000086
0.00
0.0017
0.020
0.061
0.018
140
TABLE 7. ESTIMATED ANNUAL EMISSIONS FOR TYPICAL BATCH MIX PLANT ASPHALT STORAGE TANKa
a Uncontrolled emissions from plant producing 100,000 tons of hot mix asphalt per year. Includes emissions from oil-fired hot oil heaters. All calculated PAH emissions and almost all of the formaldehyde emissions
are from the oil-fired hot oil heater.
21

Pollutant No. 2 fuel oil-fired dryer Natural gas-fired dryer
Emissions, lb/yr
Criteria Pollutants
PM-10
VOC
CO
SO2
NOx
4,600
6,400
26,000
2,200
11,000
4,600
6,400
26,000
680
5,200
PAHs (semi-volatile HAPs)
2-Methylnaphthalene
Acenaphthene
Acenaphthylene
Anthracene
Benzo(a)anthracene
Benzo(a)pyrene
Benzo(b)fluoranthene
Benzo(e)pyrene
Benzo(g,h,i)perylene
Benzo(k)fluoranthene
Chrysene
Fluoranthene
Fluorene
Indeno(1,2,3-cd)pyrene
Naphthalene
Perylene
Phenanthrene
Pyrene
Total PAHs
34
0.28
4.4
0.62
0.042
0.0020
0.020
0.022
0.0080
0.0082
0.036
0.12
2.2
0.0014
130
0.0018
4.6
0.60
180
15
0.28
1.7
0.044
0.042
0.0020
0.020
0.022
0.0080
0.0082
0.036
0.12
0.76
0.0014
18
0.0018
1.5
0.11
37
Volatile HAPs
Isooctane
Hexane
Benzene
Ethylbenzene
Formaldehyde
Methyl chloroform
Toluene
Xylene
Total volatile HAPs
8.0
184
78
48
620
9.6
580
40
1,568
8.0
180
78
48
620
9.6
30
40
1,020
Metal HAPs
Lead
Mercury
Antimony
Arsenic
Beryllium
Cadmium
Chromium
Manganese
Nickel
Selenium
Total metal HAPs
3
0.52
0.036
0.11
0.000
0.082
1.1
1.5
12.6
0.070
19
0.12
0.048
0.036
0.11
0.000
0.082
1.1
1.5
12.6
0.070
16
TABLE 8. ESTIMATED ANNUAL EMISSIONS FOR A TYPICAL DRUM MIX DRYERa
a
Dryer controlled by fabric filter producing 200,000 tons of hot mix asphalt per year. Between 70 and 90 percent
of HMA is produced using natural gas; most of the remaining HMA is produced using fuel oil.
22

Pollutant Emissions, lb/yr
Criteria Pollutants
PM-10
VOC
CO
104
780
270
PAHs (semi-volatile HAPs)
Acenaphthene
Acenaphthylene
Anthracene
Benzo(a)anthracene
Benzo(b)fluoranthene
Benzo(k)fluoranthene
Benzo(g,h,i)perylene
Benzo(a)pyrene
Benzo(e)pyrene
Chrysene
Dibenz(a,h)anthracene
Fluoranthene
Fluorene
Indeno(1,2,3-cd)pyrene
2-Methylnaphthalene
Naphthalene
Perylene
Phenanthrene
Pyrene
Total PAHs
0.177
0.0191
0.0477
0.013
0.0052
0.0015
0.0013
0.00157
0.0053
0.070
0.00025
0.034
0.53
0.00032
1.62
0.85
0.015
0.55
0.10
4.05
Other semi-volatile HAPs
Phenol 0.80
Volatile HAPs
Benzene
Bromomethane
2-Butanone
Carbon disulfide
Chloroethane
Chloromethane
Cumene
Ethylbenzene
Formaldehyde
n-Hexane
Isooctane
Methylene chloride
Methyl tert-butyl ether
Styrene
Tetrachloroethene
Toluene
1,1,1-Trichloroethane
Trichloroethene
Trichlorofluoromethane
m-/p-Xylene
o-Xylene
Total volatile HAPs
0.43
0.080
0.41
0.11
0.0017
0.12
0.91
2.3
0.73
1.25
0.015
0.00
0.00
0.06
0.064
1.74
0.00
0.00
0.011
3.40
0.66
12.35
TABLE 9. ESTIMATED ANNUAL EMISSIONS FOR TYPICAL DRUM MIX PLANT LOAD-OUT OPERATIONSa
a
Uncontrolled emissions from 200,000 tons of hot mix asphalt per year.
23

Pollutant Emissions, lb/yr
Criteria Pollutants
PM-10 VOC CO
120 2,400
240
PAHs (semi-volatile HAPs)
Acenaphthene Acenaphthylene Anthracene
Benzo(a)anthracene Benzo(e)pyrene
Chrysene
Fluoranthene Fluorene
2-Methylnaphthalene Naphthalene
Perylene Phenanthrene
Pyrene
Total PAHs
0.24 0.0071 0.066
0.028 0.0048
0.11
0.076 0.51
2.7 0.92
0.015 0.91
0.22
5.8
Other semi-volatile HAPs
Phenol 0.00
Volatile HAPs
Benzene Bromomethane 2-Butanone
Carbon disulfide Chloroethane
Chloromethane Ethylbenzene
Formaldehyde
n-Hexane Isooctane
Methylene chloride Styrene
Toluene m-/p-Xylene
o-Xylene
Total volatile HAPs
0.78 0.12 0.95
0.39 0.095
0.56 0.93
17
2.4 0.0076
0.0066 0.13
1.5 4.6
1.4
31
TABLE 10. ESTIMATED ANNUAL EMISSIONS FOR TYPICAL DRUM MIX PLANT SILO FILLING OPERATIONSa
a Uncontrolled emissions from 200,000 tons of hot mix asphalt per year.
24

Pollutant Emissions, lb/yr
Criteria Pollutants
PM-10 VOC CO
ND 64 6
PAHs (semi-volatile HAPs)
Acenaphthene
Acenaphthylene
Anthracene
Benzo(b)fluoranthene
Fluoranthene
Fluorene
Naphthalene
Phenanthrene
Pyrene
Total PAHs
0.0027
0.0010
0.00092
0.00051
0.00022
0.00016
0.087
0.025
0.00016
0.12
Volatile HAPs
Benzene Bromomethane 2-Butanone
Carbon disulfide Chloroethane
Chloromethane
Ethylbenzene Formaldehyde
n-Hexane Isooctane
Methylene chloride Phenol
Styrene
Toluene m-/p-Xylene
o-Xylene Total volatile HAPs
0.020 0.0031 0.025
0.010 0.0025
0.015
0.024 140
0.064 0.00020
0.00017 0.00
0.0035
0.040 0.12
0.036 140
TABLE 11. ESTIMATED ANNUAL EMISSIONS FOR TYPICAL DRUM MIX PLANT ASPHALT STORAGE TANKa
a Uncontrolled emissions from plant producing 200,000 tons of hot mix asphalt per year. Includes emissions from an oil-fired hot oil heater. All
of the calculated PAH emissions and almost all of the formaldehyde emissions are from the oil-fired hot oil heater.
25

Batch mixb Drum mixc
Pollutant Emissions, lb/yr Criteria Pollutants
PM-10 VOC
CO
ND 110
36
ND 220
72 PAHs (semi-volatile HAPs) ND ND
Other semi-volatile HAPs Phenol 0.00 0.00
Volatile HAPs
Benzene Bromomethane 2-Butanone
Carbon disulfide
Chloroethane Chloromethane
Cumene Ethylbenzene
Formaldehyde n-Hexane
Isooctane
Methylene chloride Styrene
Tetrachloroethene Toluene
Trichlorofluoromethane m-/p-Xylene
o-Xylene
Total volatile HAPs
0.057 0.011 0.054
0.014
0.00023 0.017
0.12 0.31
0.10 0.17
0.0020
0.00 0.0080
0.0085 0.23
0.0014 0.45
0.088
1.6
0.11 0.021 0.11
0.029
0.0046 0.033
0.24 0.62
0.19 0.33
0.0040
0.00 0.016
0.017 0.46
0.0029 0.90
0.18
3.3
TABLE 12. ESTIMATED ANNUAL YARD VOC EMISSIONS FOR TYPICAL BATCH MIX AND DRUM MIX HMA PLANTSa
a Fugitive VOC emissions from loaded haul truck for eight minutes after completion of load-out. b Uncontrolled emissions from plant producing 100,000 tons of hot mix asphalt per year.
c Uncontrolled emissions from plant producing 200,000 tons of hot mix asphalt per year.
26

APPENDIX A
AP-42 Section 11.1 Hot Mix Asphalt Plants

This page intentionally left blank.

APPENDIX B
Emission Factor Documentation for AP-42 Section 11.1 Hot Mix Asphalt Production

This page intentionally left blank.

APPENDIX C
Chapter 3: Preferred and Alternative Methods for Estimating
Air Emissions from Hot Mix Asphalt Plants Emission Inventory Improvement Program (EIIP)
July 1996

This page intentionally left blank.
TECHNICAL REPORT DATA (Please read Instructions on reverse before completing)
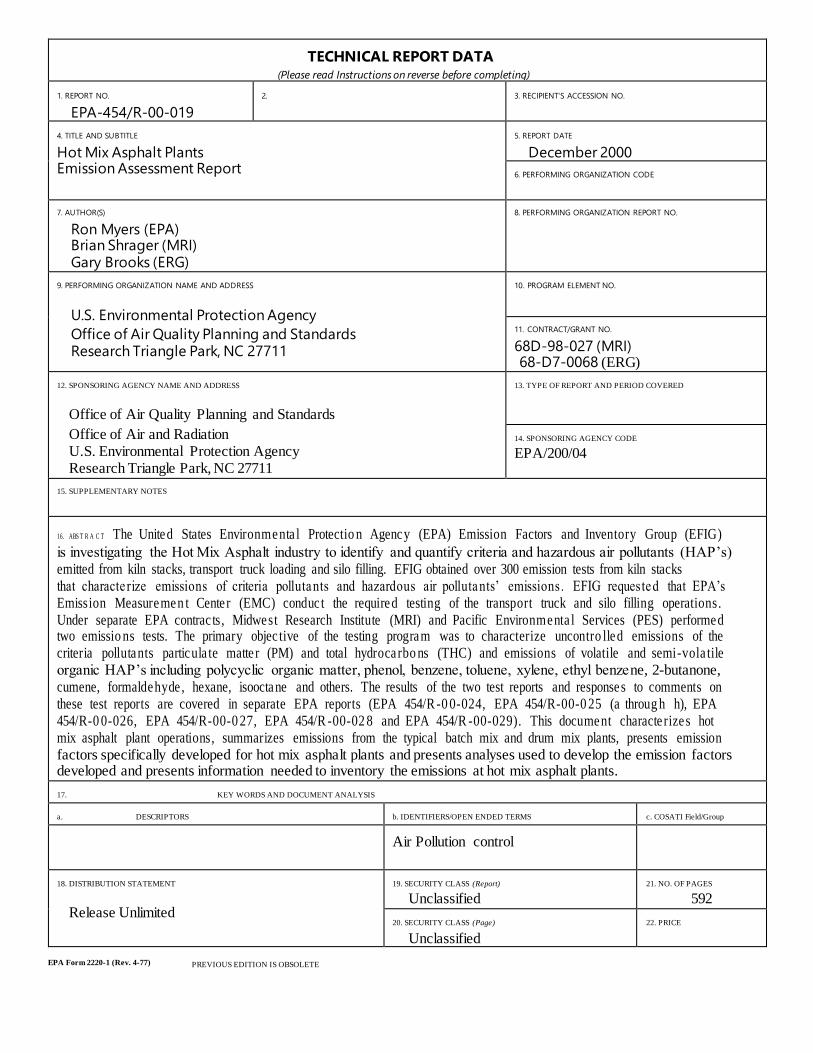
1. REPORT NO.
EPA-454/R-00-019
2. 3. RECIPIENT'S ACCESSION NO.
4. TITLE AND SUBTITLE
Hot Mix Asphalt Plants Emission Assessment Report
5. REPORT DATE
December 2000
6. PERFORMING ORGANIZATION CODE
7. AUTHOR(S)
Ron Myers (EPA) Brian Shrager (MRI) Gary Brooks (ERG)
8. PERFORMING ORGANIZATION REPORT NO.
9. PERFORMING ORGANIZATION NAME AND ADDRESS
U.S. Environmental Protection Agency
Office of Air Quality Planning and Standards Research Triangle Park, NC 27711
10. PROGRAM ELEMENT NO.
11. CONTRACT/GRANT NO.
68D-98-027 (MRI) 68-D7-0068 (ERG)
12. SPONSORING AGENCY NAME AND ADDRESS
Office of Air Quality Planning and Standards
Office of Air and Radiation U.S. Environmental Protection Agency Research Triangle Park, NC 27711
13. TYPE OF REPORT AND PERIOD COVERED
14. SPONSORING AGENCY CODE
EPA/200/04
15. SUPPLEMENTARY NOTES
16. ABS T R A C T The United States Environmenta l Protectio n Agency (EPA) Emission Factors and Inventory Group (EFIG)
is investigating the Hot Mix Asphalt industry to identify and quantify criteria and hazardous air pollutants (HAP’s) emitted from kiln stacks, transport truck loading and silo filling. EFIG obtained over 300 emission tests from kiln stacks that characte rize emissions of criteria pollutants and hazardous air pollutants’ emissions. EFIG requested that EPA’s Emission Measuremen t Cente r (EMC) conduc t the required testing of the transport truck and silo filling operations. Under separate EPA contrac ts, Midwest Research Institute (MRI) and Pacific Environmenta l Services (PES) performed two emissio ns tests. The primary objec tive of the testing program was to characterize uncontro lled emissions of the criteria pollutants particula te matte r (PM) and total hydrocarbo ns (THC) and emissions of volatile and semi-vola tile organic HAP’s including polycyclic organic matter, phenol, benzene, toluene, xylene, ethyl benzene, 2-butanone, cumene, formaldehyde , hexane, isooctane and others. The results of the two test reports and responses to comments on these test reports are covered in separate EPA reports (EPA 454/R -0 0-024, EPA 454/R-00-0 25 (a throug h h), EPA 454/R-0 0-026, EPA 454/R-00-0 27, EPA 454/R -00-02 8 and EPA 454/R -00-029). This document characte rizes hot mix asphalt plant operations, summarizes emissions from the typical batch mix and drum mix plants, presents emission factors specifically developed for hot mix asphalt plants and presents analyses used to develop the emission factors developed and presents information needed to inventory the emissions at hot mix asphalt plants.
17. KEY WORDS AND DOCUMENT ANALYSIS
a. DESCRIPTORS b. IDENTIFIERS/OPEN ENDED TERMS c. COSATI Field/Group
Air Pollution control
18. DISTRIBUTION STATEMENT
Release Unlimited
19. SECURITY CLASS (Report)
Unclassified 21. NO. OF PAGES
592
20. SECURITY CLASS (Page)
Unclassified
22. PRICE
EPA Form 2220-1 (Rev. 4-77)
PREVIOUS EDITION IS OBSOLETE

This page intentionally left blank.