hoppers crossing secondary college data analysis attitude to schooling 2013
TRANSCRIPT

HOPPERS CROSSING SECONDARY COLLEGE
DATA ANALYSISAttitude to Schooling
2013
2013 Data
The following graphs show 2013 data for:• Teacher effectiveness• Teacher empathy• Stimulating learning• School connectedness• Student motivation• Learning confidence

Teaching and Learning
Teacher Effectiveness : The extent to which teachers deliver their teaching in a planned and energetic manner.
• My teachers are easy to understand• My teachers put a lot of energy into teaching our
class• My teachers explain how we can get more
information• This school is preparing students well for their future• My teachers are well prepared

Attitude to Schooling SurveyTeacher Effectiveness (7 – 9)

Attitude to Schooling SurveyTeacher Effectiveness (10 – 12)

Teaching and Learning
Teacher Empathy: The extent to which teachers listen and understand student needs, and assist with student learning.
• My teachers listen to what I have to say• My teachers really want to help me learn• My teachers provide help and support when it is needed• My teachers are good at helping students with problems• My teachers explain things to me clearly• My teachers help me to do my best• My teachers understand how I learn

Attitude to Schooling SurveyTeacher Empathy (7 – 9)
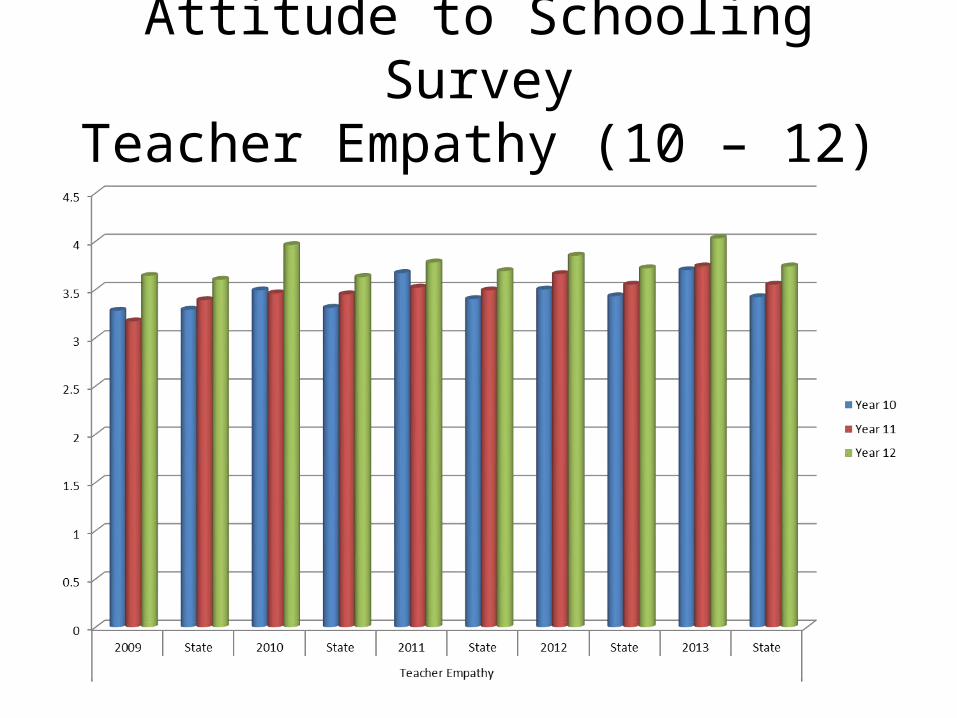
Attitude to Schooling SurveyTeacher Empathy (10 – 12)

Teaching and Learning
Stimulating Learning: The extent to which teachers make learning interesting, enjoyable and inspiring.
• My teachers make the work we do in class interesting• My teachers make learning interesting• My teachers are inspiring to listen to• My teachers make school work enjoyable

Attitude to Schooling SurveyStimulating Learning (7 – 9)
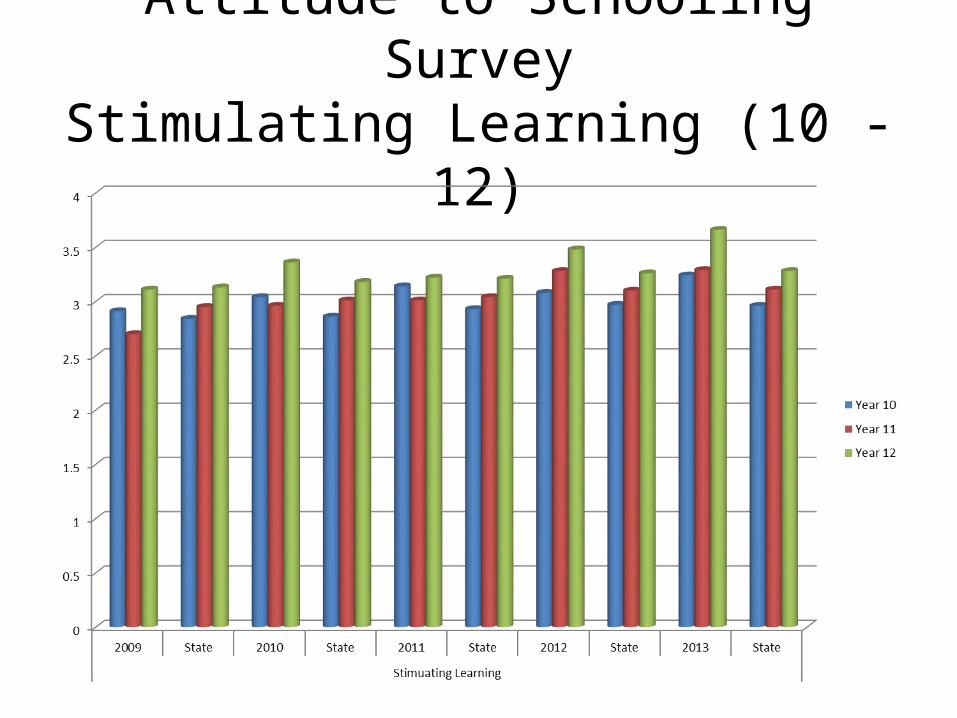
Attitude to Schooling SurveyStimulating Learning (10 - 12)

Teaching and Learning
School Connectedness: The extent to which students feel they belong and enjoy attending school.
• I feel good about being a student at this school• I like school this year• I am happy to be at this school• I feel I belong at this school• I look forward to going to school
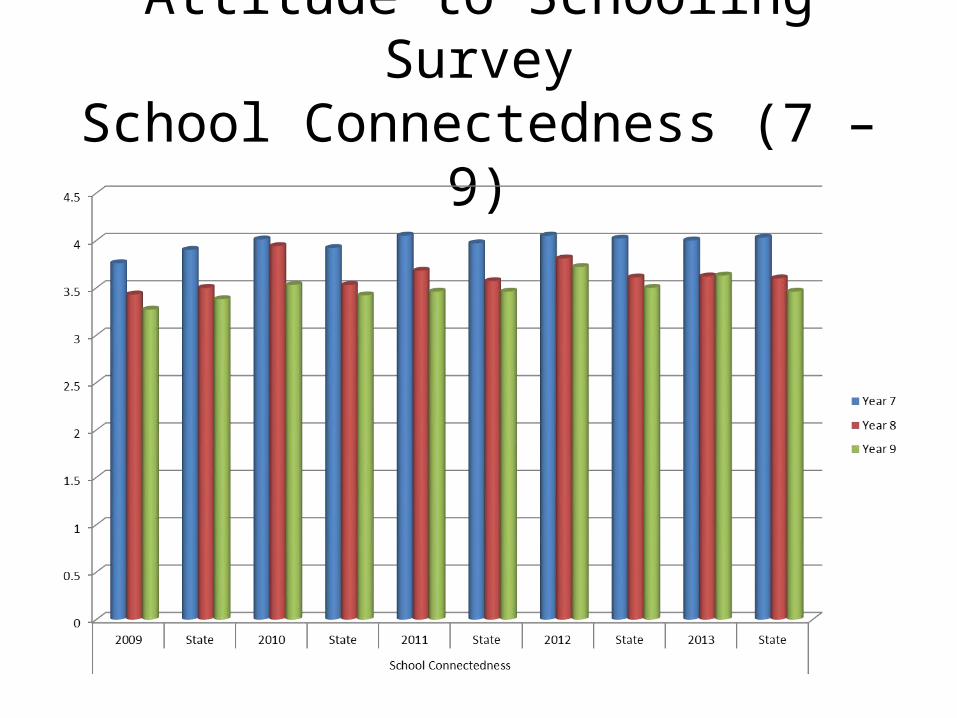
Attitude to Schooling SurveySchool Connectedness (7 – 9)

Attitude to Schooling SurveySchool Connectedness (10 - 12)

Teaching and Learning
Student Motivation: The extent to which students are motivated to learn and achieve.
• Doing well in school is very important to me• Continuing or completing my education is important
to me• I try very hard in school• I am keen to do very well at my school

Attitude to Schooling SurveyStudent Motivation (7 – 9)
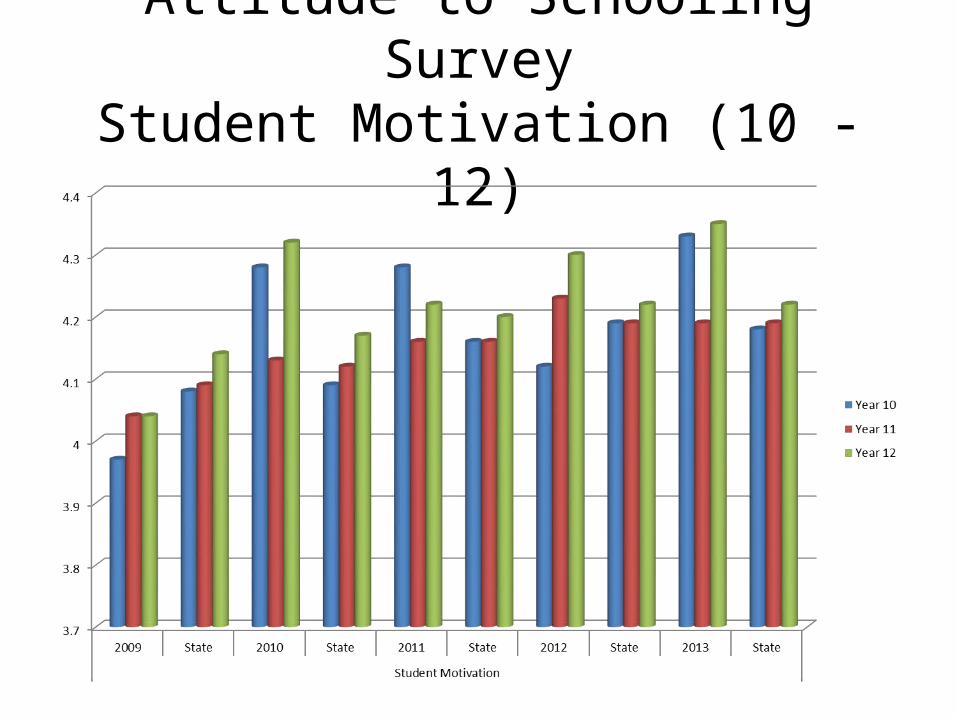
Attitude to Schooling SurveyStudent Motivation (10 - 12)
Teaching and Learning
Learning Confidence: The extent to which students have a positive perception of their ability as a student.
• I am good at my school work• I find it easy to learn new things• I am a very good student• I think I am generally successful at school

Attitude to Schooling SurveyLearning Confidence (7 – 9)

Attitude to Schooling SurveyLearning Confidence (10 – 12))

Observations and Comments
The previous graphs reflect on teaching and learning.
Comments:

2013 Data
The next 3 graphs for 2013 show:• Connectedness to peers• Classroom behaviour• Student safety

Student Relationships
Connectedness to Peers: The extent to which students feel socially connected and get along with their peers.
• I get on well with other students at my school• I am liked by others at my school• I get on really well with most of my classmates• My friends at school really care about me

Attitude to Schooling SurveyConnectedness to Peers (7 – 9)

Attitude to Schooling SurveyConnectedness to Peers (10 – 12))

Student Relationships
Classroom Behaviour: The extent to which other students are not disruptive in class.
• It’s often hard to learn in class, because other students are really disruptive
• It’s often hard to listen to the teacher in class, because other students are misbehaving
• The behaviour of some students in class makes it hard for me to do my work
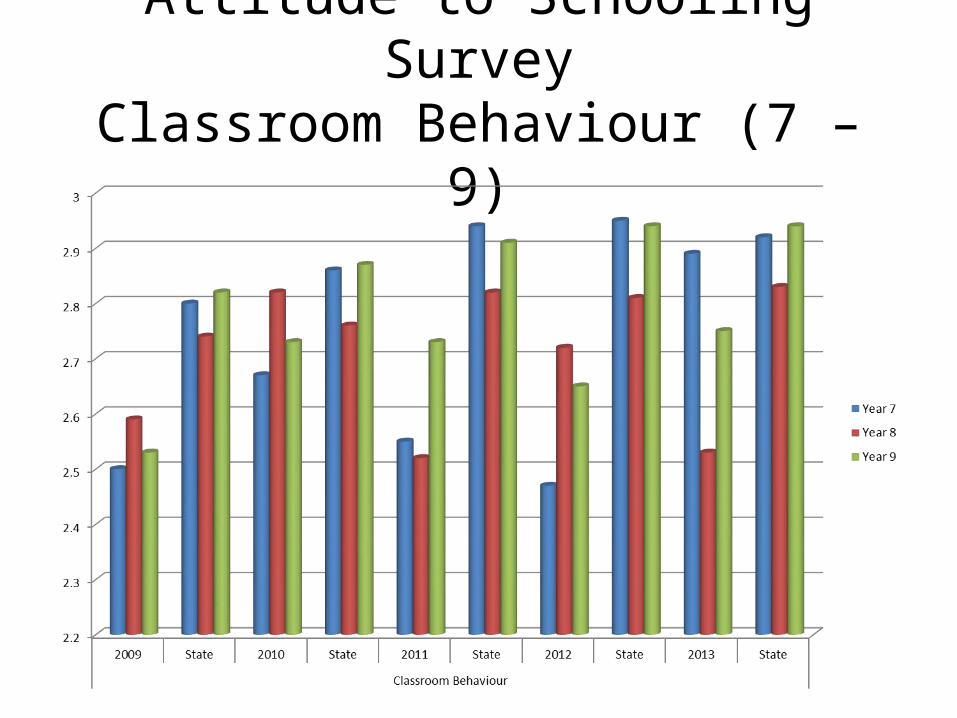
Attitude to Schooling SurveyClassroom Behaviour (7 – 9)

Attitude to Schooling SurveyClassroom Behaviour (10 – 12))

Student Relationships
Student Safety: The extent to which students feel they are safe from bullying and harassment.
• I have been bullied recently at school• I have been teased in an unpleasant way recently at
my school• Students have been mean to me at this school• I have been deliberately hit, kicked or threatened by
another student recently• Other students often spread rumours about me at my
school

Attitude to Schooling SurveyStudent Safety (7 – 9)

Attitude to Schooling SurveyStudent Safety (10 - 12)
Observations and Comments
The previous graphs relate to how connected to each other they feel and their environment.
Comments:

2013 Data
The next 2 graphs show the cumulative impact of the previous areas:
• Student morale• Student distress

Wellbeing
Student Morale: The extent to which students feel positive at school.
• I feel positive at school• I feel cheerful at school• I feel relaxed at school• I feel happy at school• I feel energised at school

Attitude to Schooling SurveyStudent Morale (7 – 9)

Attitude to Schooling SurveyStudent Morale (10 - 12)

Wellbeing
Student Distress: The extent to which students feel negative at school.
• I feel tense at school• I feel negative at school• I feel frustrated at school• I feel depressed at school• I feel uneasy at school• I feel stressed at school

Attitude to Schooling SurveyStudent Distress (7 – 9)

Attitude to Schooling SurveyStudent Distress (10 - 12)