hongkong land holdings limited - hkland.com · annual report 2017 1 is a listed leading property...
TRANSCRIPT

Annual Report 2017Hongkong Land Holdings Limited
Hongkong Land80
Contents
WF CENTRAL, a joint venture luxury retail centre at Wangfujing in Beijing (front cover).
Corporate Overview 1
Corporate Information 2
Highlights 3
Chairman’s Statement 4
Chief Executive’s Review 6
Financial Review 12
Directors’ Profiles 18
Financial Statements 20
Independent Auditors’ Report 66
Five Year Summary 70
Responsibility Statement 71
Corporate Governance 72
Principal Risks and Uncertainties 78
Shareholder Information 79
Offices 80
Report of the Valuers 81
Major Property Portfolio 82

Annual Report 2017 1
is a listed leading property investment, management and development group. Founded in 1889, Hongkong Land’s business is built on excellence, integrity and partnership.
The Group owns and manages more than 850,000 sq. m. of prime office and luxury retail property in key Asian cities, principally in Hong Kong, Singapore and Beijing. Hongkong Land’s properties attract the world’s foremost companies and luxury brands.
Its Hong Kong Central portfolio represents some 450,000 sq. m. of prime property. It has a further 165,000 sq. m. of prestigious office space in Singapore mainly held through joint ventures, a luxury retail centre at Wangfujing in Beijing, and a 50% interest in a leading office complex in Central Jakarta. The Group also has a number of high quality residential, commercial and mixed-use projects under development in cities across Greater China and Southeast Asia. In Singapore, its subsidiary, MCL Land, is a well-established residential developer.
Hongkong Land Holdings Limited is incorporated in Bermuda and has a standard listing on the London Stock Exchange, with secondary listings in Bermuda and Singapore. The Group’s assets and investments are managed from Hong Kong by Hongkong Land Limited. Hongkong Land is a member of the Jardine Matheson Group.

Hongkong Land2
Directors
Ben Keswick Chairman and
Managing Director
Robert Wong Chief Executive
Charles Allen-Jones
Simon Dixon
Mark Greenberg
Adam Keswick
Sir Henry Keswick
Simon Keswick
Dr Richard Lee
Anthony Nightingale
Y.K. Pang
Lord Powell of Bayswater, KCMG
Lord Sassoon, Kt
James Watkins
Percy Weatherall
Michael Wei Kuo Wu
Company Secretary
Neil M. McNamara
Registered Office
Jardine House
33-35 Reid Street
Hamilton
Bermuda
Hongkong Land Limited
Directors
Ben Keswick Chairman
Robert Wong Chief Executive
R.M.J. Chow
Simon Dixon Chief Financial Officer
K. Foo
R.L. Garman
Mark Greenberg
D.P. Lamb
C.F. Ling
Y.K. Pang
Jeremy Parr
John Witt
R.C.M. Wong
Corporate Secretary
Neil M. McNamara
Corporate Information

Annual Report 2017 3
• Underlying profit up 14% to a record US$970 million• Full-year dividend up 5%• Net asset value per share up 18%• WF CENTRAL retail complex opens in Beijing• Ten new projects secured
Results
2017 2016 ChangeUS$m US$m %
Underlying profit attributable to shareholders* 970 848 14
Profit attributable to shareholders 5,585 3,346 67
Shareholders’ funds 36,774 31,294 18
Net debt 2,549 2,008 27
US¢ US¢ %
Underlying earnings per share* 41.21 36.03 14
Earnings per share 237.39 142.23 67
Dividends per share 20.00 19.00 5
US$ US$ %
Net asset value per share 15.63 13.30 18
* The Group uses ‘underlying profit attributable to shareholders’ in its internal financial reporting to distinguish between ongoing business performance and non-trading items, as more fully described in Note 1 to the financial statements. Management considers this to be a key measure which provides additional information to enhance understanding of the Group’s underlying business performance.
Highlights

Hongkong Land4
Chairman’s Statement
OverviewThe Group’s investment properties produced higher results due to increased rents in Hong Kong and continuing low vacancies across both Hong Kong and Singapore. The contribution from development properties also rose with increased sales completions in mainland China, partially offset by a lower contribution in Singapore. Good progress was made in acquiring new sites during the year.
PerformanceUnderlying profit attributable to shareholders rose 14% to US$970 million.
Including the net gains of US$4,615 million resulting from higher valuations of the Group’s investment properties, the profit attributable to shareholders was US$5,585 million. This compares to US$3,346 million in 2016, which included net gains of US$2,498 million arising from revaluations.
The net asset value per share at 31st December 2017 was US$15.63, compared with US$13.30 at the end of 2016.
The Directors are recommending a final dividend of US¢14.00 per share, providing a total dividend for the year of US¢20.00 per share, compared with US¢19.00 per share for 2016.
Group ReviewInvestment PropertiesIn Hong Kong, vacancy across the office leasing market in Central remained low due to tight supply. Vacancy in the Group’s Central office portfolio was 1.4% at the end of 2017, compared with 2.2% at the end of 2016. Positive rental reversions continued, with average office rents increasing to HK$108 per sq. ft from HK$103 per sq. ft in 2016. The Group’s Central retail portfolio was effectively fully let with neutral reversions during 2017. The average rent of HK$224 per sq. ft was 3% higher than the prior year due to the full-year effect of positive reversions in 2016. The value of the Group’s investment property
portfolio in Hong Kong increased by 17%, primarily due to the impact of lower capitalisation rates used by the independent valuers.
In Singapore, vacancy in the Group’s office portfolio was 0.3%, compared to 0.1% at the end of 2016. Rental reversions were negative with the average rent declining to S$9.1 per sq. ft from S$9.3 per sq. ft in 2016. Completion of the previously announced agreement to jointly develop a site within the Marina Bay Financial District remains subject to the fulfilment of certain conditions precedent.
In mainland China, the retail component of the Group’s luxury retail and hotel complex in Beijing, WF CENTRAL, was opened in late 2017. The hotel component, comprising a 74-room Mandarin Oriental hotel, is scheduled to open in the second half of 2018. In Jakarta, the development of the fifth tower of World Trade Centre was completed in early 2018. EXCHANGE SQUARE, a 25,000 sq. m. mixed-use complex in Phnom Penh, was opened at the beginning of 2017.
In January 2018, the Group, in a 49%-owned joint venture, completed the purchase of a major freehold site in a prime location in the central business district of Bangkok in Thailand with a developable area of 440,000 sq. m.
Development PropertiesIn mainland China, higher completions of primarily residential units led to a significant increase in profit contribution, while the Group’s attributable interest in contracted sales during the year was only marginally higher at US$1,112 million than in 2016 due to fewer sales launches in the second half. At 31st December 2017, the Group had US$1,032 million in sold but unrecognised contracted sales, compared with US$1,083 million at the end of 2016.
During the year, the Group entered into three new markets in mainland China with projects in Wuhan, Nanjing and Hangzhou, and acquired two new sites in Chongqing. The Group’s effective interest in these primarily residential projects equates to a developable area of 768,000 sq. m.

Annual Report 2017 5
In January 2018, the Group secured a commercial site in Xinjiekou, Nanjing, a mature business and retail district in the heart of the city. The project has a developable area of 235,000 sq. m.
In Singapore, results were lower with only one project completion during the year. Pre-sales continued at the Sol Acres project, which is scheduled to complete in 2018, and at Lake Grande which is due for completion in 2019. In May 2017, the Group secured a large residential site in eastern Singapore with a developable area of 98,000 sq. m.
The Group’s joint venture projects in the rest of Southeast Asia are progressing on schedule. During the year, the Group entered into agreements to develop new residential projects in Bangkok and Ho Chi Minh City, increased its interest in an existing joint venture in Jakarta, and acquired its partner’s share in a retail mall and some mixed-use sites in Kuala Lumpur.
FinancingThe Group’s financial position remains strong with net debt of US$2.5 billion at 31st December 2017, up from US$2.0 billion at the end of 2016. Net gearing at the end of the year was 7%, compared with 6% at the end of 2016. Net debt is expected to move modestly higher as payments for committed land purchases are funded during 2018.
PeopleOn behalf of the Board, I would like to extend my gratitude to all of our staff for their dedication in upholding our reputation of providing high quality offerings to our tenants and customers, and for their commitment to our future growth and success.
Dr Richard Lee will step down from the Board at the forthcoming Annual General Meeting and will not seek re-election. We would like to thank him for his contribution to the Company. We are very pleased that Christina Ong, Co-Chairman and Senior Partner of Singapore law firm Allen & Gledhill LLP, has been invited to join the Board with effect from 9th May 2018.
OutlookThe strong contribution from the Group’s investment properties to underlying profit is expected to be maintained in 2018, while further improvements are anticipated from the Group’s development properties in mainland China and Singapore.
Ben KeswickChairman8th March 2018

Hongkong Land6
Hongkong Land produced an excellent result in 2017 with improved contributions from both its investment property and development property businesses, leading to a record underlying profit. The Group continues to maintain a strong balance sheet and ample financial liquidity, and is well-positioned to capitalise on opportunities to grow in its key markets.
StrategyHongkong Land operates a well-diversified portfolio of prime investment properties which it develops and holds as long-term investments, and develops premium residential and accompanying commercial properties for sale.
The Group’s investment properties are predominately commercial in nature and located in central business districts of Asian gateway cities, with a concentration in Hong Kong and Singapore. Returns principally arise from rental income and long-term capital appreciation. The commercial portfolios in Hong Kong and Singapore provide a steady stream of earnings and are the foundation of the strong financial strength that enables the Group to pursue new opportunities in its key markets in Greater China and Southeast Asia.
The Group’s development properties are premium residential and accompanying commercial developments primarily located in mainland China and Singapore, with a growing presence in Southeast Asia. Returns principally arise from short to medium-term trading profits.
Hong Kong’s Central PortfolioIn Hong Kong, the Group owns and manages 12 interconnected prime commercial buildings that form the heart of the financial district in Central, providing over 450,000 sq. m. of Grade A office and luxury retail space. This integrated mixed-use development is positioned as the pre-eminent office, luxury retail, restaurant and hotel accommodation in Hong Kong, and continues to attract both prime office tenants and luxury retailers.
Hong Kong’s positioning as one of Asia’s main financial and business hubs, combined with the scarcity of supply of high quality space in Central and the unique advantages of the Group’s portfolio, continues to support low vacancy and strong rents.
Chief Executive’s Review
41% Banks and other financial services
30% Legal 6% Property
7% Accounting 3% Trading
1% Governments 12% Others
38% Banks and other financial services
30% Legal 6% Property
8% Accounting 3% Trading
3% Governments 12% Others
2013
2017
Central portfolio office tenant profile by area occupied

Annual Report 2017 7
The Group’s 54,000 sq. m. retail portfolio is integrated with the office buildings to create part of the Group’s distinctive and successful mixed-use business model. Its tenants include numerous luxury brand flagship stores, as well as leading restaurants that have collectively been awarded a total of nine Michelin stars. LANDMARK is firmly established as the iconic shopping and fine dining destination in Hong Kong.
Other Investment PropertiesOutside Hong Kong, the Group has similarly established itself as a leading provider of prime office and retail space. In Singapore, Hongkong Land’s attributable interest of 165,000 sq. m., principally in the Marina Bay Area, includes some of the finest Grade A office space in the market. In mainland China, the 43,000 sq. m. retail component of the Group’s WF CENTRAL development in Beijing was opened in November 2017, and planning is underway for further developments in Beijing and Shanghai.
In Indonesia, the Group has attributable interests of over 100,000 sq. m. of commercial property through its 50%-owned joint venture, Jakarta Land, including the recently completed 74,000 sq. m. World Trade Centre 3 tower. In Cambodia, the development of EXCHANGE SQUARE, a 25,000 sq. m. mixed-use complex comprising office and retail components in the heart of Phnom Penh, was completed in early 2017.
Our performance in these markets depends on the levels of demand for, and supply of, prime office and luxury retail space, both of which are influenced by global and regional macro-economic conditions. The Group is committed to maintaining excellence in product quality and service to retain and attract tenants and customers, and will continue to seek new opportunities to develop prime investment properties in Asia.
Development PropertiesThe Group has established a strong and profitable trading business focusing primarily on the premium market segment in mainland China and Southeast Asia. While the capital invested in this business is significantly lower than in its investment properties, the earnings derived from development properties enhance the Group’s overall profits and returns on capital. The Group’s attributable interest in the developable area of its projects at the end of 2017 totalled 8.2 million sq. m., compared to 7.3 million sq. m. at the end of 2016. Of this, construction of approximately 34% had been completed at the end of 2017, compared to 31% at the end of 2016.
Annual returns from development properties fluctuate due to the nature of the projects and the Group’s accounting policy of only recognising profits on sold properties on completion. Demand is also dependent on overall economic conditions, which can be significantly affected by government policies and the availability of credit. Ongoing land acquisitions are necessary to build and maintain a stable income stream over the longer term.
Central portfolio top five retail tenants (in alphabetical order)in 2017
Armani Group
Dickson Concepts
Kering
LVMH Group
Richemont Group
Central portfolio top five office tenants (in alphabetical order)in 2017
ANZ
BNP Paribas
JP Morgan
KPMG
PricewaterhouseCoopers

Hongkong Land8
Chief Executive’s Review
2017
13.82
2016
13.26
2015
13.03
2014
13.14
2013
12.70
2012
11.64
2011
11.18
2010
10.85
2009
10.84
2008
8.52
Review of Investment PropertiesProfits from the Group’s investment properties were higher in 2017 than 2016, due to positive office rental reversions in Hong Kong and continuing low vacancies in both Hong Kong and Singapore.
Hong KongThe Hong Kong office leasing market remained buoyant, backed by continued tight Grade A office supply and steady demand for prime office space, in particular from mainland Chinese companies. Vacancy for the overall Central Grade A market was 1.7% at the end of 2017, unchanged from the end of 2016. The Group’s vacancy at the end of 2017 was 1.4%, down from 2.2% at the end of 2016. The Group’s average office rent was HK$108 per sq. ft, an increase from the 2016 average of HK$103 per sq. ft. Financial institutions, legal firms and accounting firms occupy 78% of the Group’s total leased office space.
The Group’s retail portfolio in Hong Kong was fully let at 31st December 2017, against a backdrop of modestly improved market sentiment during the second half of the year. Base rental reversions were largely neutral during the year, while the average rent of HK$224 per sq. ft was up slightly from the HK$218 per sq. ft achieved in the prior year, due to the full year effect of positive reversions seen in 2016.
Central portfolioat 31st December 2017
Office Retail
Capital value (US$m) 25,833 4,727*
Gross revenue (US$m) 740 258*
Equivalent yield (%)– One and Two Exchange Square 3.00– The Landmark Atrium 4.50
Average unexpired term of leases (years) 3.7 2.7
Area subject to renewal/review in 2018 (%) 31 34
* include hotel
Central portfolio average office effective rent (US$/sq. ft per month)
The value of the Group’s investment portfolio in Hong Kong at 31st December 2017, based on independent valuations, increased by 17% to US$30.9 billion when compared to the prior year, primarily due to capitalisation rates compressing on strong investor demand for commercial property.

Annual Report 2017 9
SingaporeAlthough the Singapore office leasing market showed signs of improvement towards the end of 2017 as new supply was taken up, a sustained trend is not yet evident. The overall vacancy across the entire Grade A central business district market was 10.8% as at the end of 2017, compared to 6.7% at the end of 2016. The Group’s office portfolio remained resilient, reflecting its high quality and unique positioning. Vacancy remained low at 0.3% at the year end, compared to 0.1% at the end of 2016. The Group’s average rent in 2017 was S$9.1 per sq. ft, a decrease from S$9.3 per sq. ft in the previous year, due to overall negative rental reversions. Financial institutions, legal firms and accounting firms occupy 82% of the total leasable area.
In June 2017, the Group signed an agreement to jointly construct and manage a site within the Marina Bay Financial District of Singapore with a developable area of 120,000 sq. m. The conditions precedent to the proposed joint development proceeding are yet to be fulfilled.
Other Investment PropertiesIn Beijing, WF CENTRAL, the Group’s unique lifestyle, luxury retail and hotel project in Wangfujing, had the soft opening of its retail component in November 2017. This prestigious development houses a large number of renowned international brands with many making their debuts in Beijing. The development also includes a 74-room Mandarin Oriental hotel, which is expected to open in the second half of 2018. In the central business district of Beijing’s Chaoyang District, the Group’s 30%-owned proposed office development project remains under planning. It will be developed as a prime Grade A office building of 120,000 sq. m.
In Shanghai, the Group’s joint venture project with Lujiazui Group in the Qiantan area of Pudong remains in the planning stage and is also subject to final regulatory approval. The intention is to develop the site into a mixed-use project comprising office and retail components, with a developable area of 230,000 sq. m.
In One Central Macau, occupancy in the retail portfolio was 92%, compared to 95% in the prior year. Tenant sales were up 2% as the market showed signs of stabilising.
In Jakarta, development of the fifth tower at the Group’s 50%-owned joint venture, Jakarta Land, was completed at
the start of 2018 and the space is in the process of being handed over to tenants. Occupancy across the portfolio increased to 92% at the end of 2017, compared to 90% at the end of 2016; a strong result amidst a backdrop of surplus city-wide office supply. The average gross rent in 2017 was US$25.1 per sq. m., virtually unchanged from the prior year.
In Phnom Penh, EXCHANGE SQUARE, the Group’s 25,000 sq. m. prime mixed-use complex in the heart of the city’s emerging financial district, was completed in early 2017. The development has secured a number of anchor tenants and was 65% occupied at the end of 2017. It continues to see reasonable demand for its remaining vacant space.
In October 2017, agreement was reached to jointly acquire a freehold site in Bangkok’s central business district that will yield a developable area of 440,000 sq. m. The transaction closed in January 2018.
Performances at the Group’s other investment properties were within expectations.
Review of Development PropertiesEarnings from the Group’s development properties were significantly higher in 2017 compared to 2016, primarily due to higher completions in mainland China, partially offset by a lower profit contribution from Singapore.
Mainland ChinaThe Group’s development properties in mainland China are located in seven cities, with a concentration in Chongqing. During the year, the Group entered into three new markets: namely Wuhan, Nanjing and Hangzhou, and acquired two further sites in Chongqing. The new projects are predominantly residential with accompanying commercial components.
Despite government cooling measures, sales performance remained resilient. Total contracted sales in 2017 was US$1,112 million, marginally higher than the US$1,105 million achieved in the prior year as a strong selling performance in the first half of the year was offset by fewer sales launches in the second half. The Group’s attributable interest in revenue recognised, including its share of revenue in joint ventures and associates, rose to US$1,347 million in 2017 from US$676 million in 2016, an increase of 99%, due to the timing of completions.

Hongkong Land10
Chief Executive’s Review
At 31st December 2017, the Group’s attributable interest in sold but not yet recognised contracted sales amounted to US$1,032 million, a decrease of 5% from US$1,083 million at the end of 2016.
Chongqing, the largest city in western China, remains the most significant market in the country for the Group’s development properties, representing some 53% of its mainland China exposure in this sector. There are three wholly-owned projects, Yorkville South, Yorkville North and a project in Dazhulin acquired in August 2017 adjacent to New Bamboo Grove, and five 50%-owned joint ventures, being Bamboo Grove, New Bamboo Grove, Landmark Riverside, Central Avenue and a newly acquired project in Lijia, a residential area along the south bank of the Jialing River.
The newly acquired 100%-owned site adjacent to New Bamboo Grove is primarily residential with a total developable area of some 161,000 sq. m. The new 50%-owned site located in Lijia is also primarily residential with a total developable area of some 114,000 sq. m. Both projects will be completed in a single phase in 2020.
The Group’s attributable interest in revenue recognised in Chongqing, including its share of revenue in joint ventures and associates, rose to US$806 million in 2017 from US$509 million in 2016, an increase of 58%, due to the timing of completions. The Group’s attributable interest in the developable area of its Chongqing projects at the end of 2017 totalled 4.3 million sq. m., compared to 4.1 million sq. m. at the end of 2016. Of this, construction of approximately 48% had been completed at the end of 2017, compared to 41% at the end of 2016.
In Shanghai, the Group holds a 50% joint venture interest to develop a prime residential project, Parkville, which is located in Pudong within Shanghai’s inner-ring road. The project consists of residential and commercial space with a total developable area of approximately 230,000 sq. m. Of this, construction of approximately 33%, comprising some offices and the entire residential component, had been completed at the end of 2017. The Group’s share of sales recognised was US$399 million.
In Wuhan, the Group entered into a 50%-owned joint venture with Zall Group in February 2017 to develop a mixed-use site within the Dongxihu District. The project comprises residential, retail and office components, with
a total developable area of approximately 493,000 sq. m. The project is planned to be developed in three phases to 2022.
In Nanjing, the Group entered into a joint venture with China Merchants Property Development and Country Garden in March 2017 to develop a mixed-use site within Qinhuai District. The project comprises residential, retail and serviced apartments, and a hotel, with a total developable area of approximately 218,000 sq. m. The project is planned to be developed in two phases to 2021.
Following the end of 2017, the Group acquired a commercial site in Xinjiekou, a mature business and retail district in the heart of the Nanjing central business district. The project comprises offices and retail over a developable area of 235,000 sq. m. and will be developed in one phase to 2023.
In Hangzhou, the Group entered into a joint venture with Yanlord and Transfar Group in August 2017 to develop two mixed-used sites in Xiaoshan District. The project mainly comprises residential, retail and serviced apartments, with a total developable area of approximately 776,000 sq. m. The project is planned to be developed in three phases to 2022.
SingaporeThe Group completed one residential project during 2017, the 699-unit LakeVille project, which was fully sold.
The 1,327-unit Sol Acres executive condominium development, which is scheduled for completion in 2018, was 96% pre-sold at the end of 2017. The 710-unit Lake Grande project, a residential site located adjacent to the LakeVille project, which is scheduled for completion in 2019, was 98% pre-sold.
Construction of Margaret Ville, a 309-unit residential project with a developable area of 239,000 sq. ft, is underway with completion scheduled in 2021. Pre-sales are expected to commence in the first half of 2018.
In May 2017, the Group successfully tendered for a residential site at Sims Avenue, near the Eunos MRT station. The project will yield approximately 1,400 units over a developable area of 98,000 sq. m. Construction will commence in 2018 and is expected to complete by 2021.

Annual Report 2017 11
Other Development PropertiesIn Indonesia, construction of the Group’s residential projects is progressing well. Nava Park, the Group’s 49%-owned joint venture with Bumi Serpong Damai, is a 67 hectare site in the southwest of central Jakarta. Upon completion in 2029, Nava Park will comprise a mix of landed houses, villas, mid-rise apartments and low-rise commercial components. Of the 653 units which have been launched for sale, 74% had been pre-sold as at the end of 2017. The first phase of the launched units was completed in 2017, while the second phase is due for completion by stages through to 2020.
Anandamaya Residences, the 40%-owned joint venture project with affiliate Astra International, is a 509-unit luxury apartment development. Construction is scheduled to complete in the second half of 2018. As of the end of 2017, 94% of the units had been pre-sold. In January 2018, the Group agreed to develop another residential site, Arumaya, with Astra International. It will consist of 262 luxury garden villas and apartments and is expected to complete in 2022.
Asya (formerly Jakarta Garden City), the joint venture in which the Group has a 33.5% attributable interest, is a 68 hectare site located east of central Jakarta. The project will yield a total developable area of approximately one million sq. m., comprising landed houses, villas, apartments and low-rise commercial shophouses. The project will be developed in multiple phases through to 2031. Pre-sale of the first phase was launched in December 2017.
In the Philippines, construction is continuing at Two Roxas Triangle, the 40%-owned luxury 182-unit residential condominium tower in Manila’s central Makati area. The development is expected to be completed in 2018. At the end of 2017, 96% of the units had been pre-sold.
At Mandani Bay, a 40%-owned 20 hectare development comprising principally residential units with some office and retail components in Cebu, construction progress remains on track with the project planned to be developed in multiple phases through to 2035. Of the 2,118 units launched, 50% was pre-sold at the end of 2017.
In Vietnam, the Group secured two new residential sites in Ho Chi Minh City. In July 2017, the Group conditionally entered into a 64%-owned joint venture to develop a prime residential site in District 2 of the city. The project will yield a total developable area of approximately 175,000 sq. m., consisting of over 1,000 luxury apartments. The project will be developed over two phases through to 2024.
In December 2017, the Group conditionally entered into a 70%-owned joint venture to develop a prime residential site in District 1 of Ho Chi Minh City. The project will comprise a 530-unit luxury residential tower with a total developable area of approximately 57,000 sq. m. The project will be developed in a single phase and is expected to complete in 2021.
In Thailand, the Group secured its first residential project in Bangkok, under a 49%-owned joint venture, in February 2017. The site, which is located in the Sukhumvit area of Bangkok, will be developed as a 338-unit high-rise luxury condominium tower with total developable area of approximately 38,000 sq. m. The project will be developed in a single phase and is expected to complete in 2020.
OutlookThe Group’s investment property portfolio is expected to continue generating stable returns in 2018. In the development properties business, higher profits are expected from mainland China and Singapore.
We take pride in delivering outstanding services and products to our tenants and customers by upholding the highest standards of quality. These are the core values which have served as the foundation of Hongkong Land’s long-term success. The Group intends to utilise its strong balance sheet and disciplined investment approach to further strengthen its market positions and achieve sustained growth.
Robert WongChief Executive8th March 2018

Hongkong Land12
ResultsThe Group’s underlying profit attributable to shareholders in 2017 was US$970 million, up 14% from the prior year. This result can be analysed by reportable segment at the operating profit level, and unallocated expenses. Each of these items in the below table includes the Group’s share of results from its associates and joint ventures. Given the significance of the Group’s joint ventures, this provides a clear summary of the Group’s performance during the year.
2017 2016US$m US$m
Investment Properties, underlying operating profit 988 953Development Properties, underlying operating profit 540 286Corporate costs (68) (62)
Underlying operating profit 1,460 1,177Net financing charges (104) (102)Tax (371) (214)Non-controlling interests (15) (13)
Underlying profit attributable to shareholders 970 848
US¢ US¢
Underlying earnings per share 41.21 36.03
The Group’s operating profit from Investment Properties was US$988 million, a 4% increase on the prior year. The improved results were mostly attributable to the Hong Kong Central office portfolio, on positive rental reversions and continued low vacancies. The Hong Kong Central retail portfolio, which continues to be effectively fully occupied, had a moderately improved performance over the prior year, whilst the contribution from the Singapore portfolio was slightly lower in 2017 due to negative rental reversions.
In Hong Kong, strong results continued at the Group’s office portfolio on 5% higher average rents due to tight supply and steady demand for prime office space. The retail portfolio benefited from the full-year effect of positive reversions in 2016, resulting in a 3% increase in average rents. The Hong Kong Central Portfolio generated 85% of the operating profit contributed by the Group’s Investment Properties sector, marginally higher than the prior year of 83%.
In Singapore, the contribution to the Group’s Investment Properties segment was marginally lower in 2017 than the prior year, due to overall negative rental reversions. Singapore contributed to 12% of the Group’s Investment Properties segment, marginally lower than the prior year of 13%.
In mainland China, the retail component of WF CENTRAL in Beijing was opened in November 2017, with a negative contribution due to opening expenses incurred.
Financial Review

Annual Report 2017 13
The contribution from the Development Properties segment was US$540 million, an 89% increase on the prior year, primarily due to a higher contribution from mainland China, that was only partially offset by a lower contribution from Singapore. The Group’s mainland China results benefited from higher completions, and collectively a higher margin, whereas Singapore’s contribution was lower as a result of lower margins enjoyed on the project that completed in 2017.
In mainland China, the Group’s attributable interest in revenue, being the Group’s share of completed units handed over to customers, increased by 99% compared to the prior year due to higher completions. Earnings contribution increased by 176% compared to the prior year driven by both higher completions and improved margins, predominately due to the first time recognition of profits at the Parkville development in Shanghai.
Revenue was recognised at the following projects in mainland China:
Project CityAttributable
interest Number of units sold
% 2017 2016
Maple Place Beijing 90 13 31Yorkville North Chongqing 100 844 767Yorkville South Chongqing 100 940 1,155Bamboo Grove Chongqing 50 1,431 347New Bamboo Grove Chongqing 50 1,322 –Landmark Riverside Chongqing 50 1,438 216Central Avenue Chongqing 50 482 512WE City Chengdu 50 730 1,069Parkville Shanghai 50 490 –
In Singapore, there was one project completion, namely LakeVille (699 units). The 2017 operating profit contribution declined compared to the prior year, despite moderately higher revenues, mainly due to a decline in margins caused by the timing of the LakeVille land purchase.
Other locations are predominately under development and are yet to make a meaningful contribution to operating profit.
Net financing charges of US$104 million were 2% higher than the prior year primarily due to slightly higher average net borrowings as a result of the Group’s investments during the year. Average borrowing costs remained largely unchanged from the prior year at 3.6%.
The tax charge, which includes Land Appreciation Tax at the Group’s development properties projects in mainland China, increased by 73% to US$371 million, with a higher effective tax rate of 25.2% from the prior year’s 19.7%, primarily due to higher Land Appreciation Tax.
Non-Trading ItemsIn 2017, the Group had net non-trading gains of US$4,615 million compared with US$2,498 million in 2016. These arose principally on revaluations of the Group’s investment properties, including its share of joint ventures, which were performed at 31st December 2017 by independent valuers.
The gains on valuation came predominately from the Group’s Central office portfolio in Hong Kong due to a compression in capitalisation rates on a continuation of strong investor demand for Grade A office space in Central, and an increase in open market rents. The Central portfolio increased in value by 17% to US$30.6 billion.

Hongkong Land14
Financial Review
The cash inflows from operating activities for the year were US$800 million, compared with US$1,096 million in 2016. The decrease of US$296 million was principally due to lower operating profit from the Group’s subsidiaries, and higher payments for wholly-owned residential development sites. The Group’s operating profit from its subsidiaries (excluding non-trading items) was US$908 million, 6% lower than the prior year. An improved contribution from the Hong Kong Central
portfolio was more than offset by lower underlying profits from wholly-owned development properties in mainland China and Singapore. Furthermore, the Group paid US$549 million to acquire development property sites, predominately attributable to the Margaret Drive and Eunosville projects in Singapore (collectively US$245 million), and a new site acquired in Chongqing (US$287 million), as compared to US$79 million in 2016.
Cash FlowsThe Group’s consolidated cash flows are summarised as follows:
2017 2016US$m US$m
Operating activitiesOperating profit, excluding non-trading items 908 971Net interest (76) (75)Tax paid (137) (141)Payments for development properties sites (549) (79)Expenditure on development properties projects (298) (336)Sale proceeds from development properties 1,018 953Dividends received from joint ventures 94 88Others (160) (285)
800 1,096Investing activitiesMajor renovations capex (108) (92)Investments in and advances to associates and joint ventures (670) (1)Development expenditure (106) (148)Acquisition of a subsidiary (43) –Payment of deposit for a joint venture (20) (4)
(947) (245)Financing activitiesDividends paid by the Company (443) (444)Net drawdown of borrowings 239 26Others 11 (24)
(193) (442)
Net (decrease)/increase in cash and cash equivalents (340) 409Cash and cash equivalents at 1st January 1,898 1,566Effect of exchange rate changes 58 (77)
Cash and cash equivalents at 31st December 1,616 1,898

Annual Report 2017 15
Cash outflows from investing activities were US$947 million, compared to US$245 million in the prior year. The increase of US$702 million was mainly due to an increase in investment activity. Net funding of the Group’s joint venture projects totalled US$670 million, a significant increase on US$1 million in the prior year primarily due to an increase in new joint venture developments. Similar to the prior year, development expenditure of US$106 million was principally for the WF CENTRAL project in Beijing, whilst capital expenditure of US$108 million related to major renovations, principally in respect of the Hong Kong Central portfolio.
Under financing activities, the Company paid dividends of US$443 million, being the 2016 final dividend of US¢13.00 per share and the 2017 interim dividend of US¢6.00 per share, in line with the prior year. The Group also had a net drawdown of borrowings of US$239 million.
Cash and cash equivalents was US$282 million lower at the end of 2017. Taken together with an increase in borrowings, this resulted in an increase in the Group’s net debt at 31st December 2017, which has moved up to US$2,549 million, from US$2,008 million at the beginning of the year.
DividendsThe Board is recommending a final dividend of US¢14.00 per share for 2017, providing a total annual dividend of US¢20.00 per share, an increase of 5% over 2016. The final dividend will be payable on 16th May 2018, subject to approval at the Annual General Meeting to be held on 9th May 2018, to shareholders on the register of members at the close of business on 23rd March 2018. No scrip alternative is being offered in respect of the dividend.
Treasury PolicyThe Group manages its treasury activities within established risk management objectives and policies using a variety of techniques and instruments. The main objectives are to manage exchange, interest rate and liquidity risks and to provide a degree of certainty in respect of costs. The investment of the Group’s cash balances is managed so as to minimise risk while seeking to enhance yield. Appropriate credit guidelines are in place to manage counterparty credit risk.
When economically sensible to do so, borrowings are taken in local currencies to hedge foreign currency exposures on investments. A portion of borrowings is denominated in fixed rates. Adequate headroom in committed facilities is maintained to facilitate the Group’s capacity to pursue new investment opportunities and to provide some protection against market uncertainties. Overall, the Group’s funding arrangements are designed to keep an appropriate balance between equity and debt from banks and capital markets, both short and long term, to give flexibility to develop the business.
The Group’s Treasury operations are managed as cost centres and are not permitted to undertake speculative transactions unrelated to underlying financial exposures.
2017 2016US$m US$m
US$ bonds/notes 1,504 1,507HK$ bonds/notes 1,238 1,248HK$ bank loans 555 675S$ bonds/notes 112 139S$ bank loans 364 78RMB bank loans 393 265PHP bank loans – 5THB bank loans 5 –
Gross debt 4,171 3,917Cash 1,622 1,909
Net debt 2,549 2,008
* Before currency swaps
Year-end debt summary*

Hongkong Land16
Financial Review
At 31st December 2017, the Group had total committed lines of approximately US$6.8 billion. Of these lines, 58% were sourced from banks with the remaining 42% from the capital markets. At the end of 2017, the Group had drawn US$4.1 billion of these lines leaving US$2.7 billion of committed, but unused, facilities. Adding the Group’s year end cash balances, the Group had overall liquidity at 31st December 2017 of US$4.3 billion, down from US$4.5 billion at the end of 2016.
Debt profile at 31st December 2017
FundingThe Group is well financed with strong liquidity. Net gearing was 7% at 31st December 2017, up from 6% at the end of 2016. Interest cover, calculated as the underlying operating profits, including the Group’s share of associates and joint ventures’ operating profits, divided by net financing charges including the Group’s share of associates and joint ventures’ net financing charges, was 14.0 times, up from 11.5 times in 2016.
Both Moody’s and Standard & Poor’s have maintained their credit ratings of Hongkong Land Holdings Limited at A3 and A respectively.
During the year, bilateral revolving facilities of US$1.6 billion were signed with a number of banks to refinance facilities expiring in 2017 and the first half of 2018.
The average tenor of the Group’s debt was 5.9 years at 31st December 2017, down from 6.4 years at 2016 year end. Approximately 48% of the Group’s borrowings were at floating rates and the remaining 52% were either fixed rate borrowings or covered by interest rate hedges with major credit worthy financial institutions, broadly in line with the end of 2016.
Net debt as a percentage of equity
Committed facility maturity at 31st December 2017 (US$m)
2013 2014 2015 2016 2017
7%6%11% 10% 8%
Net debt Equity
Interestrate
Currency Maturity
46% >5 years
43% 2-5 years
6% 1-2 years
5% <1 year
9% RMB
76% HK$
15% S$
52% Fixed
48% Floating
2022& beyond
4,455
2018
593
2019
662
2020
308
2021
812

Annual Report 2017 17
Gross assets by activity
Gross assets by location
Gross AssetsThe Group’s gross assets, including its share of joint ventures, (excluding cash balances) is analysed below, by activity and by location.
Principal Risks and UncertaintiesA review of the principal risks and uncertainties facing the Group is set out on page 78.
Accounting PoliciesThe Directors continue to review the appropriateness of the accounting policies adopted by the Group with regard to developments in International Financial Reporting Standards. The accounting policies are consistent with those of the prior year. A number of new standards and amendments, which are effective for accounting periods beginning after 2017, have been published and will be adopted by the Group from their effective dates. The new standard that will have the greatest impact on the Group’s underlying profit from 2018 is IFRS 15, Revenue from Contracts with Customers. The new standard is expected to change the Group’s revenue recognition in Singapore (excluding executive condominiums, which will continue to be recognised on completion), and the Philippines, from completion to percentage of completion, leading to the earlier recognition of revenue.
Simon DixonChief Financial Officer8th March 2018
90% Investment Properties
10% Development Properties
77% Hong Kong
12% Southeast Asia
11% Mainland China and Macau
90% Investment Properties
10% Development Properties
77% Hong Kong
12% Southeast Asia
11% Mainland China and Macau

Hongkong Land18
Ben Keswick* Chairman and Managing Director
Mr Ben Keswick joined the Board as Managing Director in 2012 and became Chairman in 2013. He has held a number of executive positions since joining the Jardine Matheson group in 1998, including finance director and then chief executive officer of Jardine Pacific between 2003 and 2007 and, thereafter, group managing director of Jardine Cycle & Carriage until 2012. He has an MBA from INSEAD. Mr Keswick is chairman of Jardine Matheson Limited and Jardine Cycle & Carriage and a commissioner of Astra. He is also chairman and managing director of Dairy Farm and Mandarin Oriental, managing director of Jardine Matheson and Jardine Strategic, and a director of Jardine Pacific and Jardine Motors.
Robert Wong* Chief Executive
Mr Wong joined the Board as Chief Executive in 2016. He joined the Group in 1985 and has extensive experience in property management and development. As a director of Hongkong Land Limited since 1996, he had prime responsibility for the Group’s residential property business. He is a member of both The Royal Institution of Chartered Surveyors and The Hong Kong Institute of Surveyors.
Simon Dixon* Chief Financial Officer
Mr Dixon joined the Board as Chief Financial Officer in 2016. A Chartered Accountant, he joined the Jardine Matheson group in 2006 from PricewaterhouseCoopers. He was previously finance director of Astra, prior to which he was group treasurer of Jardine Matheson from 2006 to 2010.
Charles Allen-JonesMr Allen-Jones joined the Board in 2001. He was formerly senior partner of Linklaters, where he had been a partner for 33 years until 2001. Mr Allen-Jones is a non-executive director of Jardine Strategic.
Mark GreenbergMr Greenberg joined the Board in 2006. He is group strategy director of Jardine Matheson. He had previously spent 16 years in investment banking with Dresdner Kleinwort Wasserstein in London. He is also a director of Jardine Matheson Limited, Dairy Farm, Jardine Cycle & Carriage and Mandarin Oriental, and a commissioner of Astra and Bank Permata.
Adam KeswickMr Adam Keswick joined the Board in 2012. Having joined Jardine Matheson in 2001, he was appointed to the board in 2007 and was deputy managing director from 2012 to 2016. Mr Keswick is also deputy chairman of Jardine Lloyd Thompson and a director of Dairy Farm, Jardine Strategic and Mandarin Oriental. He is also a director of Ferrari, and a supervisory board member of Rothschild & Co.
Sir Henry KeswickSir Henry first served on the Board of the Group’s holding company between 1970 and 1975 and was re-appointed a Director in 1988. He is chairman of Jardine Matheson, having first joined the group in 1961, and is also chairman of Jardine Strategic. He is a director of Dairy Farm and Mandarin Oriental. He is also vice chairman of the Hong Kong Association.
Simon KeswickMr Simon Keswick has been a Director of the Group’s holding company since 1983. He was Chairman of the Company from 1983 to 1988 and from 1989 to 2013. He joined the Jardine Matheson group in 1962 and is a director of Dairy Farm, Jardine Matheson, Jardine Strategic and Mandarin Oriental.
Dr Richard LeeDr Lee joined the Board in 2003. Dr Lee’s principal business interests are in the manufacturing of textiles and apparel in Southeast Asia, and he is the honorary chairman of TAL Apparel. He is also a director of Jardine Matheson and Mandarin Oriental.
* Executive Director
Directors’ Profiles

Annual Report 2017 19
Anthony NightingaleMr Nightingale joined the Board in 2006 and was Managing Director of the Company from 2006 to 2012. He is also a director of Dairy Farm, Jardine Cycle & Carriage, Jardine Matheson, Jardine Strategic, Mandarin Oriental, Prudential, Schindler, Shui On Land and Vitasoy, and a commissioner of Astra. He is chairman of The Sailors Home and Missions to Seamen in Hong Kong.
Y.K. PangMr Pang has been a Director of the Company since 2007. He was Chief Executive of the Group from 2007 to 2016. He is deputy managing director of Jardine Matheson, chairman of Jardine Pacific, and chairman and chief executive of Jardine Motors. He previously held a number of senior executive positions in the Jardine Matheson group, which he joined in 1984. Mr Pang is also deputy chairman of Jardine Matheson Limited, and a director of Dairy Farm, Jardine Matheson (China), Jardine Strategic, Mandarin Oriental, Yonghui Superstores and Zhongsheng. He is chairman of the General Committee of the Employers’ Federation of Hong Kong and a past chairman of the Hong Kong General Chamber of Commerce.
Lord Powell of Bayswater, KCMG
Lord Powell rejoined the Board in 2008, having first served as a Director between 1992 and 2000. He was previously Private Secretary and adviser on foreign affairs and defence to British Prime Ministers, Baroness Thatcher and Rt Hon John Major. He is a director of LVMH Moët Hennessy Louis Vuitton, Matheson & Co, Mandarin Oriental and Northern Trust Corporation. Previously president of the China-Britain Business Council and chairman of the Singapore-British Business Council, he is currently a British Business Ambassador. He is an independent member of the House of Lords.
Lord Sassoon, Kt
Lord Sassoon joined the Board in 2013. He began his career at KPMG, before joining SG Warburg (later UBS Warburg) in 1985. From 2002 to 2006 he was in the United Kingdom Treasury as a civil servant, where he had responsibility for financial services and enterprise policy. Following this, he chaired the Financial Action Task Force; and conducted a review of the UK’s system of financial regulation. From 2010 to 2013 Lord Sassoon was the first Commercial Secretary to the Treasury and acted as the Government’s Front Bench Treasury spokesman in the House of Lords. He is a director of Dairy Farm, Jardine Lloyd Thompson, Jardine Matheson and Mandarin Oriental. He is also chairman of the China-Britain Business Council.
James WatkinsMr Watkins joined the Board in 2009. He was a director and group general counsel of Jardine Matheson from 1997 to 2003. Mr Watkins qualified as a solicitor in 1969 and was formerly a partner of Linklaters. He is also a director of IL&FS India Realty Fund II, Jardine Cycle & Carriage and Mandarin Oriental.
Percy WeatherallMr Weatherall joined the Board in 1994 and was Managing Director from 2000 to 2006. He first joined the Jardine Matheson group in 1976 and retired from executive office in 2006. He is also a director of Dairy Farm, Jardine Matheson, Jardine Strategic and Mandarin Oriental. He is chairman of Corney & Barrow and the Nith District Salmon Fishery Board.
Michael Wei Kuo WuMr Wu joined the Board in 2012. He is chairman and managing director of Maxim’s Caterers in Hong Kong. He is also a non-executive director of Hang Seng Bank and Jardine Matheson.

Hongkong Land20
2017 2016Underlying
business performance
Non-trading
items Total
Underlying business
performance
Non-trading
items Total
Note US$m US$m US$m US$m US$m US$m
Revenue 5 1,959.8 – 1,959.8 1,993.9 – 1,993.9Net operating costs 6 (1,052.2) – (1,052.2) (1,023.3) – (1,023.3)
907.6 – 907.6 970.6 – 970.6Change in fair value of investment properties 11 – 4,677.9 4,677.9 – 2,549.9 2,549.9Gain on acquisition of a subsidiary 11 – 3.0 3.0 – – –Asset impairment reversals 11 – – – – 1.2 1.2
Operating profit 907.6 4,680.9 5,588.5 970.6 2,551.1 3,521.7
Net financing charges 7
– financing charges (121.3) – (121.3) (110.4) – (110.4) – financing income 43.1 – 43.1 41.5 – 41.5
(78.2) – (78.2) (68.9) – (68.9)Share of results of associates and joint ventures 8
– before change in fair value of investment properties 298.5 – 298.5 117.0 – 117.0 – change in fair value of investment properties 11 – (53.1) (53.1) – (57.9) (57.9)
298.5 (53.1) 245.4 117.0 (57.9) 59.1
Profit before tax 1,127.9 4,627.8 5,755.7 1,018.7 2,493.2 3,511.9Tax 9 (156.8) (1.8) (158.6) (168.1) 0.8 (167.3)
Profit after tax 971.1 4,626.0 5,597.1 850.6 2,494.0 3,344.6
Attributable to:Shareholders of the Company 969.7 4,615.7 5,585.4 847.8 2,498.5 3,346.3Non-controlling interests 1.4 10.3 11.7 2.8 (4.5) (1.7)
971.1 4,626.0 5,597.1 850.6 2,494.0 3,344.6
US¢ US¢ US¢ US¢
Earnings per share (basic and diluted) 10 41.21 237.39 36.03 142.23
Consolidated Profit and Loss Accountfor the year ended 31st December 2017

Annual Report 2017 21
Consolidated Statement of Comprehensive Incomefor the year ended 31st December 2017
2017 2016Note US$m US$m
Profit for the year 5,597.1 3,344.6Other comprehensive income/(expense)
Items that will not be reclassified to profit or loss:Remeasurements of defined benefit plans 2.3 (1.2)Tax on items that will not be reclassified 9 (0.4) 0.2
1.9 (1.0)
Items that may be reclassified subsequently to profit or loss:Net exchange translation differences – net gain/(loss) arising during the year 69.4 (172.1) – transfer to profit and loss 11.2 –
80.6 (172.1)
Revaluation of other investments 51.4 (9.1)Cash flow hedges – net (loss)/gain arising during the year (27.8) 41.8 – transfer to profit and loss (2.8) (2.5)
(30.6) 39.3Tax relating to items that may be reclassified 9 5.1 (6.5)Share of other comprehensive income/(expense) of associates and joint ventures 237.2 (144.9)
343.7 (293.3)
Other comprehensive income/(expense) for the year, net of tax 345.6 (294.3)
Total comprehensive income for the year 5,942.7 3,050.3
Attributable to:Shareholders of the Company 5,925.8 3,055.2Non-controlling interests 16.9 (4.9)
5,942.7 3,050.3

Hongkong Land22
Consolidated Balance Sheetat 31st December 2017
2017 2016Note US$m US$m
Net operating assetsTangible fixed assets 106.9 44.9Investment properties 12 32,481.0 27,712.3Associates and joint ventures 13 5,550.8 4,460.7Other investments 14 103.0 52.2Non-current debtors 15 28.5 60.1Deferred tax assets 16 15.5 8.7Pension assets 0.1 –
Non-current assets 38,285.8 32,338.9
Properties for sale 17 2,534.6 2,217.4Current debtors 15 498.4 480.3Current tax assets 10.6 9.2Bank balances 18 1,622.1 1,908.9
Current assets 4,665.7 4,615.8
Current creditors 19 (1,694.9) (1,490.3)Current borrowings 20 (190.6) (220.7)Current tax liabilities (113.5) (80.0)
Current liabilities (1,999.0) (1,791.0)
Net current assets 2,666.7 2,824.8Long-term borrowings 20 (3,980.3) (3,695.7)Deferred tax liabilities 16 (126.9) (121.5)Pension liabilities – (1.8)Non-current creditors 19 (36.9) (30.3)
36,808.4 31,314.4
Total equityShare capital 21 235.3 235.3Share premium 386.9 386.9Revenue and other reserves 36,151.5 30,672.2
Shareholders' funds 36,773.7 31,294.4Non-controlling interests 34.7 20.0
36,808.4 31,314.4
Approved by the Board of Directors on 8th March 2018
Ben KeswickRobert WongDirectors

Annual Report 2017 23
Consolidated Statement of Changes in Equityfor the year ended 31st December 2017
Share capital
Share premium
Revenue reserves
Hedging reserves
Exchange reserves
Attributable to shareholders
of the Company
Attributable to non-
controlling interests
Total equity
Note US$m US$m US$m US$m US$m US$m US$m US$m
2017At 1st January 235.3 386.9 31,093.6 18.6 (440.0) 31,294.4 20.0 31,314.4Total comprehensive income – – 5,638.7 (26.3) 313.4 5,925.8 16.9 5,942.7Dividends paid by the Company 22 – – (447.0) – – (447.0) – (447.0)Dividends paid to non-controlling shareholders – – – – – – (2.2) (2.2)Unclaimed dividends forfeited – – 0.5 – – 0.5 – 0.5
At 31st December 235.3 386.9 36,285.8 (7.7) (126.6) 36,773.7 34.7 36,808.4
2016At 1st January 235.3 386.9 28,205.8 (9.1) (133.9) 28,685.0 35.4 28,720.4Total comprehensive income – – 3,336.2 27.7 (308.7) 3,055.2 (4.9) 3,050.3Dividends paid by the Company 22 – – (447.0) – – (447.0) – (447.0)Dividends paid to non-controlling shareholders – – – – – – (4.2) (4.2)Unclaimed dividends forfeited – – 0.5 – – 0.5 – 0.5Change in interests in subsidiaries – – (1.9) – 2.6 0.7 (6.3) (5.6)
At 31st December 235.3 386.9 31,093.6 18.6 (440.0) 31,294.4 20.0 31,314.4
Total comprehensive income included in revenue reserves mainly comprises profit attributable to shareholders of the Company of US$5,585.4 million (2016: US$3,346.3 million) and a fair value gain on other investments of US$51.4 million (2016: loss of US$9.1 million). The cumulative fair value gain on other investments amounted to US$65.8 million (2016: US$14.4 million).

Hongkong Land24
Consolidated Cash Flow Statementfor the year ended 31st December 2017
2017 2016Note US$m US$m
Operating activitiesOperating profit 5,588.5 3,521.7Depreciation 6 3.0 3.1Reversal of writedowns on properties for sale 6 – (3.2)Change in fair value of investment properties 12 (4,677.9) (2,549.9)Gain on acquisition of a subsidiary (3.0) –Asset impairment reversals – (1.2)(Increase)/decrease in properties for sale (69.7) 392.4Decrease/(increase) in debtors 26.7 (131.7)Increase/(decrease) in creditors 51.3 (7.5)Interest received 41.9 36.4Interest and other financing charges paid (117.8) (111.4)Tax paid (137.2) (140.6)Dividends from associates and joint ventures 94.4 88.1
Cash flows from operating activities 800.2 1,096.2
Investing activitiesMajor renovations expenditure (108.2) (91.3)Developments capital expenditure (105.5) (148.2)Acquisition of a subsidiary (42.6) –Investments in and advances to associates and joint ventures (670.5) (1.4)Payment of deposit for a joint venture (20.1) (4.2)
Cash flows from investing activities (946.9) (245.1)
Financing activitiesDrawdown of borrowings 825.1 266.7Repayment of borrowings (586.1) (240.6)Dividends paid by the Company (443.4) (443.8)Dividends paid to non-controlling shareholders (3.8) (4.2)Change in interests in subsidiaries 15.0 (20.2)
Cash flows from financing activities (193.2) (442.1)
Net cash (outflow)/inflow (339.9) 409.0Cash and cash equivalents at 1st January 1,898.4 1,565.9Effect of exchange rate changes 58.1 (76.5)
Cash and cash equivalents at 31st December 23 1,616.6 1,898.4

Annual Report 2017 25
Notes to the Financial Statements
1 Principal Accounting PoliciesBasis of preparation
The financial statements have been prepared in accordance with International Financial Reporting Standards (‘IFRS’), including International Accounting Standards (‘IAS’) and Interpretations adopted by the International Accounting Standards Board. The financial statements have been prepared on a going concern basis and under the historical cost convention except as disclosed in the accounting policies below.
There are no new standards or amendments, which are effective in 2017 and relevant to the Group’s operations, that have a material impact on the Group’s accounting policies and disclosures.
New standards and amendments effective after 2017 which are relevant to the Group’s operations and yet to be adopted
A number of new standards and amendments, which are effective for accounting periods beginning after 2017, have been published and will be adopted by the Group from their effective dates. The Group’s assessment of the impact of these standards and amendments is set out below.
IFRS 9 Financial Instruments (effective from 1st January 2018) The standard replaces IAS 39 ‘Financial Instruments: Recognition and Measurement’, addresses the classification, measurement and derecognition of financial assets and liabilities, and includes a new expected credit losses model for financial assets that replaces the incurred loss impairment model used today. A substantially-reformed approach to hedging accounting is introduced.
The Group does not expect the new guidance to have a significant impact on the classification and measurement of its financial assets and financial liabilities. At 31st December 2017, the Group had investments in equity securities classified as available-for-sale with a fair value of US$103 million. Under IFRS 9, the gains and losses arising from changes in fair value of these investments will be recognised in profit and loss, instead of through other comprehensive income. Such fair value gains or losses on revaluation of these investments will be classified as non-trading items. The above change will not have any impact on the Group’s underlying profit attributable to shareholders and shareholders funds. The Group’s profit attributable to shareholders for the year ended 31st December 2017 would increase by US$51 million.
The new hedge accounting rules will align the accounting for hedging instruments closely with the Group’s risk management practices. The Group does not expect a significant impact on the accounting for its hedging relationships.
IFRS 15 Revenue from Contracts with Customers (effective from 1st January 2018) The standard establishes a comprehensive framework for the recognition of revenue. It replaces IAS 11 ‘Construction Contracts’ and IAS 18 ‘Revenue’ which covers contracts for goods and services. The core principle in the framework is that revenue is recognised when control of a good or service transfers to a customer. The new standard will change the Group’s revenue recognition on certain property sales from completion method to percentage of completion method. This will lead to earlier recognition of revenue when compared to the current completion method.
Based on the Group’s assessment, it is estimated that the change in the above property sale recognition method will reduce the Group’s underlying profit attributable to shareholders for the year ended 31st December 2017 by about 2% but will increase the Group’s shareholders’ funds as at 1st January 2018 by about 0.2%.
IFRS 16 Leases (effective from 1st January 2019) The standard replaces IAS 17 ‘Leases’ and related interpretations. It will result in lessees bringing almost all their leases onto the balance sheet as the distinction between operating leases and finance leases is removed. The model requires a lessee to recognise a right-of-use asset and a lease liability, except for leases with a term of less than 12 months or with low-value. IFRS 16 will affect primarily the accounting for the Group’s operating leases. As at 31st December 2017, the Group had total commitments under operating leases of US$10 million (refer Note 25). The accounting for lessors will not change significantly. The impact of IFRS 16 on the Group businesses is expected to be insignificant.
Apart from the above, there are no other standards or amendments that are not yet effective and that would be expected to have a material impact to the Group.
The principal operating subsidiaries, associates and joint ventures have different functional currencies in line with the economic environments of the locations in which they operate. The functional currency of the Company is United States dollars. The consolidated financial statements are presented in United States dollars.
The Group’s reportable segments are set out in Note 4.

Hongkong Land26
Notes to the Financial Statements
1 Principal Accounting Policies continued
Basis of consolidation
i) The consolidated financial statements include the financial statements of the Company, its subsidiaries, and the Group’s interests in associates and joint ventures.
ii) A subsidiary is an entity over which the Group has control. The Group controls an entity when the Group is exposed to, or has rights to, variable returns from its involvement with the entity and has the ability to affect those returns through its power over the entity.
The purchase method of accounting is used to account for the acquisition of subsidiaries by the Group. The cost of an acquisition includes the fair value at the acquisition date of any contingent consideration. The Group recognises the non-controlling interest’s proportionate share of the recognised identifiable net assets of the acquired subsidiary. In a business combination achieved in stages, the Group remeasures its previously held interest in the acquiree at its acquisition-date fair value and recognises the resulting gain or loss in profit and loss. Changes in a parent’s ownership interest in a subsidiary that do not result in the loss of control are accounted for as equity transactions. When control over a previous subsidiary is lost, any remaining interest in the entity is remeasured at fair value and the resulting gain or loss is recognised in profit and loss.
All material intercompany transactions, balances and unrealised surpluses and deficits on transactions between Group companies have been eliminated.
iii) An associate is an entity, not being a subsidiary or joint venture, over which the Group exercises significant influence. A joint venture is a type of joint arrangement whereby the parties that have joint control of the arrangement have rights to the net assets of the joint venture. Joint control is the contractually agreed sharing of control of an arrangement, which exists only when decisions about the relevant activities require unanimous consent of the parties sharing control.
Associates and joint ventures are included on the equity basis of accounting.
Profits and losses resulting from upstream and downstream transactions between the Group and its associates and joint ventures are recognised in the consolidated financial statements only to the extent of unrelated investor’s interests in the associates and joint ventures.
iv) Non-controlling interests represent the proportion of the results and net assets of subsidiaries and their associates and joint ventures not attributable to the Group.
v) The results of subsidiaries, associates and joint ventures are included or excluded from their effective dates of acquisition or disposal respectively. The results of entities other than subsidiaries, associates and joint ventures are included to the extent of dividends received when the right to receive such dividend is established.
Foreign currencies
Transactions in foreign currencies are accounted for at the exchange rates ruling at the transaction dates.
Assets and liabilities of subsidiaries, associates and joint ventures, together with all other monetary assets and liabilities expressed in foreign currencies, are translated into United States dollars at the rates of exchange ruling at the year end. Results expressed in foreign currencies are translated into United States dollars at the average rates of exchange ruling during the year, which approximate the exchange rates at the dates of the transactions.
Exchange differences arising from the retranslation of the net investment in foreign subsidiaries, associates and joint ventures, and of financial instruments which are designated as hedges of such investments, are recognised in other comprehensive income and accumulated in equity under exchange reserves. On the disposal of these investments, such exchange differences are recognised in profit and loss. Exchange differences on available-for-sale investments are recognised in other comprehensive income as part of the gains and losses arising from changes in their fair value. Exchange differences relating to changes in the amortised cost of monetary securities classified as available-for-sale and all other exchange differences are recognised in profit and loss.
Goodwill and fair value adjustments arising on acquisition of a foreign entity after 1st January 2003 are treated as assets and liabilities of the foreign entity and translated into United States dollars at the rate of exchange ruling at the year end.
Annual Report 2017 27
1 Principal Accounting Policies continued
Impairment of non-financial assets
Assets that have indefinite useful lives are not subject to amortisation and are tested for impairment annually and whenever there is an indication that the assets may be impaired. Assets that are subject to amortisation are reviewed for impairment whenever events or changes in circumstances indicate that the carrying amount may not be recoverable. For the purpose of assessing impairment, assets are grouped at the lowest level for which there is separately identifiable cash flows. Cash-generating units or groups of cash-generating units to which goodwill has been allocated are tested for impairment annually and whenever there is an indication that the units may be impaired. An impairment loss is recognised for the amount by which the carrying amount of the asset exceeds its recoverable amount, which is the higher of an asset’s fair value less costs to sell and value in use. Non-financial assets other than goodwill that suffered an impairment are reviewed for possible reversal of the impairment annually.
Goodwill
Goodwill represents the excess of the sum of the consideration transferred, the amount of any non-controlling interests in the acquiree, and the acquisition-date fair value of any previously held equity interest in the acquiree over the acquisition-date fair value of the Group’s share of the net identifiable assets acquired. Non-controlling interests are measured at their proportionate share of the net identifiable assets at the acquisition date. If the cost of acquisition is less than the fair value of the net assets acquired, the difference is recognised directly in profit and loss. Goodwill on acquisitions of subsidiaries is included in intangible assets. Goodwill on acquisitions of associates and joint ventures is included in investment in associates and joint ventures. Goodwill is allocated to cash-generating units or groups of cash-generating units for the purpose of impairment testing and is carried at cost less accumulated impairment loss.
The profit or loss on disposal of subsidiaries, associates and joint ventures is stated after deducting the carrying amount of goodwill relating to the entity sold.
Leasehold land
Leasehold land represents payments to third parties to acquire short-term interests in property. These payments are stated at cost and are amortised over the useful life of the lease which includes the renewal period if the lease can be renewed by the Group without significant cost.
Tangible fixed assets and depreciation
Long-term interests in leasehold land are classified as finance leases and grouped under tangible fixed assets if substantially all risks and rewards relating to the land have been transferred to the Group, and are amortised over the useful life of the lease. Grants related to tangible assets are deducted in arriving at the carrying amount of the assets. The building component of owner-occupied leasehold properties are stated at cost less accumulated depreciation and impairment. Other tangible fixed assets are stated at cost less amounts provided for depreciation.
Depreciation of tangible fixed assets is calculated on the straight line basis to allocate the cost or valuation of each asset to its residual value over its estimated useful life. The residual values and useful lives are reviewed at each balance sheet date. The estimated useful lives are as follows:
Furniture, equipment and motor vehicles 3 – 10 yearsLeasehold land period of the lease
Where the carrying amount of a tangible fixed asset is greater than its estimated recoverable amount, it is written down immediately to its recoverable amount.
The profit or loss on disposal of tangible fixed assets is recognised by reference to their carrying amount.
Hongkong Land28
Notes to the Financial Statements
1 Principal Accounting Policies continued
Investment properties
Properties including those under operating leases which are held for long-term rental yields or capital gains are classified and accounted for as investment properties, but the business model does not necessarily envisage that the properties will be held for their entire useful life. Investment properties are carried at fair value, representing estimated open market value determined annually by independent qualified valuers who have recent experience in the location and category of the investment property being valued. The market value of commercial properties are calculated on the discounted net rental income allowing for reversionary potential. The market value of residential properties are arrived at by reference to market evidence of transaction prices for similar properties. Changes in fair value are recognised in profit and loss.
Investments
Investments are classified by management as available for sale or held to maturity on initial recognition. Available-for-sale investments are shown at fair value. Gains and losses arising from changes in the fair value are recognised in other comprehensive income and accumulated in equity. On the disposal of an investment or when an investment is determined to be impaired, the cumulative gain or loss previously deferred in equity is recognised in profit and loss. Held-to-maturity investments are shown at amortised cost. Investments are classified under non-current assets unless they are expected to be realised within 12 months after the balance sheet date.
At each balance sheet date, the Group assesses whether there is objective evidence that an investment is impaired. In the case of equity securities classified as available for sale, a significant or prolonged decline in the fair value of the security below its cost is considered as an indicator that the securities are impaired and are recognised in profit and loss.
All purchases and sales of investments are recognised on the trade date, which is the date that the Group commits to purchase or sell the investment.
Leases
Leases are classified as finance leases when the terms of the lease transfer substantially all the risks and rewards of ownership to the lessee. All other leases are classified as operating leases.
Payments made under operating leases (net of any incentives received from the lessor) are charged to profit and loss on a straight line basis over the period of the lease. When a lease is terminated before the lease period has expired, any payment required to be made to the lessor by way of penalty is recognised as an expense in the year in which termination takes place.
Properties for sale
Properties for sale, which comprise land and buildings held for resale, are stated at the lower of cost and net realisable value. The cost of properties for sale comprises land cost, and construction and other development costs.
Debtors
Debtors, excluding derivative financial instruments, are measured at amortised cost except where the effect of discounting would be immaterial. Provision for impairment is established when there is objective evidence that the outstanding amounts will not be collected. Significant financial difficulties of the debtor, probability that the debtor will enter bankruptcy or financial reorganisation, and default or delinquency in payments are considered indicators that the debtor is impaired. The carrying amount of the asset is reduced through the use of an allowance account and the amount of the loss is recognised in arriving at operating profit. When a debtor is uncollectible, it is written off against the allowance account. Subsequent recoveries of amount previously written off are credited to profit and loss.
Debtors with maturities greater than 12 months after the balance sheet date are classified under non-current assets.
Cash and cash equivalents
For the purposes of the cash flow statement, cash and cash equivalents comprise deposits with banks and financial institutions, and bank and cash balances, net of bank overdrafts. In the balance sheet, bank overdrafts are included in current borrowings.

Annual Report 2017 29
1 Principal Accounting Policies continued
Provisions
Provisions are recognised when the Group has present legal or constructive obligations as a result of past events, it is probable that an outflow of resources embodying economic benefits will be required to settle the obligations, and a reliable estimate of the amount of the obligations can be made.
Borrowings and borrowing costs
Borrowings are initially recognised at fair value, net of transaction costs incurred. In subsequent periods, borrowings are stated at amortised cost using the effective interest method.
Borrowing costs relating to major development projects are capitalised until the asset is substantially completed. Capitalised borrowing costs are included as part of the cost of the asset. All other borrowing costs are expensed as incurred.
Borrowings are classified as current liabilities unless the Group has an unconditional right to defer settlement of the liability for at least 12 months after the balance sheet date.
Current and deferred tax
The tax expense for the year comprises current and deferred tax. Tax is recognised in profit and loss, except to the extent that it relates to items recognised in other comprehensive income or direct in equity. In this case, the tax is also recognised in other comprehensive income or directly in equity, respectively.
The current income tax charge is calculated on the basis of the tax laws enacted or substantively enacted at the balance sheet date in the countries where the Group operates and generates taxable income. Management periodically evaluates positions taken in tax returns with respect to situations in which applicable tax regulation is subject to interpretation. It establishes provisions where appropriate on the basis of amounts expected to be paid to the tax authorities.
Deferred tax is provided, using the liability method, for all temporary differences arising between the tax bases of assets and liabilities and their carrying values. Deferred tax is determined using tax rates and laws that have been enacted or substantially enacted by the balance sheet date and are expected to apply when the related deferred tax asset is realised or the deferred tax liability is settled.
Provision for deferred tax is made on the revaluation of certain non-current assets and, in relation to acquisitions, on the difference between the fair value of the net assets acquired and their tax base. Deferred tax is provided on temporary differences associated with investments in subsidiaries, associates and joint ventures, except where the Group is able to control the reversal of the temporary difference and it is probable that the temporary difference will not reverse in the foreseeable future. Deferred tax assets relating to the carry forward of unused tax losses are recognised to the extent that it is probable that future taxable profit will be available against which the unused tax losses can be utilised.
Pension obligations
The Group operates a number of defined benefit and defined contribution plans, the assets of which are held in trustee administered funds.
Pension accounting costs for defined benefit plans are assessed using the projected unit credit method. Under this method, the costs of providing pensions are charged to profit and loss spreading the regular cost over the service lives of employees in accordance with the advice of qualified actuaries, who carry out a full valuation of major plans every year. The pension obligations are measured as the present value of the estimated future cash outflows by reference to market yields on high quality corporate bonds which have terms to maturity approximating the terms of the related liability. Plan assets are measured at fair value.
Actuarial gains and losses arising from experience adjustments and changes in actuarial assumptions are recognised in other comprehensive income in the year in which they occur. Past service costs are recognised immediately in profit and loss.
The Group’s total contributions relating to the defined contribution plans are charged to profit and loss in the year to which they relate.

Hongkong Land30
Notes to the Financial Statements
1 Principal Accounting Policies continued
Derivative financial instruments
The Group only enters into derivative financial instruments in order to hedge underlying exposures. Derivative financial instruments are initially recognised at fair value on the date a derivative contract is entered into and are subsequently remeasured at their fair value. The method of recognising the resulting gain or loss is dependent on the nature of the item being hedged. The Group designates certain derivatives as a hedge of the fair value of a recognised asset or liability (fair value hedge), or a hedge of a forecast transaction or of the foreign currency risk on a firm commitment (cash flow hedge), or a hedge of a net investment in a foreign entity.
Changes in the fair value of derivatives that are designated and qualify as fair value hedges and that are highly effective, are recognised in profit and loss, along with any changes in the fair value of the hedged asset or liability that is attributable to the hedged risk. When a hedging instrument expires or is sold, or when a hedge no longer meets the criteria for hedge accounting, the cumulative adjustment to the carrying amount of a hedged item for which the effective interest method is used is amortised to profit and loss over the residual period to maturity.
Changes in the fair value of derivatives that are designated and qualify as cash flow hedges and that are highly effective, are recognised in other comprehensive income and accumulated in equity under hedging reserves. Changes in the fair value relating to the ineffective portion is recognised immediately in profit and loss. Where the forecast transaction or firm commitment results in the recognition of a non-financial asset or of a non-financial liability, the gains and losses previously deferred in hedging reserves are transferred from hedging reserves and included in the initial measurement of the cost of the asset or liability. Otherwise, amounts deferred in hedging reserves are transferred to profit and loss in the same periods during which the hedged firm commitment or forecast transaction affects profit and loss. When a hedging instrument expires or is sold, or when a hedge no longer meets the criteria for hedge accounting, any cumulative gain or loss existing in hedging reserves at that time remains in the hedging reserves and is recognised when the committed or forecast transaction ultimately is recognised in profit and loss. When a committed or forecast transaction is no longer expected to occur, the cumulative gain or loss that was reported in hedging reserves is immediately transferred to profit and loss.
Certain derivative transactions, while providing effective economic hedges under the Group’s risk management policies, do not qualify for hedge accounting under the specific rules in IAS 39. Changes in the fair value of any derivative instruments that do not qualify for hedge accounting under IAS 39 are recognised immediately in profit and loss.
Hedges of net investments in foreign entities are accounted for on a similar basis to that used for cash flow hedges. Any gain or loss on the hedging instrument relating to the effective portion of the hedge is recognised in other comprehensive income and accumulated in exchange reserves; the gain or loss relating to the ineffective portion is recognised immediately in profit and loss.
The fair value of derivatives which are designated and qualify as effective hedges are classified as non-current assets or liabilities if the remaining maturities of the hedged assets or liabilities are greater than 12 months after the balance sheet date.
Offsetting financial instruments
Financial assets and liabilities are offset and the net amount reported in the balance sheet when there is a legally enforceable right to offset the recognised amounts and there is an intention to settle on a net basis or realise the asset and settle the liability simultaneously. The legally enforceable right must not be contingent on future events and must be enforceable in the normal course of business and in the event of default, insolvency or bankruptcy of the company or the counterparty.
Annual Report 2017 31
1 Principal Accounting Policies continued
Non-trading items
Non-trading items are separately identified to provide greater understanding of the Group’s underlying business performance. Items classified as non-trading items include fair value gains or losses on revaluation of investment properties; gains and losses arising from the sale of businesses, investments and investment properties; impairment of non-depreciable intangible assets and other investments; provisions for the closure of businesses; acquisition-related costs in business combinations; and other credits and charges of a non-recurring nature that require inclusion in order to provide additional insight into underlying business performance.
Earnings per share
Earnings per share are calculated on profit attributable to shareholders and on the weighted average number of shares in issue during the year.
Dividends
Dividends proposed or declared after the balance sheet date are not recognised as a liability at the balance sheet date.
Revenue recognition
Revenue is measured at the fair value of the consideration received and receivable and represents amounts receivable for goods and services provided in the normal course of business, net of discounts and sales related taxes.
i) Revenue from sale of properties is recognised on the transfer of significant risks and rewards of ownership, which generally coincides with the time when the properties are delivered to customers.
ii) Receipts under operating leases are accounted for on an accrual basis over the lease terms.
iii) Revenue from rendering of services is recognised when services are performed, provided that the amount can be measured reliably.
iv) Dividend income is recognised when the right to receive payment is established.
v) Interest income is recognised on a time proportion basis taking into account the principal amounts outstanding and the interest rates applicable.
Pre-operating costs
Pre-operating costs are expensed as they are incurred.
2 Financial Risk ManagementFinancial risk factors
The Group’s activities expose it to a variety of financial risks: market risk (including foreign exchange risk, interest rate risk and price risk), credit risk and liquidity risk.
The Group’s treasury function co-ordinates, under the directions of the board of Hongkong Land Limited, financial risk management policies and their implementation on a group-wide basis. The Group’s treasury policies are designed to manage the financial impact of fluctuations in interest rates and foreign exchange rates and to minimise the Group’s financial risks. The Group uses derivative financial instruments, principally interest rate swaps, cross-currency swaps and forward foreign exchange contracts as appropriate for hedging transactions and managing the Group’s assets and liabilities in accordance with the Group’s financial risk management policies. Financial derivative contracts are executed between third party banks and the Group entity that is directly exposed to the risk being hedged. Certain derivative transactions, while providing effective economic hedges under the Group’s risk management policies, do not qualify for hedge accounting under the specific rules in IAS 39. Changes in the fair value of any derivative instruments that do not qualify for hedge accounting under IAS 39 are recognised immediately in profit and loss account. It is the Group’s policy not to enter into derivative transactions for speculative purposes. The notional amounts and fair values of derivative financial instruments at 31st December 2017 are disclosed in Note 24.

Hongkong Land32
Notes to the Financial Statements
2 Financial Risk Management continued
Financial risk factors continued
i) Market risk
Foreign exchange risk Entities within the Group are exposed to foreign exchange risk from future commercial transactions, net investments
in foreign operations and net monetary assets and liabilities that are denominated in a currency that is not the entity’s functional currency.
Entities in the Group use cross-currency swaps and forward foreign exchange contracts in a consistent manner to hedge firm and anticipated foreign exchange commitments and manage their foreign exchange risk arising from future commercial transactions. The Group does not usually hedge its net investments in foreign operations except in circumstances where there is a material exposure arising from a currency that is anticipated to be volatile and the hedging is cost effective. Group entities are required to manage their foreign exchange risk against their functional currency. Foreign currency borrowings are swapped into the entity’s functional currency using cross-currency swaps except where the foreign currency borrowings are repaid with cash flows generated in the same foreign currency. The purpose of these hedges is to mitigate the impact of movements in foreign exchange rates on assets and liabilities and the profit and loss account of the Group.
Currency risks as defined by IFRS 7 arise on account of monetary assets and liabilities being denominated in a currency that is not the functional currency. At 31st December 2017, there are no significant monetary balances held by group companies that are denominated in a non-functional currency other than the cross-currency swap contracts with contract amounts of US$1,648 million (2016: US$1,637 million). Differences resulting from the translation of financial statements into the Group’s presentation currency are not taken into consideration.
Since the Group manages the interdependencies between foreign exchange risk and interest rate risk of foreign currency borrowings using cross-currency swaps, the sensitivity analysis on financial impacts arising from cross-currency swaps is included in the sensitivity assessment on interest rates under the interest rate risk section.
Interest rate risk The Group is exposed to interest rate risk through the impact of rate changes on interest bearing liabilities and assets.
These exposures are managed partly by using natural hedges that arise from offsetting interest rate sensitive assets and liabilities, and partly through fixed rate borrowings and the use of derivative financial instruments such as interest rate swaps. The Group monitors interest rate exposure on a monthly basis by currency and business unit, taking into consideration proposed financing and hedging arrangements. The Group’s guideline is to maintain 40% to 60% of its gross borrowings in fixed rate instruments. At 31st December 2017, the Group’s interest rate hedge was 52% (2016: 56%) with an average tenor of seven years (2016: eight years). The interest rate profile of the Group’s borrowings after taking into account hedging transactions are set out in Note 20.
Cash flow interest rate risk is the risk that changes in market interest rates will impact cash flows arising from variable rate financial instruments. Borrowings at floating rates therefore expose the Group to cash flow interest rate risk. The Group manages this risk by using forward rate agreements to a maturity of one year, and by entering into interest rate swaps for a maturity of generally up to five years or longer to match the maturity of the underlying exposure. Forward rate agreements and interest rate swaps have the economic effect of converting borrowings from floating rates to fixed rates.
Fair value interest rate risk is the risk that the value of a financial asset or liability and derivative financial instrument will fluctuate because of changes in market interest rates. The Group manages its fair value interest rate risk by entering into interest rate swaps which have the economic effect of converting borrowings from fixed rates to floating rates, to maintain the Group’s fixed rate instruments within the Group’s guideline.

Annual Report 2017 33
2 Financial Risk Management continued
Financial risk factors continued
i) Market risk continued
Interest rate risk continued At 31st December 2017, if interest rates had been 100 basis points higher/lower with all other variables held constant, the
Group’s profit after tax would have been US$3 million (2016: US$8 million) higher/lower and hedging reserve would have been US$55 million (2016: US$59 million) higher/lower, as a result of fair value changes to cash flow hedges. The sensitivity analysis has been determined assuming that the change in interest rates had occurred at the balance sheet date and had been applied to the exposure to interest rate risk for both derivative and non-derivative financial instruments in existence at that date. The 100 basis point increase or decrease represents management’s assessment of a reasonably possible change in those interest rates which have the most impact on the Group, specifically the United States, Hong Kong, mainland China and Singapore rates, over the period until the next annual balance sheet date. In the case of effective fair value hedges, changes in fair value of the hedged item caused by interest rate movements balance out in profit and loss account against changes in the fair value of the hedging instruments. Changes in market interest rates affect the interest income or expense of non-derivative variable-interest financial instruments, the interest payments of which are not designated as hedged items of cash flow hedges against interest rate risks. As a consequence, they are included in the calculation of profit after tax sensitivities. Changes in the market interest rate of financial instruments that were designated as hedging instruments in a cash flow hedge to hedge payment fluctuations resulting from interest rate movements affect the hedging reserves and are therefore taken into consideration in the equity-related sensitivity calculations.
Price risk The Group is exposed to securities price risk because of listed investments which are available for sale and held by the
Group at fair value. Gains and losses arising from changes in the fair value of available-for-sale investments are recognised in other comprehensive income. The performance of the Group’s listed and unlisted available-for-sale investments are monitored regularly, together with an assessment of their relevance to the Group’s long term strategic plans. Details of the Group’s available-for-sale investments are contained in Note 14.
Available-for-sale investments are unhedged. At 31st December 2017, if the price of listed available-for-sale investments had been 25% higher/lower with all other variables held constant, total equity would have been US$26 million (2016: US$13 million) higher/lower unless impaired. The sensitivity analysis has been determined based on a reasonable expectation of possible valuation volatility over the next 12 months.
ii) Credit risk
The Group’s credit risk is primarily attributable to deposits with banks, credit exposures to customers and derivative financial instruments with a positive fair value. The Group has credit policies in place and the exposures to these credit risks are monitored on an ongoing basis.
The Group manages its deposits with banks and financial institutions and transactions involving derivative financial instruments by monitoring credit ratings and capital adequacy ratios of counterparties, and limiting the aggregate risk to any individual counterparty. The utilisation of credit limits is regularly monitored. At 31st December 2017, 98% (2016: 83%) of deposits and balances with banks and financial institutions were made to institutions with Moody’s credit ratings of no less than A3, 1% (2016: 11%) at Baa1 and 1% (2016: 6%) at Baa2 or below. Similarly transactions involving derivative financial instruments are with banks with sound credit ratings and capital adequacy ratios. In developing countries it may be necessary to deposit money with banks that have a lower credit rating, however the Group only enters into derivative transactions with counterparties which have credit ratings of at least investment grade. Management does not expect any counterparty to fail to meet its obligations.
In respect of credit exposures to customers, the Group has policies in place to ensure that investment properties are leased principally to corporate companies with appropriate credit history, and rental deposits in the form of cash or bank guarantee are usually received from tenants. The Group receives progress payments from sales of residential properties to individual customers prior to the completion of transactions. In the event of default by customers, the Group undertakes legal proceedings to recover the property. Amounts due from associates and joint ventures are generally supported by the underlying assets.
The maximum exposure to credit risk is represented by the carrying amount of each financial asset in the balance sheet after deducting any impairment allowance.

Hongkong Land34
Notes to the Financial Statements
2 Financial Risk Management continued
Financial risk factors continued
iii) Liquidity risk
Prudent liquidity risk management includes managing the profile of debt maturities and funding sources, maintaining sufficient cash and marketable securities, and ensuring the availability of funding from an adequate amount of committed credit facilities and the ability to close out market positions. The Group's ability to fund its existing and prospective debt requirements is managed by maintaining diversified funding sources with adequate committed funding lines from high quality lenders, and by monitoring rolling short-term forecasts of the Group’s cash and gross debt on the basis of expected cash flows. In addition long-term cash flows are projected to assist with the Group’s long-term debt financing plans.
At 31st December 2017, total committed and uncommitted borrowing facilities amounted to US$7,040 million (2016: US$6,662 million) of which US$4,171 million (2016: US$3,917 million) was drawn down. Undrawn committed facilities, in the form of revolving credit and term loan facilities, totalled US$2,658 million (2016: US$2,607 million).
The following table analyses the Group’s non-derivative financial liabilities, net-settled derivative financial liabilities and gross-settled financial instruments into relevant maturity groupings based on the remaining period at the balance sheet date to the contractual maturity date. Derivative financial liabilities are included in the analysis if their contractual maturities are essential for an understanding of the timing of the cash flows. The amounts disclosed in the table are the contractual undiscounted cash flows.
Within one year
Between one and
two years
Between two and
three years
Between three and
four years
Between four and
five yearsBeyond
five years
Total undiscounted
cash flowsUS$m US$m US$m US$m US$m US$m US$m
2017Borrowings 395.4 452.6 518.1 546.4 1,149.2 2,160.2 5,221.9Creditors 645.8 12.2 6.5 0.2 0.2 3.0 667.9Gross settled derivative financial instruments – inflow 73.9 150.2 132.4 68.0 556.3 1,097.9 2,078.7 – outflow 65.0 145.0 128.2 60.5 544.8 1,088.5 2,032.0
2016Borrowings 374.0 486.5 559.2 474.7 240.8 2,788.6 4,923.8Creditors 508.9 8.9 10.3 1.7 0.2 3.3 533.3Gross settled derivative financial instruments – inflow 74.0 74.0 150.9 132.9 68.0 1,655.0 2,154.8 – outflow 63.6 63.6 137.7 122.1 59.4 1,643.9 2,090.3
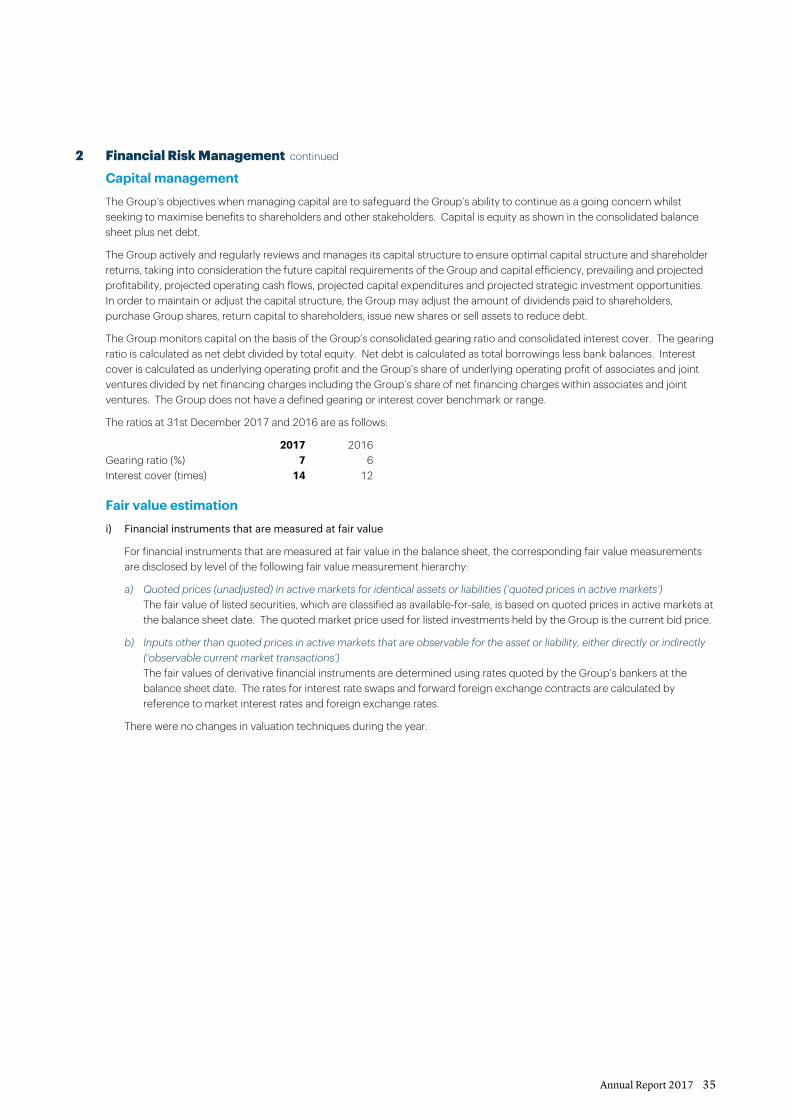
Annual Report 2017 35
2 Financial Risk Management continued
Capital management
The Group’s objectives when managing capital are to safeguard the Group’s ability to continue as a going concern whilst seeking to maximise benefits to shareholders and other stakeholders. Capital is equity as shown in the consolidated balance sheet plus net debt.
The Group actively and regularly reviews and manages its capital structure to ensure optimal capital structure and shareholder returns, taking into consideration the future capital requirements of the Group and capital efficiency, prevailing and projected profitability, projected operating cash flows, projected capital expenditures and projected strategic investment opportunities. In order to maintain or adjust the capital structure, the Group may adjust the amount of dividends paid to shareholders, purchase Group shares, return capital to shareholders, issue new shares or sell assets to reduce debt.
The Group monitors capital on the basis of the Group’s consolidated gearing ratio and consolidated interest cover. The gearing ratio is calculated as net debt divided by total equity. Net debt is calculated as total borrowings less bank balances. Interest cover is calculated as underlying operating profit and the Group’s share of underlying operating profit of associates and joint ventures divided by net financing charges including the Group’s share of net financing charges within associates and joint ventures. The Group does not have a defined gearing or interest cover benchmark or range.
The ratios at 31st December 2017 and 2016 are as follows:
2017 2016Gearing ratio (%) 7 6Interest cover (times) 14 12
Fair value estimation
i) Financial instruments that are measured at fair value
For financial instruments that are measured at fair value in the balance sheet, the corresponding fair value measurements are disclosed by level of the following fair value measurement hierarchy:
a) Quoted prices (unadjusted) in active markets for identical assets or liabilities (‘quoted prices in active markets’) The fair value of listed securities, which are classified as available-for-sale, is based on quoted prices in active markets at
the balance sheet date. The quoted market price used for listed investments held by the Group is the current bid price.
b) Inputs other than quoted prices in active markets that are observable for the asset or liability, either directly or indirectly (‘observable current market transactions’)
The fair values of derivative financial instruments are determined using rates quoted by the Group’s bankers at the balance sheet date. The rates for interest rate swaps and forward foreign exchange contracts are calculated by reference to market interest rates and foreign exchange rates.
There were no changes in valuation techniques during the year.

Hongkong Land36
Notes to the Financial Statements
2 Financial Risk Management continued
Fair value estimation continued
i) Financial instruments that are measured at fair value continued
The table below analyses financial instruments carried at fair value, by the levels in the fair value measurement hierarchy.
Quoted prices in
active markets
Observable current market
transactions TotalUS$m US$m US$m
2017AssetsAvailable-for-sale financial assets – listed securities 103.0 – 103.0Derivative designated at fair value – through other comprehensive income – 4.8 4.8 – through profit and loss – 9.7 9.7
103.0 14.5 117.5
LiabilitiesDerivative designated at fair value – through other comprehensive income – (7.7) (7.7) – through profit and loss – (8.6) (8.6)
– (16.3) (16.3)
2016AssetsAvailable-for-sale financial assets – listed securities 52.2 – 52.2Derivative designated at fair value – through other comprehensive income – 28.0 28.0 – through profit and loss – 16.5 16.5
52.2 44.5 96.7
LiabilitiesDerivative designated at fair value – through profit and loss – (7.6) (7.6)
There were no transfers among the two categories during the year ended 31st December 2017.

Annual Report 2017 37
2 Financial Risk Management continued
Fair value estimation continued
ii) Financial instruments that are not measured at fair value
The fair values of current debtors, bank balances, current creditors and current borrowings are assumed to approximate their carrying amounts due to the short-term maturities of these assets and liabilities.
The fair values of long-term borrowings are based on market prices or are estimated using the expected future payments discounted at market interest rates.
Financial instruments by category
The fair values of financial assets and financial liabilities, together with carrying amounts as at 31st December 2017 and 2016 are as follows:
Loans and
receivables
Derivatives used for hedging
Available-for-sale
Other financial
instruments at amortised
cost
Total carrying amount Fair value
US$m US$m US$m US$m US$m US$m
2017AssetsOther investments – – 103.0 – 103.0 103.0Debtors 217.9 14.5 – – 232.4 232.4Bank balances 1,622.1 – – – 1,622.1 1,622.1
1,840.0 14.5 103.0 – 1,957.5 1,957.5
LiabilitiesBorrowings – – – (4,170.9) (4,170.9) (4,292.7)Creditors – (16.3) – (667.9) (684.2) (684.2)
– (16.3) – (4,838.8) (4,855.1) (4,976.9)
2016AssetsOther investments – – 52.2 – 52.2 52.2Debtors 288.1 44.5 – – 332.6 332.6Bank balances 1,908.9 – – – 1,908.9 1,908.9
2,197.0 44.5 52.2 – 2,293.7 2,293.7
LiabilitiesBorrowings – – – (3,916.4) (3,916.4) (3,988.3)Creditors – (7.6) – (533.3) (540.9) (540.9)
– (7.6) – (4,449.7) (4,457.3) (4,529.2)

Hongkong Land38
Notes to the Financial Statements
3 Critical Accounting Estimates and JudgementsEstimates and judgements used in preparing the financial statements are continually evaluated and are based on historical experience and other factors, including expectations of future events that are believed to be reasonable. The resulting accounting estimates will, by definition, seldom equal the related actual results. The estimates and assumptions that have a significant effect on the carrying amounts of assets and liabilities are discussed below.
Acquisition of subsidiaries, associates and joint ventures
The initial accounting on the acquisition of subsidiaries, associates and joint ventures involves identifying and determining the fair values to be assigned to the identifiable assets, liabilities and contingent liabilities of the acquired entities. The fair values of leasehold land, tangible assets and investment properties are determined by independent valuers by reference to market prices or present value of expected net cash flows from the assets. Any changes in the assumptions used and estimates made in determining the fair values, and management’s ability to measure reliably the contingent liabilities of the acquired entity will impact the carrying amount of these assets and liabilities.
On initial acquisition or acquisition of further interests in an entity, an assessment of the level of control or influence exercised by the Group is required. For entities where the Group has a shareholding of less than 50%, an assessment of the Group’s level of voting rights, board representation and other indicators of influence is performed to consider whether the Group has de facto control, requiring consolidation of that entity, or significant influence, requiring classification as an associate.
Investment properties
The fair values of investment properties are determined by independent valuers on an open market for existing use basis calculated on the discounted net income allowing for reversionary potential. For investment properties in Hong Kong, mainland China and Singapore, capitalisation rates in the range of 2.75% to 3.50% for office (2016: 3.20% to 3.85%) and 3.75% to 5.00% for retail (2016: 4.50% to 5.50%) are used in the fair value determination.
Considerations have been given to assumptions that are mainly based on market conditions existing at the balance sheet date and appropriate capitalisation rates. These estimates are regularly compared to actual market data and actual transactions entered into by the Group.
Impairment of assets
The Group tests annually whether goodwill and other assets that have indefinite useful lives suffered any impairment. Other assets are reviewed for impairment whenever events or changes in circumstances indicate that the carrying amount of the asset exceeds its recoverable amount. The recoverable amount of an asset or a cash generating unit is determined based on the higher of its fair value less costs to sell and its value-in-use, calculated on the basis of management’s assumptions and estimates. Changing the key assumptions, including the discount rates or the growth rate assumptions in the cash flow projections, could materially affect the value-in-use calculations.
In determining when an available-for-sale equity investment is impaired, significant judgement is required. In making this judgement, the Group evaluates, among other factors, the duration and extent to which the fair value of an investment is less than its cost; and the financial health of and near-term business outlook for the investee, including factors such as industry and sector performance, changes in technology and operational and financial cash flows.
Income taxes
The Group is subject to income taxes in numerous jurisdictions. Significant judgement is required in determining the worldwide provision for income taxes. There are many transactions and calculations for which the ultimate tax determination is uncertain during the ordinary course of business. Where the final tax outcome of these matters is different from the amounts that were initially recorded, such differences will impact the income tax and deferred tax provisions in the period in which such determination is made.
Provision of deferred tax follows the way management expects to recover or settle the carrying amount of the related assets or liabilities, which the management may expect to recover through use, sale or combination of both. Accordingly, deferred tax will be calculated at income tax rate, capital gains tax rate or combination of both. There is a rebuttable presumption in International Financial Reporting Standards that investment properties measured at fair value are recovered through sale. Thus deferred tax on revaluation of investment properties held by the Group are calculated at the capital gain tax rate.
Recognition of deferred tax assets, which principally relate to tax losses, depends on the management’s expectation of future taxable profit that will be available against which the tax losses can be utilised. The outcome of their actual utilisation may be different.

Annual Report 2017 39
3 Critical Accounting Estimates and Judgements continued
Non-trading items
The Group uses underlying business performance in its internal financial reporting to distinguish between the underlying profits and non-trading items. The identification of non-trading items requires judgement by management, but follows the consistent methodology as set out in the Group’s accounting policies.
4 Segmental InformationOperating segments are identified on the basis of internal reports about components of the Group that are regularly reviewed by the executive directors of the Company for the purpose of resource allocation and performance assessment. The Group has two operating segments, namely Investment Properties and Development Properties. No operating segments have been aggregated to form the reportable segments. Set out below is an analysis of the Group's underlying profit and total equity by reportable segment.
2017 2016Investment
PropertiesDevelopment
Properties Corporate TotalInvestmentProperties
Development Properties Corporate Total
US$m US$m US$m US$m US$m US$m US$m US$m
Revenue 1,049.0 910.8 – 1,959.8 988.8 1,005.1 – 1,993.9Net operating costs (197.5) (786.9) (67.8) (1,052.2) (182.9) (778.9) (61.5) (1,023.3)Share of operating profit of associates and joint ventures 136.4 415.8 – 552.2 146.4 60.0 – 206.4
Underlying operating profit 987.9 539.7 (67.8) 1,459.8 952.3 286.2 (61.5) 1,177.0
Net financing charges – subsidiaries (78.2) (68.9) – share of associates and joint ventures (26.2) (33.2)
(104.4) (102.1)
Tax – subsidiaries (156.8) (168.1) – share of associates and joint ventures (214.2) (46.4)
(371.0) (214.5)
Non-controlling interests – subsidiaries (1.4) (2.8) – share of associates and joint ventures (13.3) (9.8)
(14.7) (12.6)
Underlying profit attributable to shareholders 969.7 847.8Non-trading items: – change in fair value of investment properties 4,612.7 2,497.3 – gain on acquisition of a subsidiary 3.0 – – asset impairment reversals – 1.2
4,615.7 2,498.5
Profit attributable to shareholders 5,585.4 3,346.3

Hongkong Land40
Notes to the Financial Statements
4 Segmental Information continued
RevenueUnderlying
operating profit
Underlying profit attributable toshareholders
2017 2016 2017 2016 2017 2016US$m US$m US$m US$m US$m US$m
By geographical locationGreater China 1,302.5 1,396.7 1,315.4 975.7 1,293.7 959.0Southeast Asia and others 657.3 597.2 212.2 262.8 211.1 261.5Corporate, net financing charges and tax – – (67.8) (61.5) (535.1) (372.7)
1,959.8 1,993.9 1,459.8 1,177.0 969.7 847.8
Segment assets Segment liabilities
Unallocated assets and
liabilities
Total assets and
liabilities Investment properties
Properties for sale Others
US$m US$m US$m US$m US$m US$m
By business2017Investment Properties 36,813.0 – 478.3 (695.7) – 36,595.6Development Properties – 5,525.9 502.7 (2,093.3) – 3,935.3Unallocated assets and liabilities – – – – (3,722.5) (3,722.5)
36,813.0 5,525.9 981.0 (2,789.0) (3,722.5) 36,808.4
2016Investment Properties 31,891.6 – 385.4 (652.4) – 31,624.6Development Properties – 4,052.9 459.6 (2,184.5) – 2,328.0Unallocated assets and liabilities – – – – (2,638.2) (2,638.2)
31,891.6 4,052.9 845.0 (2,836.9) (2,638.2) 31,314.4
By geographical location2017Greater China 32,502.8 3,837.4 551.4 (1,889.4) – 35,002.2Southeast Asia and others 4,310.2 1,688.5 429.6 (899.6) – 5,528.7Unallocated assets and liabilities – – – – (3,722.5) (3,722.5)
36,813.0 5,525.9 981.0 (2,789.0) (3,722.5) 36,808.4
2016Greater China 27,893.7 2,587.6 436.4 (1,867.2) – 29,050.5Southeast Asia and others 3,997.9 1,465.3 408.6 (969.7) – 4,902.1Unallocated assets and liabilities – – – – (2,638.2) (2,638.2)
31,891.6 4,052.9 845.0 (2,836.9) (2,638.2) 31,314.4
Unallocated assets and liabilities include tax assets and liabilities, bank balances and borrowings.

Annual Report 2017 41
5 Revenue
2017 2016US$m US$m
Rental income 911.7 858.8Service income 140.3 130.8Sales of properties 907.8 1,004.3
1,959.8 1,993.9
Service income includes service and management charges and hospitality service income.
Total contingent rents included in rental income amounted to US$8.8 million (2016: US$10.4 million).
2017 2016US$m US$m
The future minimum rental payments receivable under non-cancellable leases are as follows:
Within one year 821.8 766.7Between one and two years 618.2 525.0Between two and five years 727.9 579.4Beyond five years 321.6 341.2
2,489.5 2,212.3
Generally the Group‘s operating leases are for terms of three years or more.
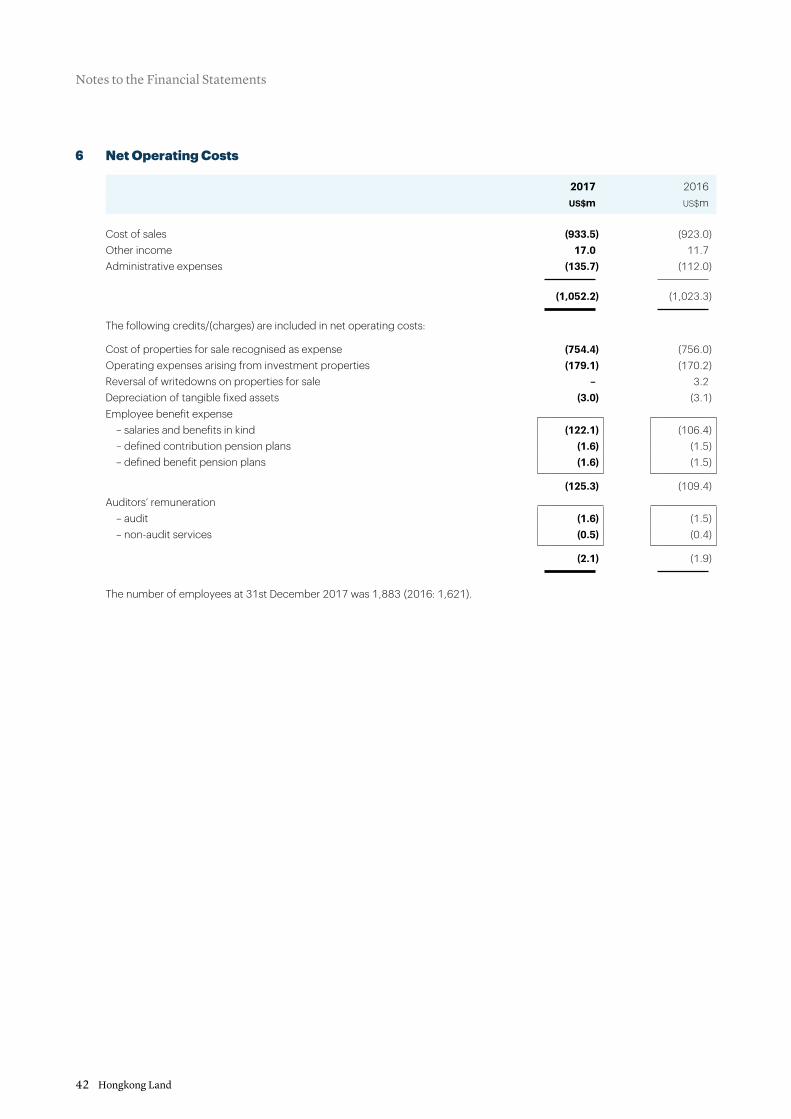
Notes to the Financial Statements
Hongkong Land42
6 Net Operating Costs
2017 2016US$m US$m
Cost of sales (933.5) (923.0)Other income 17.0 11.7Administrative expenses (135.7) (112.0)
(1,052.2) (1,023.3)
The following credits/(charges) are included in net operating costs:
Cost of properties for sale recognised as expense (754.4) (756.0)Operating expenses arising from investment properties (179.1) (170.2)Reversal of writedowns on properties for sale – 3.2Depreciation of tangible fixed assets (3.0) (3.1)Employee benefit expense – salaries and benefits in kind (122.1) (106.4) – defined contribution pension plans (1.6) (1.5) – defined benefit pension plans (1.6) (1.5)
(125.3) (109.4)Auditors’ remuneration – audit (1.6) (1.5) – non-audit services (0.5) (0.4)
(2.1) (1.9)
The number of employees at 31st December 2017 was 1,883 (2016: 1,621).

Annual Report 2017 43
7 Net Financing Charges
2017 2016US$m US$m
Interest expense – bank loans and overdrafts (28.3) (24.2) – other borrowings (107.7) (106.9)
Total interest expense (136.0) (131.1)Interest capitalised 32.1 34.1
(103.9) (97.0)Commitment and other fees (17.4) (13.4)
Financing charges (121.3) (110.4)Financing income 43.1 41.5
(78.2) (68.9)
Financing charges and financing income are stated after taking into account hedging gains or losses.
8 Share of Results of Associates and Joint Ventures
2017 2016US$m US$m
By businessInvestment Properties 82.1 89.4Development Properties 216.4 27.6
Underlying business performance 298.5 117.0
Non-trading items:Change in fair value of investment properties (53.1) (57.9)
245.4 59.1
Results are shown after tax and non-controlling interests in the associates and joint ventures.
The Group’s share of revenue of associates and joint ventures was US$1,324.6 million (2016: US$538.5 million).
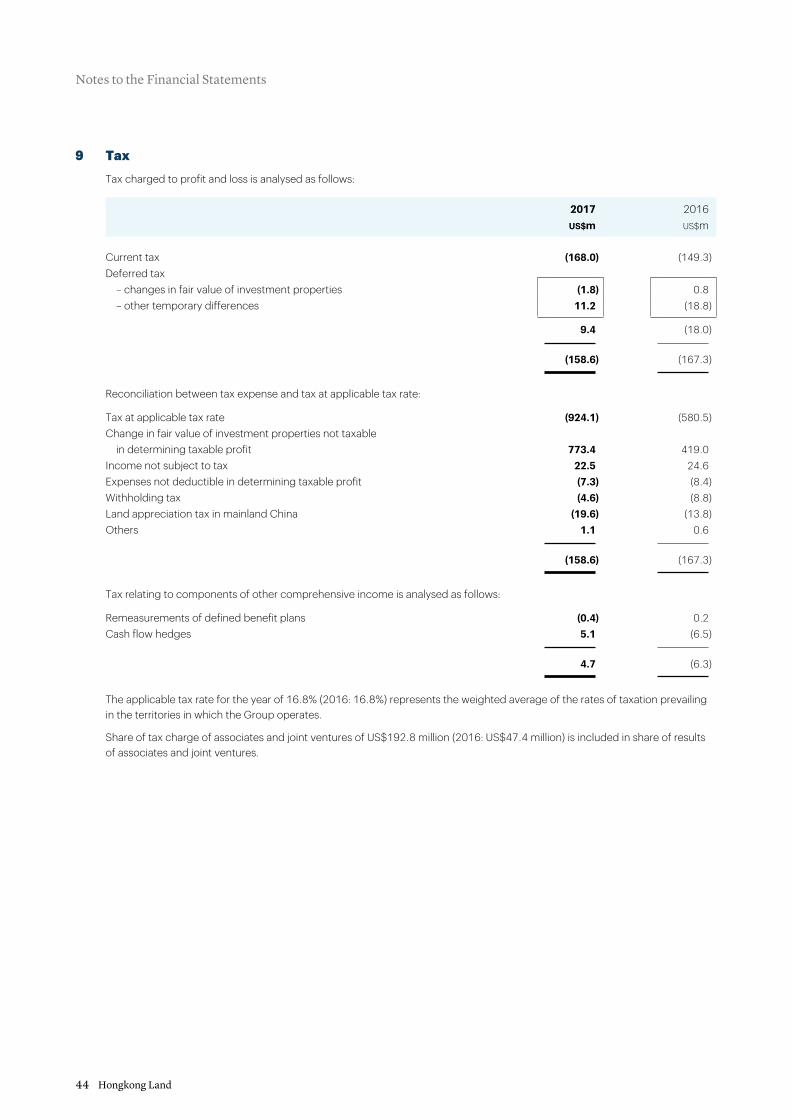
Notes to the Financial Statements
Hongkong Land44
9 TaxTax charged to profit and loss is analysed as follows:
2017 2016US$m US$m
Current tax (168.0) (149.3)Deferred tax – changes in fair value of investment properties (1.8) 0.8 – other temporary differences 11.2 (18.8)
9.4 (18.0)
(158.6) (167.3)
Reconciliation between tax expense and tax at applicable tax rate:
Tax at applicable tax rate (924.1) (580.5)Change in fair value of investment properties not taxable in determining taxable profit 773.4 419.0Income not subject to tax 22.5 24.6Expenses not deductible in determining taxable profit (7.3) (8.4)Withholding tax (4.6) (8.8)Land appreciation tax in mainland China (19.6) (13.8)Others 1.1 0.6
(158.6) (167.3)
Tax relating to components of other comprehensive income is analysed as follows:
Remeasurements of defined benefit plans (0.4) 0.2Cash flow hedges 5.1 (6.5)
4.7 (6.3)
The applicable tax rate for the year of 16.8% (2016: 16.8%) represents the weighted average of the rates of taxation prevailing in the territories in which the Group operates.
Share of tax charge of associates and joint ventures of US$192.8 million (2016: US$47.4 million) is included in share of results of associates and joint ventures.
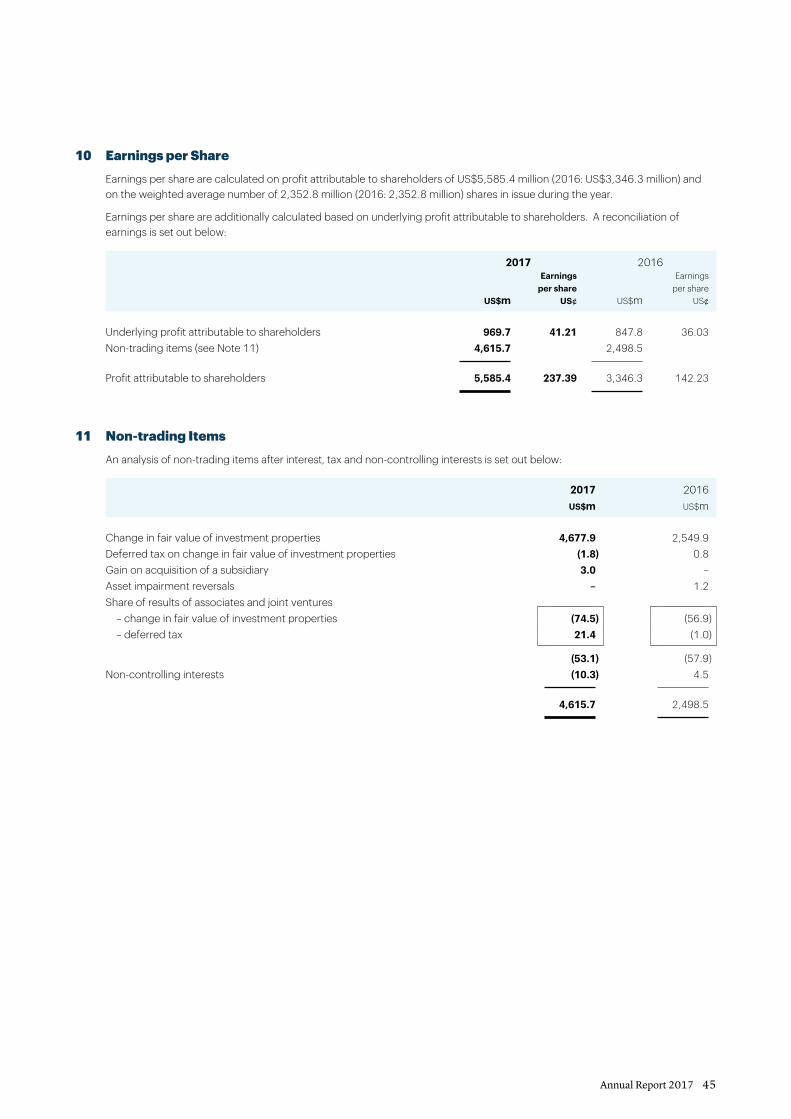
Annual Report 2017 45
10 Earnings per ShareEarnings per share are calculated on profit attributable to shareholders of US$5,585.4 million (2016: US$3,346.3 million) and on the weighted average number of 2,352.8 million (2016: 2,352.8 million) shares in issue during the year.
Earnings per share are additionally calculated based on underlying profit attributable to shareholders. A reconciliation of earnings is set out below:
2017 2016Earnings
per shareEarnings
per shareUS$m US¢ US$m US¢
Underlying profit attributable to shareholders 969.7 41.21 847.8 36.03Non-trading items (see Note 11) 4,615.7 2,498.5
Profit attributable to shareholders 5,585.4 237.39 3,346.3 142.23
11 Non-trading ItemsAn analysis of non-trading items after interest, tax and non-controlling interests is set out below:
2017 2016US$m US$m
Change in fair value of investment properties 4,677.9 2,549.9Deferred tax on change in fair value of investment properties (1.8) 0.8Gain on acquisition of a subsidiary 3.0 –Asset impairment reversals – 1.2Share of results of associates and joint ventures – change in fair value of investment properties (74.5) (56.9) – deferred tax 21.4 (1.0)
(53.1) (57.9)Non-controlling interests (10.3) 4.5
4,615.7 2,498.5

Notes to the Financial Statements
Hongkong Land46
12 Investment Properties
Completed commercial
properties
Under development
commercial properties
Completed residential properties Total
US$m US$m US$m US$m
2017At 1st January 26,665.6 804.2 242.5 27,712.3Exchange differences (170.9) 48.4 (0.6) (123.1)Additions 68.3 145.6 – 213.9Transfer 990.7 (990.7) – –Increase in fair value 4,620.4 39.4 18.1 4,677.9
At 31st December 32,174.1 46.9 260.0 32,481.0
Freehold properties 170.1Leasehold properties 32,310.9
32,481.0
2016At 1st January 23,984.7 741.4 231.2 24,957.3Exchange differences (25.4) (45.0) (0.6) (71.0)Additions 132.6 143.4 0.1 276.1Increase/(decrease) in fair value 2,573.7 (35.6) 11.8 2,549.9
At 31st December 26,665.6 804.2 242.5 27,712.3
Freehold properties 157.3Leasehold properties 27,555.0
27,712.3
The Group measures its investment properties at fair value. The fair values of the Group’s investment properties at 31st December 2017 and 2016 have been determined on the basis of valuations carried out by independent valuers who hold a recognised relevant professional qualification and have recent experience in the locations and segments of the investment properties valued. The Group employed Jones Lang LaSalle to value its commercial investment properties in Hong Kong, mainland China, Singapore, Vietnam and Cambodia which are either freehold or held under leases with unexpired lease terms of more than 20 years. The valuations, which conform to the International Valuation Standards issued by the International Valuation Standards Council and the HKIS Valuation Standards issued by the Hong Kong Institute of Surveyors, were arrived at by reference to the net income, allowing for reversionary potential, of each property. The Report of the Valuers is set out on page 81. The valuations are comprehensively reviewed by the Group.
At 31st December 2017, investment properties of US$898.7 million (2016: US$676.1 million) were pledged as security for borrowings (see Note 20).

Annual Report 2017 47
12 Investment Properties continued
Fair value measurements of residential properties using no significant unobservable inputsFair values of completed residential properties are generally derived using the direct comparison method. This valuation method is based on comparing the property to be valued directly with other comparable properties, which have recently transacted. However, given the heterogeneous nature of real estate properties, appropriate adjustments are usually required to allow for any qualitative differences that may affect the price likely to be achieved by the property under consideration.
Fair value measurements of commercial properties using significant unobservable inputsFair values of completed commercial properties in Hong Kong and Singapore are generally derived using the income capitalisation method. This valuation method is based on the capitalisation of the net income and reversionary income potential by adopting appropriate capitalisation rates, which are derived from analysis of sale transactions and valuers’ interpretation of prevailing investor requirements or expectations. The prevailing market rents adopted in the valuation have reference to valuers’ view of recent lettings, within the subject properties and other comparable properties.
Fair values of completed commercial properties in Vietnam and Cambodia are generally derived using the discounted cash flow method. The net present value of the income stream is estimated by applying an appropriate discount rate which reflects the risk profile.
Fair values of under development commercial properties are generally derived using the residual method. This valuation method is essentially a means of valuing the land by reference to its development potential by deducting development costs together with developer’s profit and risk from the estimated capital value of the proposed development assuming completion as at the date of valuation.
The Group’s policy is to recognise transfers between fair value measurements as of the date of the event or change in circumstances that caused the transfer.
Information about fair value measurements using significant unobservable inputs at 31st December 2017:
Range of significant unobservable inputs
Fair value Valuation methodPrevailing market
rent per monthCapitalisation/
discount rateUS$m US$ %
Completed propertiesHong Kong 30,559.8 Income capitalisation 5.1 to 37.2 per square foot 2.75 to 5.00Mainland China 898.7 Income capitalisation 96.6 per square metre 3.75Singapore 573.6 Income capitalisation 7.3 to 8.8 per square foot 3.50 to 4.80Vietnam and Cambodia 142.0 Discounted cash flow 21.0 to 44.8 per square metre 12.50 to 15.00
Total 32,174.1
Prevailing market rents are estimated based on independent valuers’ view of recent lettings, within the subject properties and other comparable properties. The higher the rents, the higher the fair value.
Capitalisation and discount rates are estimated by independent valuers based on the risk profile of the properties being valued. The lower the rates, the higher the fair value.

Notes to the Financial Statements
Hongkong Land48
13 Associates and Joint Ventures
2017 2016US$m US$m
Unlisted associates 306.2 123.9Unlisted joint ventures 5,244.6 4,336.8
Share of attributable net assets 5,550.8 4,460.7
By businessInvestment Properties 3,517.4 3,382.3Development Properties 2,033.4 1,078.4
5,550.8 4,460.7
Associates Joint ventures2017 2016 2017 2016US$m US$m US$m US$m
Movements of associates and joint ventures during the year:
At 1st January 123.9 136.8 4,336.8 4,480.8Exchange differences 0.6 (0.1) 25.9 13.9Share of results after tax and non-controlling interests 84.7 (19.3) 160.7 78.4Share of other comprehensive income/(expenses) after tax and non-controlling interests 24.3 (21.2) 212.9 (123.7)Dividends received and receivable (0.9) (1.2) (94.3) (85.9)Investments in and advances to/(repayments from) associates and joint ventures 73.6 28.9 627.2 (27.5)Acquisition of a subsidiary – – 15.9 –Transfer to subsidiary on further acquisiton of interest – – (41.2) –Others – – 0.7 0.8
At 31st December 306.2 123.9 5,244.6 4,336.8
The material joint ventures of the Group are listed below. These joint ventures have share capital consisting solely of ordinary shares, which are held directly by the Group.
Nature of investments in material joint ventures in 2017 and 2016:
Name of entity Nature of business
Country of incorporation/ principal place
of business
% of ownership
interest
2017 2016
Properties Sub F, Ltd Property investment Macau 49.0 49.0BFC Development LLP Property investment Singapore 33.3 33.3Central Boulevard Development Pte Ltd Property investment Singapore 33.3 33.3One Raffles Quay Pte Ltd Property investment Singapore 33.3 33.3
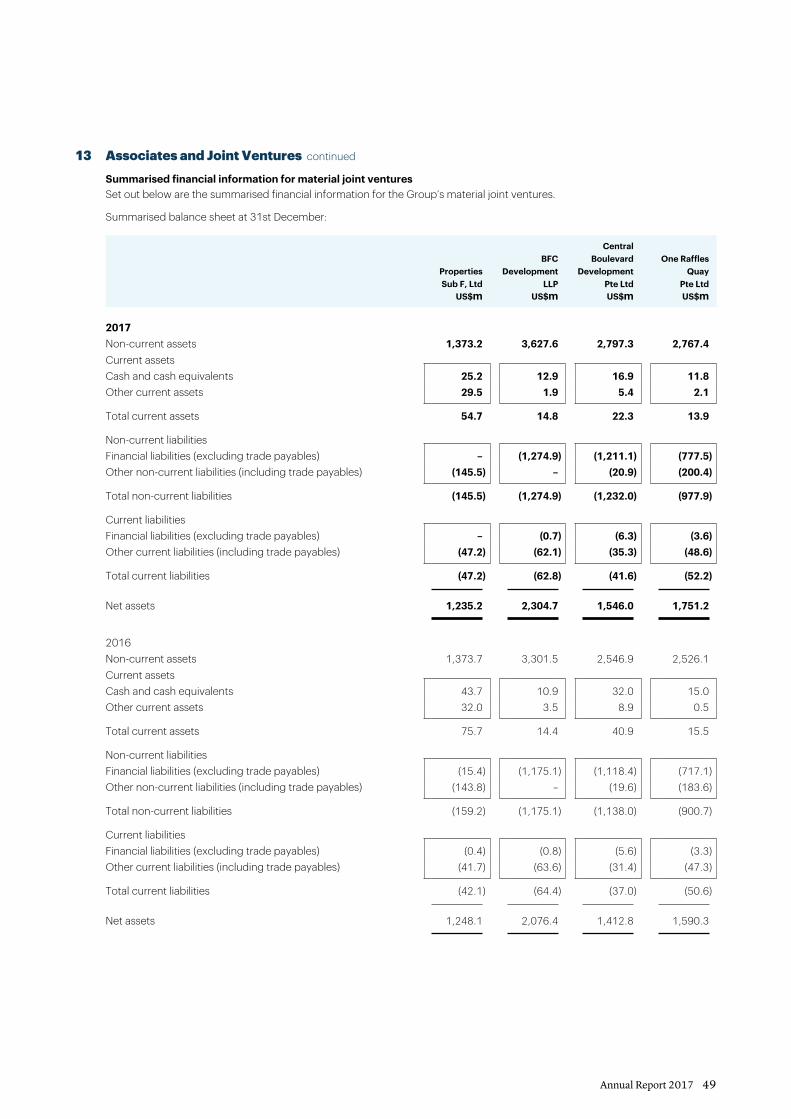
Annual Report 2017 49
13 Associates and Joint Ventures continued
Summarised financial information for material joint venturesSet out below are the summarised financial information for the Group’s material joint ventures.
Summarised balance sheet at 31st December:
Properties Sub F, Ltd
BFC Development
LLP
Central Boulevard
Development Pte Ltd
One Raffles Quay
Pte LtdUS$m US$m US$m US$m
2017Non-current assets 1,373.2 3,627.6 2,797.3 2,767.4Current assetsCash and cash equivalents 25.2 12.9 16.9 11.8Other current assets 29.5 1.9 5.4 2.1
Total current assets 54.7 14.8 22.3 13.9
Non-current liabilitiesFinancial liabilities (excluding trade payables) – (1,274.9) (1,211.1) (777.5)Other non-current liabilities (including trade payables) (145.5) – (20.9) (200.4)
Total non-current liabilities (145.5) (1,274.9) (1,232.0) (977.9)
Current liabilitiesFinancial liabilities (excluding trade payables) – (0.7) (6.3) (3.6)Other current liabilities (including trade payables) (47.2) (62.1) (35.3) (48.6)
Total current liabilities (47.2) (62.8) (41.6) (52.2)
Net assets 1,235.2 2,304.7 1,546.0 1,751.2
2016Non-current assets 1,373.7 3,301.5 2,546.9 2,526.1Current assetsCash and cash equivalents 43.7 10.9 32.0 15.0Other current assets 32.0 3.5 8.9 0.5
Total current assets 75.7 14.4 40.9 15.5
Non-current liabilitiesFinancial liabilities (excluding trade payables) (15.4) (1,175.1) (1,118.4) (717.1)Other non-current liabilities (including trade payables) (143.8) – (19.6) (183.6)
Total non-current liabilities (159.2) (1,175.1) (1,138.0) (900.7)
Current liabilitiesFinancial liabilities (excluding trade payables) (0.4) (0.8) (5.6) (3.3)Other current liabilities (including trade payables) (41.7) (63.6) (31.4) (47.3)
Total current liabilities (42.1) (64.4) (37.0) (50.6)
Net assets 1,248.1 2,076.4 1,412.8 1,590.3

Notes to the Financial Statements
Hongkong Land50
13 Associates and Joint Ventures continued
Summarised statement of comprehensive income for the year ended 31st December:
Properties Sub F, Ltd
BFC Development
LLP
Central Boulevard
Development Pte Ltd
One Raffles Quay
Pte LtdUS$m US$m US$m US$m
2017Revenue 81.3 150.7 109.4 118.2 Depreciation and amortisation (7.6) – – –Interest income – 0.1 0.2 0.1 Interest expense (0.4) (38.5) (28.2) (21.6)
Profit from underlying business performance 40.7 78.4 54.5 70.3 Income tax expense (4.8) (13.2) (8.7) (11.9)
Profit after tax from underlying business performance 35.9 65.2 45.8 58.4 Profit after tax from non-trading items 13.2 57.7 43.5 33.3
Profit after tax 49.1 122.9 89.3 91.7 Other comprehensive income/(expense) (10.1) 169.7 114.5 128.2
Total comprehensive income 39.0 292.6 203.8 219.9
Group’s share of dividends received and receivable from joint ventures 9.7 21.4 23.5 19.6
2016Revenue 86.1 168.5 105.7 121.1 Depreciation and amortisation (7.5) (0.1) (0.1) – Interest income – 0.1 0.2 0.1 Interest expense (0.9) (45.8) (29.2) (22.3)
Profit from underlying business performance 45.1 85.1 51.2 70.9 Income tax expense (4.9) (14.2) (8.5) (11.9)
Profit after tax from underlying business performance 40.2 70.9 42.7 59.0Profit after tax from non-trading items (169.1) (3.8) (3.6) (3.0)
Profit/(loss) after tax (128.9) 67.1 39.1 56.0 Other comprehensive expense (0.9) (33.3) (36.9) (36.5)
Total comprehensive income/(expense) (129.8) 33.8 2.2 19.5
Group’s share of dividends received and receivable from joint ventures 11.7 27.2 17.2 19.6
The information above reflects the amounts presented in the financial statements of the joint ventures adjusted for differences in accounting policies between the Group and the joint ventures, and fair value of the joint ventures at the time of acquisition.

Annual Report 2017 51
13 Associates and Joint Ventures continued
Reconciliation of summarised financial informationReconciliation of the summarised financial information presented to the carrying amount of the Group’s interest in the material joint ventures for the year ended 31st December:
Properties Sub F, Ltd
BFC Development
LLP
Central Boulevard
Development Pte Ltd
One Raffles Quay
Pte LtdUS$m US$m US$m US$m
2017Net assets 1,235.2 2,304.7 1,546.0 1,751.2Shareholders’ loans – 1,274.9 – 100.8
Adjusted net assets 1,235.2 3,579.6 1,546.0 1,852.0
Interest in joint ventures (%) 49.0 33.3 33.3 33.3
Group’s share of net assets in joint ventures 605.4 1,193.2 515.3 617.4
2016Net assets 1,248.1 2,076.4 1,412.8 1,590.3Shareholders’ loans 15.8 1,175.1 – 93.3
Adjusted net assets 1,263.9 3,251.5 1,412.8 1,683.6
Interest in joint ventures (%) 49.0 33.3 33.3 33.3
Group’s share of net assets in joint ventures 619.3 1,083.8 470.9 561.2
The Group has interests in a number of individually immaterial joint ventures. The following table analyses, in aggregate, the share of profit and other comprehensive income and carrying amount of these joint ventures.
2017 2016US$m US$m
Share of profit 35.3 87.3Share of other comprehensive income/(expense) 80.3 (87.8)
Share of total comprehensive income/(expense) 115.6 (0.5)
Carrying amount of interests in these joint ventures 2,313.3 1,601.6
At 31st December 2017, the Group’s commitments to provide funding to its joint ventures, if called, amounted to US$1,293.6 million (2016: US$404.5 million).
There were no contingent liabilities relating to the Group’s interest in the joint ventures at 31st December 2017 and 2016.

Notes to the Financial Statements
Hongkong Land52
14 Other Investments
2017 2016US$m US$m
Available-for-sale financial assets – listed securiites 103.0 52.2
15 Debtors
2017 2016US$m US$m
Trade debtors 84.8 176.9Other debtors – third parties 400.5 323.6 – associates and joint ventures 41.6 39.9
526.9 540.4
Non-current 28.5 60.1Current 498.4 480.3
526.9 540.4
By geographical area of operationGreater China 261.9 255.0Southeast Asia and others 265.0 285.4
526.9 540.4
Trade and other debtors excluding derivative financial instruments are stated at amortised cost. The fair value of these debtors approximates their carrying amounts, as the impact of discounting is not significant. Derivative financial instruments are stated at fair value.
An allowance for impairment of trade debtors is made based on the estimated irrecoverable amount determined by reference to past default experience. Significant financial difficulties of the debtor, probability that the debtor will enter bankruptcy or financial reorganisation, and default or delinquency in payment are considered indicators that the debt is impaired.
At 31st December 2017, trade debtors of US$8.0 million (2016: US$5.9 million) were past due but not impaired. The ageing analysis of these trade debtors is as follows:
2017 2016US$m US$m
Below 30 days 5.5 5.1Between 31 and 60 days 0.6 0.4Between 61 and 90 days – 0.3Over 90 days 1.9 0.1
8.0 5.9
The risk of trade and other debtors that are neither past due nor impaired at 31st December 2017 becoming impaired is low as they have a good track record with the Group. Based on past experience, management believes that no impairment allowance is necessary in respect of these balances as there has not been a significant change in credit quality and the balances are still considered fully recoverable.

Annual Report 2017 53
15 Debtors continued
Other debtors are further analysed as follows:
2017 2016US$m US$m
Prepayments 294.5 207.9Derivative financial instruments 14.5 44.5Amounts due from associates and joint ventures 41.6 39.9Others 91.5 71.2
442.1 363.5
16 Deferred Tax Assets and Liabilities
Tax losses
Accelerated capital
allowances
Revaluation surpluses of investment properties
Other temporary
differences TotalUS$m US$m US$m US$m US$m
2017At 1st January 0.1 (75.4) (1.7) (35.8) (112.8)Exchange differences – 0.6 (0.1) (2.7) (2.2)Credited/(charged) to profit and loss 0.4 (5.4) (1.8) 16.2 9.4Charged to other comprehensive income – – – 4.7 4.7Acquisition of a subsidiary – – – (10.5) (10.5)
At 31st December 0.5 (80.2) (3.6) (28.1) (111.4)
Deferred tax assets 0.5 – – 15.0 15.5Deferred tax liabilities – (80.2) (3.6) (43.1) (126.9)
0.5 (80.2) (3.6) (28.1) (111.4)
2016At 1st January 0.5 (70.3) (2.5) (16.6) (88.9)Exchange differences – – – 0.4 0.4Credited/(charged) to profit and loss (0.4) (5.1) 0.8 (13.3) (18.0)Charged to other comprehensive income – – – (6.3) (6.3)
At 31st December 0.1 (75.4) (1.7) (35.8) (112.8)
Deferred tax assets 0.1 – – 8.6 8.7Deferred tax liabilities – (75.4) (1.7) (44.4) (121.5)
0.1 (75.4) (1.7) (35.8) (112.8)
Deferred tax balances predominantly comprise non-current items. Deferred tax assets and liabilities are netted when the taxes relate to the same taxation authority and where offsetting is allowed.
Deferred tax assets of US$5.0 million (2016: US$0.9 million) arising from unused tax losses of US$17.9 million (2016: US$5.0 million) have not been recognised in the financial statements. Included in the unused tax losses, US$6.6 million (2016: US$5.0 million) have no expiry date.

Notes to the Financial Statements
Hongkong Land54
17 Properties for Sale
2017 2016US$m US$m
Properties under development 2,374.4 1,968.2Completed properties 173.5 262.7
2,547.9 2,230.9Provision for impairment (13.3) (13.5)
2,534.6 2,217.4
At 31st December 2017, properties under development which were not scheduled for completion within the next 12 months amounted to US$1,385.8 million (2016: US$1,386.4 million).
18 Bank Balances
2017 2016US$m US$m
Deposits with banks and financial institutions 1,345.1 994.3Bank balances 277.0 914.6
1,622.1 1,908.9
By currencyChinese renminbi 182.7 1,010.1Hong Kong dollar 38.5 21.1Malaysian ringgit 25.8 0.7Singapore dollar 620.0 207.7United States dollar 753.3 667.3Others 1.8 2.0
1,622.1 1,908.9
Deposits and bank balances of certain subsidiaries amounting to US$45.6 million (2016: US$122.7 million) are held under the Housing Developers (Project Account) Rules in Singapore, withdrawals from which are subject to the provision of these Rules.
The weighted average interest rate on deposits with banks and financial institutions is 1.4% (2016: 1.2%) per annum.
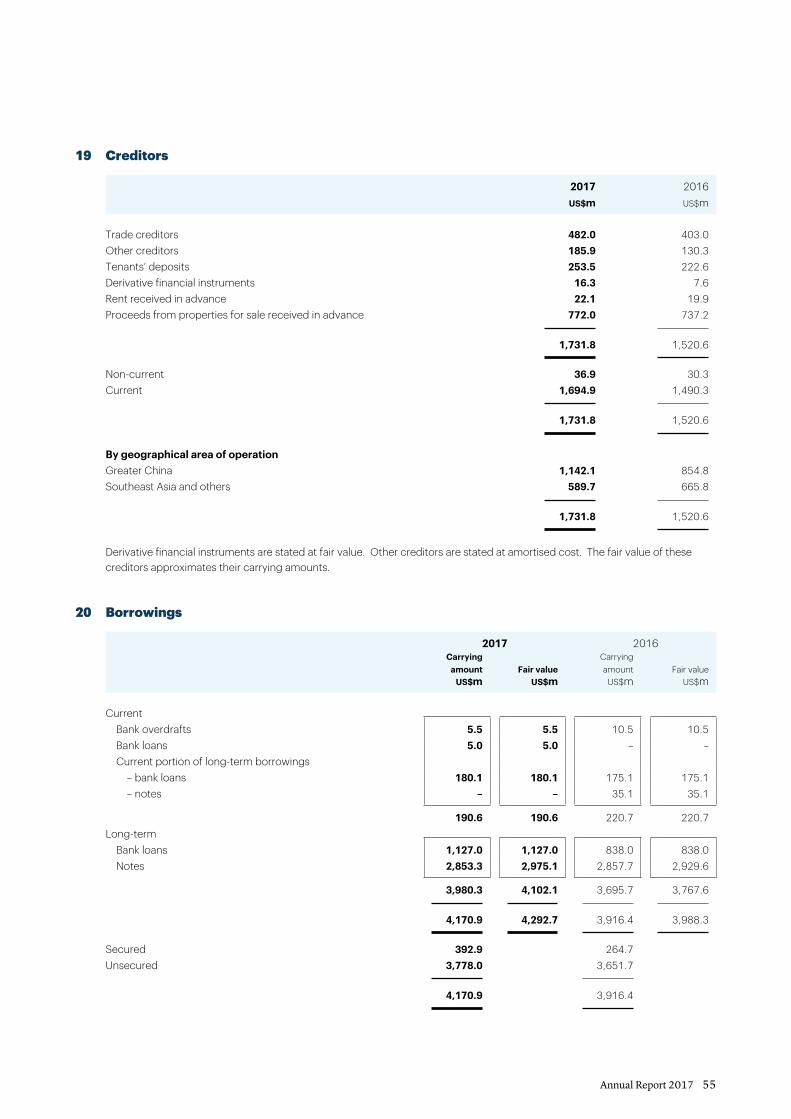
Annual Report 2017 55
19 Creditors
2017 2016US$m US$m
Trade creditors 482.0 403.0Other creditors 185.9 130.3Tenants‘ deposits 253.5 222.6Derivative financial instruments 16.3 7.6Rent received in advance 22.1 19.9Proceeds from properties for sale received in advance 772.0 737.2
1,731.8 1,520.6
Non-current 36.9 30.3Current 1,694.9 1,490.3
1,731.8 1,520.6
By geographical area of operationGreater China 1,142.1 854.8Southeast Asia and others 589.7 665.8
1,731.8 1,520.6
Derivative financial instruments are stated at fair value. Other creditors are stated at amortised cost. The fair value of these creditors approximates their carrying amounts.
20 Borrowings
2017 2016Carrying
amount Fair valueCarrying amount Fair value
US$m US$m US$m US$m
Current Bank overdrafts 5.5 5.5 10.5 10.5 Bank loans 5.0 5.0 – – Current portion of long-term borrowings – bank loans 180.1 180.1 175.1 175.1 – notes – – 35.1 35.1
190.6 190.6 220.7 220.7Long-term Bank loans 1,127.0 1,127.0 838.0 838.0 Notes 2,853.3 2,975.1 2,857.7 2,929.6
3,980.3 4,102.1 3,695.7 3,767.6
4,170.9 4,292.7 3,916.4 3,988.3
Secured 392.9 264.7Unsecured 3,778.0 3,651.7
4,170.9 3,916.4

Notes to the Financial Statements
Hongkong Land56
20 Borrowings continued
The fair values are based on market prices or are estimated using the expected future payments discounted at market interest rates ranging from 1.5% to 6.5% (2016: 1.4% to 6.2%) per annum. This is in line with the definition of 'observable current market transactions' under the fair value measurement hierarchy. The fair value of current borrowings approximates their carrying amounts, as the impact of discounting is not significant.
Secured borrowings at 31st December 2017 and 2016 were certain subsidiaries' bank borrowings which were secured against their investment properties.
The borrowings are further summarised as follows:
Fixed rate borrowingsWeighted
average interest rates
Weighted average period
outstanding
Floating rate
borrowings Total% Years US$m US$m US$m
By currency2017Hong Kong dollar 3.6 7.6 1,987.8 1,165.4 3,153.2Singapore dollar 2.5 2.2 188.8 430.6 619.4Chinese renminbi 4.9 – – 392.9 392.9Others 2.4 – – 5.4 5.4
2,176.6 1,994.3 4,170.9
2016Hong Kong dollar 3.5 8.6 1,996.4 1,288.1 3,284.5Singapore dollar 2.8 3.2 181.0 180.6 361.6Chinese renminbi 5.0 – – 264.7 264.7Others 2.9 – – 5.6 5.6
2,177.4 1,739.0 3,916.4
The weighted average interest rates and period of fixed rate borrowings are stated after taking into account hedging transactions.
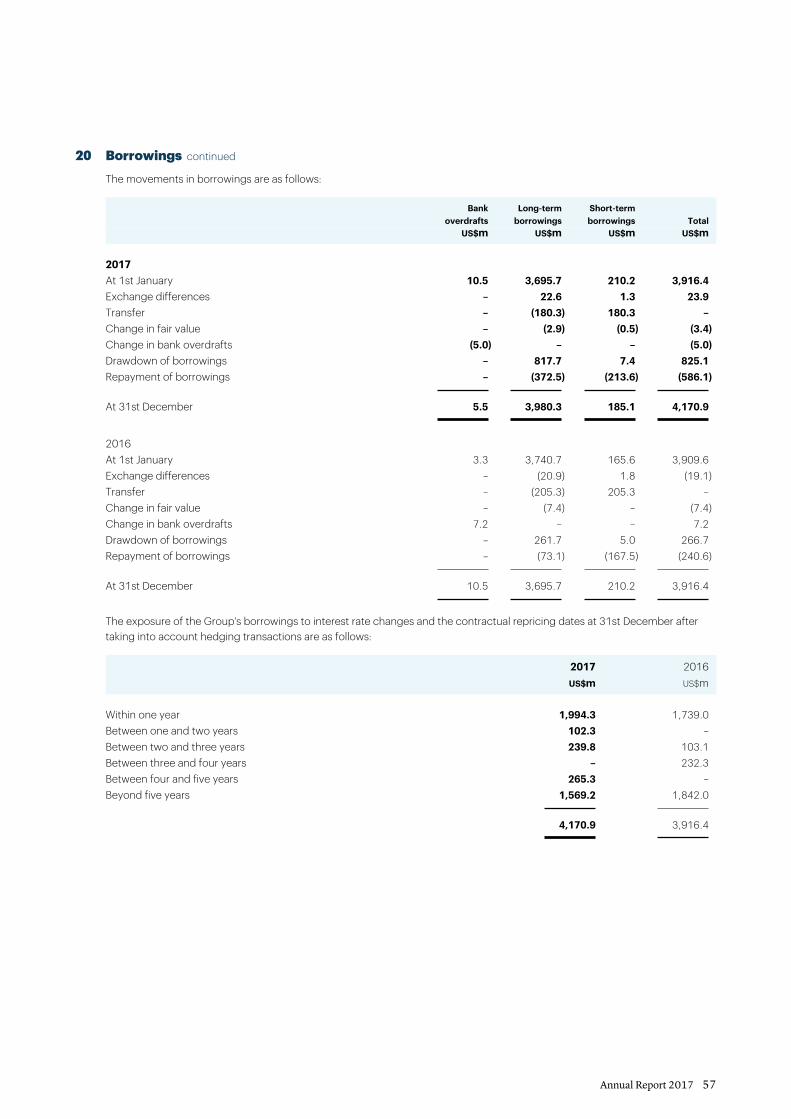
Annual Report 2017 57
20 Borrowings continued
The movements in borrowings are as follows:
Bank overdrafts
Long-term borrowings
Short-term borrowings Total
US$m US$m US$m US$m
2017At 1st January 10.5 3,695.7 210.2 3,916.4Exchange differences – 22.6 1.3 23.9Transfer – (180.3) 180.3 –Change in fair value – (2.9) (0.5) (3.4)Change in bank overdrafts (5.0) – – (5.0)Drawdown of borrowings – 817.7 7.4 825.1Repayment of borrowings – (372.5) (213.6) (586.1)
At 31st December 5.5 3,980.3 185.1 4,170.9
2016At 1st January 3.3 3,740.7 165.6 3,909.6Exchange differences – (20.9) 1.8 (19.1)Transfer – (205.3) 205.3 –Change in fair value – (7.4) – (7.4)Change in bank overdrafts 7.2 – – 7.2Drawdown of borrowings – 261.7 5.0 266.7Repayment of borrowings – (73.1) (167.5) (240.6)
At 31st December 10.5 3,695.7 210.2 3,916.4
The exposure of the Group's borrowings to interest rate changes and the contractual repricing dates at 31st December after taking into account hedging transactions are as follows:
2017 2016US$m US$m
Within one year 1,994.3 1,739.0Between one and two years 102.3 –Between two and three years 239.8 103.1Between three and four years – 232.3Between four and five years 265.3 –Beyond five years 1,569.2 1,842.0
4,170.9 3,916.4
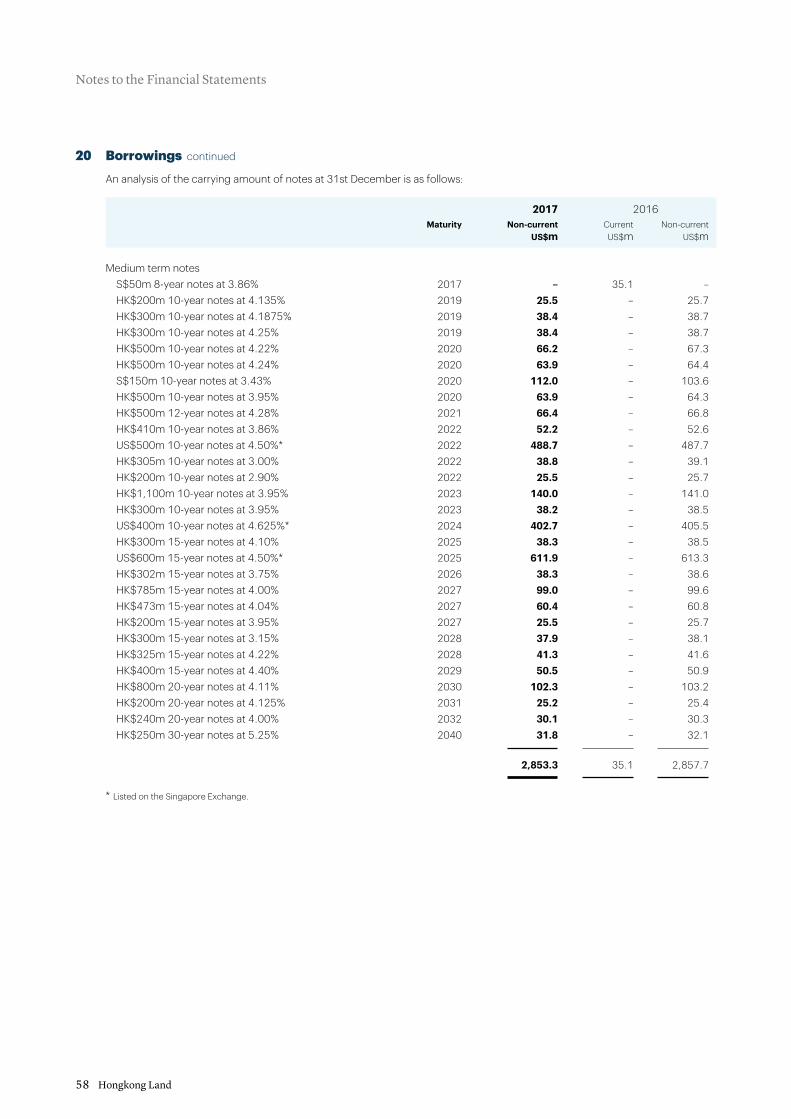
Notes to the Financial Statements
Hongkong Land58
20 Borrowings continued
An analysis of the carrying amount of notes at 31st December is as follows:
2017 2016Maturity Non-current Current Non-current
US$m US$m US$m
Medium term notes S$50m 8-year notes at 3.86% 2017 – 35.1 – HK$200m 10-year notes at 4.135% 2019 25.5 – 25.7 HK$300m 10-year notes at 4.1875% 2019 38.4 – 38.7 HK$300m 10-year notes at 4.25% 2019 38.4 – 38.7 HK$500m 10-year notes at 4.22% 2020 66.2 – 67.3 HK$500m 10-year notes at 4.24% 2020 63.9 – 64.4 S$150m 10-year notes at 3.43% 2020 112.0 – 103.6 HK$500m 10-year notes at 3.95% 2020 63.9 – 64.3 HK$500m 12-year notes at 4.28% 2021 66.4 – 66.8 HK$410m 10-year notes at 3.86% 2022 52.2 – 52.6 US$500m 10-year notes at 4.50%* 2022 488.7 – 487.7 HK$305m 10-year notes at 3.00% 2022 38.8 – 39.1 HK$200m 10-year notes at 2.90% 2022 25.5 – 25.7 HK$1,100m 10-year notes at 3.95% 2023 140.0 – 141.0 HK$300m 10-year notes at 3.95% 2023 38.2 – 38.5 US$400m 10-year notes at 4.625%* 2024 402.7 – 405.5 HK$300m 15-year notes at 4.10% 2025 38.3 – 38.5 US$600m 15-year notes at 4.50%* 2025 611.9 – 613.3 HK$302m 15-year notes at 3.75% 2026 38.3 – 38.6 HK$785m 15-year notes at 4.00% 2027 99.0 – 99.6 HK$473m 15-year notes at 4.04% 2027 60.4 – 60.8 HK$200m 15-year notes at 3.95% 2027 25.5 – 25.7 HK$300m 15-year notes at 3.15% 2028 37.9 – 38.1 HK$325m 15-year notes at 4.22% 2028 41.3 – 41.6 HK$400m 15-year notes at 4.40% 2029 50.5 – 50.9 HK$800m 20-year notes at 4.11% 2030 102.3 – 103.2 HK$200m 20-year notes at 4.125% 2031 25.2 – 25.4 HK$240m 20-year notes at 4.00% 2032 30.1 – 30.3 HK$250m 30-year notes at 5.25% 2040 31.8 – 32.1
2,853.3 35.1 2,857.7
* Listed on the Singapore Exchange.

Annual Report 2017 59
21 Share Capital
Ordinary shares in millions 2017 20162017 2016 US$m US$m
AuthorisedShares of US$0.10 each 4,000.0 4,000.0 400.0 400.0
Issued and fully paidAt 1st January and 31st December 2,352.8 2,352.8 235.3 235.3
22 Dividends
2017 2016US$m US$m
Final dividend in respect of 2016 of US¢13.00 (2015: US¢13.00) per share 305.8 305.8Interim dividend in respect of 2017 of US¢6.00 (2016: US¢6.00) per share 141.2 141.2
447.0 447.0
A final dividend in respect of 2017 of US¢14.00 (2016: US¢13.00) per share amounting to a total of US$329.4 million (2016: US$305.8 million) is proposed by the Board. The dividend proposed will not be accounted for until it has been approved at the Annual General Meeting. The amount will be accounted for as an appropriation of revenue reserves in the year ending 31st December 2018.
23 Cash and Cash Equivalents
2017 2016US$m US$m
Bank balances 1,622.1 1,908.9Bank overdrafts (see Note 20) (5.5) (10.5)
1,616.6 1,898.4

Notes to the Financial Statements
Hongkong Land60
24 Derivative Financial InstrumentsThe fair values of derivative financial instruments at 31st December are as follows:
2017 2016Positive
fair valueNegative fair value
Positive fair value
Negative fair value
US$m US$m US$m US$m
Designated as cash flow hedges – cross currency swaps 4.8 7.7 28.0 –
Designated as fair value hedges – interest rate swaps 2.5 – 2.9 – – cross currency swaps 7.2 8.6 13.6 7.6
Interest rate swapsThe notional principal amounts of the outstanding interest rate swap contracts at 31st December 2017 were US$64.0 million (2016: US$99.1 million).
The fair values of interest rate swaps are based on the estimated cash flows discounted at market rates ranging from 1.3% to 2.0% (2016: 1.0% to 2.3%) per annum.
Cross currency swapsThe contract amounts of the outstanding cross currency swap contracts at 31st December 2017 were US$1,647.9 million (2016: US$1,636.9 million).
25 Commitments
2017 2016US$m US$m
Capital commitments Authorised not contracted 23.4 81.8 Contracted not provided – contributions to joint ventures 1,293.6 404.5 – others 48.6 136.7
1,342.2 541.2
1,365.6 623.0
Operating lease commitments Due within one year 3.5 2.6 Due between one and two years 2.5 1.5 Due between two and five years 3.8 1.3
9.8 5.4

Annual Report 2017 61
26 Contingent LiabilitiesVarious Group companies are involved in litigation arising in the ordinary course of their respective businesses. Having reviewed outstanding claims and taking into account legal advice received, the Directors are of the opinion that adequate provisions have been made in the financial statements.
27 Related Party TransactionsThe parent company of the Group is Jardine Strategic Holdings Limited and the ultimate holding company is Jardine Matheson Holdings Limited (‘JMH‘). Both companies are incorporated in Bermuda.
In the normal course of business, the Group has entered into a variety of transactions with the subsidiaries, associates and joint ventures of JMH (‘Jardine Matheson group members‘). The more significant of these transactions are described below:
Management feeThe management fee payable by the Group, under an agreement entered into in 1995, to Jardine Matheson Limited (‘JML‘) in 2017 was US$4.9 million (2016: US$4.2 million), being 0.5% per annum of the Group‘s underlying profit in consideration for management consultancy services provided by JML, a wholly-owned subsidiary of JMH.
Property and other servicesThe Group rented properties to Jardine Matheson group members. Gross rents on such properties in 2017 amounted to US$21.2 million (2016: US$20.2 million).
The Group provided consultancy services to Jardine Matheson group members in 2017 amounting to US$0.2 million (2016: US$0.4 million).
Jardine Matheson group members provided property maintenance and other services to the Group in 2017 in aggregate amounting to US$63.9 million (2016: US$53.7 million).
Hotel management servicesJardine Matheson group members provided hotel management services to the Group in 2017 amounting to US$3.4 million (2016: US$2.4 million).
Outstanding balances with associates and joint venturesAmounts of outstanding balances with associates and joint ventures are included in debtors and creditors as appropriate (see Notes 15 and 19). The amounts are not material.
Directors‘ emolumentsDetails of Directors‘ emoluments (being the key management personnel compensation) are shown on page 73 under the heading of ‘Directors‘ Appointment, Retirement, Remuneration and Service Contracts‘.

Notes to the Financial Statements
Hongkong Land62
28 Summarised Balance Sheet of the CompanyIncluded below is certain summarised balance sheet information of the Company disclosed in accordance with Bermuda law.
2017 2016US$m US$m
Net operating assetsInvestments at cost Unlisted shares in subsidiaries 4,481.7 4,481.7 Amounts due from subsidiaries 1,473.8 1,371.4
5,955.5 5,853.1Creditors and other accruals (26.8) (23.7)
5,928.7 5,829.4
Total equityShare capital (see Note 21) 235.3 235.3Revenue and other reserves Contributed surplus 2,249.6 2,249.6 Share premium 386.9 386.9 Revenue reserves 3,056.9 2,957.6
5,693.4 5,594.1
Shareholders’ funds 5,928.7 5,829.4
Subsidiaries are shown at cost less amounts provided.
The contributed surplus was set up on the formation of the Company in 1989 and, under the Bye-laws of the Company, is distributable.

Annual Report 2017 63
29 Principal Subsidiaries, Associates and Joint VenturesThe principal subsidiaries, associates and joint ventures of the Group at 31st December 2017 are set out below.
Attributableinterests
Issued share capital Main activitiesPlace of incorporation2017 2016
% %
Subsidiaries
Hongkong Land China Holdings Ltd* 100 100 USD 200,000,000 Investment holding Bermuda
Hongkong Land International Holdings Ltd*
100 100 USD 200,000,000 Investment holding Bermuda
Hongkong Land Ltd* 100 100 USD 12,000 Group management Bermuda
The Hongkong Land Company, Ltd 100 100 HKD 1,293,180,006 Investment holding Hong Kong
The Hongkong Land Property Company, Ltd
100 100 HKD 200 Property investment Hong Kong
HKL (Chater House) Ltd 100 100 HKD 1,500,000 Property investment Hong Kong
HKL (Landmark Hotel) Ltd 100 100 HKD 2 Hotel investment Hong Kong
HKL (Prince‘s Building) Ltd 100 100 HKD 200 Property investment Hong Kong
Hongkong Land (HK) Investments Ltd 100 – HKD 2,102,106,003 Investment holding Hong Kong
Mulberry Land Company Ltd 100 100 HKD 200 Property investment Hong Kong
Hongkong Land (Chongqing) Development Co Ltd
100 100 USD 479,990,000 Property development Mainland China
Hongkong Land (Chongqing North) Development Co Ltd
100 100 HKD 3,980,000,000 Property development Mainland China
Hongkong Land (Chongqing) Investment and Holding Co Ltd
100 – USD 30,000,000 Investment holding Mainland China
Hongkong Land (Chonqqing) Xinchen Development Co Ltd
100 – RMB 20,000,000 Property development Mainland China
Wangfu Central Real Estate Development Co Ltd
84 84 RMB 3,500,000,000 Property investment Mainland China
HKL (Esplanade) Pte Ltd 100 100 SGD 150,000,000 Property investment Singapore
HKL Treasury (Singapore) Pte Ltd 100 100 SGD 2 Finance Singapore
The Hongkong Land Treasury Services (Singapore) Pte Ltd
100 100 SGD 2 Finance Singapore
* Owned directly
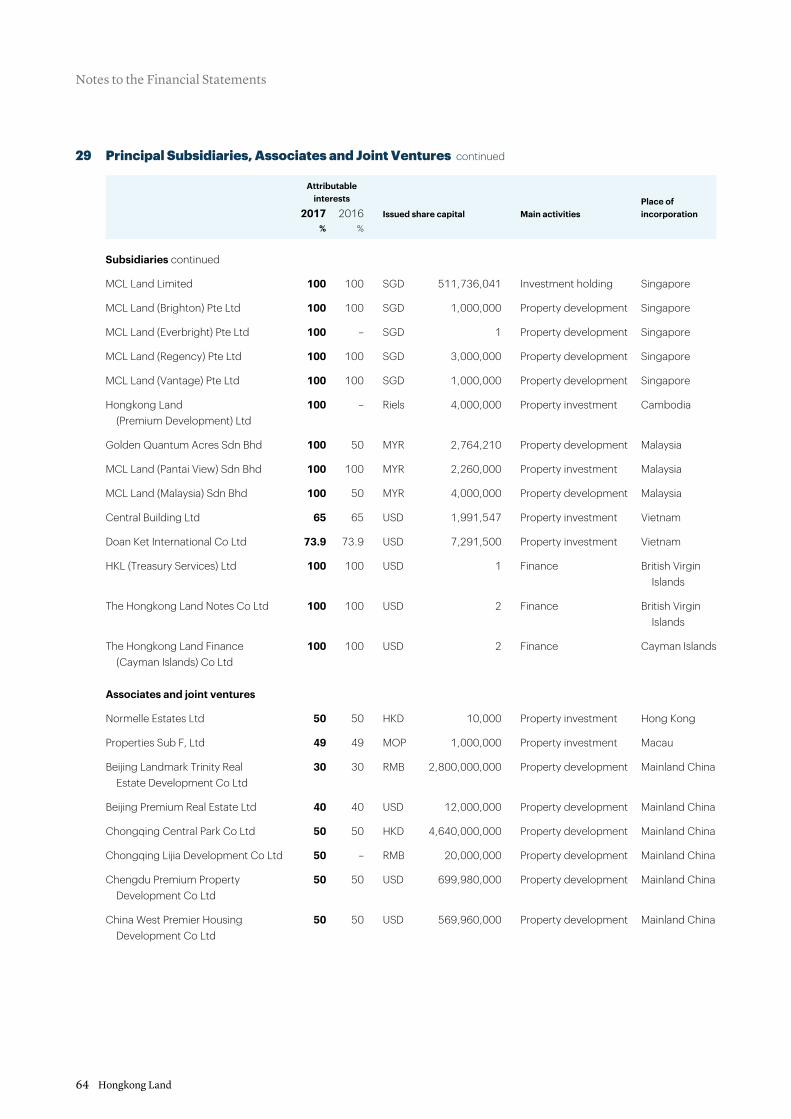
Notes to the Financial Statements
Hongkong Land64
Attributableinterests
Issued share capital Main activitiesPlace of incorporation2017 2016
% %
Subsidiaries continued
MCL Land Limited 100 100 SGD 511,736,041 Investment holding Singapore
MCL Land (Brighton) Pte Ltd 100 100 SGD 1,000,000 Property development Singapore
MCL Land (Everbright) Pte Ltd 100 – SGD 1 Property development Singapore
MCL Land (Regency) Pte Ltd 100 100 SGD 3,000,000 Property development Singapore
MCL Land (Vantage) Pte Ltd 100 100 SGD 1,000,000 Property development Singapore
Hongkong Land (Premium Development) Ltd
100 – Riels 4,000,000 Property investment Cambodia
Golden Quantum Acres Sdn Bhd 100 50 MYR 2,764,210 Property development Malaysia
MCL Land (Pantai View) Sdn Bhd 100 100 MYR 2,260,000 Property investment Malaysia
MCL Land (Malaysia) Sdn Bhd 100 50 MYR 4,000,000 Property development Malaysia
Central Building Ltd 65 65 USD 1,991,547 Property investment Vietnam
Doan Ket International Co Ltd 73.9 73.9 USD 7,291,500 Property investment Vietnam
HKL (Treasury Services) Ltd 100 100 USD 1 Finance British Virgin Islands
The Hongkong Land Notes Co Ltd 100 100 USD 2 Finance British Virgin Islands
The Hongkong Land Finance (Cayman Islands) Co Ltd
100 100 USD 2 Finance Cayman Islands
Associates and joint ventures
Normelle Estates Ltd 50 50 HKD 10,000 Property investment Hong Kong
Properties Sub F, Ltd 49 49 MOP 1,000,000 Property investment Macau
Beijing Landmark Trinity Real Estate Development Co Ltd
30 30 RMB 2,800,000,000 Property development Mainland China
Beijing Premium Real Estate Ltd 40 40 USD 12,000,000 Property development Mainland China
Chongqing Central Park Co Ltd 50 50 HKD 4,640,000,000 Property development Mainland China
Chongqing Lijia Development Co Ltd 50 – RMB 20,000,000 Property development Mainland China
Chengdu Premium Property Development Co Ltd
50 50 USD 699,980,000 Property development Mainland China
China West Premier Housing Development Co Ltd
50 50 USD 569,960,000 Property development Mainland China
29 Principal Subsidiaries, Associates and Joint Ventures continued

Annual Report 2017 65
29 Principal Subsidiaries, Associates and Joint Ventures continued
Attributableinterests
Issued share capital Main activitiesPlace of incorporation2017 2016
% %
Associates and joint ventures continued
Hangzhou Kesheng Property Development Co Ltd
30 – RMB 50,000,000 Property development Mainland China
Hangzhou Keyi Property Development Co Ltd
30 – RMB 50,000,000 Property development Mainland China
Longfor Hongkong Land (Chongqing) Development Co Ltd
50 50 RMB 1,275,920,000 Property development Mainland China
Longhu Land Ltd 50 50 USD 27,000,000 Property development Mainland China
Nanjing Shengxiangyuan Property Development Co Ltd
33 – RMB 30,000,000 Property development Mainland China
Shanghai Xujing Property Co Ltd 50 50 RMB 4,200,000,000 Property development Mainland China
Wuhan Dream Land Investment and Development Co Ltd
50 – RMB 1,200,000,000 Property development Mainland China
BFC Development LLP 33.3 33.3 SGD N/A Property investment Singapore
Central Boulevard Development Pte Ltd
33.3 33.3 SGD 6 Property investment Singapore
One Raffles Quay Pte Ltd 33.3 33.3 SGD 6 Property investment Singapore
PT Astra Modern Land 33.5 – IDR 3,870,000,000,000 Property development Indonesia
PT Brahmayasa Bahtera 40 40 IDR 166,000,000,000 Property development Indonesia
PT Bumi Parama Wisesa 49 49 IDR 1,950,000,000,000 Property development Indonesia
PT Jakarta Land 50 50 IDR 3,320,000,000 Property investment Indonesia
Sunrise MCL Land Sdn Bhd 50 50 MYR 2,000,000 Property development Malaysia
NorthPine Land Inc 40 40 Peso 1,224,635,200 Property development The Philippines
Roxas Land Corporation 40 40 Peso 3,133,000,000 Property development The Philippines
Gaysorn Land Co Ltd 49 49 THB 61,250,000 Property investment Thailand
S36 Property Co Ltd 49 – THB 310,000,000 Property development Thailand
Nassim JV Co Ltd 50 50 VND 286,200,000,000 Property development Vietnam
Jardine Gibbons Properties Ltd 40 40 BD 600,000 ‘A’ Property investment Bermuda 400,000 ‘B’

Hongkong Land66
To the members of Hongkong Land Holdings Limited
Report on the audit of the financial statements
Opinion
In our opinion, Hongkong Land Holdings Limited’s Group financial statements (the ‘financial statements’):
• give a true and fair view of the state of the Group’s affairs as at 31st December 2017 and of its profit and cash flows for the year then ended;
• have been properly prepared in accordance with International Financial Reporting Standards (‘IFRSs’) as issued by the International Accounting Standards Board (IASB); and
• have been prepared in accordance with the requirements of the Companies Act 1981 (Bermuda).
What we have auditedWe have audited the financial statements, included within the Annual Report, which comprise: the Consolidated Balance Sheet as at 31st December 2017; the Consolidated Profit and Loss Account, Consolidated Statement of Comprehensive Income, the Consolidated Cash Flow Statement, and the Consolidated Statement of Changes in Equity for the year then ended; and the Notes to the Financial Statements, which include a description of the significant accounting policies.
Certain required disclosures have been presented in the Corporate Governance section on page 73, rather than in the notes to the consolidated financial statements. These disclosures are cross-referenced from the consolidated financial statements and are identified as audited.
Basis for opinion
We conducted our audit in accordance with International Standards on Auditing (UK) (‘ISAs (UK)’) and applicable law. Our responsibilities under ISAs (UK) are further described in the Auditors’ responsibilities for the audit of the financial statements section of our report. We believe that the audit evidence we have obtained is sufficient and appropriate to provide a basis for our opinion.
IndependenceWe remained independent of the Group in accordance with the ethical requirements that are relevant to our audit of the financial statements in the UK, which includes the Financial Reporting Council’s (‘FRC’s’) Ethical Standard as applicable to listed entities, and we have fulfilled our other ethical responsibilities in accordance with these requirements.
Our audit approach
OverviewMateriality• Overall Group materiality: US$383.0 million which represents 1% of total non-current assets.• Specific Group materiality, applied to balances not related to investment properties: US$56.0 million which represents 5% of
Underlying Profit before tax.
Audit scope• A full scope audit was performed on seven entities. These subsidiaries accounted for 94% of the Group’s revenue, 97% of the
Group’s profit before tax and 80% of the Group’s total non-current assets.• Full scope audits of three joint ventures were also performed which accounted for 2% of the Group’s profit before tax and 6% of
the Group’s total non-current assets.• Specified procedures were performed over selected material financial statement line items for 17 other entities.
Key audit matter• Valuation of investment properties.
The scope of our auditAs part of designing our audit, we determined materiality and assessed the risks of material misstatement in the financial statements. In particular, we looked at where the Directors made subjective judgements, for example in respect of significant accounting estimates that involved making assumptions and considering future events that are inherently uncertain. As in all of our audits we also addressed the risk of management override of internal controls, including evaluating whether there was evidence of bias by the Directors that represented a risk of material misstatement due to fraud.
Independent Auditors’ Report

Annual Report 2017 67
Our audit approach continued
Key audit mattersKey audit matters are those matters that, in the auditors’ professional judgement, were of most significance in the audit of the financial statements of the current period and include the most significant assessed risks of material misstatement (whether or not due to fraud) identified by the auditors, including those which had the greatest effect on: the overall audit strategy, the allocation of resources in the audit and directing the efforts of the engagement team. These matters, and any comments we make on the results of our procedures thereon, were addressed in the context of our audit of the financial statements as a whole, and in forming our opinion thereon, and we do not provide a separate opinion on these matters. This is not a complete list of all risks identified by our audit.
How we tailored the audit scopeWe tailored the scope of our audit to ensure that we performed sufficient audit work to be able to give an opinion on the financial statements as a whole, taking into account the geographic locations and structure of the Group, the accounting processes and controls in place and the industry in which the Group operates.
The Group’s accounting processes are structured around finance functions, which are responsible for their own accounting records and controls, which in turn, report financial information to the Group’s finance function in Hong Kong to enable them to prepare consolidated financial statements.
Key audit matter
Valuation of investment propertiesRefer to Note 3 (Critical Accounting Estimates and Judgements) and Note 12 (Investment Properties) to the consolidated financial statements.
The fair value of the Group’s investment properties amounted to US$32,481.0 million at 31st December 2017, with a revaluation gain of US$4,677.9 million recognised as a non-trading item in the consolidated profit and loss account for the year. The Group’s property portfolio principally consists of commercial properties.
The valuation of the Group’s investment property portfolio is inherently subjective due to, among other factors, the individual nature of each property, its location, prevailing market returns and the expected future rentals for that particular property.
The valuations were carried out by third party valuers (the ‘valuers’). In determining a property’s valuations, the valuers make assumptions, judgements and estimates in key areas. Valuations are principally derived using the income capitalisation method. Judgements are made in respect of capitalisation rates and market rents.
We focused on the valuation of investment properties due to the significant judgements and estimates involved in determining the valuations.
How our audit addressed the key audit matter
We assessed the valuers’ qualifications and their expertise, considering whether there were any matters that might have affected their objectivity or may have imposed scope limitations upon their work. We found no evidence to suggest that the objectivity of the valuers in their performance of the valuations was compromised.
Our work focused on the highest value properties in the portfolio, namely the buildings in the financial district of Central, Hong Kong.
We read the valuation reports for the Hong Kong properties covering the majority of the total investment property portfolio and considered the valuation approach used was appropriate for each property and suitable for use in determining the carrying value. We performed testing, on a sample basis, on the input data used in the valuation process to satisfy ourselves of the accuracy of the property information supplied to the valuers by management, for example agreement of lease terms to tenancy agreements and other supporting documents.
We understood and assessed the Group’s controls over data used in the valuation of the investment property portfolio and management’s review of the valuations.
The audit team, including our valuation specialists, attended meetings with the valuers at which the valuations and the key assumptions therein were discussed. We compared the capitalisation rates used by the valuers with an estimated range of expected yields, determined via reference to published benchmarks and market information. We evaluated year-on-year movements in capital value and rentals with reference to publicly available information and market rents. We evaluated whether assumptions were appropriate in light of the evidence provided by significant transactions which had taken place in local markets during the year.
We concluded that the assumptions used in the valuations were supportable in light of available evidence.
Hongkong Land68
Our audit approach continued
How we tailored the audit scope continuedIn establishing the overall approach to the Group audit, we determined the type of work that needed to be performed by members of the Group engagement team or by component auditors from within the PwC Network and other auditors operating under our instruction. Where the work was performed by component auditors, we determined the level of involvement we needed to have in the audit work at those components to be able to conclude whether sufficient appropriate audit evidence had been obtained as a basis for our opinion on the financial statements as a whole. The Group engagement team was involved in the significant reporting entities in scope for Group reporting during the audit cycle through a combination of meetings, visits and conference calls. The lead Group audit partner and other senior team members undertook multiple visits to Hong Kong during the audit and were involved throughout the year in regular conference calls and other forms of communication to direct and oversee the audit throughout the year. Other senior team members visited a number of countries, including Singapore and mainland China during the audit to review the work of component teams with regular communication throughout the year.
A full scope audit of the complete financial information was performed for seven subsidiaries which accounted for 94% of the Group’s revenue, 97% of the Group’s profit before tax and 80% of the Group’s total non-current assets. Full scope audits of the complete financial information were also performed for three principal joint ventures which accounted for 2% of the Group’s profit before tax and 6% of the Group’s total non-current assets. Specified procedures were performed over selected material financial statement line items for 17 other entities. This, together with procedures performed on centralised functions and at the Group level (on the consolidation and other areas of significant judgement), gave us the evidence we needed for our opinion on the financial statements as a whole.
MaterialityThe scope of our audit was influenced by our application of materiality. We set certain quantitative thresholds for materiality. These, together with qualitative considerations, helped us to determine the scope of our audit and the nature, timing and extent of our audit procedures on the individual financial statement line items and disclosures and in evaluating the effect of misstatements, both individually and in aggregate on the financial statements as a whole.
Based on our professional judgement, we determined materiality for the financial statements as a whole as follows:
Overall Group materiality US$383.0 millionHow we determined it 1% of total non-current assetsRationale for benchmark applied A key determinant of the Group’s value is investment property. As non-current assets
primarily comprise investment properties, we set an overall Group materiality level based on total non-current assets
We set a specific materiality level of US$56.0 million for items not related to the carrying value of investment properties and their related fair value changes (either wholly owned or held within joint ventures). This equates to 5% of Underlying Profit before tax.
For each component in the scope of our Group audit, we allocated a materiality that is less than our overall Group materiality. The range of materiality allocated across components was US$1.0 million to US$21.0 million.
We agreed with the Audit Committee that we would report to them misstatements identified during our audit of investment property related items above US$19.0 million as well as misstatements below that amount that in our view, warranted reporting for qualitative reasons. For all other account balances, we agreed with the Audit Committee that we would report to them misstatements identified during our audit above US$2.8 million as well as misstatements below that amount that in our view, warranted reporting for qualitative reasons.
Conclusions relating to going concern
In accordance with ISAs (UK) we are required to report if the Directors’ use of the going concern basis of accounting in the preparation of the financial statements is not appropriate or the Directors have not disclosed in the financial statements any identified material uncertainties that may cast significant doubt about the Group’s ability to continue to adopt the going concern basis of accounting for a period of at least twelve months from the date when the financial statements are authorised for issue. We have nothing to report.
However, because not all future events or conditions can be predicted, this statement is not a guarantee as to the Group’s ability to continue as a going concern.
Independent Auditors’ Report

Annual Report 2017 69
Reporting on other information
The other information comprises all of the information in the Annual Report other than the financial statements and our auditors’ report thereon. The Directors are responsible for the other information. Our opinion on the financial statements does not cover the other information and, accordingly, we do not express an audit opinion or, except to the extent otherwise explicitly stated in this report, any form of assurance thereon.
In connection with our audit of the financial statements, our responsibility is to read the other information and, in doing so, consider whether the other information is materially inconsistent with the financial statements or our knowledge obtained in the audit, or otherwise appears to be materially misstated. If we identify an apparent material inconsistency or material misstatement, we are required to perform procedures to conclude whether there is a material misstatement of the financial statements or a material misstatement of the other information. If, based on the work we have performed, we conclude that there is a material misstatement of this other information, we are required to report that fact. We have nothing to report based on these responsibilities.
Responsibilities for the financial statements and the audit
Responsibilities of the Directors for the financial statementsAs explained more fully in the Responsibility Statement set out on page 71, the Directors are responsible for the preparation of the financial statements in accordance with the applicable framework and for being satisfied that they give a true and fair view. The Directors are also responsible for such internal control as they determine is necessary to enable the preparation of financial statements that are free from material misstatement, whether due to fraud or error.
In preparing the financial statements, the Directors are responsible for assessing the Group’s ability to continue as a going concern, disclosing as applicable, matters related to going concern and using the going concern basis of accounting unless the Directors either intend to liquidate the Group or to cease operations, or have no realistic alternative but to do so.
Auditors’ responsibilities for the audit of the financial statementsOur objectives are to obtain reasonable assurance about whether the financial statements as a whole are free from material misstatement, whether due to fraud or error, and to issue an auditors’ report that includes our opinion. Reasonable assurance is a high level of assurance, but is not a guarantee that an audit conducted in accordance with ISAs (UK) will always detect a material misstatement when it exists. Misstatements can arise from fraud or error and are considered material if, individually or in the aggregate, they could reasonably be expected to influence the economic decisions of users taken on the basis of these financial statements.
A further description of our responsibilities for the audit of the financial statements is located on the FRC’s website at: www.frc.org.uk/auditorsresponsibilities. This description forms part of our auditors’ report.
Use of this reportThis report, including the opinions, has been prepared for and only for the company’s members as a body in accordance with Section 90 of the Companies Act 1981 (Bermuda) and for no other purpose. We do not, in giving these opinions, accept or assume responsibility for any other purpose or to any other person to whom this report is shown or into whose hands it may come save where expressly agreed by our prior consent in writing.
John Bakerfor and on behalf of PricewaterhouseCoopers LLPChartered AccountantsLondon8th March 2018
(a) The maintenance and integrity of the Hongkong Land Holdings Limited website is the responsibility of the Directors; the work carried out by the auditors does not involve consideration of these matters and, accordingly, the auditors accept no responsibility for any changes that may have occurred to the financial statements since they were initially presented on the website.
(b) Legislation in Bermuda governing the preparation and dissemination of financial statements may differ from legislation in other jurisdictions.

Hongkong Land70
Five Year Summary
2013 2014 2015 2016 2017US$m US$m US$m US$m US$m
Profit attributable to shareholders 1,190 1,327 2,012 3,346 5,585
Underlying profit attributable to shareholders 935 930 905 848 970
Investment properties 23,583 23,697 24,957 27,712 32,481
Net debt 3,025 2,657 2,341 2,008 2,549
Shareholders’ funds 26,857 27,548 28,685 31,294 36,774
US$ US$ US$ US$ US$
Net asset value per share 11.41 11.71 12.19 13.30 15.63
Underlying earnings/dividends per share (US¢)
Net asset value per share (US$)
2013 2014 2015 2016 2017
39.73
18.00
39.52
19.00
38.44
19.00
41.21
20.00
36.03
19.00
DividendsUnderlying earnings 2013 2014 2015 2016 2017
15.63
13.30
11.41 11.7112.19

Annual Report 2017 71
Responsibility Statement
The Directors of the Company confirm to the best of their knowledge that:
a. the consolidated financial statements have been prepared in accordance with International Financial Reporting Standards, including International Accounting Standards and Interpretations adopted by the International Accounting Standards Board; and
b. the sections of this Report, including the Chairman’s Statement, Chief Executive’s Review and Principal Risks and Uncertainties, which constitute the management report include a fair review of all information required to be disclosed by the Disclosure Guidance and Transparency Rules 4.1.8 to 4.1.11 issued by the Financial Conduct Authority in the United Kingdom.
For and on behalf of the Board
Robert WongSimon DixonDirectors8th March 2018

Hongkong Land72
Corporate Governance
Hongkong Land Holdings Limited is incorporated in Bermuda. The Company’s property interests are almost entirely in Asia. The Company’s equity shares have a standard listing on the Main Market of the London Stock Exchange, and secondary listings in Bermuda and Singapore. The Disclosure Guidance and Transparency Rules (the ‘DTRs’) issued by the Financial Conduct Authority in the United Kingdom (the ‘FCA’) require that this Report address all relevant information about the corporate governance practices applied beyond the requirements under Bermuda law.
The Company attaches importance to the corporate stability and opportunities that result from it being part of the Jardine Matheson Holdings Limited (‘Jardine Matheson’) group, which is considered to be fundamental to the Company’s ability to pursue a long-term strategy in Asian markets. By coordinating objectives, establishing common values and standards, and sharing experience, contacts and business relationships, Jardine Matheson helps the Group to optimise its opportunities in the countries in which it operates.
The Group is committed to high standards of governance. The system of governance it has adopted is based on a well-tried approach to oversight and management that has been developed over many years by the members of the Jardine Matheson group. It enables the Group to benefit from Jardine Matheson’s strategic guidance and professional expertise, while at the same time the independence of the Board is respected and clear operational accountability rests with the Company’s executive management team.
The Management of the Group
The Company has its dedicated executive management under the Chief Executive. The Memorandum of Association of the Company, however, provides for the chairman of Jardine Matheson to be, or to appoint, the Managing Director of the Company. Reflecting this, and the Jardine Matheson group’s 50% interest in the Company’s share capital, the Chief Executive and the Managing Director meet regularly. Similarly, the board of the Hong Kong-based Group management company, Hongkong Land Limited (‘HKL’), and its finance committee are chaired by the Managing Director and include Group executives as well as Jardine Matheson’s deputy managing director, group finance director, group strategy director and group general counsel.
The presence of Jardine Matheson representatives on the Board and on the board of HKL, as well as on its audit and finance committees, provides an added element of stability to the Company‘s financial planning and supervision, enhancing its ability to raise finance and take a long-term view of business development. It also eases the ability of management to work effectively together in exploiting the full range of the Jardine Matheson group’s commercial strengths.
The Directors of the Company retain full power to manage the business affairs of the Company, other than matters reserved to be exercised by the Company in general meeting under Bermuda legislation or the Company’s Bye-laws. Among the matters on which the Board decides are the Group’s business strategy, its annual budget, dividends and major corporate activities.
The Board
The Company currently has a Board of 16 Directors. Their names and brief biographies appear on pages 18 and 19 of this Report. The Chairman has been appointed in accordance with the provisions of the Bye-laws of the Company, which provide that the chairman of Jardine Matheson, or any Director nominated by him, shall be the Chairman of the Company. The Board composition and operation helps to provide the Company with the necessary stability as it seeks to grow its business.
The role of the Chairman is to lead the Board as it oversees the Group’s strategic and financial direction, while the principal role of the Managing Director is to act as chairman of HKL and of its finance committee. Ben Keswick is currently appointed to both positions. The responsibility for running the Group’s business and all the executive matters affecting the Group rests with the Chief Executive, Robert Wong. The implementation of the Group’s strategy is delegated to the Company’s executive management, with decision-making authority within designated financial parameters delegated to the HKL finance committee.
The Board is scheduled to hold four meetings in 2018 and ad hoc procedures are adopted to deal with urgent matters. In 2017 one meeting was held in Bermuda and three were held in Asia. The Board receives high quality, up to date information for each of its meetings. In addition, certain Directors of the Company who do not serve on the board of HKL and who are based outside Asia regularly visit Asia and Bermuda to discuss the Group’s business, as well as to participate in the four strategic reviews that precede the regular Board meetings. These Directors are not directly involved in the operational management of the Group’s business activities, but their knowledge and close oversight of the Group’s affairs reinforces the process by which business is reviewed before consideration at Board meetings.
Annual Report 2017 73
Directors’ Appointment, Retirement, Remuneration and Service Contracts
Candidates for appointment as executive Directors of the Company, as executive directors of HKL or as senior executives elsewhere in the Group may be sourced internally, or from the Jardine Matheson group or externally, including by using the services of specialist executive search firms. The aim is to appoint individuals who combine international best practice with familiarity of or adaptability to Asian markets. When appointing non-executive Directors, the Board pays particular attention to the Asian business experience and relationships that they can bring.
Each new Director is appointed by the Board and, in accordance with the Company’s Bye-laws, each new Director so appointed is subject to retirement at the first annual general meeting after appointment. Thereafter, Directors are subject to retirement by rotation under the Bye-laws whereby one-third of the Directors retire at the annual general meeting each year. These provisions apply to both executive and non-executive Directors, but the requirement to retire by rotation does not extend to the Chairman or Managing Director.
At this year’s Annual General Meeting to be held on 9th May 2018, Dr Richard Lee is to retire and will not seek re-election. It is proposed that Christina Ong will join the Board following the Annual General Meeting. In accordance with Bye-law 85, Mark Greenberg, Lord Powell of Bayswater, James Watkins and Percy Weatherall retire by rotation and, being eligible, offer themselves for re-election. None of the Directors proposed for re-election has a service contract with the Company or its subsidiaries.
The Company’s policy is to offer competitive remuneration packages to its senior executives. It is recognised that, due to the nature of the Group and its diverse geographic base, a number of its senior executives are required to be offered international terms and the nature of the remuneration packages is designed to reflect this. Executive Directors joining from outside the Group may be offered an initial fixed-term service contract to reflect any requirement for them to relocate.
Recommendations and decisions on remuneration and other benefits payable or made available to executive Directors result from consultations between the Chairman and other Directors as he considers appropriate. Directors’ fees, which are payable to all Directors other than the Chief Executive and the Chief Financial Officer, are decided upon by shareholders in general meeting as provided for by the Company’s Bye-laws.
For the year ended 31st December 2017, the Directors received from the Group US$8.2 million (2016: US$7.7 million) in Directors’ fees and employee benefits, being US$0.9 million (2016: US$0.8 million) in Directors’ fees, US$7.0 million (2016: US$6.6 million) in short-term employee benefits including salary, bonuses, accommodation and deemed benefits in kind and US$0.3 million (2016: US$0.3 million) in post-employment benefits. The information set out in this paragraph forms part of the audited financial statements.
The Company has in place notional share option plan under which cash bonuses are paid based on the performance of the Company’s share price over a period. The notional plan was established to provide longer-term incentives for executive Directors and senior managers. Notional share options are granted after consultation between the Chairman and the Chief Executive as well as other Directors as they consider appropriate.
The Company purchases insurance to cover its Directors against their costs in defending themselves in civil proceedings taken against them in that capacity and in respect of damages resulting from the unsuccessful defence of any proceedings. To the extent permitted by law, the Company also indemnifies its Directors. Neither the insurance nor the indemnity provides cover where the Director has acted fraudulently or dishonestly.

Hongkong Land74
Audit Committee
The Board has established within HKL an audit committee (the ‘Audit Committee’), the current members of which are Y.K. Pang, Mark Greenberg, Jeremy Parr and John Witt; they have extensive knowledge of the Group while at the same time not being directly involved in operational management. The chairman, chief executive and chief financial officer of HKL, together with representatives of the internal and external auditors, also attend the Audit Committee meetings by invitation. The Audit Committee meets and reports to the Board semi-annually.
Prior to completion and announcement of the half-year and year-end results, a review of the financial information and of any issues raised in connection with the preparation of the results, including the adoption of new accounting policies, is undertaken by the Audit Committee with the executive management and a report is received from the external auditors. The external auditors also have access to the full Board, in addition to the Chief Executive, Chief Financial Officer and other senior executives.
The Audit Committee keeps under review the nature, scope and results of the audits conducted by the internal audit function. The Audit Committee’s responsibilities extend to reviewing the effectiveness of both the internal and external audit functions; considering the independence and objectivity of the external auditors; and reviewing and approving the level and nature of non-audit work performed by the external auditors.
The terms of reference of the Audit Committee can be found on the Company’s website at www.hkland.com.
Risk Management and Internal Control
The Board has overall responsibility for the Group’s systems of risk management and internal control. The Board has delegated to the Audit Committee responsibility for providing oversight in respect of risk management activities. The Audit Committee considers the Group’s principal risks and uncertainties and potential changes to the risk profile, and reviews the operation and effectiveness of the Group’s systems of internal control and the procedures by which these risks are monitored and mitigated. The Audit Committee considers the systems and procedures on a regular basis, and reports to the Board semi-annually. The systems of internal control are designed to manage, rather than eliminate, business risk; to help safeguard the Group’s assets against fraud and other irregularities; and to give reasonable, but not absolute, assurance against material financial misstatement or loss.
Executive management is responsible for the implementation of the systems of internal control throughout the Group. The internal audit function also monitors the effectiveness of the systems of internal control and the approach taken by the business units to risk. The internal audit function is independent of the operating businesses and reports its findings, and recommendations for any corrective action required, to the Audit Committee.
The Group has in place an organisational structure with defined lines of responsibility and delegation of authority. There are established policies and procedures for financial planning and budgeting; for information and reporting systems; for assessment of risk; and for monitoring the Group’s operations and performance. The information systems in place are designed to ensure that the financial information reported is reliable and up to date.
The Company’s policy on commercial conduct underpins the Group’s internal control process, particularly in the area of compliance. The policy is set out in the Group’s Code of Conduct, which is a set of guidelines to which every employee must adhere, and is reinforced and monitored by an annual compliance certification process.
The Audit Committee has also been given the responsibility to oversee the effectiveness of the formal procedures for employees to raise any matters of serious concern, and is required to review any reports made under those procedures that are referred to it by the internal audit function.
The principal risks and uncertainties facing the Company are set out on page 78.
Corporate Governance

Annual Report 2017 75
Directors’ Responsibilities in respect of the Financial Statements
The Directors are required under the Bermuda Companies Act to prepare financial statements for each financial year and to present them annually to the Company’s shareholders at the annual general meeting. The financial statements are required to present fairly in accordance with International Financial Reporting Standards (‘IFRS’) the financial position of the Group at the end of the year and the results of its operations and its cash flows for the year then ended. The Directors consider that applicable accounting policies under IFRS, applied on a consistent basis and supported by prudent and reasonable judgements and estimates, have been followed in preparing the financial statements. The financial statements have been prepared on a going concern basis.
Code of Conduct
The Group conducts business in a professional, ethical and even-handed manner. Its ethical standards are clearly set out in its Code of Conduct, which is modelled on the Jardine Matheson group’s code of conduct. The Code of Conduct requires that all Group companies comply with all laws of general application, all rules and regulations that are industry specific and proper standards of business conduct. The Code of Conduct prohibits the giving or receiving of illicit payments, and requires that all managers must be fully aware of their obligations under the Code of Conduct and establish procedures to ensure compliance at all levels within their organisations.
The Code of Conduct also encourages inclusion and diversity, and requires all employees to be treated fairly, impartially and with dignity and respect. As a multinational Group with a broad range of businesses operating across Asia, the Group believes in promoting equal opportunities in recruiting, developing and rewarding its people regardless of race, gender, nationality, religion, sexual orientation, disability, age or background. The scale and breadth of the Group’s businesses necessitate that they seek the best people from the communities in which they operate most suited to their needs.
The Group has in place procedures by which employees can raise, in confidence, matters of serious concern in areas such as financial reporting or compliance. Directors’ Share Interests
The Directors of the Company in office on 8th March 2018 had interests (within the meaning of the EU Market Abuse Regulation (‘MAR’), which applies to the Company as it is listed on the London Stock Exchange) as set out below in the ordinary share capital of the Company. These interests include those notified to the Company in respect of the Directors’ closely associated persons (as that term is used under MAR).
Charles Allen-Jones 60,000 Dr Richard Lee 3,678,685 Anthony Nightingale 2,184 Y.K. Pang 38,000
In addition, Robert Wong held share options in respect of 900,000 ordinary shares issued pursuant to the Company’s notional share option plan.
Substantial Shareholders
As a non-UK issuer, the Company is subject to the DTRs pursuant to which a person must in certain circumstances notify the Company of the percentage of voting rights attaching to the share capital of the Company that he holds. The obligation to notify arises if that person acquires or disposes of shares in the Company which results in the percentage of voting rights which he holds reaching, exceeding, or falling below, 5%, 10%, 15%, 20%, 25%, 30%, 50% and 75%.
The Company has been informed of the holding of voting rights of 5% or more attaching to the Company’s issued ordinary share capital by Jardine Strategic Holdings Limited (‘Jardine Strategic’), which is directly interested in 1,176,616,646 ordinary shares carrying 50.01% of the voting rights. By virtue of its interest in Jardine Strategic, Jardine Matheson is also interested in the same ordinary shares. Apart from this shareholding, the Company is not aware of any holders of voting rights of 5% or more attaching to the issued ordinary share capital of the Company as at 8th March 2018.
There were no contracts of significance with corporate substantial shareholders during the year under review.

Hongkong Land76
Governance Principles
The Company’s primary listing on the London Stock Exchange is a standard listing on the Main Market. Under a standard listing, the Company is subject to the UK Listing Rules (other than those which apply only to companies with a premium listing), the DTRs, the UK Prospectus Rules and MAR. The Company, therefore, is bound by the rules in relation to continuous disclosure, periodic financial reporting, disclosure of interests in shares and market abuse, including the rules governing insider dealing, market manipulation and the disclosure of inside information. The Company is also subject to regulatory oversight from the FCA, as the Company’s principal securities regulator, and is required to comply with the Admission and Disclosure Standards of the Main Market of the London Stock Exchange.
When shareholders approved the Company’s move to a standard listing from a premium listing in 2014, the Company stated that it intended to maintain certain governance principles on the same basis as was then applicable to the Company’s premium listing, as follows:
1. When assessing a significant transaction, being a larger transaction which would be classified as a class 1 transaction under the provisions of the UK Listing Rules, the Company will engage an independent financial adviser to provide a fairness opinion on the terms of the transaction.
2. In the event of a related party transaction, being a transaction with a related party which would require a sponsor to provide a fair and reasonable opinion under the provisions of the UK Listing Rules, the Company will engage an independent financial adviser to confirm that the terms of the transaction are fair and reasonable as far as the shareholders of the Company are concerned.
3. Further, as soon as the terms of a significant transaction or a related party transaction are agreed, an announcement will be issued by the Company providing such details of the transaction as are necessary for investors to evaluate the effect of the transaction on the Company.
4. At each annual general meeting, the Company will seek shareholder approval to issue new shares on a non-pre-emptive basis for up to 33% of the Company’s issued share capital, of which up to 5% can be issued for cash consideration.
5. The Company will continue to adhere to its Securities Dealing Rules. These rules, which were based on the UK Model Code, have since been revised to follow the provisions of MAR with respect to market abuse and disclosure of interests in shares.
6. The Company will continue its policies and practices in respect of risk management and internal controls.
Related Party Transactions
Details of transactions with related parties entered into by the Company during the course of the year are included in Note 27 to the financial statements on page 61.
Securities Purchase Arrangements
The Directors have the power under the Bermuda Companies Act and the Company’s Memorandum of Association to purchase the Company’s shares. Any shares so purchased shall be treated as cancelled and, therefore, reduce the issued share capital of the Company. When the Board reviews the possibility for share repurchases, it will take into consideration the potential for the enhancement of earnings or asset values per share. When purchasing such shares, the Company is subject to the provisions of MAR.
Takeover Code
The Company is subject to a Takeover Code, based on London’s City Code on Takeovers and Mergers. The Takeover Code provides an orderly framework within which takeovers can be conducted and the interests of shareholders protected. The Takeover Code has statutory backing, being established under the Acts of incorporation of the Company in Bermuda.
Corporate Governance

Annual Report 2017 77
Annual General Meeting
The 2018 Annual General Meeting will be held on 9th May 2018. The full text of the resolutions and explanatory notes in respect of the meeting are contained in the Notice of Meeting which accompanies this Report. A corporate website is maintained containing a wide range of information of interest to investors at www.hkland.com.
Power to Amend Bye-laws
The Bye-laws of the Company can be amended by the shareholders by way of a special resolution at a general meeting of the Company.

Hongkong Land78
Principal Risks and Uncertainties
The Board has overall responsibility for risk management and internal control. The process by which the Group identifies and manages risk is set out in more detail on page 74 of the Corporate Governance section of this Report. The following are the principal risks and uncertainties facing the Company as required to be disclosed pursuant to the Disclosure Guidance and Transparency Rules issued by the Financial Conduct Authority in the United Kingdom and are in addition to the matters referred to in the Chairman’s Statement and Chief Executive’s Review.
Economic Risk and Financial Risk
The Group is exposed to the risk of negative developments in global and regional economies, and financial and property markets, either directly or through the impact on the Group’s joint venture partners, bankers, suppliers or tenants. These developments can result in:
• recession, inflation, deflation and currency fluctuations;• restrictions in the availability of credit, increases in financing and construction costs and business failures; and• reductions in office and retail rents, office and retail occupancy and sales prices of, and demand for, residential developments.
Such developments might increase costs of sales and operating costs, reduce revenues, increase net financing charges, or result in reduced valuations of the Group’s investment properties or in the Group being unable to meet in full its strategic objectives.
The steps taken by the Group to manage its exposure to financial risk are set out in the Financial Review on page 15 and Note 2 to the financial statements on pages 31 to 37.
Commercial Risk
Risks are an integral part of normal commercial practices, and where practicable steps are taken to mitigate such risks. These risks are further pronounced when operating in volatile markets.
The Group makes significant investment decisions in respect of commercial and residential development projects that take time to come to fruition and achieve the desired returns and are, therefore, subject to market risks. These risks are further pronounced when operating in volatile markets.
The Group operates in areas that are highly competitive, and failure to compete effectively in terms of price, tender terms, product specification or levels of service can have an adverse effect on earnings or market share, as can construction risks in relation to new developments. Significant pressure from such competition may also lead to reduced margins. The quality and safety of the products and services provided by the Group are important and there is an associated risk if they are below standard, while any damage to brand equity or reputation might adversely impact the ability to achieve acceptable revenues and profit margins.
The potential impact due to the disruption to IT systems or infrastructure, whether by cyber-crime or other reasons, may be significant.
Regulatory and Political Risk
The Group is subject to a number of regulatory environments in the territories in which it operates. Changes in the regulatory approach to such matters as foreign ownership of assets and businesses, exchange controls, planning controls, tax rules and employment legislation have the potential to impact the operations and profitability of the Group. Changes in the political environment in such territories can also affect the Group.
Terrorism, Pandemic and Natural Disasters
A number of the Group’s interests are vulnerable to the effects of terrorism, either directly through the impact of an act of terrorism or indirectly through the impact of generally reduced economic activity in response to the threat of or an actual act of terrorism.
The Group would be impacted by a global or regional pandemic which could be expected to seriously affect economic activity and the ability of our business to operate smoothly. In addition, many of the territories in which the Group is active can experience from time to time natural disasters such as earthquakes and typhoons.

Annual Report 2017 79
Shareholder Information
Financial Calendar
2017 full-year results announced 8th March 2018
Shares quoted ex-dividend on the Singapore Exchange 21st March 2018
Shares quoted ex-dividend on the London Stock Exchange 22nd March 2018
Share registers closed 26th to 30th March 2018
Annual General Meeting to be held 9th May 2018
2017 final dividend payable 16th May 2018
2018 half-year results to be announced 26th July 2018 *
Shares quoted ex-dividend on the Singapore Exchange 15th August 2018 *
Shares quoted ex-dividend on the London Stock Exchange 16th August 2018 *
Share registers to be closed 20th to 24th August 2018 *
2018 interim dividend payable 10th October 2018 *
* Subject to change
Dividends
Shareholders will receive their cash dividends in United States dollars, unless they are registered on the Jersey branch register where they will have the option to elect for sterling. These shareholders may make new currency elections for the 2017 final dividend by notifying the United Kingdom transfer agent in writing by 27th April 2018. The sterling equivalent of dividends declared in United States dollars will be calculated by reference to a rate prevailing on 2nd May 2018. Shareholders holding their shares through CREST in the United Kingdom will receive their cash dividends in sterling only. Shareholders holding their shares through The Central Depository (Pte) Limited (‘CDP’) in Singapore will receive their cash dividends in United States dollars unless they elect, through CDP, to receive Singapore dollars.
Registrars and Transfer Agent
Shareholders should address all correspondence with regard to their shareholdings or dividends to the appropriate registrar or transfer agent.
Principal RegistrarJardine Matheson International Services LimitedP.O. Box HM 1068Hamilton HM EXBermuda
Jersey Branch Registrar Singapore Branch RegistrarLink Market Services (Jersey) Limited M & C Services Private Limited12 Castle Street 112 Robinson Road #05-01St Helier, Jersey JE2 3RT Singapore 068902Channel Islands
United Kingdom Transfer AgentLink Asset ServicesThe Registry34 Beckenham RoadBeckenham, Kent BR3 4TUUnited Kingdom
Press releases and other financial information can be accessed through the internet at www.hkland.com.

Hongkong Land80
Hongkong Land Holdings LimitedJardine House33-35 Reid StreetHamiltonBermudaTel +1441 292 0515E-mail: [email protected] A. Barnes
Hongkong Land LimitedOne Exchange Square, 8th FloorHong KongTel +852 2842 8428E-mail: [email protected] Wong
Hongkong Land (Beijing) Management Company LimitedRoom 303, Block 26, Central ParkNo. 6 Chaoyangmenwai AvenueChaoyang DistrictBeijing 100020ChinaTel +8610 6597 0921E-mail: [email protected] Zhang
Hongkong Land (Chongqing) Management Company Limited7/F, Zone D, Neptune BuildingNo. 62 Star Light RoadNew North ZoneChongqing 401147ChinaTel +8623 6703 3016-8E-mail: [email protected] Chang Feng
Hongkong Land (Philippines) Consultancy, Inc.1803 The Taipan PlaceF. Ortigas Jr. RoadOrtigas CenterPasig City 1605PhilippinesTel +632 625 6880E-mail: [email protected] Chee Hoe
Hongkong Land (Premium Investments) LimitedExchange Square Unit 702, 7th FloorNo. 19 & 20Street 106, Village 2Sangkat Wat PhnomKhan Daun Penh, Phnom PenhCambodiaTel +855 2399 2063E-mail: [email protected] Shu
Offices
Hongkong Land (Shanghai) Management Company LimitedUnit 1601a, 07-08 Finance Square333 Jiujiang Road, Huangpu DistrictShanghai 200001ChinaTel +8621 6333 3921E-mail: [email protected] Tong
Hongkong Land (Singapore) Pte. Ltd.One Raffles QuayNorth Tower #34-03Singapore 048583Tel +65 6238 1121E-mail: [email protected] Garman
HKL (Vietnam) Consultancy and Management Company LimitedSuite 704, The Metropolitan235 Dong KhoiBen Nghe Ward, District 1Ho Chi Minh CityVietnamTel +8428 3827 9006E-mail: [email protected] Jencks
Beijing Yee Zhi Real Estate Consultancy Co., Ltd.Room 1013, 10/FOffice Tower 1 Beijing APMNo. 138 Wangfujing StreetDongcheng DistrictBeijing 100006ChinaTel +8610 6520 4828E-mail: [email protected] Ko
MCL Land Limited78 Shenton Way #33-00Singapore 079120Tel +65 6221 8111E-mail: [email protected] Wee Hsien
PT Hongkong Land Consultancy and ManagementWorld Trade Centre 1, 17th FloorJl. Jend. Sudirman Kav. 29–31Jakarta 12920IndonesiaTel +6221 521 1125E-mail: [email protected] Chuang

Annual Report 2017 81
Report of the Valuers
To Hongkong Land Holdings Limited
Dear Sirs
Revaluation of Investment Properties Held under Freehold and Leasehold
Further to your instructions, we have valued in our capacity as external valuers the investment properties held under freehold and leasehold as described in the consolidated financial statements of Hongkong Land Holdings Limited. We are of the opinion that the market value of the investment properties held under freehold in Cambodia and leasehold in China, Hong Kong, Singapore and Vietnam as at 31st December 2017, totalled US$32,467,800,000 (United States Dollars Thirty Two Billion Four Hundred Sixty Seven Million and Eight Hundred Thousand).
Our valuations were prepared in accordance with the International Valuation Standards by the International Valuation Standards Council and The HKIS Valuation Standards by The Hong Kong Institute of Surveyors.
We have inspected the properties without either making structural surveys or testing the services. We have been supplied with details of tenure, tenancies and other relevant information.
In arriving at our opinion, each property was valued individually, on market value basis, calculated on the net income allowing for reversionary potential, however no allowance has been made for expenses of realisation or for taxation which might arise in the event of disposal.
Yours faithfully
Jones Lang LaSalle LimitedHong Kong, 8th February 2018

Hongkong Land82
Major Property Portfolioat 31st December 2017
Investment PropertiesAttributable
interests Location
Lettable area of the property
Total Office Retail % (in thousands of square metres)
Alexandra House 100 Hong Kong 35 30 5
Chater House 100 Hong Kong 43 39 4
Exchange Square 100 139
One Exchange Square Hong Kong 53 – Two Exchange Square Hong Kong 47 – Three Exchange Square Hong Kong 30 – Podium Hong Kong – 5 The Forum Hong Kong 4 –
Jardine House 100 Hong Kong 63 59 4
Gloucester Tower 100 Hong Kong 44 44 –
Landmark Atrium 100 Hong Kong 24 – 24
Edinburgh Tower 100 Hong Kong 44 31 13
York House 100 Hong Kong 10 10 –
Prince’s Building 100 Hong Kong 51 38 13
WF CENTRAL 84 Beijing, mainland China 43 – 43
One Central 49 Macau 20 – 20
One Raffles Link 100 Singapore 29 23 6
One Raffles Quay 33.3 123
North Tower Singapore 71 – South Tower Singapore 52 –
Marina Bay Financial Centre 33.3 286
Tower 1 Singapore 57 2 Tower 2 Singapore 95 7 Tower 3 Singapore 117 8
World Trade Centre 1 50 Jakarta, Indonesia 42 37 5
World Trade Centre 2 50 Jakarta, Indonesia 60 56 4
World Trade Centre 5 50 Jakarta, Indonesia 15 14 1
World Trade Centre 6 50 Jakarta, Indonesia 19 17 2
EXCHANGE SQUARE 100 Phnom Penh, Cambodia 25 17 8
Gaysorn 49 Bangkok, Thailand 17 5 12
Central Building 65 Hanoi, Vietnam 4 3 1
63 Ly Thai To 73.9 Hanoi, Vietnam 7 6 1

Annual Report 2017 83
Development PropertiesAttributable
interests Location
Developable area of the
property Construction
completed
Under construction/
to be developed
% (in thousands of square metres)
Central Park 40 Beijing, mainland China 329 329 –
WE City 50 Chengdu, mainland China 896 396 500
Central Avenue 50 Chongqing, mainland China 1,101 133 968
Landmark Riverside 50 Chongqing, mainland China 996 410 586
New Bamboo Grove 50 Chongqing, mainland China 640 218 422
Lijia Project 50 Chongqing, mainland China 114 – 114
Liangjiang Project 100 Chongqing, mainland China 161 – 161
Yorkville North 100 Chongqing, mainland China 1,088 375 713
Yorkville South 100 Chongqing, mainland China 881 556 325
Xiaoshan Project 30 Hangzhou, mainland China 776 – 776
Yue City 33 Nanjing, mainland China 218 – 218
Parkville 50 Shanghai, mainland China 230 227 3
Wuhan Dream Land 50 Wuhan, mainland China 493 – 493
Sol Acres 100 Singapore 115 – 115
Lake Grande 100 Singapore 50 – 50
Margaret Ville 100 Singapore 22 – 22
Anandamaya Residences 40 Jakarta, Indonesia 116 – 116
Asya 33.5 Jakarta, Indonesia 1,064 – 1,064
Nava Park 49 Serpong, Greater Jakarta, Indonesia
784 61 723
Begonia 50 Seremban Forest Heights, Malaysia
33 – 33
Greenwoods Village 40 Cavite, The Philippines 442 316 126
Two Roxas Triangle 40 Manila, The Philippines 98 – 98
Pampanga Property 40 Pampanga, The Philippines 103 – 103
The ESSE Sukhumvit 36 49 Bangkok, Thailand 38 – 38
The Nassim 50 Ho Chi Minh City, Vietnam 31 – 31

Hong Kong – Central District
Mass Transit Railway access
Public car park
Hongkong Land properties
Pedestrian bridges
Major Property Portfolio
CH
AT E
R R
OA
D
D E S V O E U X R O A D C E N T R A L
I C E H O U S E S T R E E T
Q U E E N ’ S R O A D C E N T R A L
ICE
HO
US
E S
TR
EE
T
PE
DD
ER
ST
RE
ET
MA N Y I U S T R E E T
LU N G W
O R
OA D
MA N C
H E U N G S
T R E E TH A R B O
U R VI E
W S
T R E E T
J A C K S O N R O A D
C O N N A U G H T R O A D C E N T R A L
CO
NN
AU
GH
T R
OA
D C
E NT R
AL
QU
EE
N’S
RO
AD
CE N
T RA
LD
ES V
OEU
X R
OA
D C
ENTR
AL
StockExchange
10
11
99a
76 1 2
4
3
5
12
8
StatueSquare
MandarinOriental
StatueSquare
GeneralPost O�ce
HSBC
StandardCharteredBank
Bank ofChina
Airport E
xpress Station
1 One Exchange Square2 Two Exchange Square3 Three Exchange Square4 The Forum
5 Jardine House6 Chater House7 Alexandra House
8 Gloucester Tower9 Edinburgh Tower9a The Landmark Mandarin Oriental
10 York House11 Landmark Atrium12 Prince’s Building
9
7
12
119a
10
8
6
5
1 2
3
4
Hongkong Land84

* This rendering is for reference only, subject to change and government approval.
Beijing, China Chengdu, China
WF CENTRAL CBD Site* Central Park WE City*
Chongqing, China
Chongqing, China
Central Avenue* Landmark Riverside Yorkville South Yorkville North
Yue City* Wuhan Dream Land*Xiaoshan Project*
Nanjing, China Wuhan, ChinaHangzhou, China Shanghai, China
Parkville*
Liangjiang Project*New Bamboo Grove* Lijia Project*Bamboo Grove

Indonesia
Nava Park Asya*Anandamaya Residences*WTC
One Central The ESSE Sukhumvit 36*Gaysorn British Embassy compound
Macau
Vietnam
Thailand
The Nassim*
Thu Thiem River Park Project*29B NDC*
Central Building 63 Ly Thai To

* This rendering is for reference only, subject to change and government approval.
Singapore Malaysia
One Raffles QuayMarina Bay Financial Centre One Raffles Link
Sol AcresLakeVille
Singapore
Lake Grande*
Eunosville* Wangsa Walk MallMargaret Ville*
Cambodia Philippines
Central Mansions EXCHANGE SQUARE Roxas Triangle Towers* Mandani Bay*
