home work excel solution
DESCRIPTION
Home work solution for ISB PGP courseTRANSCRIPT
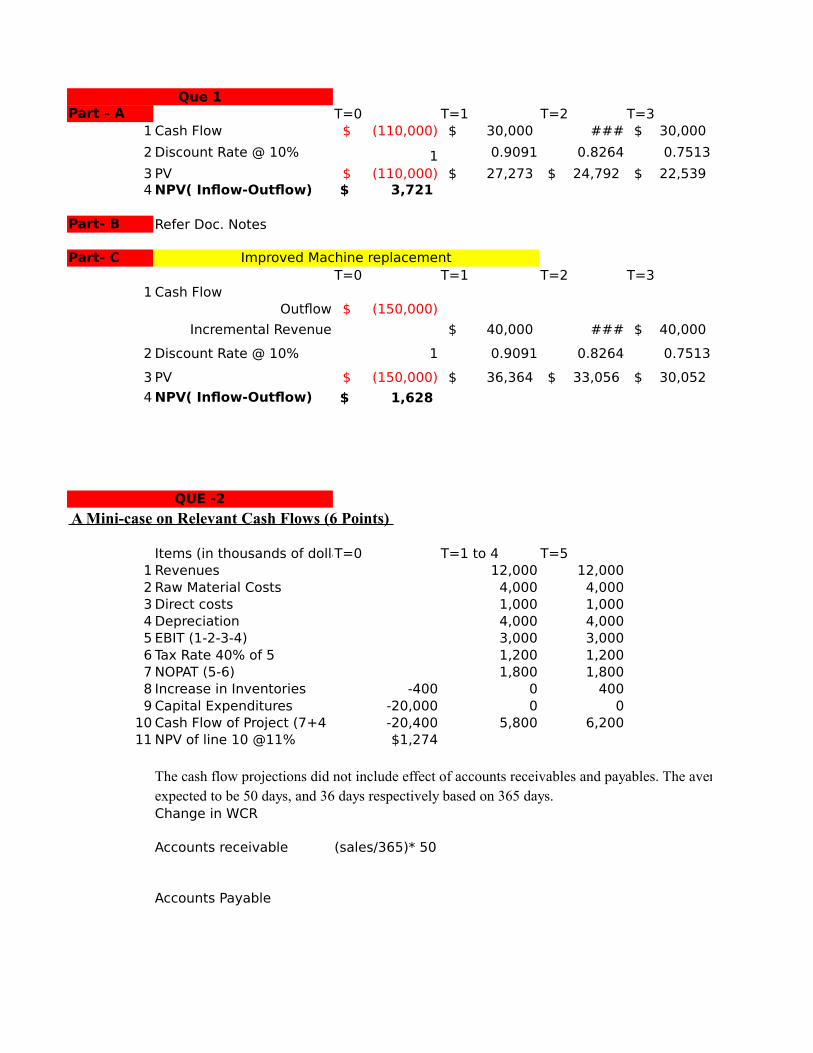
Que 1Part - A T=0 T=1 T=2 T=3
1 Cash Flow $ (110,000) $ 30,000 ### $ 30,000
2 Discount Rate @ 10% 1 0.9091 0.8264 0.7513
3 PV $ (110,000) $ 27,273 $ 24,792 $ 22,539 4 NPV( Inflow-Outflow) $ 3,721
Part- B Refer Doc. Notes
Part- C Improved Machine replacementT=0 T=1 T=2 T=3
1 Cash FlowOutflow $ (150,000)
Incremental Revenue $ 40,000 ### $ 40,000
2 Discount Rate @ 10% 1 0.9091 0.8264 0.7513
3 PV $ (150,000) $ 36,364 $ 33,056 $ 30,052
4 NPV( Inflow-Outflow) $ 1,628
QUE -2
A Mini-case on Relevant Cash Flows (6 Points)
Items (in thousands of dollaT=0 T=1 to 4 T=51 Revenues 12,000 12,0002 Raw Material Costs 4,000 4,0003 Direct costs 1,000 1,0004 Depreciation 4,000 4,0005 EBIT (1-2-3-4) 3,000 3,0006 Tax Rate 40% of 5 1,200 1,2007 NOPAT (5-6) 1,800 1,8008 Increase in Inventories -400 0 4009 Capital Expenditures -20,000 0 0
10 Cash Flow of Project (7+4 -20,400 5,800 6,20011 NPV of line 10 @11% $1,274
The cash flow projections did not include effect of accounts receivables and payables. The average collection period for receivables and average payment period for payables are expected to be 50 days, and 36 days respectively based on 365 days. Change in WCR
Accounts receivable (sales/365)* 50
Accounts Payable
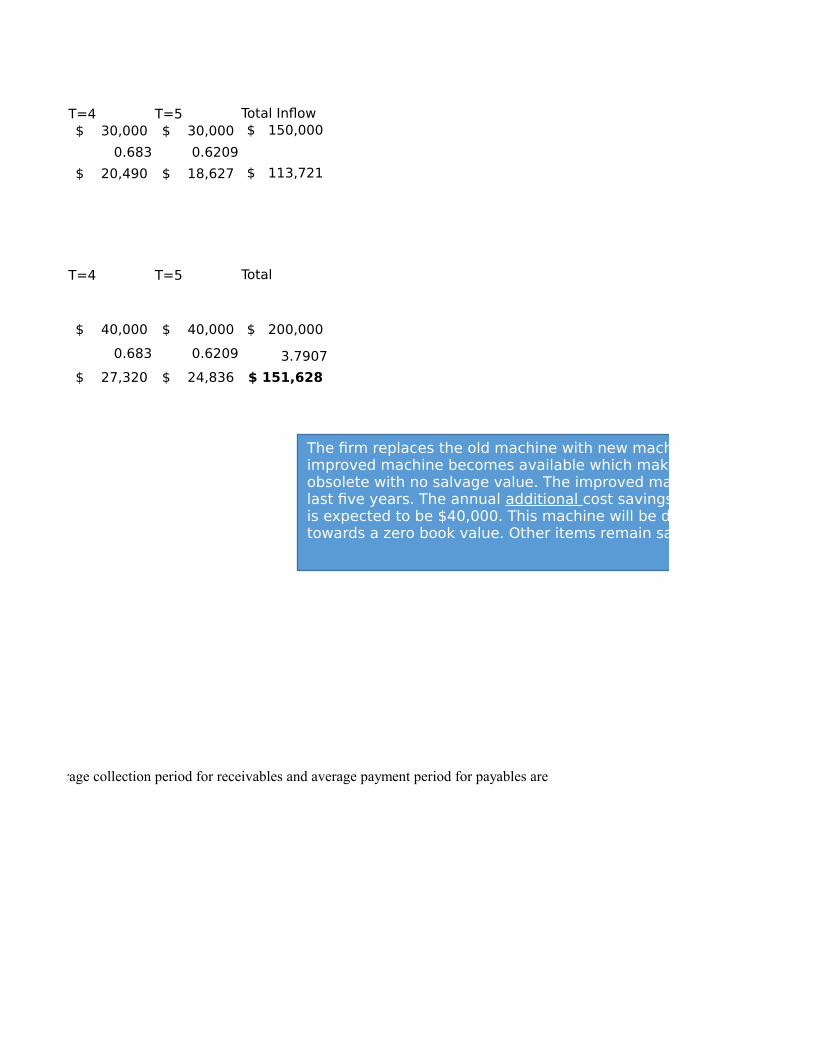
T=4 T=5 Total Inflow $ 30,000 $ 30,000 $ 150,000
0.683 0.6209
$ 20,490 $ 18,627 $ 113,721
T=4 T=5 Total
$ 40,000 $ 40,000 $ 200,000
0.683 0.6209 3.7907
$ 27,320 $ 24,836 $ 151,628
The cash flow projections did not include effect of accounts receivables and payables. The average collection period for receivables and average payment period for payables are
The firm replaces the old machine with new machine. Two years later, an improved machine becomes available which makes the “existing” machine obsolete with no salvage value. The improved machine will cost $150,000 and last five years. The annual additional cost savings over the previous machine is expected to be $40,000. This machine will be depreciated on a straight line towards a zero book value. Other items remain same
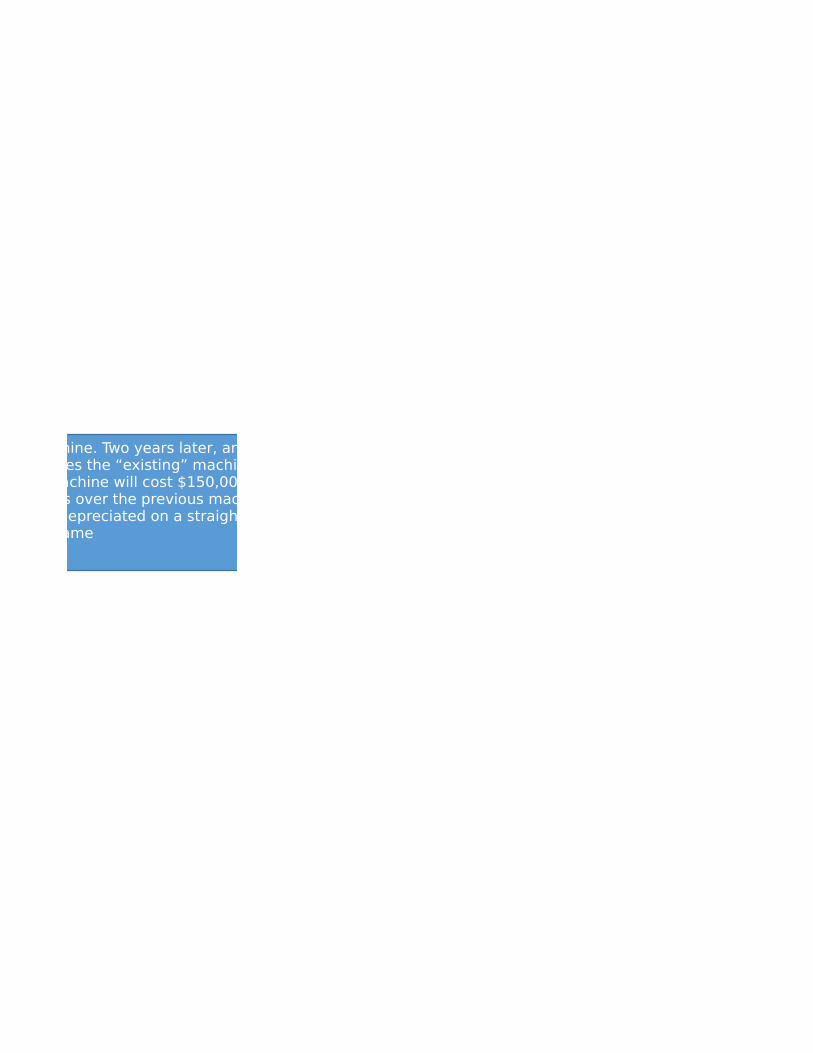
The firm replaces the old machine with new machine. Two years later, an improved machine becomes available which makes the “existing” machine obsolete with no salvage value. The improved machine will cost $150,000 and last five years. The annual additional cost savings over the previous machine is expected to be $40,000. This machine will be depreciated on a straight line towards a zero book value. Other items remain same
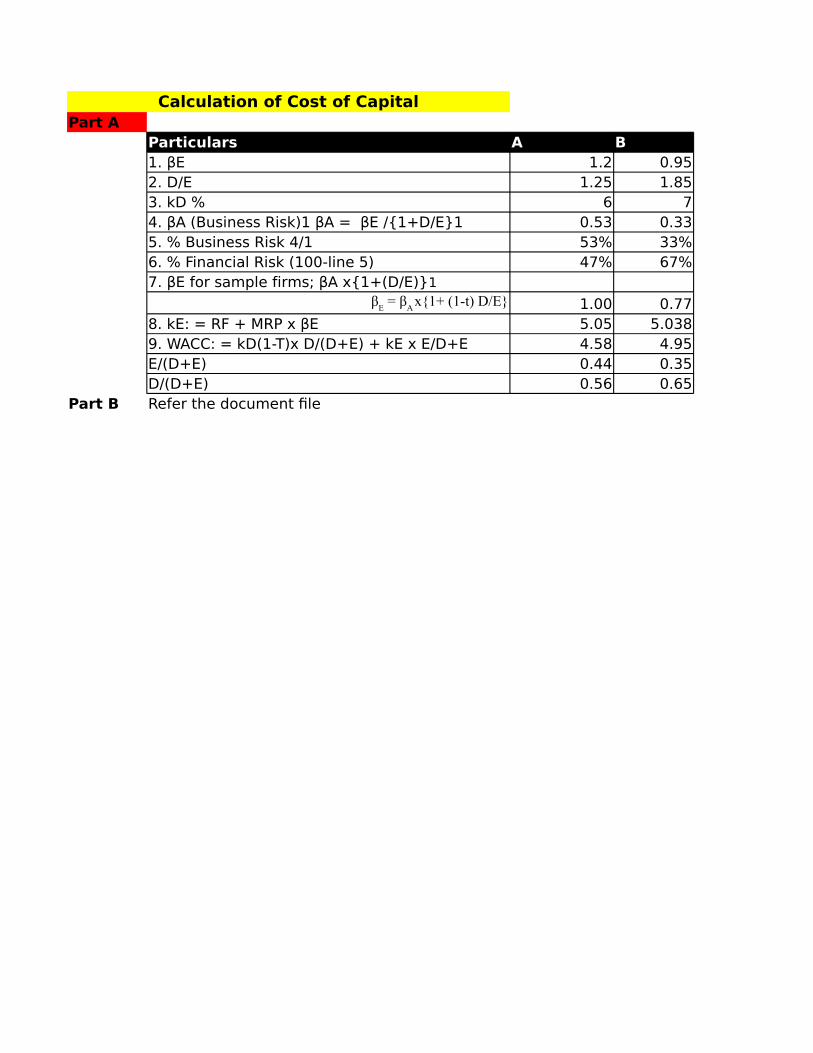
Calculation of Cost of CapitalPart A
Particulars A B1. βE 1.2 0.952. D/E 1.25 1.853. kD % 6 74. βA (Business Risk)1 βA = βE /{1+D/E}1 0.53 0.335. % Business Risk 4/1 53% 33%6. % Financial Risk (100-line 5) 47% 67%
1.00 0.778. kE: = RF + MRP x βE 5.05 5.0389. WACC: = kD(1-T)x D/(D+E) + kE x E/D+E 4.58 4.95E/(D+E) 0.44 0.35D/(D+E) 0.56 0.65
Part B Refer the document file
7. βE for sample firms; βA x{1+(D/E)}1β
E = β
A x{1+ (1-t) D/E}
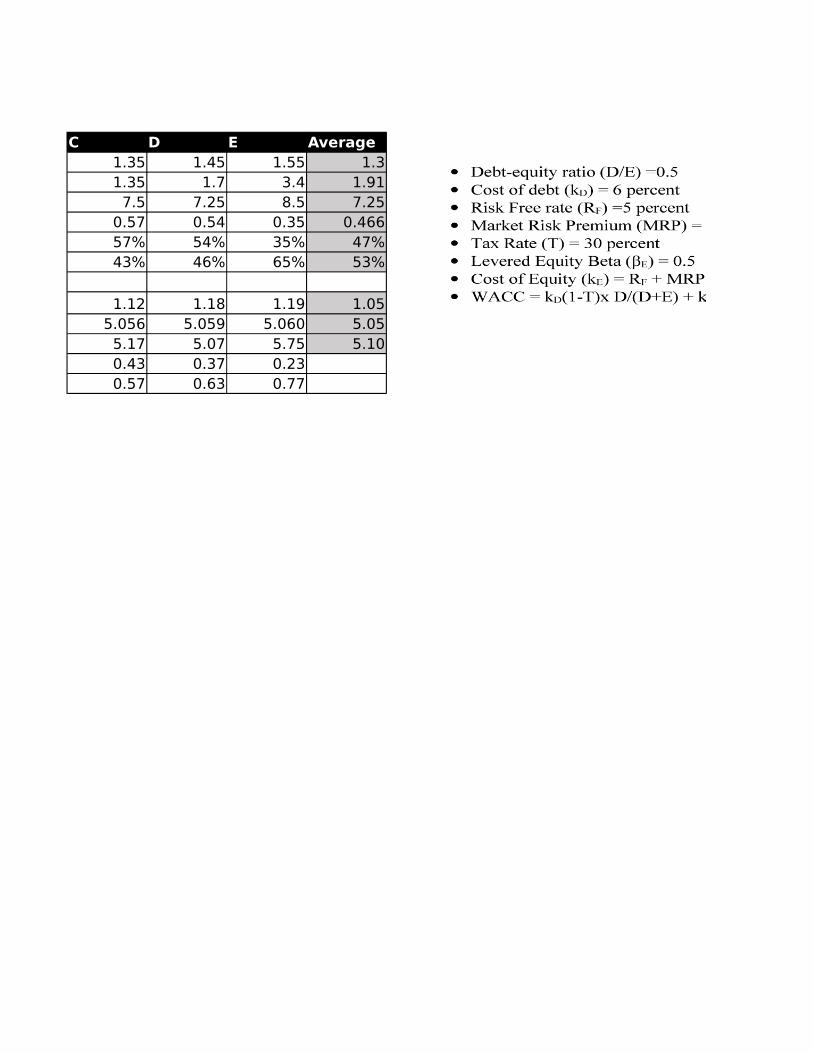
C D E Average1.35 1.45 1.55 1.31.35 1.7 3.4 1.91
7.5 7.25 8.5 7.250.57 0.54 0.35 0.46657% 54% 35% 47%43% 46% 65% 53%
1.12 1.18 1.19 1.055.056 5.059 5.060 5.05
5.17 5.07 5.75 5.100.43 0.37 0.230.57 0.63 0.77

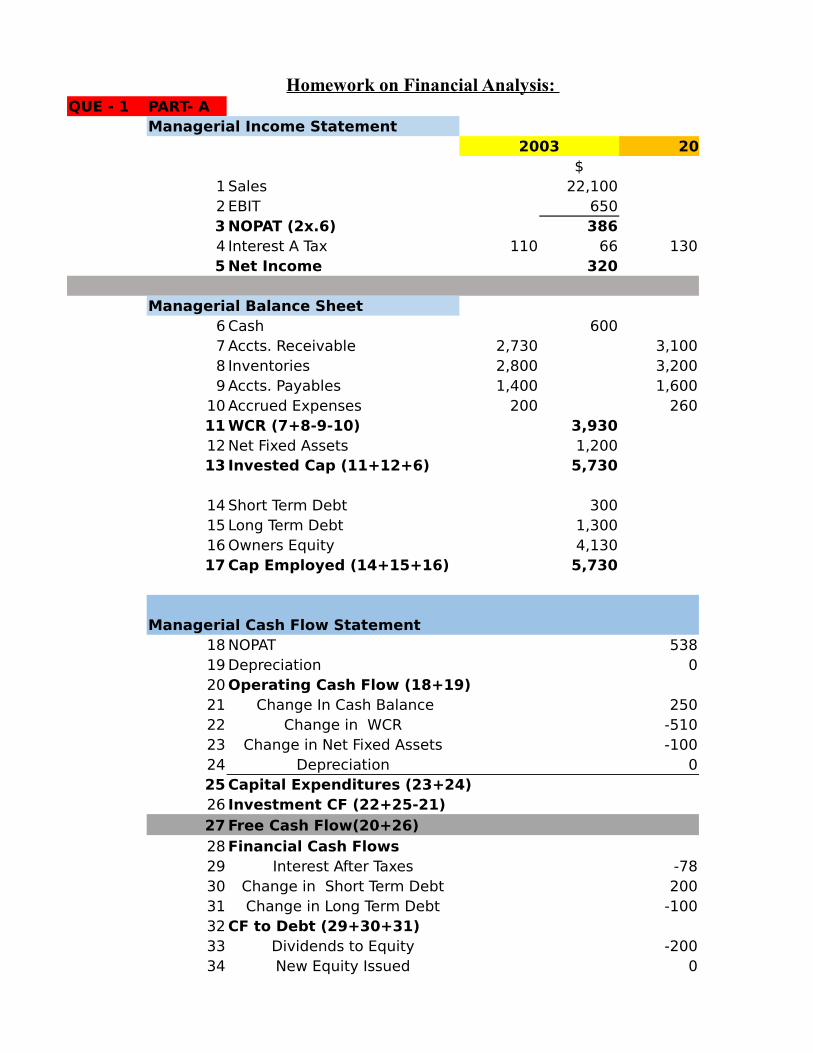
Homework on Financial Analysis: QUE - 1 PART- A
Managerial Income Statement2003 2004
$ 1 Sales 22,1002 EBIT 6503 NOPAT (2x.6) 3864 Interest A Tax 110 66 1305 Net Income 320
Managerial Balance Sheet6 Cash 6007 Accts. Receivable 2,730 3,1008 Inventories 2,800 3,2009 Accts. Payables 1,400 1,600
10 Accrued Expenses 200 26011 WCR (7+8-9-10) 3,93012 Net Fixed Assets 1,20013 Invested Cap (11+12+6) 5,730
14 Short Term Debt 30015 Long Term Debt 1,30016 Owners Equity 4,13017 Cap Employed (14+15+16) 5,730
Managerial Cash Flow Statement18 NOPAT 53819 Depreciation 020 Operating Cash Flow (18+19)21 Change In Cash Balance 25022 Change in WCR -51023 Change in Net Fixed Assets -10024 Depreciation 025 Capital Expenditures (23+24)26 Investment CF (22+25-21)27 Free Cash Flow(20+26)28 Financial Cash Flows29 Interest After Taxes -7830 Change in Short Term Debt 20031 Change in Long Term Debt -10032 CF to Debt (29+30+31)33 Dividends to Equity -20034 New Equity Issued 0

35 CF to Equity (33 + 34))36 Free Cash Flow (32+35)

2004 2005 Remarks $ $ 24,300 31,600
900 1,350538 810 Tax @40%
78 267 160460 650
350 3004,2004,3002,050
3504,440 6,1001,300 1,4406,090 7,840
500 1,9001,200 1,1004,390 4,8406,090 7,840
8100
538 810 Inflow50
-1,660 -1,610 Outflow-140
0-100 -140 Outflow-360178 940 Outflow
160 outflow-1400 Inflow
10022 -1140 Inflow
2000
Inflow or Outflow
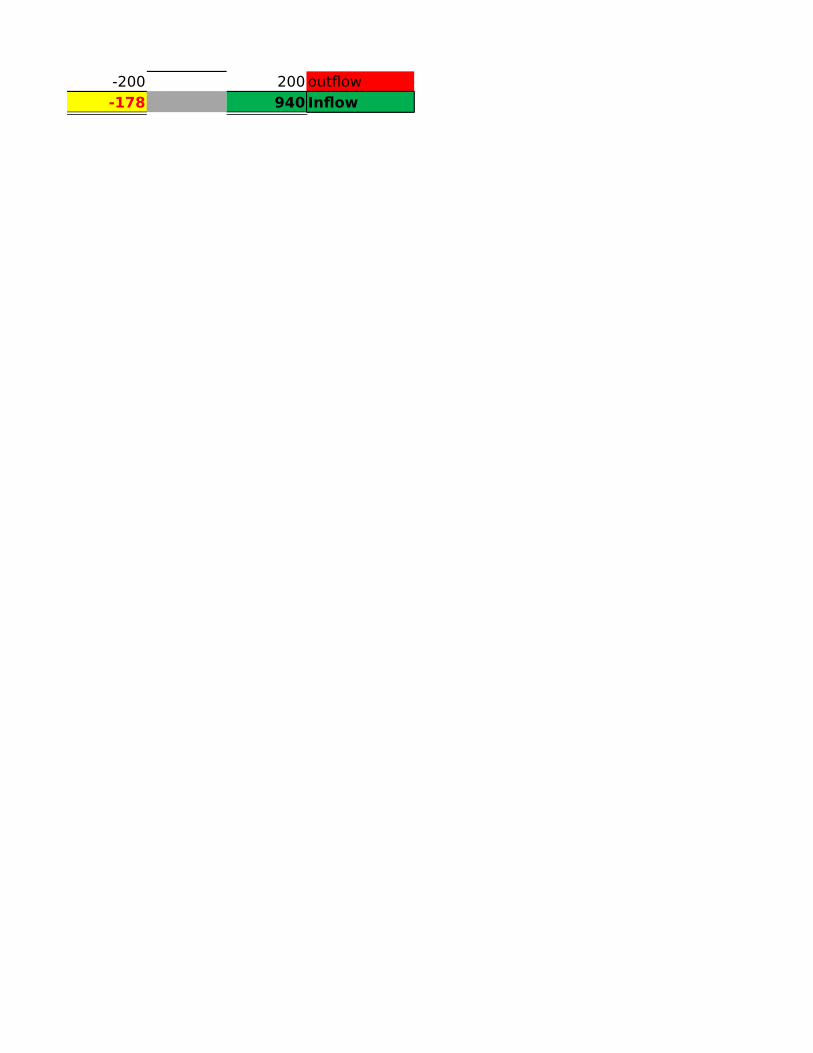
-200 200 outflow-178 940 Inflow
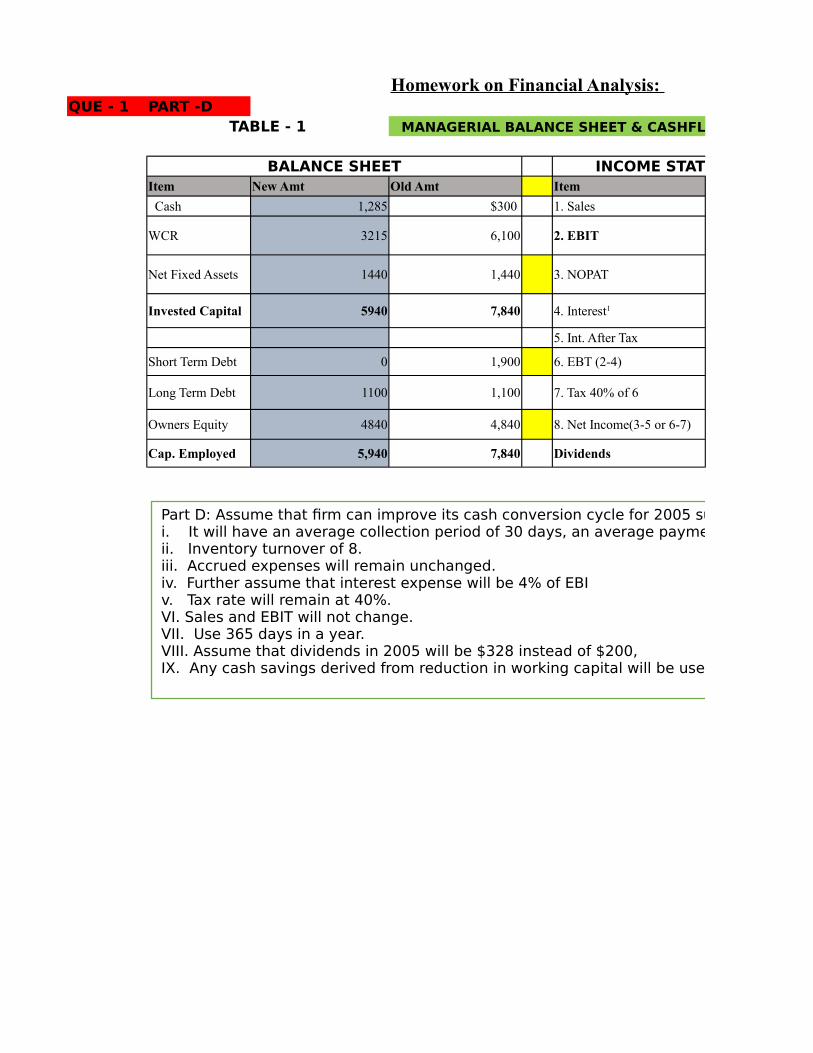
Homework on Financial Analysis: QUE - 1 PART -D
TABLE - 1 MANAGERIAL BALANCE SHEET & CASHFLOW STATEMENT
BALANCE SHEET INCOME STATEMENTItem New Amt Old Amt Item
Cash 1,285 $300 1. Sales
WCR 3215 6,100 2. EBIT
Net Fixed Assets 1440 1,440 3. NOPAT
Invested Capital 5940 7,840
5. Int. After Tax
Short Term Debt 0 1,900 6. EBT (2-4)
Long Term Debt 1100 1,100 7. Tax 40% of 6
Owners Equity 4840 4,840 8. Net Income(3-5 or 6-7)
Cap. Employed 5,940 7,840 Dividends
4. Interest1
Part D: Assume that firm can improve its cash conversion cycle for 2005 such that i. It will have an average collection period of 30 days, an average payment period of 33 days.ii. Inventory turnover of 8.iii. Accrued expenses will remain unchanged. iv. Further assume that interest expense will be 4% of EBIv. Tax rate will remain at 40%. VI. Sales and EBIT will not change. VII. Use 365 days in a year. VIII. Assume that dividends in 2005 will be $328 instead of $200,IX. Any cash savings derived from reduction in working capital will be used to pay short term debt.

Homework on Financial Analysis:
MANAGERIAL BALANCE SHEET & CASHFLOW STATEMENT
INCOME STATEMENT CASH FLOW STATEMENTAmount Item Amount
$31,600 1. NOPAT .6 x EBIT 810 Inflow
1,350 1,225 Inflow
810 -140 Outflow
54 -935
32 5. FCF (1+2+3+4) 960 Inflow
1,296 6. Dividends -328
518 7. Int. A. Taxes -32
778 -600
328 9. FCF (6+7+8) -960 Outflow
2. WCR
3. Net Fixed Assets
4. Cash Balance
8. S.T & LT Debt
Part D: Assume that firm can improve its cash conversion cycle for 2005 such that i. It will have an average collection period of 30 days, an average payment period of 33 days.ii. Inventory turnover of 8.iii. Accrued expenses will remain unchanged. iv. Further assume that interest expense will be 4% of EBIv. Tax rate will remain at 40%. VI. Sales and EBIT will not change. VII. Use 365 days in a year. VIII. Assume that dividends in 2005 will be $328 instead of $200,IX. Any cash savings derived from reduction in working capital will be used to pay short term debt.
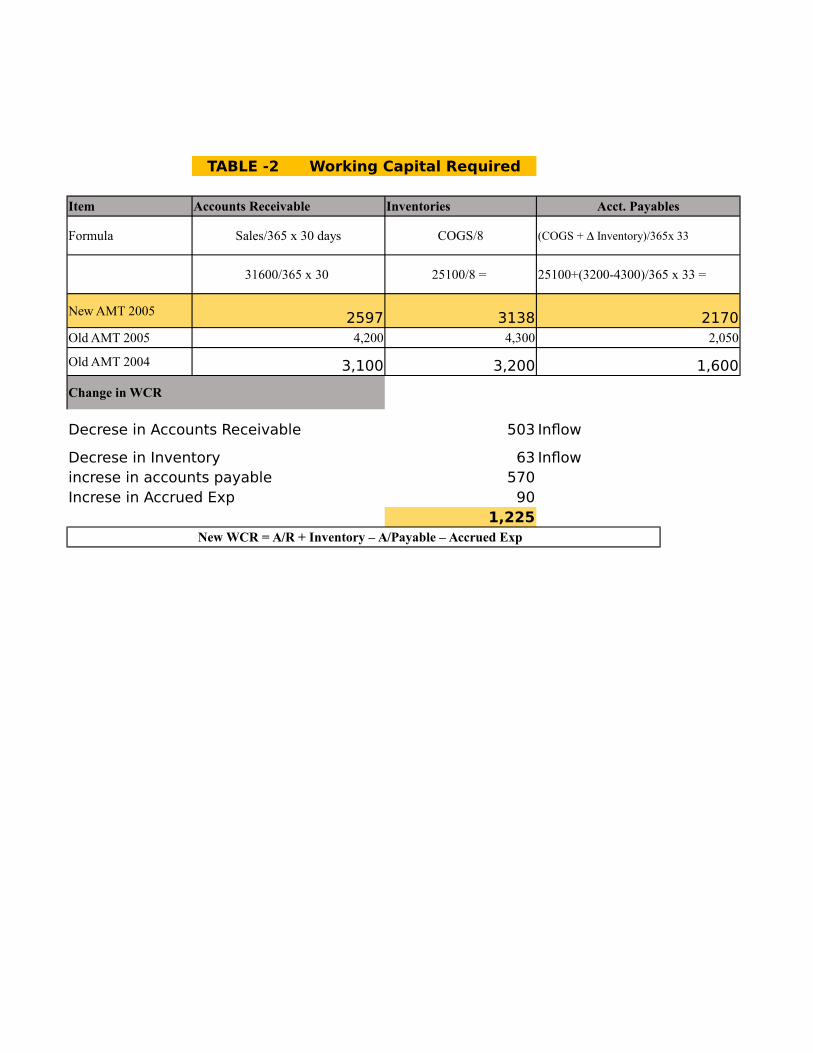
TABLE -2 Working Capital Required
Item Accounts Receivable Inventories Acct. Payables
Formula Sales/365 x 30 days COGS/8
31600/365 x 30 25100/8 = 25100+(3200-4300)/365 x 33 =
New AMT 2005 2597 3138 2170Old AMT 2005 4,200 4,300 2,050
Old AMT 2004 3,100 3,200 1,600
Change in WCR
Decrese in Accounts Receivable 503 Inflow
Decrese in Inventory 63 Inflowincrese in accounts payable 570Increse in Accrued Exp 90
1,225
(COGS + Inventory)/365x 33
New WCR = A/R + Inventory – A/Payable – Accrued Exp
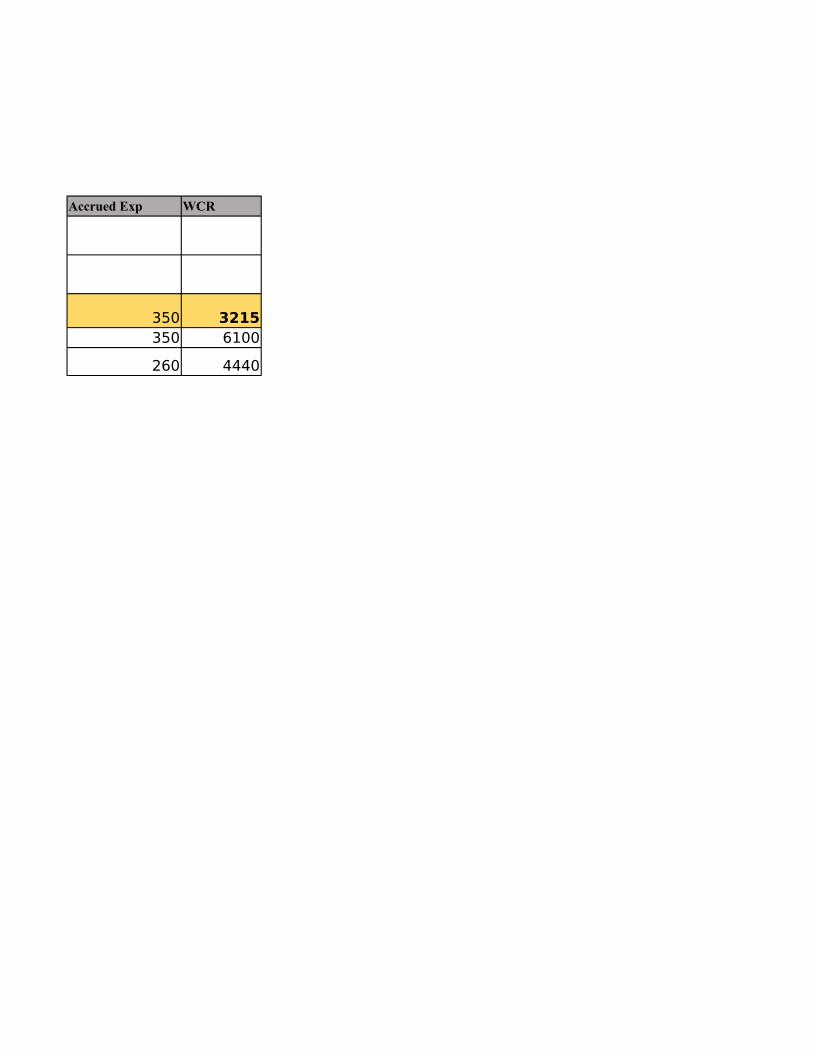
Accrued Exp WCR
350 3215350 6100
260 4440
Homework on Financial Analysis:
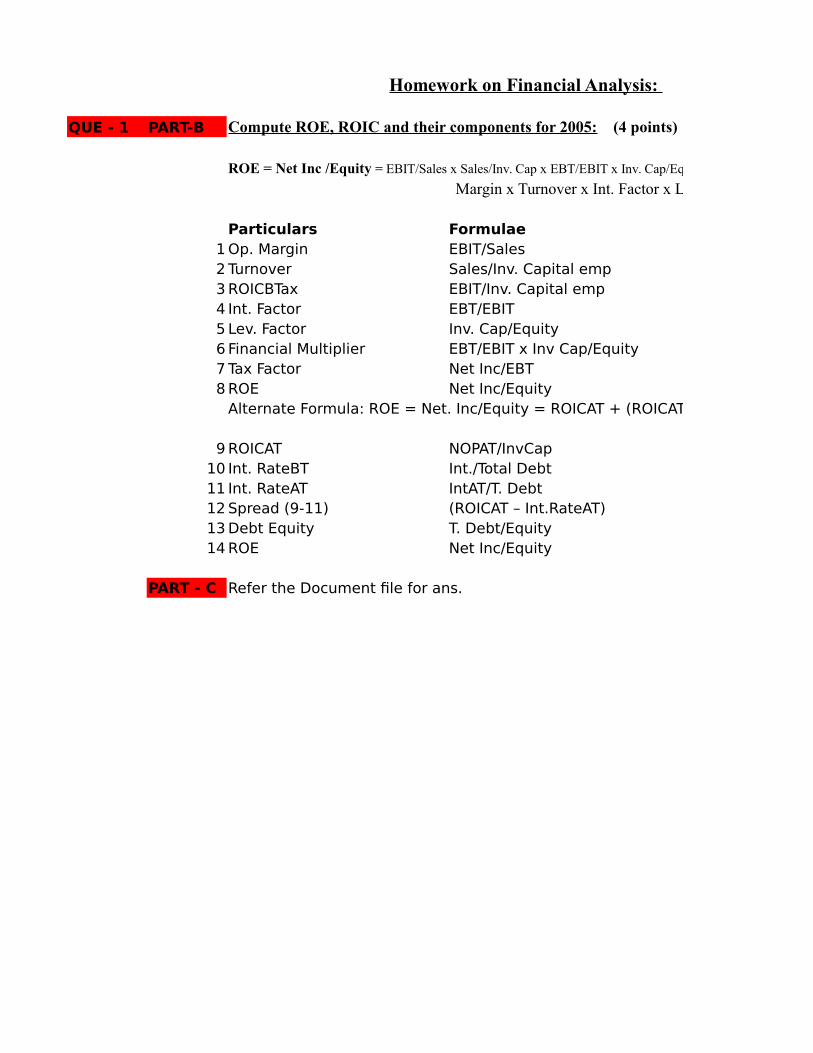
QUE - 1 PART-B
Particulars Formulae1 Op. Margin EBIT/Sales2 Turnover Sales/Inv. Capital emp3 ROICBTax EBIT/Inv. Capital emp4 Int. Factor EBT/EBIT5 Lev. Factor Inv. Cap/Equity6 Financial Multiplier EBT/EBIT x Inv Cap/Equity7 Tax Factor Net Inc/EBT8 ROE Net Inc/Equity
Alternate Formula: ROE = Net. Inc/Equity = ROICAT + (ROICAT – Int. RateAT) x Debt/Equity
9 ROICAT NOPAT/InvCap10 Int. RateBT Int./Total Debt11 Int. RateAT IntAT/T. Debt12 Spread (9-11) (ROICAT – Int.RateAT)13 Debt Equity T. Debt/Equity14 ROE Net Inc/Equity
PART - C Refer the Document file for ans.
Compute ROE, ROIC and their components for 2005: (4 points)
ROE = Net Inc /Equity = EBIT/Sales x Sales/Inv. Cap x EBT/EBIT x Inv. Cap/Equity x Net Inc/EBT
Margin x Turnover x Int. Factor x Lev. Factor x Tax Factor

Homework on Financial Analysis:
2003 2004 2005 Remarks650/22100 2.90% 3.70% 4%
22100/5730 3.86 3.99 4.031650/5730 11.34% 14.80% 17%540/650 0.83 0.86 0.80
5730/4130 1.39 1.39 1.6200.83 x 1.39 1.155 1.2 1.30
320/540 0.59 0.6 0.60320/4130 7.75% 10.48% 13.43%
Alternate Formula: ROE = Net. Inc/Equity = ROICAT + (ROICAT – Int. RateAT) x Debt/Equity
386/5730 6.74% 8.83% 10.33%110/1600 6.88% 7.65% 8.90%66/1600 4.13% 4.59% 5.33%
2.63% 4.24% 5.00%1600/4130 38.70% 38.70% 61.98%320/4130 7.75% 10.48% 13.43%
(4 points)
EBIT/Sales x Sales/Inv. Cap x EBT/EBIT x Inv. Cap/Equity x Net Inc/EBT
Margin x Turnover x Int. Factor x Lev. Factor x Tax Factor