home advantage in sport
TRANSCRIPT

Home Advantage in SportAn Overview of Studies on the Advantage of Playing at Home
Alan M. Nevill1 and Roger L. Holder2
1 Research Institute for Sport and Exercise Sciences, Liverpool John Moores University, Liverpool, England
2 School of Mathematics and Statistics, University of Birmingham, Birmingham, England
Abstract This review identifies the most likely causes of home advantage. The resultsof previous studies have identified 4 factors thought to be responsible for thehome advantage. These can be categorised under the general headings of crowd,learning, travel and rule factors. From the accumulated evidence, rule factorswerefound to play only a minor role (in a limited number of sports) in contributing tohome advantage. Studies investigating the effect of learning factors found thatlittle benefit was to be gained from being familiar with the local conditions whenplaying at home. There was evidence to suggest that travel factors were responsiblefor part of the home advantage, provided the journey involved crossing a numberof time zones. However, since high levels of home advantage are observed withincountries where travel distances are not great, travel factors were not thought tobe a major cause of home advantage. The evidence from studies investigatingcrowd factors appeared to provide the most dominant causes of home advantage.
A number of studies provide strong evidence that home advantage increaseswith crowd size, until the crowd reaches a certain size or consistency (a morebalanced number of home and away supporters), after which a peak in homeadvantage is observed. Two possible mechanisms were proposed to explain theseobservations: either (i) the crowd is able to raise the performance of the homecompetitors relative to the away competitors; or (ii) the crowd is able to influencethe officials to subconsciously favour the home team. The literature supports thelatter to be the most important and dominant explanation. Clearly, it only takes2 or 3 crucial decisions to go against the away team or in favour of the home teamto give the side playing at home the ‘edge’.
LEADING ARTICLE Sports Med 1999 Oct; 28 (4): 221-2360112-1642/99/0010-0221/$08.00/0
© Adis International Limited. All rights reserved.
For the first time in their history, France won thesoccer World Cup in 1998. Never having reachedaworld cup final before, France’s only other previousmajor international soccer success, that of winningthe European Cup in 1984, also occurred on homesoil. Did these supreme sporting achievements re-flect France’s true ability, that coincidentally oc-curred in front of their home supporters, or do theysimply provide further examples of the alreadyoverwhelming evidence of home advantage?
Before attempting to answer this question, it isimportant to be clear what is meant by home ad-vantage. In their seminal review, Courneya andCarron[1] defined home advantage as ‘the consis-tent finding that home teams in sports competitionswin over 50% of the games played under a balancedhome and away schedule’. Provided the competi-tion is balanced, with teams competing an equalnumber of games both home and away, the homeadvantage for the entire competition can be assessed
as the number of games won by teams playing athome, expressed as a percentage of decided games.An alternative definition would be to score 2 pointsfor a win, 1 point for a draw and 0 for a loss and tothen calculate the percentage of points accrued bythe teamwhen playing at home. However, care needsto be taken with subsequent statistical analyseswhen adopting this second definition. Some authorshave incorrectly investigated home advantage us-ing chi-squared tests where total points have beenconfused with total frequencies. Another analyticalerror made when including tied games in chi-squared tests has been to assume, in the absence ofa home advantage, that the 3 possible outcomes(win, draw and loss) are equally likely. Both willlead to grossly inflated chi-squared test statistics.The straightforward approach of calculating home
advantage using the percentage of games won byhome teams throughout the competition is suitable,since the quality of the opposition effect, the othermajor factor likely to influence the game outcome,is effectively eliminated by counterbalancing thegame location. However, more recent research intohome advantage has not been restricted by this ho-listic approach. The work of Clarke and Norman[2]has enabled individual team home advantage to beassessed that should, in theory, provide a more sen-sitive measure of home advantage for further re-search. More recently, the work of Nevill et al.[3]and Holder and Nevill[4] has proposed an alterna-tive approach to assessing home advantage in com-petitions that are not balanced, such as internationalgolf and tennis tournaments. Interestingly, by ap-plying these methods to the results of the 1998 soc-cer World Cup, we are able to answer the questionposed in the opening paragraph: did France enjoya home advantage in winning the 1998World Cup?
The purpose of this literature review is to pro-vide a comprehensive overview of these and otherstudies investigating the advantage of playing athome. Adopting the conceptual framework proposedby Courneya and Carron,[1] we shall assess whetherwe are any closer to answering the ultimate ques-tion: why does home advantage exist? We shallalso provide directions and recommendations forfuture research.
1. The Existence of Home Advantage
1.1 Balanced Competitions
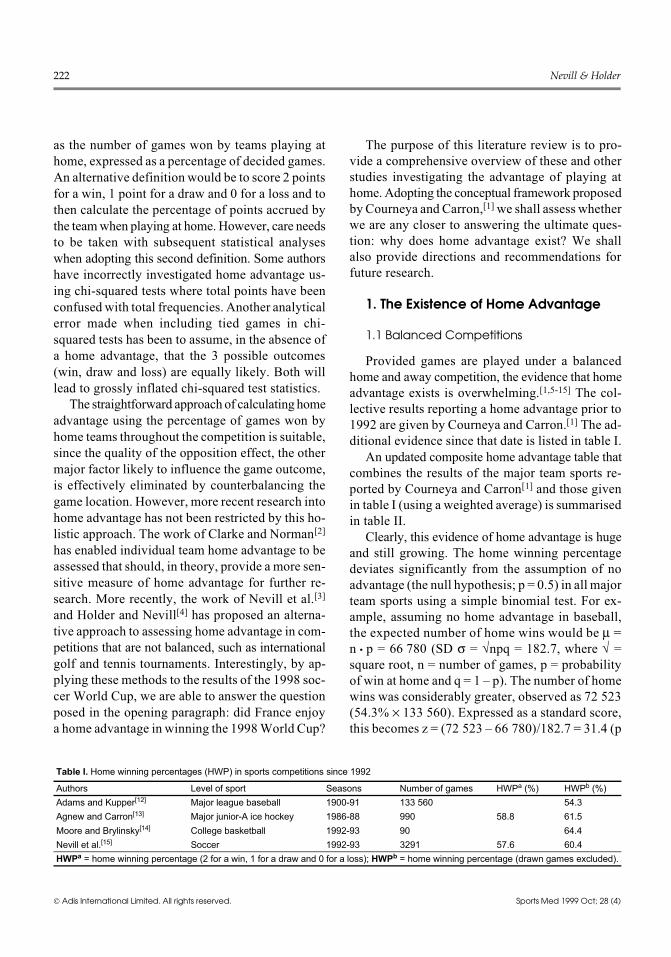
Provided games are played under a balancedhome and away competition, the evidence that homeadvantage exists is overwhelming.[1,5-15] The col-lective results reporting a home advantage prior to1992 are given by Courneya and Carron.[1] The ad-ditional evidence since that date is listed in table I.An updated composite home advantage table that
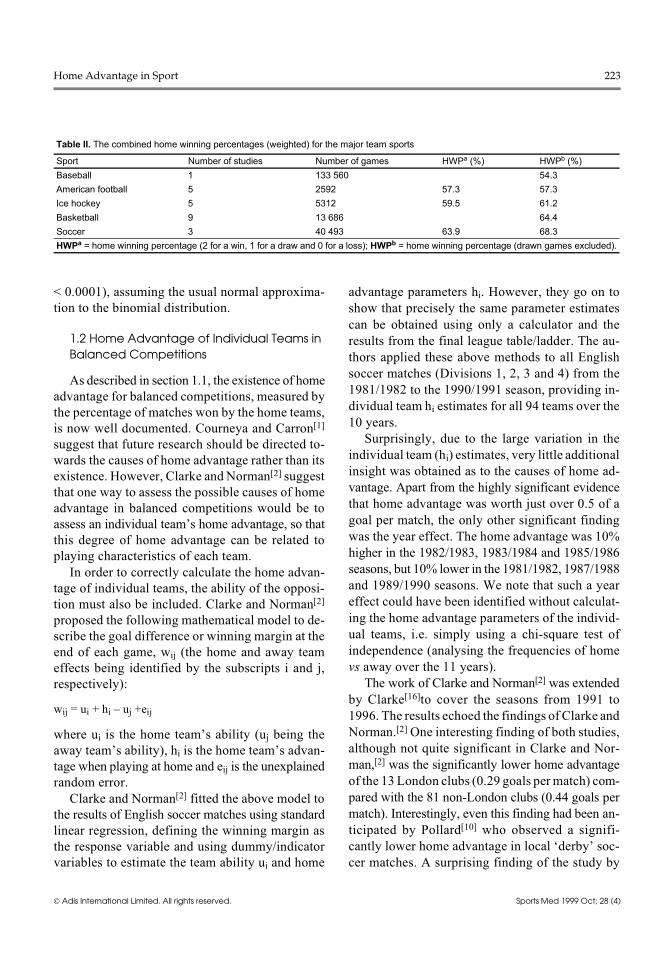
combines the results of the major team sports re-ported by Courneya and Carron[1] and those givenin table I (using a weighted average) is summarisedin table II.Clearly, this evidence of home advantage is huge
and still growing. The home winning percentagedeviates significantly from the assumption of noadvantage (the null hypothesis; p = 0.5) in all majorteam sports using a simple binomial test. For ex-ample, assuming no home advantage in baseball,the expected number of home wins would be μ =n • p = 66 780 (SD σ = √npq = 182.7, where √ =square root, n = number of games, p = probabilityof win at home and q = 1 – p). The number of homewins was considerably greater, observed as 72 523(54.3% × 133 560). Expressed as a standard score,this becomes z = (72 523 – 66 780)/182.7 = 31.4 (p
Table I. Home winning percentages (HWP) in sports competitions since 1992
Authors Level of sport Seasons Number of games HWPa (%) HWPb (%)Adams and Kupper[12] Major league baseball 1900-91 133 560 54.3Agnew and Carron[13] Major junior-A ice hockey 1986-88 990 58.8 61.5Moore and Brylinsky[14] College basketball 1992-93 90 64.4Nevill et al.[15] Soccer 1992-93 3291 57.6 60.4HWPa = home winning percentage (2 for a win, 1 for a draw and 0 for a loss); HWPb = home winning percentage (drawn games excluded).
222 Nevill & Holder
© Adis International Limited. All rights reserved. Sports Med 1999 Oct; 28 (4)
< 0.0001), assuming the usual normal approxima-tion to the binomial distribution.
1.2 Home Advantage of Individual Teams inBalanced Competitions
As described in section 1.1, the existence of homeadvantage for balanced competitions, measured bythe percentage of matches won by the home teams,is now well documented. Courneya and Carron[1]suggest that future research should be directed to-wards the causes of home advantage rather than itsexistence. However, Clarke and Norman[2] suggestthat one way to assess the possible causes of homeadvantage in balanced competitions would be toassess an individual team’s home advantage, so thatthis degree of home advantage can be related toplaying characteristics of each team.In order to correctly calculate the home advan-
tage of individual teams, the ability of the opposi-tion must also be included. Clarke and Norman[2]proposed the following mathematical model to de-scribe the goal difference or winning margin at theend of each game, wij (the home and away teameffects being identified by the subscripts i and j,respectively):
wij = ui + hi – uj +eij
where ui is the home team’s ability (uj being theaway team’s ability), hi is the home team’s advan-tage when playing at home and eij is the unexplainedrandom error.Clarke and Norman[2] fitted the above model to
the results of English soccer matches using standardlinear regression, defining the winning margin asthe response variable and using dummy/indicatorvariables to estimate the team ability ui and home
advantage parameters hi. However, they go on toshow that precisely the same parameter estimatescan be obtained using only a calculator and theresults from the final league table/ladder. The au-thors applied these above methods to all Englishsoccer matches (Divisions 1, 2, 3 and 4) from the1981/1982 to the 1990/1991 season, providing in-dividual team hi estimates for all 94 teams over the10 years.Surprisingly, due to the large variation in the
individual team (hi) estimates, very little additionalinsight was obtained as to the causes of home ad-vantage. Apart from the highly significant evidencethat home advantage was worth just over 0.5 of agoal per match, the only other significant findingwas the year effect. The home advantage was 10%higher in the 1982/1983, 1983/1984 and 1985/1986seasons, but 10% lower in the 1981/1982, 1987/1988and 1989/1990 seasons. We note that such a yeareffect could have been identified without calculat-ing the home advantage parameters of the individ-ual teams, i.e. simply using a chi-square test ofindependence (analysing the frequencies of homevs away over the 11 years).The work of Clarke and Norman[2] was extended
by Clarke[16]to cover the seasons from 1991 to1996. The results echoed the findings of Clarke andNorman.[2] One interesting finding of both studies,although not quite significant in Clarke and Nor-man,[2] was the significantly lower home advantageof the 13 London clubs (0.29 goals permatch) com-pared with the 81 non-London clubs (0.44 goals permatch). Interestingly, even this finding had been an-ticipated by Pollard[10] who observed a signifi-cantly lower home advantage in local ‘derby’ soc-cer matches. A surprising finding of the study by
Table II. The combined home winning percentages (weighted) for the major team sports
Sport Number of studies Number of games HWPa (%) HWPb (%)Baseball 1 133 560 54.3American football 5 2592 57.3 57.3Ice hockey 5 5312 59.5 61.2Basketball 9 13 686 64.4Soccer 3 40 493 63.9 68.3HWPa = home winning percentage (2 for a win, 1 for a draw and 0 for a loss); HWPb = home winning percentage (drawn games excluded).
Home Advantage in Sport 223
© Adis International Limited. All rights reserved. Sports Med 1999 Oct; 28 (4)

Clarke[16] was the lack of consistency in the homeadvantage parameters hi from one year to the next.The correlations were very low and sometimesnegative, suggesting that individual team home ad-vantage is a relatively transient or random effect.This may explain why very little additional insightinto the causes of home advantage was obtainedusing this approach and, as such, may question thebenefit of calculating individual team home advan-tage as a more sensitive measure of home advantage.However, the assumption by Courneya and Car-
ron[1] that the descriptive phase of the enquiry intohome advantage is complete may have been prema-ture, especially when considering unbalanced com-petitions such as individual golf majors and tennisgrand slam tournaments,[3,4] and the final games ofchampionship play-offs.[17-19] These subtle and not-so-subtle differences in home advantage revealedby such studies may provide a valuable insight intothe causes of home advantage.
1.3 Home Advantage in Unbalanced Competitions
Does the same home advantage, observed in bal-anced major team sports, exist in unbalanced com-petitions such as grand-slam tennis tournaments,golf majors and world cup soccer finals? A numberof studies have examined this question but withquite different conclusions. McCutcheon[20] founda small but significant home advantage with highschool cross-country runners (53.5%). A similarhome advantage was observed with high schoolwrestlers.[21] Bray and Carron[22] also found someevidence of home advantage when studying WorldCup alpine skiing. However, it is not clear howthese studies attempted to overcome the seriousmethodological problem that the observed homeadvantage may have been simply due to the homecompetitors being better athletes than the awaycompetitors. It is this problem that Nevill et al.[3]addressed when attempting to identify home ad-vantage in international tennis and golf tournaments.As stated earlier, the holistic approach of calcu-
lating home advantage using the percentage of winsby teams playing at home in a balanced competi-
tion is appropriate, since the quality of the teameffect, the other major factor likely to influence thegame outcome, is effectively eliminated by counter-balancing the game location. However, when con-sidering home advantage in unbalanced competi-tions, such as individual golf majors and tennis grandslam tournaments, there is a need to adjust the tour-nament results for the quality or standard of thecompetitors prior to the competition before any homeadvantage can be assessed. For example, if all theBritish golfers competing in the British Open werebetter (higher world ranked) golfers than the visit-ing competitors, an apparent home advantage wouldbe inferred if the results of the British golfers weresignificantly better than their foreign counterparts.Clearly, there is a need to adjust the tournamentresults to take into account the standard of all thegolfers prior to the competition before valid inferenceinto the existence of home advantage can be made.Using the world rankings of the competitors prior
to competitions as their relative standard or quality,Nevill et al.[3] investigated the presence of homeadvantage in the international grand slam tennisand major golf tournaments in 1993. Regressionanalysis (defining log-transformed performance rankas the response variable) was used to detect anyhome advantage associated with competitors rep-resenting the host country (home competitors) incomparison with their visiting counterparts (awaycompetitors). The proposed test, to compare the re-gression parameters of the home and away regres-sion lines, is similar to traditional analysis of co-variance (ANCOVA), to compare the home and awaycompetitors’ tournament result ranks using the logof their world ranks as the covariate, i.e. adjustingall competitors to have the same world rank.Home advantage would be present if the regres-
sion line parameters differed significantly and theresults of home competitors were located below theresults of the away competitors, i.e. the majority ofthe results of the home competitors were numeri-cally lower than the results of the away competitors.Because the assumptions required for the regres-sion analyses would not be met precisely, i.e. thedependent variable (log transformed result ranks)
224 Nevill & Holder
© Adis International Limited. All rights reserved. Sports Med 1999 Oct; 28 (4)

will not be exactly normally distributed with con-stant error variance, more complex distribution-freetests could be applied.[4] Interestingly, this madeno difference to the conclusions described below.The results provided little evidence of home ad-
vantage in either the 4 grand slam tennis tourna-ments or the 4 golf major tournaments held in 1993.The only possible evidence of home advantage wasfound in theWimbledon tennis championships andthe US Open golf championships. In both cases,some of the lower (numerically higher) ranked homecompetitors, who were given privileged (e.g. wildcard) entry to the tournaments, had a greater oppor-tunity to perform above their anticipated world rank-ings. Hence, Nevill et al.[3] concluded that providedthe entry into tennis and golf tournaments is truly‘open’ (without restriction) to both the host nation’srepresentatives and foreign competitors alike, homeadvantage was not a major factor likely to influencethe competitors’ performance in such competitions.Using these regression methods described by
Nevill et al.,[3] we can now answer the questionposed in the opening paragraph of the introduction:did France’s success, by winning the 1998 WorldCup, simply provide another example of home ad-vantage? The FIFA/Coca-Cola world rankings, ob-tained from the internet (http://www.fifa2.com) asof 20 May 1998, and the final results/finishing po-sitions recorded as ranks (e.g. losing quater-finalistswere allocated the rank 6.5 = (5+6+7+8)/4 etc.)were obtained from The Independent newspaper(13 July 1998). These results, together with the logtransformed ranks, are listed in table III.Clearly, because there is only one home team,
we can only test whether there exists a significantdifference in the intercepts between the away team’sregression line and the line, with the same slope,passing through the home team’s result. We shalltherefore define home advantage in this context assignificantly different intercepts. This is equivalentto determining if the data point of France would fallon the regression line fitted to all the remainingteams. The plot of the log-transformed result ranksagainst the log-transformed world ranks are givenin figure 1.
The analysis identified a significant differencein the intercept parameters for France comparedwith the remaining competing nations (p < 0.001).This was confirmed using the distribution free per-mutation methods proposed by Holder and Nevill.[4]While France was identified as the most significantoutlier in a common regression for all 32 teams(p < 0.033), Croatia was the next largest outlier.This is also evident when observing the results ofFrance (and Croatia) in figure 1. The 2 regressionmodels explaining R2 = 48.5% of the variance aregiven as follows:lnresrank (France) = –1.06 + 0.375 lnwranklnresrank (others) = +1.62 + 0.375 lnwrank
where lnresrank = log (result rank) and lnwrank = log(world rank).Based on their relatively low world ranking
prior to the competition (17th), France’s successwas significantly better (p < 0.001) than all othernations competing and, as such, enjoyed a signifi-cant home advantage in winning the 1998 soccerWorld Cup.
1.4 Home Advantage or Disadvantage inChampionship ‘Play-Offs’
There is still fierce debate as to the existence ofa possible home disadvantage, when the home team
3
2
1
0
0 1 2 3 4
Log
(res
ult r
ank)
Log (world rank)
France Other countries
Fig. 1. Log-transformed result ranks plotted against the log-transformed world ranks for France and all other countries fromthe 1998 World Cup.
Home Advantage in Sport 225
© Adis International Limited. All rights reserved. Sports Med 1999 Oct; 28 (4)

appears to ‘choke’ on their own territory in the finalgames of a championship play-off. This conceptwas first introduced by Baumeister and Steinhil-ber,[17] who examined archival data from the base-ball World Series from 1924 to 1982. They foundthat when the home team was close to victory, asin the decisive seventh game of the series, theywononly 39% of the games. Their arguments appearedeven more compelling in the light of data from bas-ketball play-offs being generally consistent withthe data from baseball. Independent archival inves-tigations by other researchers have found similareffects in golf[23] and ice hockey.[24]
However, a number of authors have questionedthe concept of ‘home field championshipchoke’.[1,18,25,26] Courneya and Carron[1] argue thatthe whole concept is, at the very least, a tenuousassertion in light of the number of games on whichit is based. Indeed, Schlenker et al.[18] go on to re-port that since 1982, 4 baseball World Series wentto a seventh game and every one of these was wonby the home team. Since 1982, similar findings wereobserved in basketball, with the 6 final and semi-final championships that went to 7 games all wonby home teams. Arguments and counter-argumentsfollowed in the literature[17-19,27] and the debate is
Table III. The FIFA/Coca-Cola world rankings prior to, and the final results/finishing positions (recorded as ranks) after, the 1998 World Cupfinals held in France
Country World rank Result rank Home lnwrank [log (world rank)] lnresrank [log (result rank)]Brazil 1 2.0 0 0.00000 0.69315Germany 2 6.5 0 0.69315 1.87180Mexico 4 12.5 0 1.38629 2.52573England 5 12.5 0 1.60944 2.52573Argentina 6 6.5 0 1.79176 1.87180Norway 7 12.5 0 1.94591 2.52573Yugoslavia 8 12.5 0 2.07944 2.52573Chile 9 12.5 0 2.19722 2.52573Colombia 10 24.5 0 2.30259 3.19867USA 11 24.4 0 2.39790 3.19458Japan 12 24.5 0 2.48491 3.19867Morocco 13 24.5 0 2.56495 3.19867Italy 14 6.5 0 2.63906 1.87180Spain 15 24.5 0 2.70805 3.19867France 17 1.0 1 2.83321 0.00000Croatia 19 3.0 0 2.94444 1.09861Korea 20 24.5 0 2.99573 3.19867Tunisia 21 24.5 0 3.04452 3.19867Romania 22 12.5 0 3.09104 2.52573South Africa 24 24.5 0 3.17805 3.19867Netherlands 25 4.0 0 3.21888 1.38629Denmark 27 6.5 0 3.29584 1.87180Paraguay 29 12.5 0 3.36730 2.52573Jamaica 30 24.5 0 3.40120 3.19867Austria 31 24.5 0 3.43399 3.19867Saudi Arabia 34 24.5 0 3.52636 3.19867Bulgaria 35 24.5 0 3.55535 3.19867Belgium 36 24.5 0 3.58352 3.19867Scotland 41 24.5 0 3.71357 3.19867Iran 42 24.5 0 3.73767 3.19867Cameroon 49 24.5 0 3.89182 3.19867Nigeria 74 12.5 0 4.30407 2.52573
226 Nevill & Holder
© Adis International Limited. All rights reserved. Sports Med 1999 Oct; 28 (4)

clearly set to continue for some time. However,one conclusion from this debate seems reasonable.There does appear to be strong evidence of a re-duced home advantage in the latter stages of cham-pionship games. This had been observed by Pol-lard[10] when reporting the home advantage in theFA Cup from 1960 to 1984. He noted a greatly re-duced home advantage of 50.5% in the sixth roundof the competition, a finding that supports the as-sertion that home advantage is diluted at the crucialstages of a competition.
2. Game Location Factors Associatedwith Home Advantage
Courneya andCarron[1] identified 4game locationmajor factors likely to effect the degree of homeadvantage. These are crowd factors, learning/famil-iarity factors, travel factors and rule factors. Weshall assess the relative importance of these factorsand, in the light of recent research, examine to whatextent this research has adopted the 3 approachesrecommended by Courneya and Carron[1] as ‘pos-sible future directions’ for further research.Briefly, the following 3 approaches were recom-mended: (i) selecting a game location factor (e.g.crowd size) and observing the way home advan-tage varies for the home and away teams with dif-ferent levels of the factor; (ii) observing differ-ences in home advantagewhen only 1 game locationfactor is present (or absent); and (iii) observing howdifferences in home advantage, such as the numberof fouls, vary with differences in crowd behaviour,such as cheering or booing.We recognise that the approaches above are not
true experimental designs, but are often referred toas quasi-experimental designs. Nevertheless, theirpurpose is to fit the investigations into a real worldsetting while controlling as many as possible of theconfounding effects that could threaten the internalvalidity of the study.
2.1 Crowd Factors
There has been conflicting evidence as to howimportant crowd support is in contributing to homeadvantage. Studies by Dowie[8] and Pollard[10] found
very little evidence that home advantage varied withcrowd density (percentage of ground capacity).Based on the home advantage across the 4 divi-sions of the English football (soccer) league, theauthors found little difference in home advantageeven though the average crowd density increasedfrom 20% in division 4 to 70% in division 1.In contrast, Schwartz and Barsky[5] found that
the home advantage in major league baseball in-creased with crowd density. The trend in homewinning percentage increased from a home advan-tage of 48% in relatively empty stadia (less than20% capacity), to 55% when the stadia were be-tween 20 and 40% capacity and to 57% whencrowd density was greater than 40%. Interestingly,Schwartz and Barsky[5] recognised the need to par-tition out the effects of both home advantage andteam quality. Assuming constant additive effects,the authors were able to show that the home advan-tage had a marginally stronger effect than the qual-ity of team effect when comparing the number ofruns scored by division 1 and division 2 teams.Further evidence that crowd density effects the
home advantage inmajor junior-A ice hockey comesfrom a study by Agnew and Carron.[13] Multipleregression was used to investigate the predictiveeffect of the main effects, crowd size (entered bothas absolute size and as a percentage of the arenacapacity), time of year (first or second half of theseason), opponent’s division (2 divisions of datawere available) and all interactions between thesefactors. Using the results (game outcome) of 990games as the response variable (2 for a win, 1 fora draw and 0 for a loss), the regression analysisfound that crowd density was significantly relatedto home advantage (R2 = 0.011, p < 0.001). Theauthors concluded that only a small (but neverthe-less significant) percentage of the variance in homeadvantage could be explained by crowd factors.Moore and Brylinsky[28] seized on a unique op-
portunity to assess the effect of crowd support onteam performance in college basketball. During the1988/1989 season, a measles epidemic resulted ina quarantine that caused 11 North Atlantic Confer-ence basketball games for 2 teams (Siena and Hart-
Home Advantage in Sport 227
© Adis International Limited. All rights reserved. Sports Med 1999 Oct; 28 (4)

ford) to be played without spectators. When theresults for both teams were analysed, evidence ofan improved performance in the total number ofpoints scored, field goal percentage and free throwpercentage was found when no crowd was present.This result was counter-intuitive to the findings de-scribed above, but the authors acknowledged thatthe power of the statistical test used to analyse thedata was low. Furthermore, the quality of the op-position effect, the other major factor known toinfluenceperformanceoutcomes,wasnot incorporatedinto the analysis and, as such, the findings of thestudy may be misleading.Evidence that the crowd may be able to influ-
ence the number of fouls and turnovers, and hencethe home advantage, in college basketball, comesfrom a study by Thirer and Rampey.[29] The authorsfound that during normal crowd behaviour, the vis-iting teams committed more infractions, (i.e. com-mitted more fouls and lost more possessions orturnovers). However, home teams committed moreinfractions during antisocial crowd behaviour(swearing, chanting obscenities). The authors con-cluded that ‘anti-social behaviour from the crowdhad a detrimental effect on the home team’.Greer[30] also assessed the effect of crowd beha-
viour (spectator booing) on the performance out-comes of home and away teams (points scored, turn-overs, violations and composite score comprisingof points scored minus turnovers and violations).Greer[30] observed that during normal crowd beha-viour, home teams were better on all 4 performanceoutcomes. During those instances when the crowdwere booing (for longer than 15 seconds), the hometeam’s superiority increased further in all 4 perfor-mance outcomes, 2 being significant. Greer[30]speculated that the observed increase in the hometeam’s performance measures (home advantage)was because of either a decrement in the visitingteam’s performance or to referee bias resultingfrom intimidation by the home crowd (since mostof the booing was directed at the officials).Further support for an association between home
advantage and crowd support comes from a studyby Nevill et al.[15] Using results from the end-of-
season (1992/1993) league tables, overall home ad-vantage was confirmed in the 8 major divisions ofthe English and Scottish football (soccer) leagues.Furthermore, the degree of home advantage wasfound to be associated significantly with the meanattendance of each division. In an attempt to ex-plain these findings, the number of sendings-off orpenalties scored were recorded. The overall fre-quency of both sendings-off and penalties scored fa-voured the home side, but again this was not con-stant across the divisions. In divisions with largecrowds, the percentage of home sendings-off wasrelatively small (30%) in contrast to no difference(50%) in divisions with smaller crowds. Similarly,the percentage of penalties scored by home sides indivisions with the largest crowds was large (>70%)in contrast to little or no advantage in divisionswith smaller crowds. Nevill et al.[15] argued in thediscussion that the reason why their findings con-flict with the results of the studies by Dowie[8] andPollard[10] might well have been due to the inclu-sion of the semi-professional leagues (G.M.Vauxhallleague) and the 3 Scottish leagues where crowdsizes are considerably smaller. In support of thesefindings, Pollard[10] did acknowledge little evidenceof home advantage (52.6%) with games of less im-portance (i.e. F.A. Sunday Cup games), when at-tendances would have been relatively small.In order to help explain why officials makemore
subjective decisions in favour of the home side,Nevill et al.[31] investigated whether a crowd’s re-action to various tackles/challenges (recorded onvideotape during televised soccer games) were ableto influence knowledgeable observers’ opinions ofwhat should be the correct decision. Eleven know-ledgeable observers (semi-professional footballers,qualified referees and coaches) viewed 52 tackles/challenges from a televised football match, of which26 were made by the home player and 26 by theaway player. Six of the participants observed thevideo tape with no background crowd noise whilstthe remaining 5 observed the video tape in the pre-sence of background crowd noise. An analysis ofthe number of fouls awarded by the observers (ex-cluding the referee’s data) using the analysis of
228 Nevill & Holder
© Adis International Limited. All rights reserved. Sports Med 1999 Oct; 28 (4)

variance (ANOVA) identified a significant 2-wayinteraction between ‘noise group’ and ‘team repre-sentation’ (F1,9 = 8.2, p = 0.019). The noise of thecrowd would appear to influence observers to awardfewer fouls against home players, andmore againstaway players (noise group), when compared witha group receiving the visual stimulus alone (no noisegroup), a tendency which was echoed by the matchreferee. Assuming that the decisions of officialsmay be affected in a similar way to the knowledge-able observers, these results provide the first experi-mental/empirical evidence of how official decisionsmay be influenced by crowd reactions in favour ofthe home side or against the away side, thus con-tributing to the explanation of home advantage.Finally, Nevill et al.[15] observed that the division
with the greatest home advantage in percentages ofhome wins, away players being sent off and homepenalties scored was not the English premier league,but the English first division, where crowd sizeswere considerably less. Similarly, based on the com-bined results of the 11 seasons from 1985 to 1996(see table IV), the greatest percentage of homewins was also found in the English league division1 (66.0%) and not in the premier league (64.3%).Furthermore, when the percentage of home wins
was examined separately for each season, the pre-mier league had the highest percentage in only 2 ofthe 11 seasons. These results suggest that once thecrowd has reached a certain size or consistency (thebalanced nature of the crowd), a peak in home ad-vantage is observed. These observations will bediscussed in section 5, with special reference to the
reduced home advantage observed in the latterstages of baseball and basketball championshipplay-offs,[17] and in the latter stages of the FA Cupand ‘local derbies’.[10]
2.2 Learning/Familiarity Factors
Various authors have studied the contribution tohome advantage made by familiarity with localconditions. Schwartz and Barsky[5] argued that iffamiliarity with local playing conditions was animportant factor contributing to home advantage,we would expect it to be more important in icehockey and basketball, where home advantage ismost decisive, compared with baseball and Amer-ican football, where it is least important (see tableII). However, the authors acknowledged that theevidence seemed to go in the opposite direction.Familiarity with the playing area is clearly morerelevant in baseball, where large differences existin the stadium backdrop, playing surface, etc. fromone baseball stadium to another. This apparentcontradiction lead the authors to question the rele-vance of familiarity as a major factor when assess-ing the factors associated with home advantage.Pollard[10] also noted that in English soccer
there was no direct evidence that home advantagewas affected by the relatively small differences inplaying surfaces (predominantly grass). Dowie[8]commented on the large differences in the size offootball league pitches, but the teams with thesmallest (Bristol Rovers and Halifax Town) andlargest playing areas (Manchester City and Car-
Table IV. Frequency of home and away wins by the English and Scottish leagues/divisions for the 11 seasons from 1985 to 1996
League/division Home wins (%) Away wins (%) Total winsEnglish Premier 2183 (64.3) 1211 (35.7) 3394English 1st 2789 (66.0) 1438 (34.0) 4227English 2nd 2887 (64.8) 1565 (35.2) 4452English 3rd 2670 (64.0) 1500 (36.0) 4170GM Vauxhall 2245 (60.5) 1466 (39.5) 3711Scottish Premier 1025 (59.4) 702 (40.6) 1727Scottish 1st 1137 (56.9) 860 (43.1) 1997Scottish 2nd 1217 (58.2) 874 (41.8) 2091Scottish 3nd 138 (50.4) 136 (49.6) 274Total 16291 (62.6) 9752 (37.4) 26043
Home Advantage in Sport 229
© Adis International Limited. All rights reserved. Sports Med 1999 Oct; 28 (4)

lisle) gained a similar home advantage (65.6%) tothe rest of the league (64.5%), over the seasonsfrom 1981 to 1984. Indeed, Queens Park Rangers,the only team playing on an artificial turf at homeduring that period, gained a home advantage of63.9%, again no different from the rest of the league.Clarke and Norman[2] argued that the conclusionsby Pollard[10] might have been affected by the rel-ative strengths of the clubs (team ability). Takingteam ability into account, Clarke and Norman[2]reassessed the home advantage of the 5 clubs (Bris-tol Rovers, Halifax Town, Manchester City, Carlisleand Queens Park Rangers) over the 11 seasonsfrom 1981 to 1991 to find some evidence that theseteams had a higher than average home advantage(p = 0.076). This evidence was strengthened by theresults of a study by Barnett and Hilditch,[32] whofound that teams playing on artificial pitches duringthe 1980s (Queens Park Rangers, Luton Town,Oldham Athletic and Preston North End) did in-deed have a home advantage and, when reported tothe Commission of Enquiry for the Football Leaguein 1989, was of a sufficient scale to be a cause ofconcern. For this reason, artificial pitches are nolonger permitted in the English and Scottish foot-ball leagues. The issue of whether home advantageexists for teams playing on artificial turf in baseballand American football did not appear to be a topicconsidered worthy of investigation by any of thestudies identified by this review.Moore and Brylinsky[14] seized on yet another
unique opportunity to assess the effect familiaritywith local playing conditions has on home advan-tage. During the 1992/1993 season, Western Mich-igan University basketball teams, both men andwomen, played their home games at 5 different lo-cations while the new home stadium was beingbuilt. The results showed that home advantage wasnot diluted for either the men’s or women’s teamsand was greater than the conference as a whole.
2.3 Travel Factors
The assumption that travel will be detrimentalto the performance of visiting athletes, thought toexperience fatigue and a disruption of familiar rou-
tines/habits, has been studied by various authors.However, the evidence is not overwhelming andhas been conflicting. Snyder and Purdy[9] found ahome winning percentage of 58.8% (based on 64games) for visiting basketball teams travelling lessthan 200 miles. In contrast, for teams travellingover 200 miles, the home winning percentage was84.6% (based on 26 games). The evidence of anadditional home advantage for home teams com-peting against visiting teams that travel over 200miles should be treated with some caution. Clearly,the number of games used by the study was verysmall. Using a much larger sample (3496 games),Pollard[10] found distance unimportant, with thesame home advantage of 64.3% for teams travel-ling under and over 200 miles.As stated earlier, inference from such studies is
problematic since other confounding variablessuch as team ability, number of time zones crossed,number of days between games, etc., will affectperformance simultaneously. In an attempt to over-come such problems, Courneya and Carron[33] andPace and Carron[11] used multiple regression toidentify those factors which were associated withhome advantage in baseball and ice hockey respec-tively. Using game outcome as the response vari-able, the explanatory variables were entered as bothmain effects, such as distance travelled, number oftime zones crossed, together with the 2-way inter-actions between the main effects. When all thevariables and 2-way interactions were forced intothe regression model used by Courneya and Car-ron[33] to predict the home advantage in basketball,the saturated model explained less than 1.2% of thevariance in win/loss outcome. The only variablethat was remotely related to home advantage wasthe length of the visiting teams’ road trips.Similar results were obtained when Pace and
Carron[11] used multiple regression to identify thosefactors associated with home advantage in icehockey. On this occasion, the authors used a step-wise process to identify a reduced model that ex-plained 1.5% of the variance. The variables selectedby the stepwise regression analysis were: (i) theinteraction between time zones crossed × prepara-
230 Nevill & Holder
© Adis International Limited. All rights reserved. Sports Med 1999 Oct; 28 (4)

tion time; and (ii) the visitors game number on theroad. The authors concluded that only a small pro-portion of the variance in home advantage could beexplained by travel-related factors. This type of ap-proach has obvious advantages over the relativelysimplistic approach adopted by Snyder and Purdy[9]and Pollard.[10] The only reservation we have withtheir statistical methods concerns the use of theirdiscrete categorical variables, such as the numberof time zones crossed, as continuous main effectand interaction covariates. Clearly, more valid re-sults would have been obtained by entering thesevariables as dummy/indicator variables.Various authors have examined the effect that
travelling across time zones has on American foot-ball[34,35] and basketball team performance.[36] ForAmerican football games played during the day,Jehue et al.[34] observed a decline in the home ad-vantage of west coast teams when travelling to bothcentral and east locations. In contrast, when centraland east teams travelled, there was little or nochange in their home advantage. One explanationproposed was that adaptation to travelling acrosstime zones occurs more rapidly with westboundtravel compared with eastbound travel. Interestingly,Steenland and Deddens[36] observed a decline inthe home advantage, in theNational Basketball As-sociation over the 8 seasons from 1987 to 1995,found to be associated with fewer free throws beingscored by the home team. Assuming the number offree throws scored reflects the number of freethrows being awarded as penalties, the observedassociation confirms the importance of officials’decisions in determining the degree of home ad-vantage in basketball, a finding similar to the asso-ciation observed by Nevill et al.[15] in soccer.
2.4 Rule Factors
Since the comprehensive review by Courneyaand Carron,[1] there has been very little work fo-cusing on the contribution that rule factors havemade in explaining the home advantage. This willalmost certainly reflect the limited evidence thatsuch rules benefit the home side and the limitednumber of sports where such a rule exists (batting
last in baseball and the last line change in icehockey). As stated earlier, one of the major prob-lems in assessing the impact of various game loca-tion factors on home advantage is the confoundingeffects of all the other factors that will be operatingsimultaneously on the performance/match outcomes.Courneya and Carron[37] carried out one of the fewstudies that has managed to control most, if not all,of the other major game location factors when in-vestigating the effect of rule differences on homeadvantage. To test whether home teams in baseballhave an advantage by batting last, they studied theresults from a recreational slow-pitch softball tour-nament where all games were played as doubleheaders with teams alternating home and away sta-tus. The results indicated that there was very littlebenefit to be gained from batting last.
3. Critical Psychological States
Clearly, in order for the game location factorsdescribed above to translate into a quantifiable as-pects of home advantage (performance outcomes),as in points, goals, fouls, penalties, etc., they musthave an impact on the competitors, coaches and/orofficials, in either their thoughts and/or their deeds.Courneya and Carron[1] refer to the thought processas ‘critical psychological states’ and, if subsequentlytranslated into deeds, as ‘critical behavioural states’.Very limited research has focused on the critical
psychological states that may lead to home advan-tage. One such study by Jurkovac,[38] cited byCourneya and Carron,[1] examined college basket-ball players’ perceptions of playing at home andaway. The results showed that the players reportedfeelings of playing better in front of a loud andactive crowd at home (97%) compared to playingaway (74%). The players also felt that they weremore confident (76%) and more motivated by vi-sual signs of support such as banners (89%) whenplaying in front of a home crowd. Follow-up inter-views of 14 of the athletes identified that crowdsupport was a motivational factor that resulted ingreater confidence but created more pressure to win.Although criticised by Courneya and Carron[1] fornot assessing more psychological states and adopt-
Home Advantage in Sport 231
© Adis International Limited. All rights reserved. Sports Med 1999 Oct; 28 (4)

ing a retrospective questionnaire design (athleteshad to recall their feelings/experiences after thegames), they recognised the need for this type ofresearch to assess athletes’ perceptions in an at-tempt to explain the home advantage. Probably themost important finding from this research was theconfirmation that competitors are more confidentwhen playing at home in front of a supportive au-dience. Consequently, because competitors are moreconfident when playing at home, they believe theywill be more successful and, as such, play better athome as part of the ‘self-fulfilling philosophy’.Bar-Eli et al.[39] studied how perceived specta-
tor behaviour in competition might influence thepsychological arousal and subsequent performanceof competitors. The researchers proposed that anathlete’s psychological state could be termed either‘crisis’ or ‘non-crisis’, and that athletes perceivedtheir psychological states in association with spec-tator response, their own actions and the game lo-cation. Specifically, the psychological state of anathlete was significantly vulnerable to high arousaland crisis as a result of negative responses from theaudience after unsuccessful action or poor perfor-mance at home. This work does appear to providesome support for the findings of Baumeister andSteinhilber[17] on home field disadvantage.
4. Critical Behavioural States
As with critical psychological states, there hasbeen very little systematic research into the criticalbehavioural states associated with home advantage,although a number of studies have examined thebehavioural states of competitors and officials.
4.1 Competitors’ Behavioural States
There are a number of behavioural states thatmight be associated with home advantage, includ-ing aggressiveness, effort expended, body postureand verbal/non-verbal communication. However,the majority of research into this area has focusedon aggression. Although not unanimous, moststudies have observed that visiting teams commitmore fouls (probably the most commonly adoptedmeasure of aggression) than home teams.[7,40-43]
Courneya and Carron[1] cite the study by Schwartzand Barsky[5] as providing contrasting evidence thathome teams are more aggressive. Upon more care-ful examination, however, the authors provide nodata to support this statement and admit that ‘whilewe cannot prove it directly, the bits of evidence wehave been able to piece together suggest that teamswin more games at home because they play moreaggressively in their home territories’. The onlystudies that do not support the assumption thataway teams are more aggressive are by McGuire etal.[44] and Russell,[45] who found no differences.These findings may not be contradictory, however,in that there may well be no difference in aggres-sion between home and visiting competitors, butthe observed difference in fouls may be simply aresult of officials awarding more decisions in fa-vour of the home side, for whatever reason (eitherbias, or more probably due to the subconscious in-fluence of the home crowd[31]).When studying homeadvantage in college basket-
ball, Varca[7] distinguished between functional (in-creasing the chance of winning) and dysfunctional(decreasing the chance of winning) aggressivebehaviour. The results support the hypothesis thathome teams outperform visiting teams in terms ofrebounds, blocks and steals (so-called functionalaggressive behaviour) while visiting teams com-mitted more fouls (dysfunctional aggressive beha-viour). This work was supported by Glamser,[40]when investigating player misconduct and race inEnglish soccer. The author concluded that ‘the hos-tile atmosphere of an away game where such (so-cial) support is lacking can clearly produce a dys-functional aggressive response on the part of thevisiting player and a less-than-objective view onthe part of officials’.
4.2 Officials’ Behavioural States
Although not unanimous, a number of studieshave observed that officials consistently makemore subjective decisions in favour of the hometeam.[7,30,40-43,46] In contrast, a recent study byDen-nis and Carron[47] failed to find evidence of offici-ating bias in National Hockey League games when
232 Nevill & Holder
© Adis International Limited. All rights reserved. Sports Med 1999 Oct; 28 (4)

comparing infractions (called vs not called) forboth home and away players. In an attempt to un-derstandwhy officials tend to makemore decisionsin favour of the home side, a recent study by Nevillet al.[15] was able to confirm that not only do offi-cials in English and Scottish soccer make moresubjective decisions (penalties and sendings-off)in favour of the home side, but the observed imbal-ance appears to increase in divisions with largercrowds. A number of studies, including Sumnerand Mobley,[46] have recognised that this associa-tion may not be due to officiating bias in favour ofthe home side. Due to various reasons, visitingteamsmay deserve to be penalised more frequently(e.g. visiting teams spend more time defending).As such, the observed association may be the resultof such defensive play rather than the cause of thehome advantage.In order to assess whether referees would feel
pressure from the crowd to award fewer fouls againststar players, Lehman and Reifman[48] adopted aquasi-experimental design to examine the associa-tion between player status (star vs nonstar) and thenumber of fouls called against professional basket-ball players both home and away. The results foundthat star players were penalised significantly lessat home than away from home. In contrast, no dif-ferences were found for nonstar players. Lehmanand Reifman[48] concluded that ‘this pattern mayreflect officials’ reacting to pressure from thehome crowd’, a conclusion not dissimilar to that ofGlamser[40] described above, i.e. resulting in ‘a less-than-objective view on the part of officials’.
5. Conclusions
In their review, Courneya and Carron[1] suggestedthat the descriptive phase of the enquiry into homeadvantage is complete. However, based on the evi-dence from this review, this conclusion may havebeen a little premature. By examining the differ-ences in home advantage both between and withinsports, valuable insights into the causes of homeadvantage were obtained. For example, the lack ofevidence of home advantage in individual sportssuch as golf majors and tennis grand slam tourna-
ments,[3,4] when crowd sizes are considerable, mayreflect the relatively objective nature of the scoringsystems used in tennis and golf, unlike the subjec-tive influence of officiating decisions on the out-come of team games such as soccer, basketball andice hockey.Another conclusion by Courneya and Carron,[1]
that the magnitude of home advantage within eachsport is consistent and has remained relatively sta-ble over time, is also open to some debate. Schwartzand Barsky[5] found considerable differences inhome advantage in major league baseball, withhome advantage increasing from 48% in relativelyempty stadia (less than 20% capacity) to 57%whencrowd density was greater than 40%. Indeed, de-spite reporting that home advantage varied littleacross the 4 divisions of the English football leaguefrom 1970 to 1981 (approximately 64%), Pol-lard[10] acknowledged that there was a reducedhome advantage in semi-professional leagues (ap-proximately 60% in the Vauxhall-Opel League)and games of less importance (i.e. F.A. SundayCup; home advantage = 52.6%) when attendanceswould have been relatively small. Pollard[10] alsoreported a reduced home advantage in the latterstages of the FA Cup between 1960 and 1984, withno home advantage (50.5%) in the sixth round (quar-ter-finals, the last round before games are playedon neutral grounds) when attendances would havebeen near capacity. This latter observation supportsthe findings of Baumeister and Steinhilber[17] thatthe home advantage is diluted at the crucial stagesof a competition. Pollard[10] also noted a reducedhome advantage in ‘derby games’, when a teamplays against another team from the same town orcity, when attendances are also relatively large(based on local derby matches in London from 1970to 1981, when the home advantage was 56.1%comparedwith other gameswhere home advantagewas 64.1%).These results are entirely compatible with the
differences in home advantage observed by Nevillet al.[15] in the English and Scottish soccer leagues/divisions, and further supported by the results forthe 11 seasons from 1985 to 1996 (see table IV).
Home Advantage in Sport 233
© Adis International Limited. All rights reserved. Sports Med 1999 Oct; 28 (4)

The table reveals little or no home advantage in theScottish third division (semi-professional) wherecrowd sizes are relatively small. Thereafter, the trendin home advantage increases to a maximum in theEnglish first division (home advantage = 66%), butthen declines in the English premier division (homeadvantage = 64%) where crowd sizes are at theirgreatest but also likely to be more balanced (witha greater proportion of away supporters). Indeed,we would anticipate similar, more balanced crowdsupport in local derbies, the final games of cham-pionship play-offs in baseball and basketball, andthe final rounds of the FA Cup, where a reducedhome advantage has already been reported. Clearly,if the home crowd were able to influence either thehome competitors (to perform better than the awaycompetitors) or the officials (to penalise the awayside more frequently than the home side), the ob-served reduction in home advantage would naturallyoccur when the number of home and away support-ers was more equal. Although such a conclusionseems entirely reasonable and plausible, as yet, nostudy has investigated the effect of crowd consis-tency (proportion of home and away supporters) onhome advantage.As such, we recommend that crowdconsistency should be a topic for future researchinto factors associated with home advantage.The present review of the home advantage liter-
ature has provided crucial evidence to help solvethe mystery of home advantage. From the evidenceaccumulated, we shall discuss the various game lo-cation factors in ascending order of importance.Rule factors play a very minor role in contribut-
ing to the home advantage in only a minority ofsports. In baseball, one of the few sports wherebatting last is thought to offer some advantage tothe home team, Wright and House[49] ‘guesstimated’that about 5% of the home field advantage was be-cause of the strategic advantage of batting last.Even this relatively minor contribution might be anover-estimate if the findings of Courneya and Car-ron,[37] who found no advantage in batting last inrecreational softball, can be extrapolated to majorleague baseball. Furthermore, since there are nostrategic rules that favour the home team in most
team sports where home advantage is greatest (bas-ketball and soccer), we feel confident that rule fac-tors are not the cause of home advantage.The majority of studies investigating the effect
of learning/familiarity factors on home advantageconcluded that little advantage was gained frombeing familiar with the local playing conditions ofthe stadium. The only study that found familiaritywith local playing conditions advantageous[32]identified that teams playing on artificial pitches(Queens Park Rangers, Luton Town, Oldham Ath-letic and Preston North End) had a distinct advan-tage compared with other teams in the leagues. Forthis reason, artificial pitches were banned in theEnglish and Scottish football leagues following theCommission of Enquiry by the Football League in1989. With this notable exception, the findingsfrom themajority of studies suggest that familiaritywith local playing conditions is not a major factorwhen assessing the home advantage phenomenon.Again, the majority of studies investigating the
effect of travel factors on the home advantage foundonly limited evidence that travel fatigue was re-sponsible for the home advantage. However, stud-ies examining the effect of travelling across timezones did identify significant fluctuation in homeadvantage.[34-36] All 3 studies identified jet lag asthe likely cause of home advantage and, in partic-ular, that west coast teams had an additional advan-tage when playing east coast teams on Mondaynights, due to playing at a time closer to their cir-cadian peak time of day. Once again, although travelacross time zones will undoubtedly have some ef-fect on the home advantage in competitions wherelong distances (trans-meridian) are involved, thehome advantage still remains extremely high withincountries where travel distances are not great. Forexample, Stefani[50] reported home advantages of76.1 and 76.3% in Italian and Spanish soccerleagues, respectively. As such, travel factors areunlikely to be the major cause of home advantage.On the other hand, evidence from studies inves-
tigating crowd factors appears to be the most fruit-ful and likely dominant cause of home advantage.Although not unanimous, there is strong evidence
234 Nevill & Holder
© Adis International Limited. All rights reserved. Sports Med 1999 Oct; 28 (4)

that home advantage increases with crowd size un-til the crowd has reached a certain size or consis-tency, after which a peak in home advantage is ob-served. If the home crowd is able to influence theteam’s home advantage, as the crowd size getslarger, the home advantage would naturally increase.As the crowd size increases further, as is likelywith additional away supporters attending localderbies and final rounds of knock-out competi-tions, the influence of the reactions of the home andaway supporters would becomemore balanced andcorrespondingly reduce the size of home advan-tage. This is compatible with the observation ofBaumeister and Steinhilber[17] that home advantageis diluted at the crucial stages of a competition.There are 2 possible ways the crowd might in-
fluence home advantage: either the crowd can pro-vide a psychological lift to raise the home competi-tors’ performance relative to the away competitors,and/or the crowd are able to influence the officialsto favour the home team. Jurkovac[38] provides someevidence that crowds are able to increase compet-itors’ confidence to perform better in front of thehome crowd. However, the lack of evidence of homeadvantage in individual sports such as golf majorsand tennis grand slam tournaments, where crowdsizes are considerable, suggests that the crowd’sability to influence officials’ decisions that favourthe home team may be the more dominant cause ofhome advantage. This was precisely the conclusionreached by Wright and House,[49] when studyingthe home advantage in baseball. They ‘guesstimated’that only about 5% of the home advantage was dueto the psychological lift provided by the crowd, butapproximately 40% (the largest single factor) ofhome advantage was due to officials’ bias towardthe home team. However, the present authors wouldquestion their use of the word ‘bias’. Based on thework described in the present review, the crowd ismore likely to be subconsciously influencing theofficials’ decisions rather than causing them to dis-play overt bias.The evidence that the crowd is able to influence
officials’ decisions in favour of the home side comesfrom studies such as Lehman and Reifman,[48]
Glamser[40] and Nevill et al.[15] Clearly, it wouldonly take 2 or 3 crucial decisions to go either againstthe away side or in favour of the home side, to givethe home side the ‘edge’ during the game. Just howthe crowd is able to influence the officials’ deci-sions is, as yet, unclear. However, a recent studyby Nevill et al.[31] suggests that a crowd’s reactionto various tackles/challenges recorded on video-tape during televised soccer games was able to in-fluence knowledgeable observers’ opinions of whena foul had occurred. The results confirmed that theobservers had a tendency to award more fouls forchallenges committed by the away player (com-pared with the home player) in the presence of thecrowd reactions, a tendency or bias that disappearedwhen the crowd’s reaction was absent. The authorsconcluded that crowd reactions appeared to influ-ence observers to bemore severe or aggressive whenviewing challenges by the away players, comparedwith challenges by the home players. If we canextrapolate the observers’ decisions to officials, thenthese results provide some evidence of how offi-cials’ decisions may be influenced by crowd reac-tions in favour of the home side, and thus providea possible mechanism to help explain the homeadvantage phenomenon.
References1. Courneya KS, Carron AV. The home advantage in sport com-
petitions: a literature review. J Sport Exerc Psychol 1992; 14:13-27
2. Clarke SR, Norman JM. Home ground advantage of individualclubs in English soccer. Statistician 1995; 44: 509-21
3. Nevill AM, Holder RL, Bardsley A, et al. Identifying homeadvantage in international tennis and golf tournaments. J SportsSci 1997; 15: 437-43
4. Holder RL, Nevill AM. Players performance at internationaltournaments: is there a home advantage? J R Stat Soc 1997;46: 551-9
5. Schwartz B, Barsky SF. The home advantage. Soc Forces 1977;55: 641-61
6. Edwards J. The homefield advantage. In: JH Goldstein, editor.Sports, games and play: social and psychological viewpoints.Hillsdale (NJ): Erlbaum, 1979: 409-30
7. Varca P. An analysis of home and away game performance ofmale college basketball teams. J Sport Psychol 1980; 2: 245-57
8. Dowie J. Why Spain should win the World Cup. New Scientist1982; 94: 693-5
9. Snyder EE, Purdy DA. The home advantage in collegiate basket-ball. Sociol Sport J 1985; 2: 352-6
10. Pollard R. Home advantage in soccer: a retrospective analysis.J Sport Sci 1986; 4: 237-48
Home Advantage in Sport 235
© Adis International Limited. All rights reserved. Sports Med 1999 Oct; 28 (4)

11. Pace A, Carron AV. Travel and the home advantage. Can JSport Sci 1992; 17: 60-4
12. Adams RD, Kupper SJ. The effect of expertise on peak perfor-mance: the case of home-field advantage. J Sport Behav 1994;17: 108-19
13. Agnew GA, Carron AV. Crowd effects and the home advan-tage. Int J Sport Psychol 1994; 25: 53-62
14. Moore JC, Brylinsky J. Facility familiarity and the home advan-tage. J Sport Behav 1995; 18: 302-11
15. Nevill AM, Newell SM, Gale S. Factors associated with homeadvantage in English and Scottish soccer. J Sport Sci 1996;14: 181-6
16. Clarke S. Home advantage in balanced competitions: Englishsoccer 1991-1996. 3rd Conference onMathematics and Com-puters in Sports; 1996 Sep 30-Oct 2; Queensland, Australia,111-6
17. Baumeister RF, Steinhilber A. Paradoxical effects of supportiveaudiences on performance under pressure: the home field dis-advantages in sports championships. J Personal Soc Psychol1984; 47: 85-93
18. Schlenker BR, Phillips ST, Boniecki KA, et al. Championshippressures: choking or triumphing in one’s own territory? JPersonal Soc Psychol 1995; 68: 632-43
19. Baumeister RF. Disputing the effects of championship pres-sures and home audiences. J Personal Soc Psychol 1995; 68:644-8
20. McCutcheon LE. The home advantage in high school athletics.J Sport Behav 1984; 7: 135-8
21. Gayton WF, Langevin G. Home advantage: does it exist in in-dividual sports? Percept Mot Skills 1992; 47: 706
22. Bray S, Carron A. The home advantage in alpine skiing. Aust JSci Med Sport 1993; 25: 76-81
23. Wright EF, Christie SD, McGuire GR, et al. The home-coursedisadvantage in golf championships: further evidence for theundermining effect of supportive audiences on performanceunder pressure. J Sport Behav 1991; 14: 51-60
24. Wright EF, Voyer D, Wright RD, et al. Supporting audiencesand performance under pressure: the home-ice disadvantagein hockey championships. J Sport Behav 1995; 18: 21-8
25. Gayton WF, Matthews GR, Nickless CJ. The home field disad-vantage in sports championships: does it exist in hockey? JSport Psychol 1987; 9: 183-5
26. Kornspan AS, Lerner BS, Etzel EF, et al. The home disadvan-tage in the National Football League’s conference champion-ship games. Percept Mot Skills 1995; 80: 800-2
27. Schlenker BR, Phillips ST, Boniecki KA, et al. Where is thehome choke? J Personal Soc Psychol 1995; 68: 649-52
28. Moore JC, Brylinsky JA. Spectator effect on team performancein college basketball. J Sport Behav 1993; 16: 77-84
29. Thirer J, Rampey M. Effects of abusive spectator behaviour onthe performance of home and visiting intercollegiate basket-ball teams. Percept Mot Skills 1979; 48: 1047-53
30. Greer DL. Spectator booing and the home advantage: a studyof social influence in the basketball arena. Soc Psychol Q1983; 46: 252-61
31. Nevill A, Balmer N,Williams M. Crowd influence on decisionsin association football [letter]. Lancet 1999; 353 (9162): 1416
32. Barnett V, Hilditch S. The effect of an artificial pitch surface onhome team performance in football (soccer). J R Stat Soc1993; 156: 39-50
33. Courneya KS, Carron AV. Effects of travel and length of homestand/road trip on the home advantage. J Sport Exerc Psychol1991; 13: 42-9
34. Jehue R, Street D, Huizenga R. Effect of time zone and gametime changes on team performance: National Football League.Med Sci Sports Exerc 1993; 25: 127-31
35. Smith RS, Guilleminault C, Efron B. Circadian rhythms andenhanced athletic performance in National Football League.Sleep 1997; 20: 362-5
36. Steenland K, Deddens JA. Effect of travel and rest on perfor-mance of professional basketball players. Sleep 1997; 20: 366-9
37. Courneya KS, Carron AV. Batting first versus last: implicationsfor the home advantage. J Sport Exerc Psychol 1990; 12: 312-6
38. Jurkovac T. Collegiate basketball players’ perceptions of thehome advantage [thesis]. Bowling Green (OH): Bowling GreenState University, 1983
39. Bar-Eli M, Tenenbaum G, Levy-Kolker N. A crisis related anal-ysis of perceived spectator behaviour in competition. Can JSport Sci 1992; 17: 288-98
40. Glamser FD. Contest location, player misconduct, and race: acase from English soccer. J Sport Behav 1990; 13: 41-9
41. Lefebvre LM, Passer MW. The effects of game location andimportance on aggression in team sport. Int J Sport Psychol1974; 5: 102-10
42. Silva JM, Andrew JA. An analysis of game location and bas-ketball performance in the Atlantic Coast Conference. Int JSport Psychol 1987; 18: 188-204
43. Underwood GL, Whitwood JR. Aggression in sport: a study ofan English first division soccer team. Fed Int Educ Phys Bull1980; 50: 31-9
44. McGuire EJ, Courneya KS, Widmeyer WN, et al. Aggressionas a potential mediator of the home advantage in professionalice hockey. J Sport Exerc Psychol 1992; 14: 148-58
45. Russell GW. Crowd size and density in relation to athletic aggres-sion and performance. J Soc Behav Personal 1983; 11: 9-15
46. Sumner J, Mobley M. Are cricket umpires biased? New Scien-tist 1981; 91: 29-31
47. Dennis PW, Carron AV. The relationship between game loca-tion and officiating decisions in National Hockey League of-ficials [abstract]. J Sport Exerc Psychol 1998; 20: S63
48. Lehman DR, Reifman A. Spectator influence on basketball of-ficiating. J Soc Psychol 1987; 127: 673-5
49. Wright CR, House T. The diamond appraised. New York: Si-mon and Schuster, 1989
50. Stefani RT. Observed betting tendencies and suggested bettingstrategies for European football pools. Statistician 1983; 32:319-29
Correspondence and reprints: Professor Alan M. Nevill, Re-search Institute for Sport and Exercise Sciences, School ofHuman Sciences, Liverpool John Moores University, HenryCotton Campus, 15-21 Webster Street, Liverpool L3 2ET,England.E-mail: [email protected]
236 Nevill & Holder
© Adis International Limited. All rights reserved. Sports Med 1999 Oct; 28 (4)