hochschule offenburg university of applied sciences · hochschule offenburg university of applied...
TRANSCRIPT
Dynamische Methoden in der AdsorptionstechnikProf. Dr. habil. Reiner Staudt
Hochschule Offenburg
Fakultät für Maschinenbau und Verfahrenstechnik
Hochschule Offenburg University of Applied Sciences
Hochschule Offenburg University of Applied Sciences
Gliederung
• EinführungDefinitionen, Begriffe
• Poröse FeststoffeMaterialcharakteristik
• IsothermenExperiment,Isothermengleichungen
• Kinetikeffekt. Transportkoeffizient
• Wärmeisosterische Wärme
• GemischadsorptionExperiment, Modelle
• Reale AnwendungenTSA, PSA, Wärme
30. Mai 2017 Prof. Dr. habil. Reiner Staudt 2
Hochschule Offenburg University of Applied Sciences
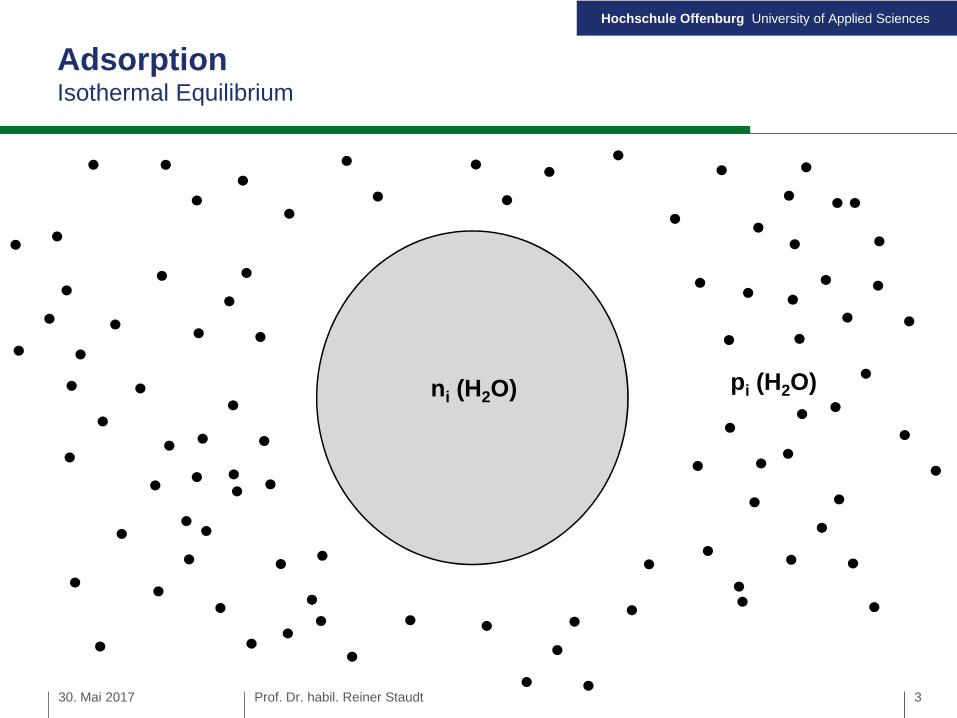
AdsorptionIsothermal Equilibrium
30. Mai 2017 Prof. Dr. habil. Reiner Staudt
pi (H2O)ni (H2O)
3
Hochschule Offenburg University of Applied Sciences
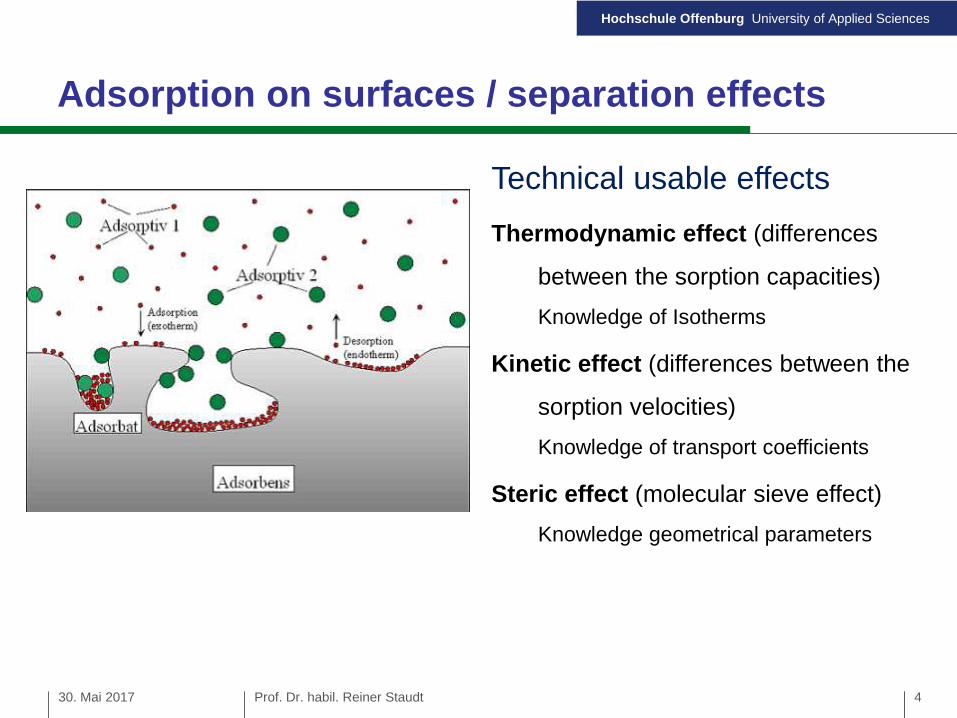
Adsorption on surfaces / separation effects
Technical usable effects
Thermodynamic effect (differences
between the sorption capacities)
Knowledge of Isotherms
Kinetic effect (differences between the
sorption velocities)
Knowledge of transport coefficients
Steric effect (molecular sieve effect)
Knowledge geometrical parameters
30. Mai 2017 Prof. Dr. habil. Reiner Staudt 4
Hochschule Offenburg University of Applied Sciences
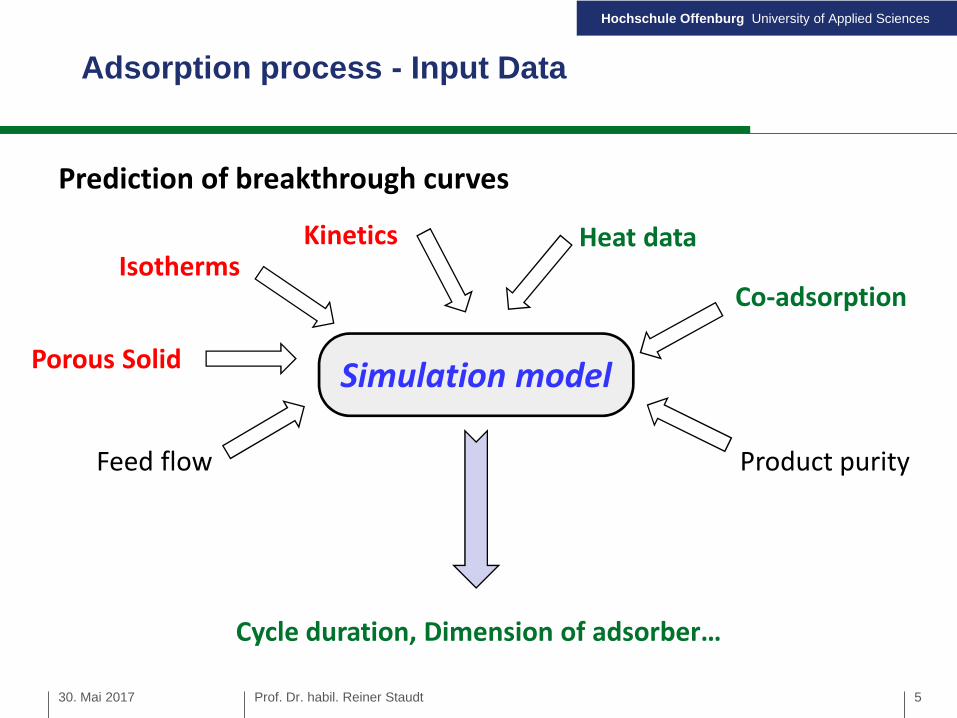
Adsorption process - Input Data
IsothermsKinetics
Co-adsorption
Feed flow Product purity
Cycle duration, Dimension of adsorber…
Prediction of breakthrough curves
Simulation model
Heat data
30. Mai 2017 Prof. Dr. habil. Reiner Staudt
Porous Solid
5
Hochschule Offenburg University of Applied Sciences
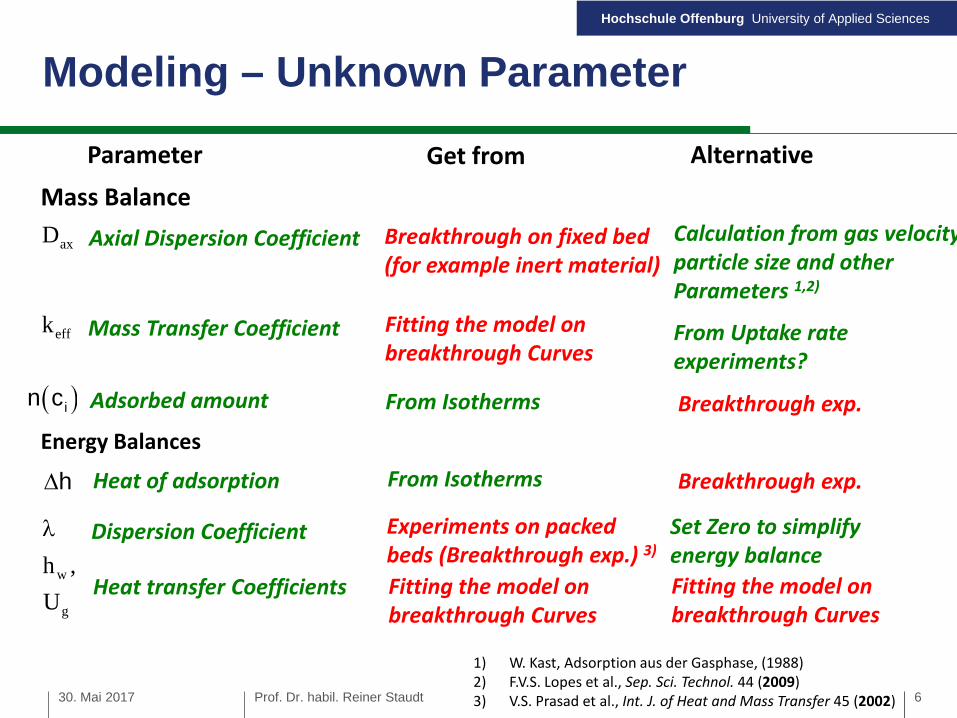
Modeling – Unknown Parameter
Mass Balance
Mass Transfer Coefficienteffk
1) W. Kast, Adsorption aus der Gasphase, (1988)2) F.V.S. Lopes et al., Sep. Sci. Technol. 44 (2009)3) V.S. Prasad et al., Int. J. of Heat and Mass Transfer 45 (2002)
Energy Balances
h
axD Axial Dispersion Coefficient
in c Adsorbed amount
Parameter Get from Alternative
Breakthrough on fixed bed(for example inert material)
Fitting the model onbreakthrough Curves
From Isotherms
Calculation from gas velocity,particle size and otherParameters 1,2)
From Uptake rateexperiments?
g
w
U
,h
Heat of adsorption From Isotherms
Dispersion Coefficient
Heat transfer Coefficients Fitting the model onbreakthrough Curves
Experiments on packedbeds (Breakthrough exp.) 3)
Set Zero to simplifyenergy balance
Fitting the model onbreakthrough Curves
30. Mai 2017 Prof. Dr. habil. Reiner Staudt
Breakthrough exp.
Breakthrough exp.
6
Hochschule Offenburg University of Applied Sciences
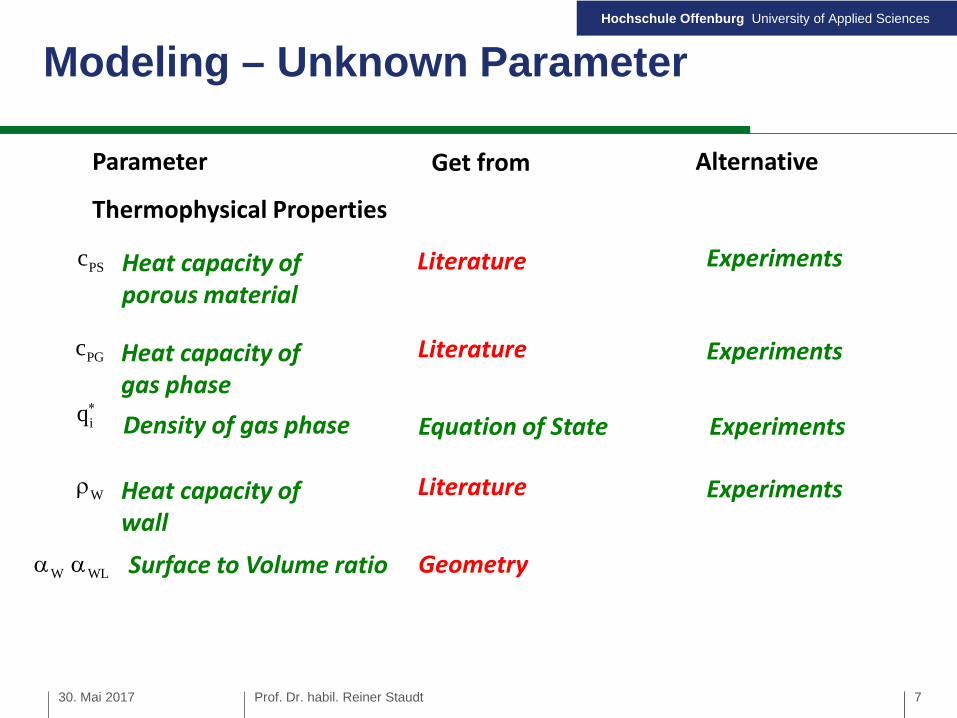
Modeling – Unknown Parameter
Thermophysical Properties
Heat capacity ofgas phase
PGc
PSc Heat capacity ofporous material
iq
Density of gas phase
Parameter Get from Alternative
Literature
Literature
Equation of State
Experiments
Experiments
30. Mai 2017 Prof. Dr. habil. Reiner Staudt
Experiments
Heat capacity ofwall
W
W WL Surface to Volume ratio
Literature
Geometry
Experiments
7
Hochschule Offenburg University of Applied Sciences
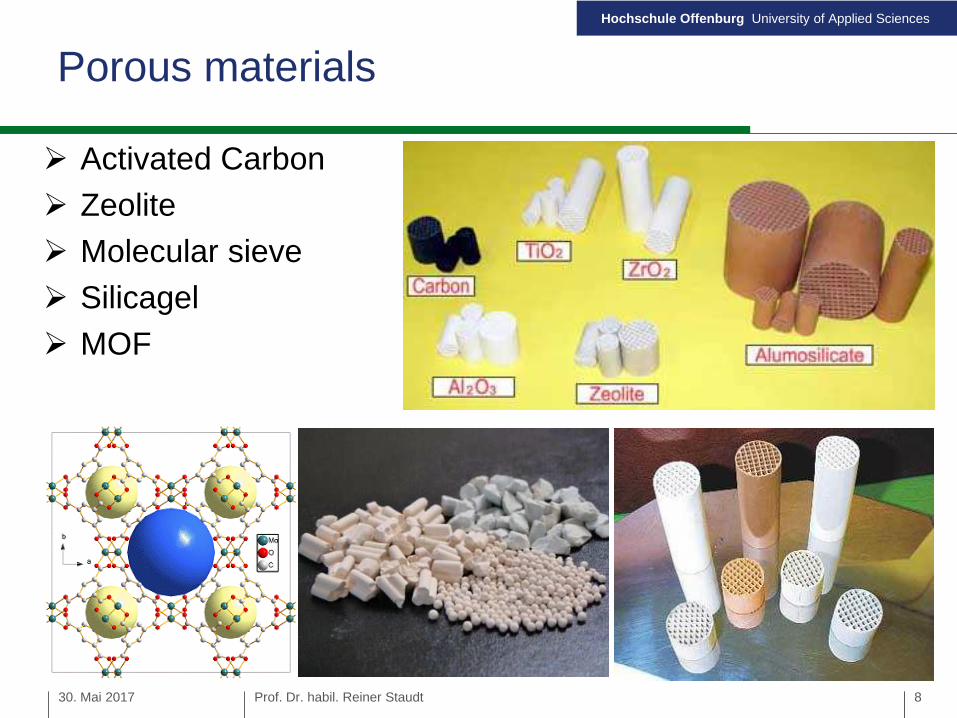
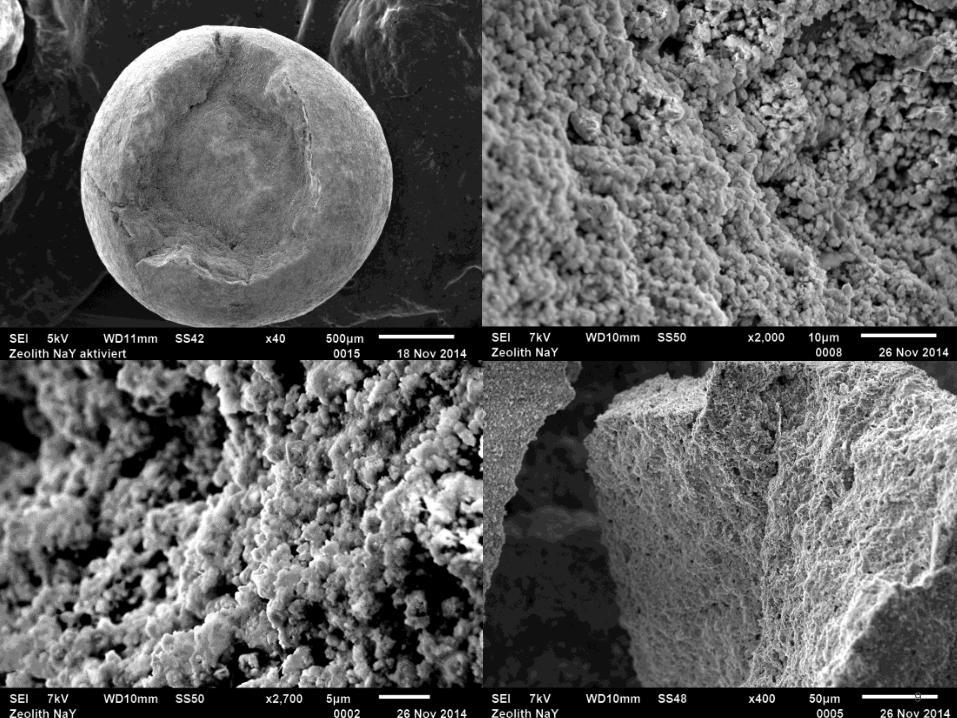
Porous materials
Activated Carbon
Zeolite
Molecular sieve
Silicagel
MOF
30. Mai 2017 Prof. Dr. habil. Reiner Staudt 8
Hochschule Offenburg University of Applied Sciences
30. Mai 2017 Prof. Dr. habil. Reiner Staudt 9
Hochschule Offenburg University of Applied Sciences
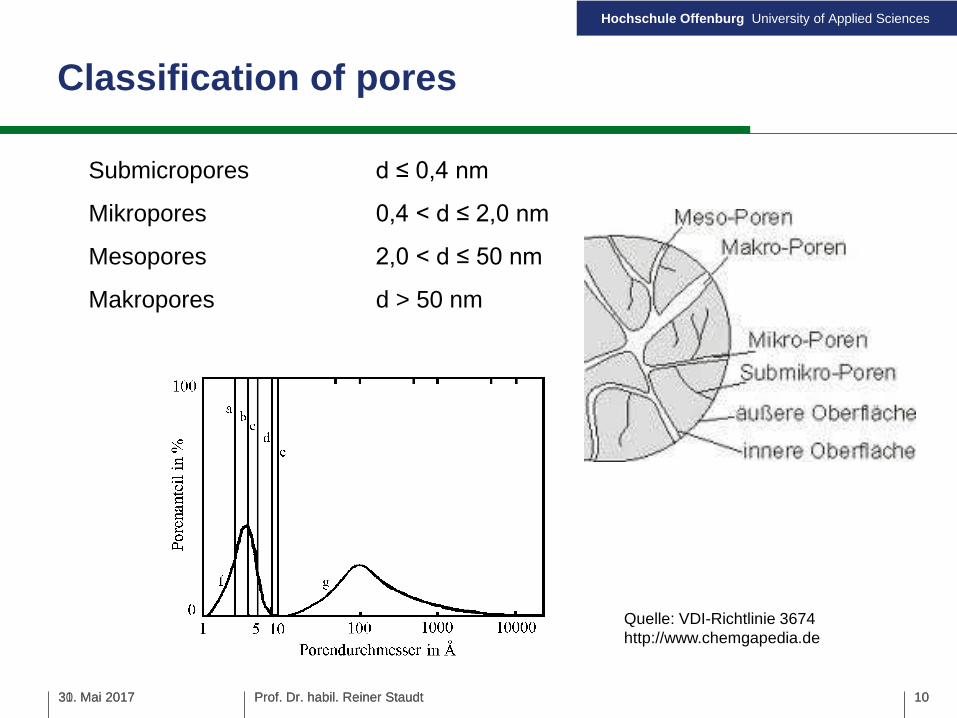
Classification of pores
30. Mai 2017 Prof. Dr. habil. Reiner Staudt
Submicropores d ≤ 0,4 nm
Mikropores 0,4 < d ≤ 2,0 nm
Mesopores 2,0 < d ≤ 50 nm
Makropores d > 50 nm
31. Mai 2017 Prof. Dr. habil. Reiner Staudt 10
Quelle: VDI-Richtlinie 3674http://www.chemgapedia.de
10
Hochschule Offenburg University of Applied Sciences
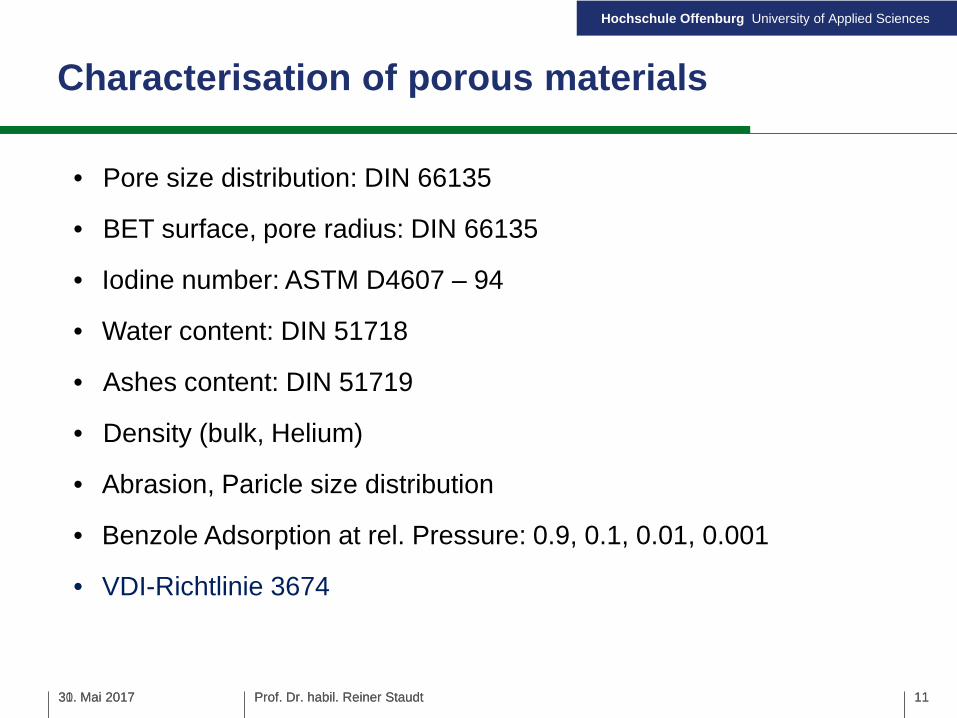
Characterisation of porous materials
30. Mai 2017 Prof. Dr. habil. Reiner Staudt
• Pore size distribution: DIN 66135
• BET surface, pore radius: DIN 66135
• Iodine number: ASTM D4607 – 94
• Water content: DIN 51718
• Ashes content: DIN 51719
• Density (bulk, Helium)
• Abrasion, Paricle size distribution
• Benzole Adsorption at rel. Pressure: 0.9, 0.1, 0.01, 0.001
• VDI-Richtlinie 3674
31. Mai 2017 Prof. Dr. habil. Reiner Staudt 1111
Hochschule Offenburg University of Applied Sciences
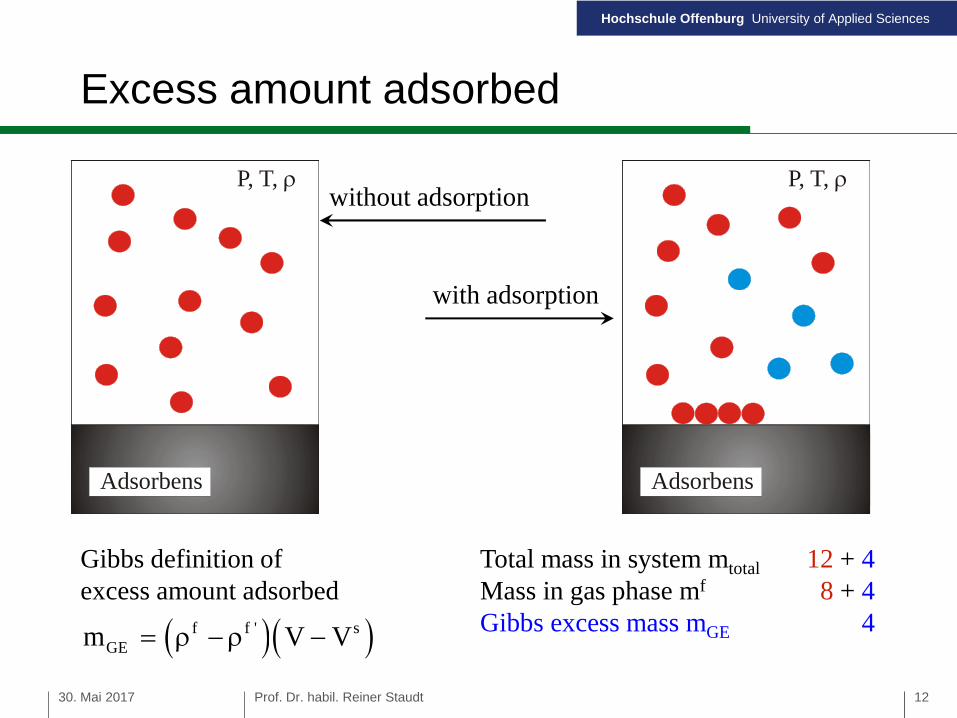
Excess amount adsorbed
Total mass in system mtotal 12 + 4Mass in gas phase mf 8 + 4Gibbs excess mass mGE 4
Adsorbens
P, T, P, T,
Adsorbens
without adsorption
with adsorption
f f ' sGEm V V
Gibbs definition ofexcess amount adsorbed
30. Mai 2017 Prof. Dr. habil. Reiner Staudt 12
Hochschule Offenburg University of Applied Sciences
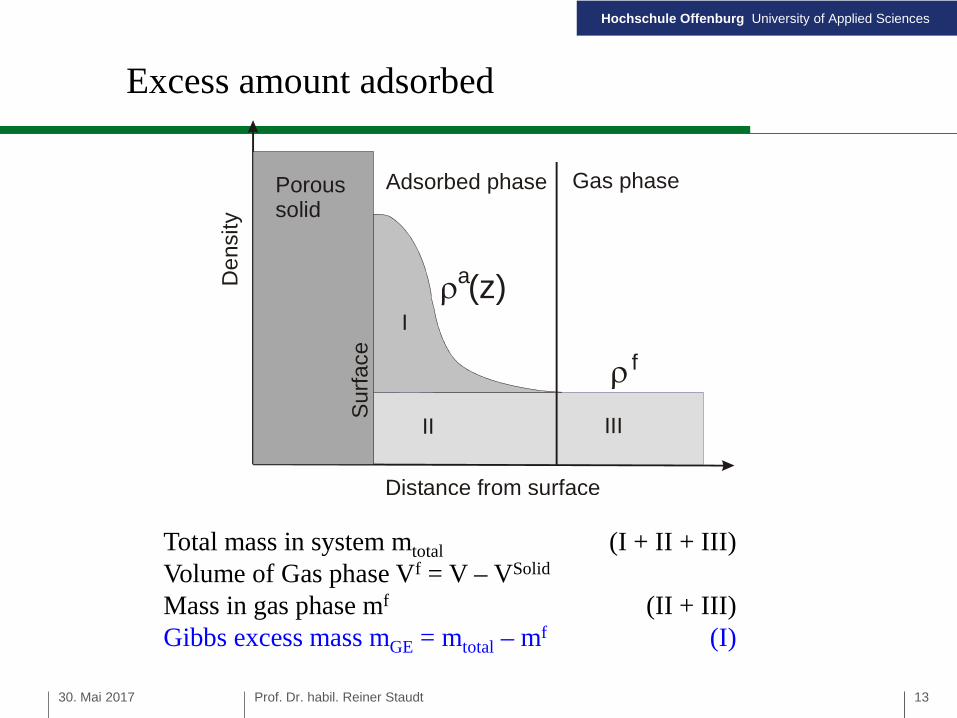
Excess amount adsorbed
Distance from surface
De
nsi
ty
Poroussolid
Surf
ace
f
(z)a
Adsorbed phase Gas phase
I
II III
Total mass in system mtotal (I + II + III)Volume of Gas phase Vf = V – VSolid
Mass in gas phase mf (II + III)Gibbs excess mass mGE = mtotal – mf (I)
30. Mai 2017 Prof. Dr. habil. Reiner Staudt 13
Hochschule Offenburg University of Applied Sciences
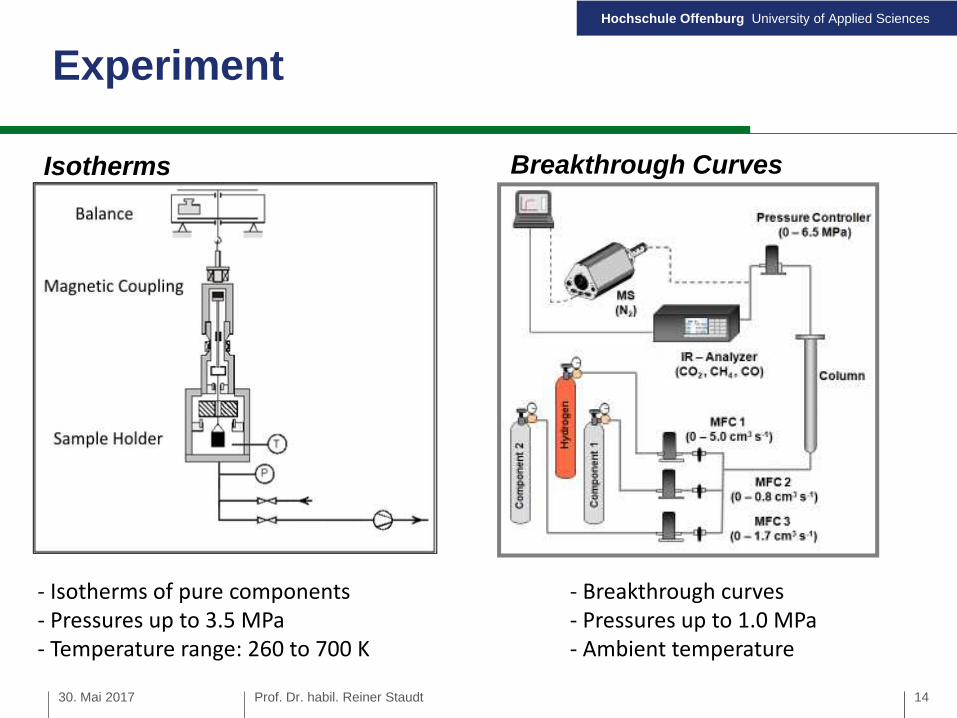
Isotherms
- Isotherms of pure components- Pressures up to 3.5 MPa- Temperature range: 260 to 700 K
Breakthrough Curves
- Breakthrough curves- Pressures up to 1.0 MPa- Ambient temperature
Experiment
30. Mai 2017 Prof. Dr. habil. Reiner Staudt 14
Hochschule Offenburg University of Applied Sciences
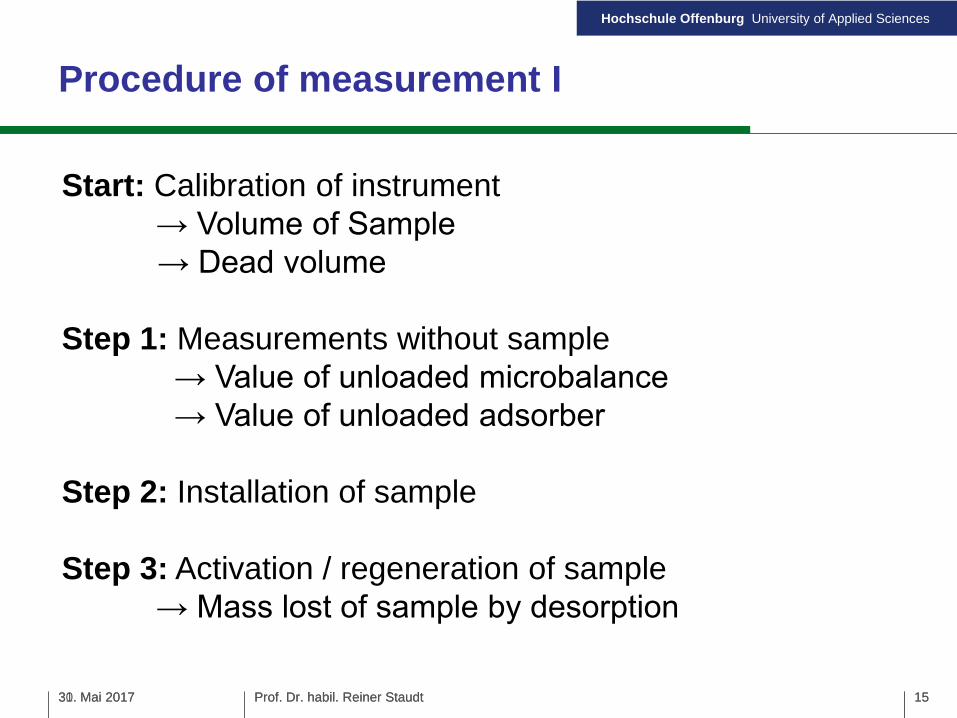
Start: Calibration of instrument→ Volume of Sample→ Dead volume
Step 1: Measurements without sample→ Value of unloaded microbalance→ Value of unloaded adsorber
Step 2: Installation of sample
Step 3: Activation / regeneration of sample→ Mass lost of sample by desorption
Procedure of measurement I
31. Mai 2017 Prof. Dr. habil. Reiner Staudt 1530. Mai 2017 Prof. Dr. habil. Reiner Staudt 15
Hochschule Offenburg University of Applied Sciences
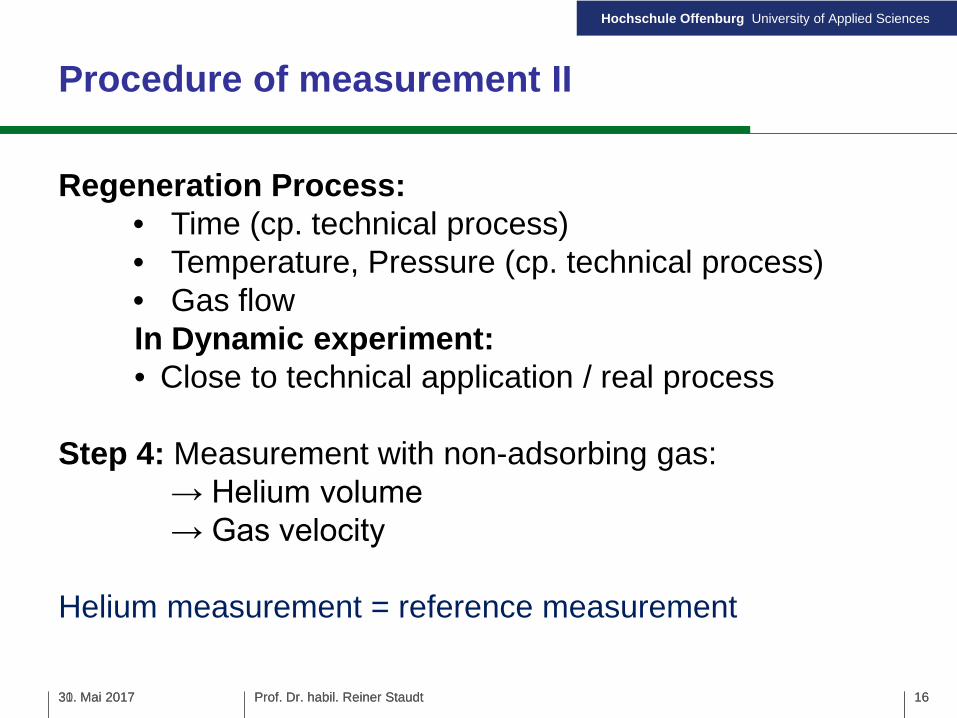
Regeneration Process:• Time (cp. technical process)• Temperature, Pressure (cp. technical process)• Gas flowIn Dynamic experiment:• Close to technical application / real process
Step 4: Measurement with non-adsorbing gas:→ Helium volume→ Gas velocity
Helium measurement = reference measurement
Procedure of measurement II
31. Mai 2017 Prof. Dr. habil. Reiner Staudt 1630. Mai 2017 Prof. Dr. habil. Reiner Staudt 16
Hochschule Offenburg University of Applied Sciences
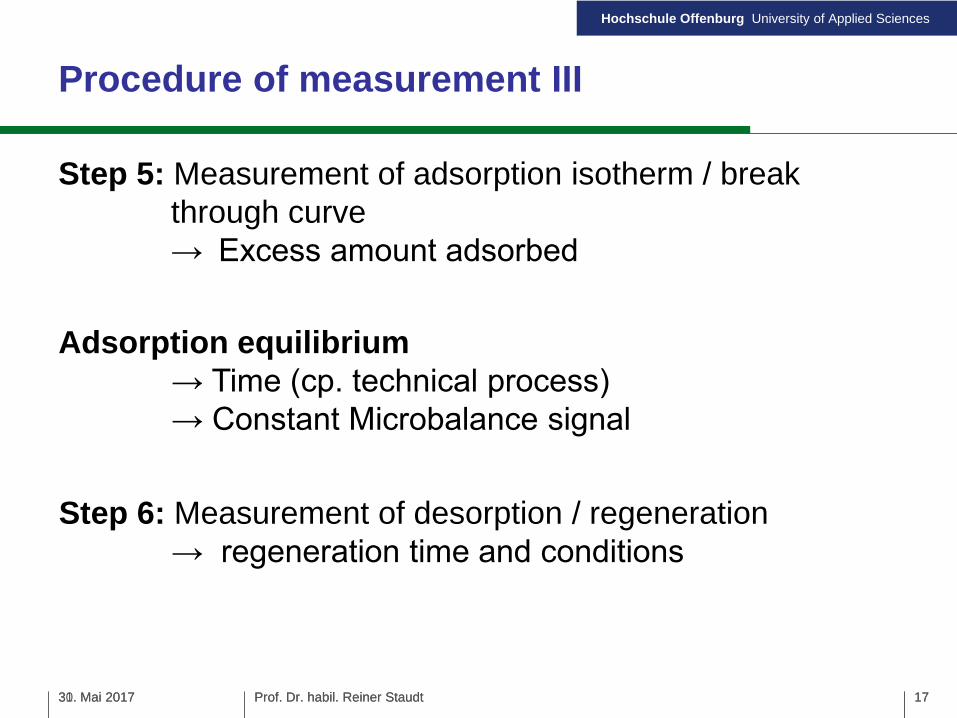
Procedure of measurement III
31. Mai 2017 Prof. Dr. habil. Reiner Staudt 1730. Mai 2017 Prof. Dr. habil. Reiner Staudt
Step 5: Measurement of adsorption isotherm / breakthrough curve→ Excess amount adsorbed
Adsorption equilibrium→ Time (cp. technical process)→ Constant Microbalance signal
17
Step 6: Measurement of desorption / regeneration→ regeneration time and conditions
Hochschule Offenburg University of Applied Sciences
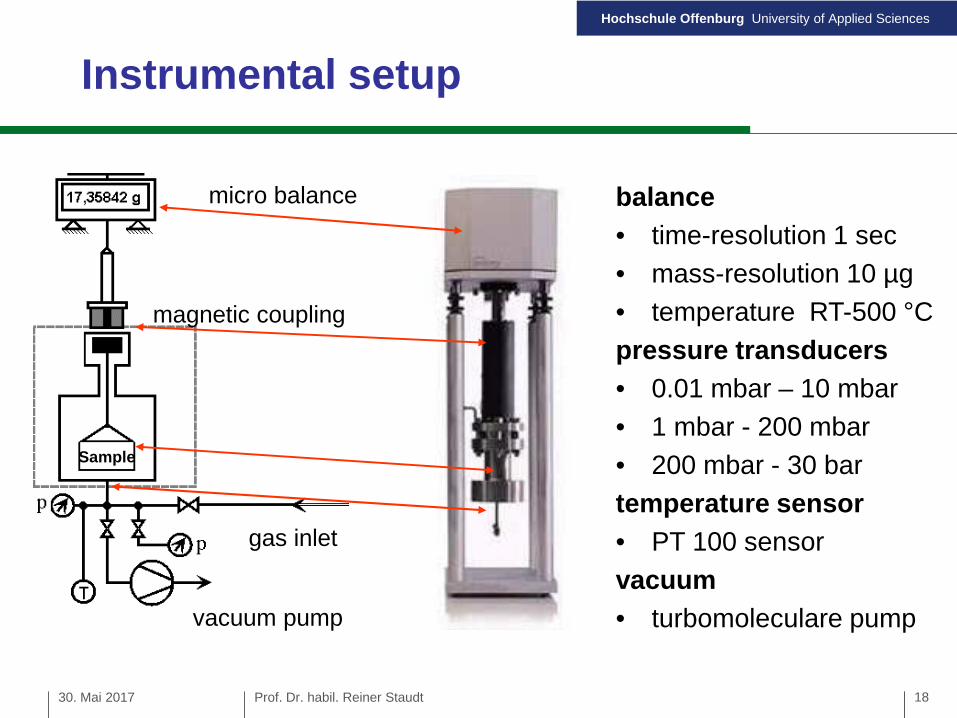
balance
• time-resolution 1 sec
• mass-resolution 10 µg
• temperature RT-500 °C
pressure transducers
• 0.01 mbar – 10 mbar
• 1 mbar - 200 mbar
• 200 mbar - 30 bar
temperature sensor
• PT 100 sensor
vacuum
• turbomoleculare pump
micro balance
magnetic coupling
Sample
vacuum pump
gas inlet
Instrumental setup
30. Mai 2017 Prof. Dr. habil. Reiner Staudt 18
Hochschule Offenburg University of Applied Sciences
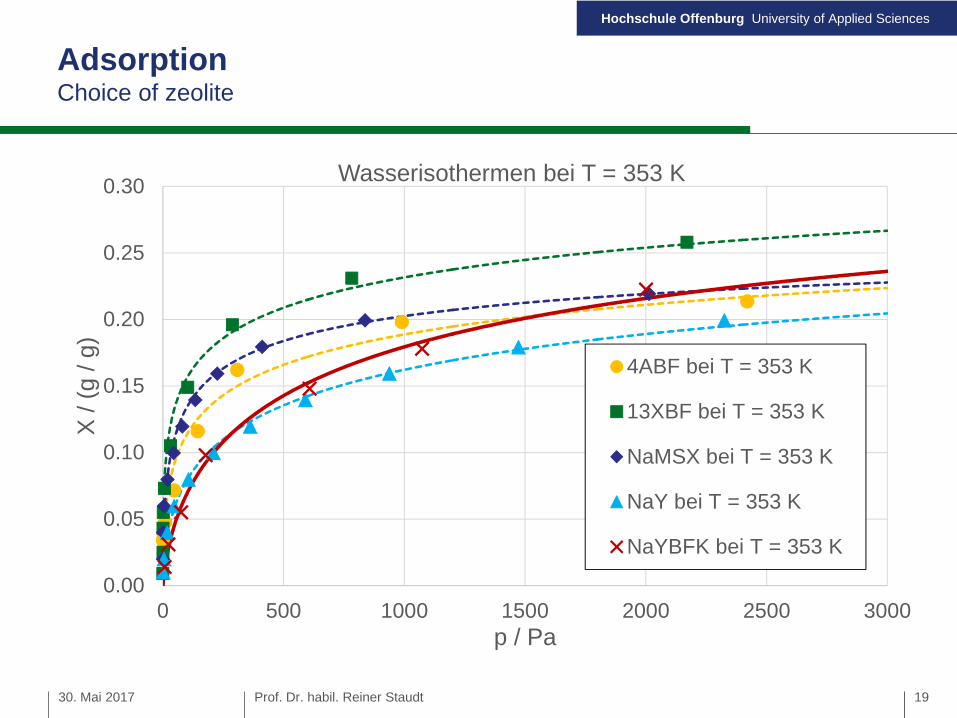
AdsorptionChoice of zeolite
30. Mai 2017 Prof. Dr. habil. Reiner Staudt
0.00
0.05
0.10
0.15
0.20
0.25
0.30
0 500 1000 1500 2000 2500 3000
X/(g
/g)
p / Pa
Wasserisothermen bei T = 353 K
4ABF bei T = 353 K
13XBF bei T = 353 K
NaMSX bei T = 353 K
NaY bei T = 353 K
NaYBFK bei T = 353 K
19
Hochschule Offenburg University of Applied Sciences
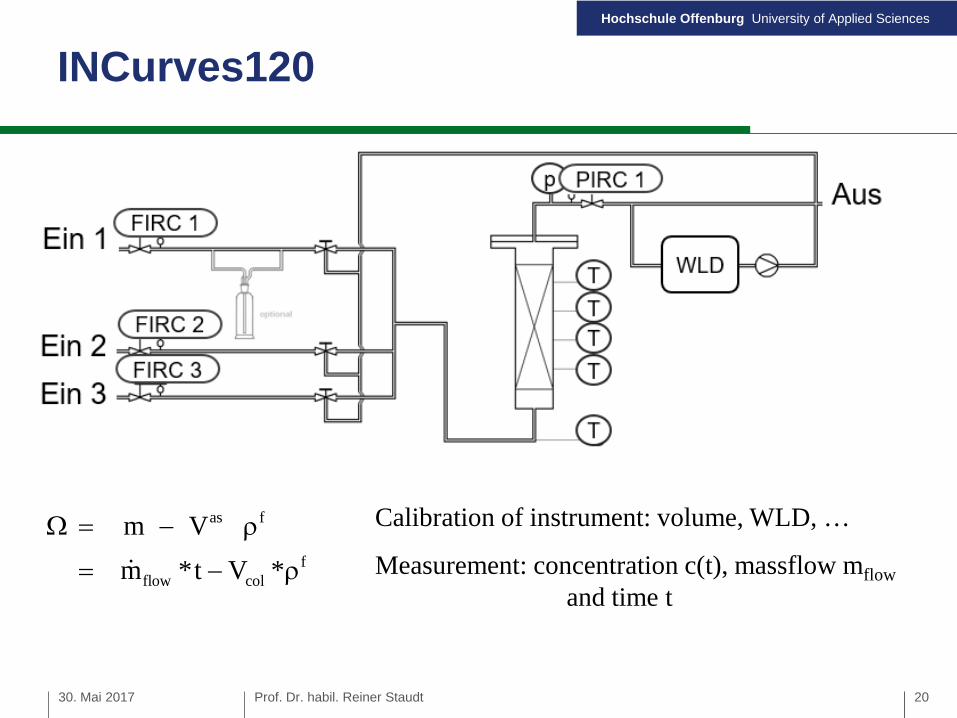
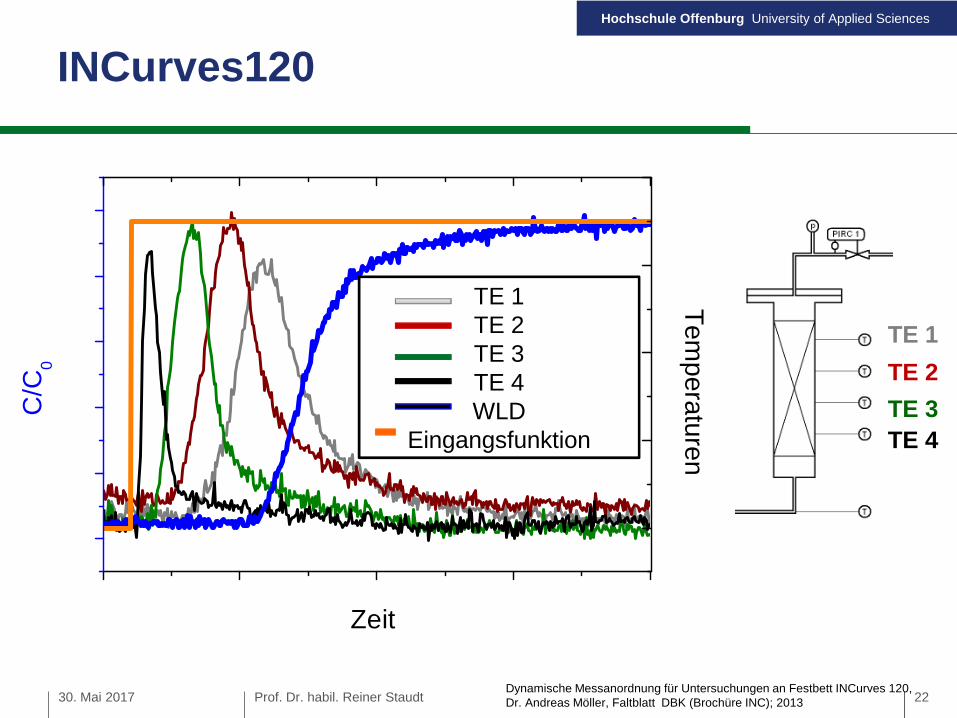
INCurves120
30. Mai 2017 Prof. Dr. habil. Reiner Staudt
as f
fflow col
m V
m *t V *
Calibration of instrument: volume, WLD, …
Measurement: concentration c(t), massflow mflow
and time t
20
Hochschule Offenburg University of Applied Sciences
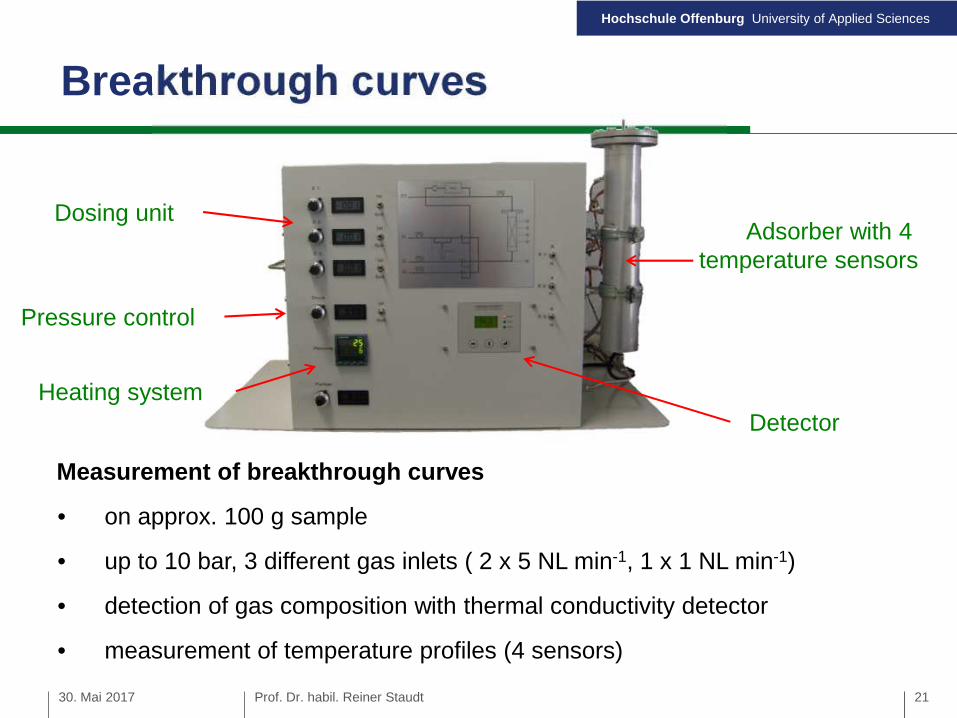
Breakthrough curves
Measurement of breakthrough curves
• on approx. 100 g sample
• up to 10 bar, 3 different gas inlets ( 2 x 5 NL min-1, 1 x 1 NL min-1)
• detection of gas composition with thermal conductivity detector
• measurement of temperature profiles (4 sensors)
Dosing unitAdsorber with 4
temperature sensors
Detector
Pressure control
Heating system
30. Mai 2017 Prof. Dr. habil. Reiner Staudt 21
Hochschule Offenburg University of Applied Sciences
30. Mai 2017 Prof. Dr. habil. Reiner Staudt
TE 1TE 2TE 3TE 4WLD-SignalGaseingangsfunktion
Zeit
C/C
0
Tem
pera
ture
nTE 1TE 2TE 3TE 4WLD
Eingangsfunktion
TE 2
TE 1
TE 3
TE 4
Dynamische Messanordnung für Untersuchungen an Festbett INCurves 120,Dr. Andreas Möller, Faltblatt DBK (Brochüre INC); 2013
INCurves120
22
Hochschule Offenburg University of Applied Sciences
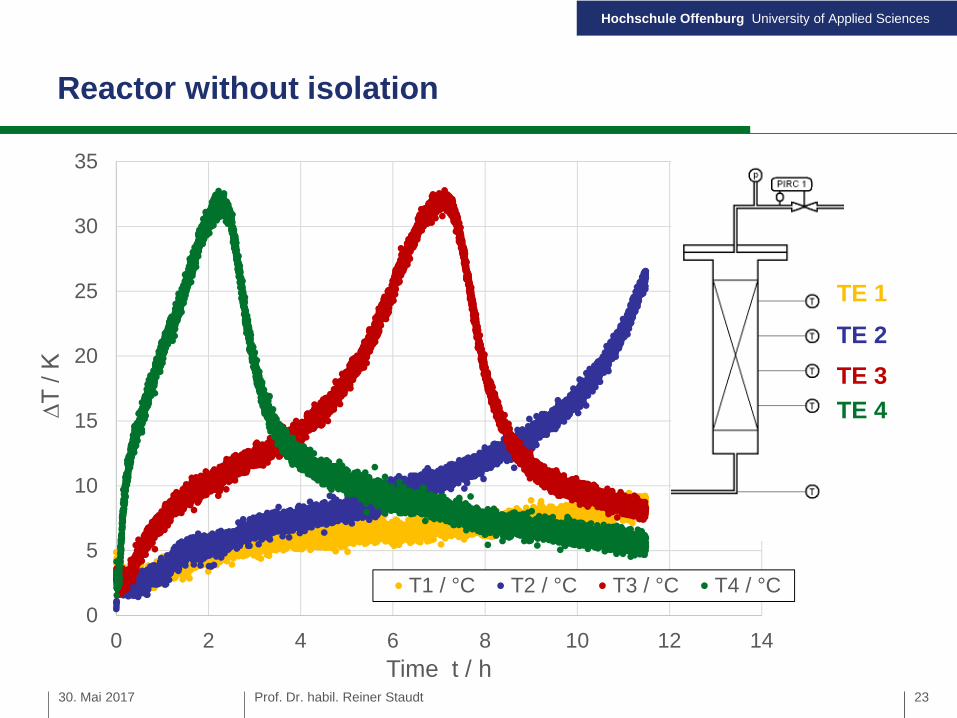
Reactor without isolation
30. Mai 2017
0
5
10
15
20
25
30
35
0 2 4 6 8 10 12 14
∆T
/ K
Time t / h
T1 / °C T2 / °C T3 / °C T4 / °C
TE 2
TE 1
TE 3
TE 4
Prof. Dr. habil. Reiner Staudt 23
Hochschule Offenburg University of Applied Sciences
30. Mai 2017 Prof. Dr. habil. Reiner Staudt
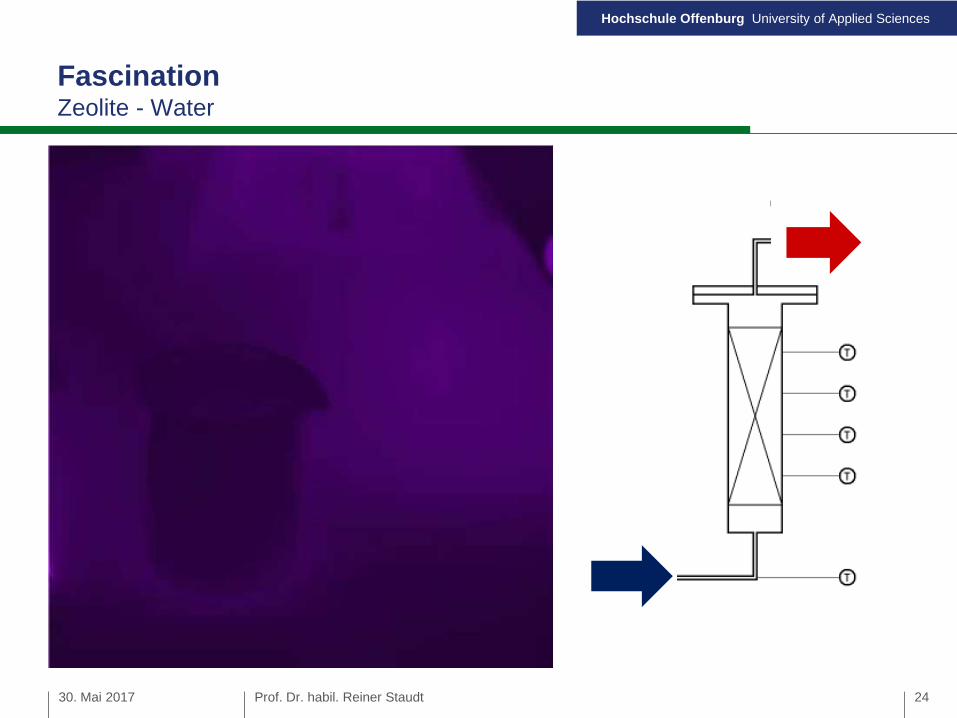
FascinationZeolite - Water
24
Hochschule Offenburg University of Applied Sciences
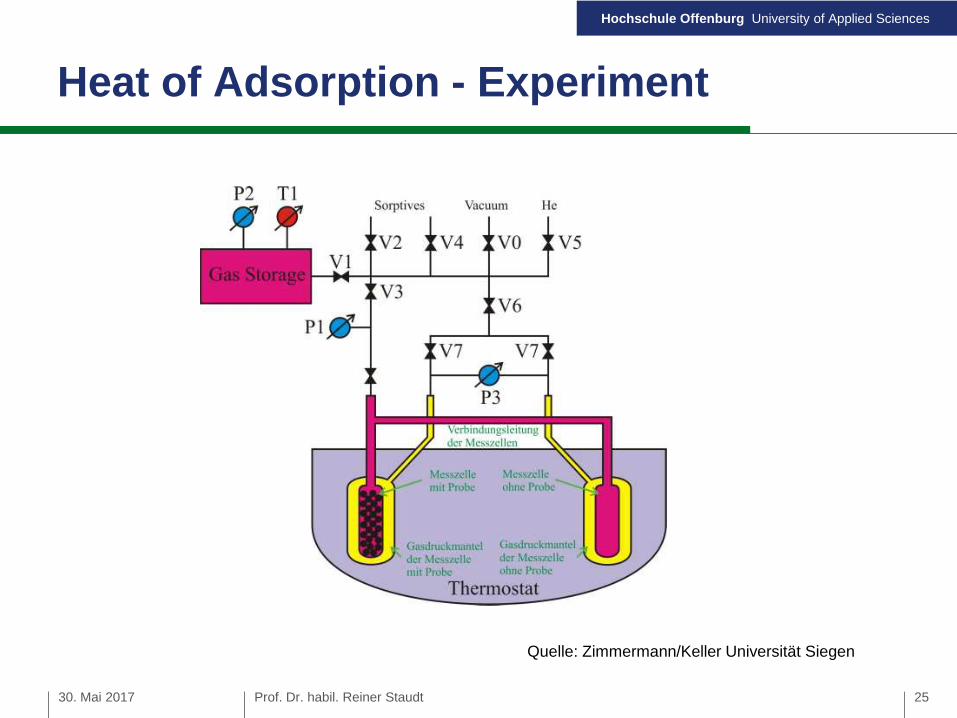
Heat of Adsorption - Experiment
30. Mai 2017 Prof. Dr. habil. Reiner Staudt
Quelle: Zimmermann/Keller Universität Siegen
25
Hochschule Offenburg University of Applied Sciences
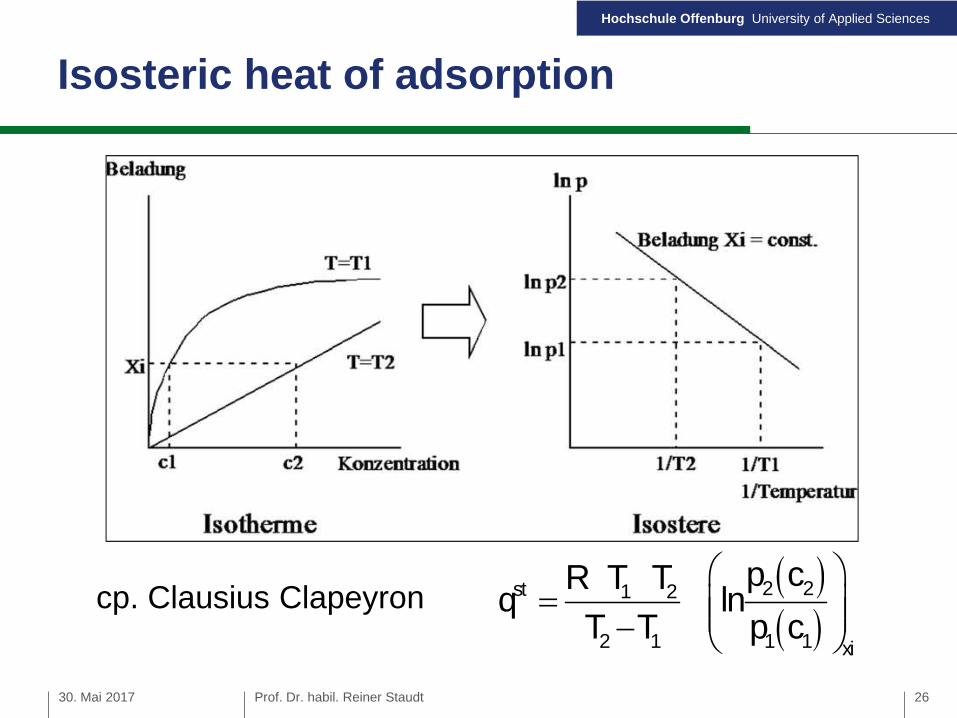
Isosteric heat of adsorption
30. Mai 2017 Prof. Dr. habil. Reiner Staudt 26
2 2st 1 2
2 1 1 1 xi
p cR T Tq ln
T T p c
cp. Clausius Clapeyron
Hochschule Offenburg University of Applied Sciences
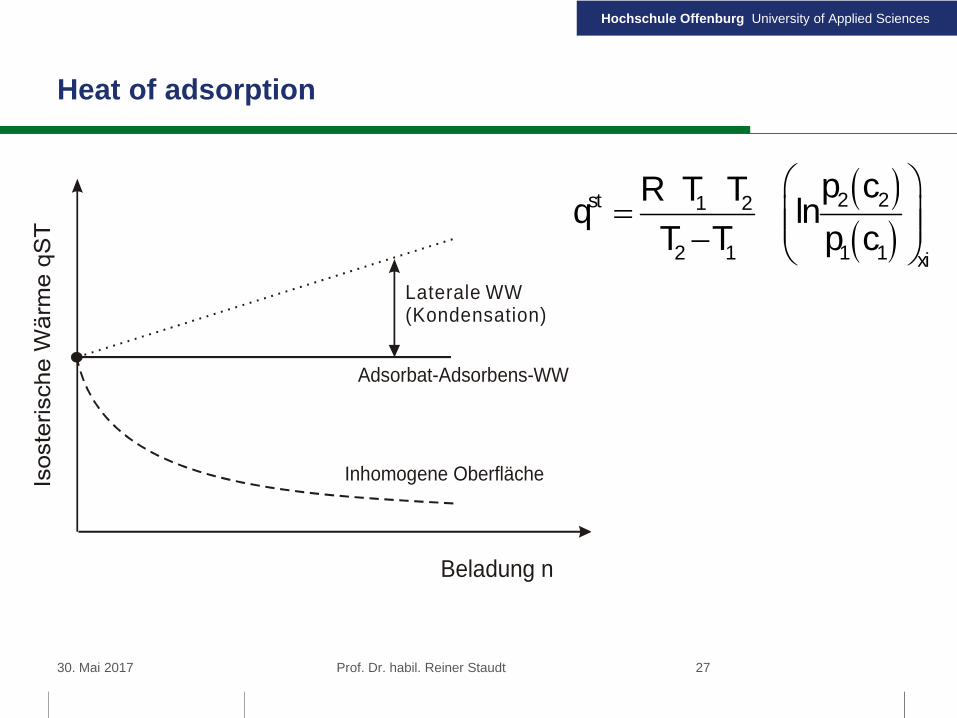
Heat of adsorption
Beladung n
Adsorbat-Adsorbens-WW
Laterale WW(Kondensation)
Inhomogene Oberfläche
2 2st 1 2
2 1 1 1 xi
p cR T Tq ln
T T p c
30. Mai 2017 Prof. Dr. habil. Reiner Staudt 27
Hochschule Offenburg University of Applied Sciences
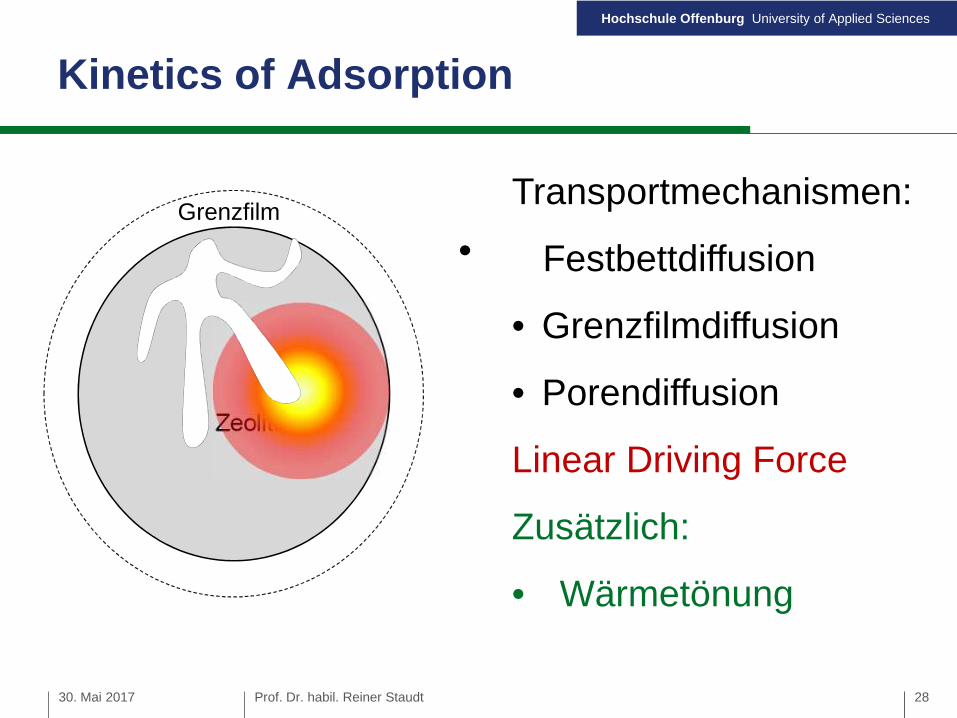
Zeolith
GrenzfilmTransportmechanismen:
Festbettdiffusion
• Grenzfilmdiffusion
• Porendiffusion
Linear Driving Force
Zusätzlich:
• Wärmetönung
Kinetics of Adsorption
30. Mai 2017 Prof. Dr. habil. Reiner Staudt 28
Hochschule Offenburg University of Applied Sciences
30. Mai 2017
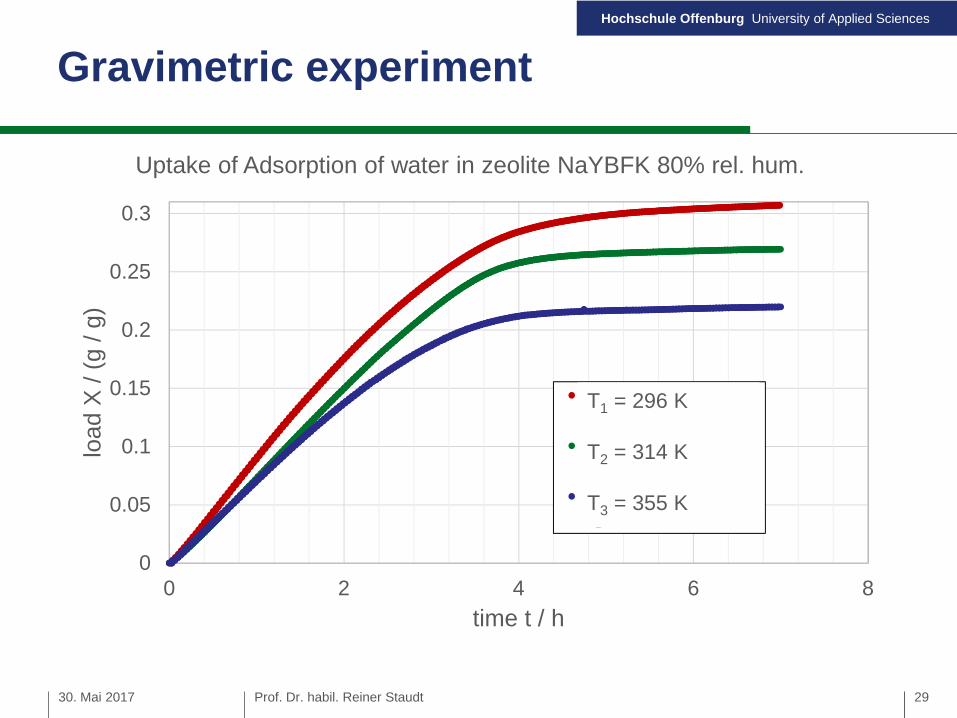
Gravimetric experiment
0
0.05
0.1
0.15
0.2
0.25
0.3
0 2 4 6 8
load
X/(g
/g)
time t / h
Uptake of Adsorption of water in zeolite NaYBFK 80% rel. hum.
T1 = 23,07621019°CT2 = 41,37786062°CT3 = 61,88455312°C
T1 = 296 K
T2 = 314 K
T3 = 355 K
Prof. Dr. habil. Reiner Staudt 29
Hochschule Offenburg University of Applied Sciences
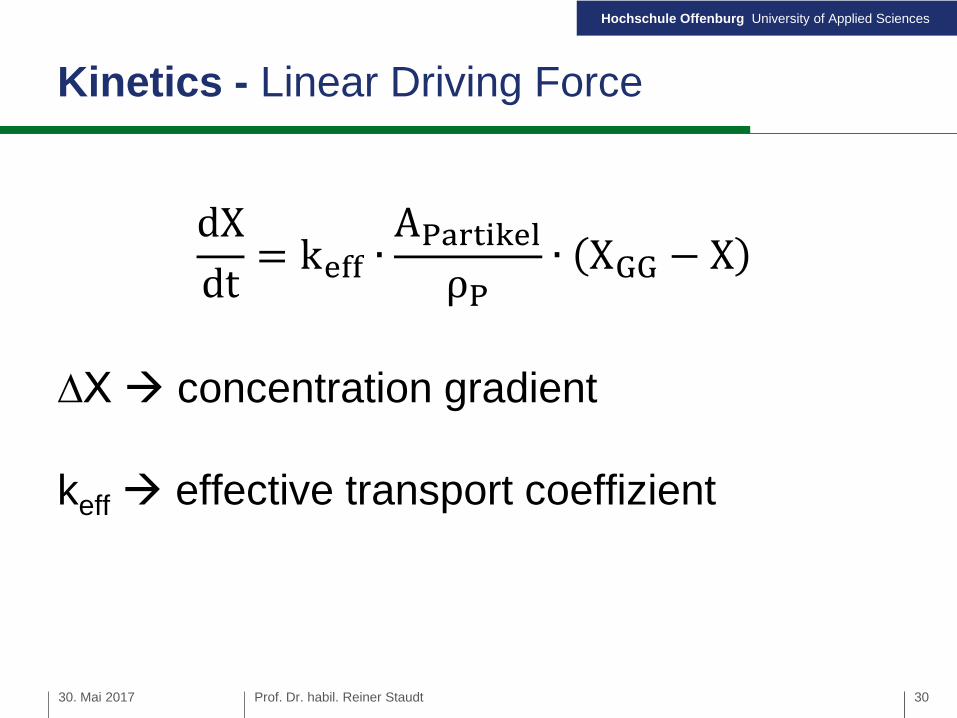
Kinetics - Linear Driving Force
∆X concentration gradient
keff effective transport coeffizient
30. Mai 2017 Prof. Dr. habil. Reiner Staudt 30
Hochschule Offenburg University of Applied Sciences
0
1
2
3
4
5
6
0 20 40 60 80 100
gas
com
positio
non
adsorb
er
exi
t/V
ol.%
time /min
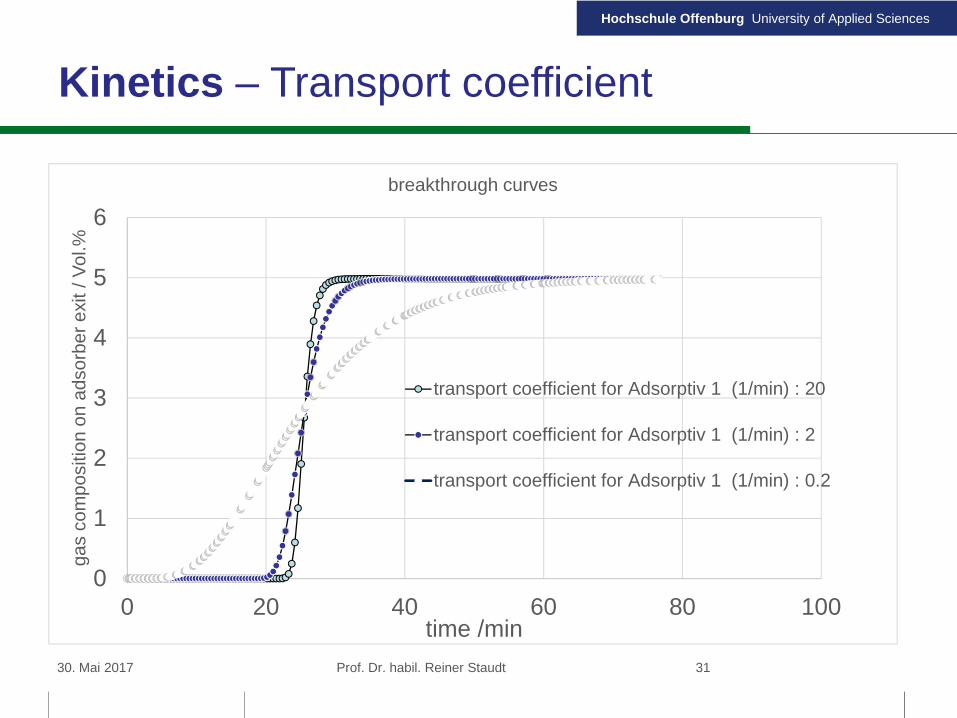
breakthrough curves
transport coefficient for Adsorptiv 1 (1/min) : 20
transport coefficient for Adsorptiv 1 (1/min) : 2
transport coefficient for Adsorptiv 1 (1/min) : 0.2
Kinetics – Transport coefficient
30. Mai 2017 Prof. Dr. habil. Reiner Staudt 31
Hochschule Offenburg University of Applied Sciences
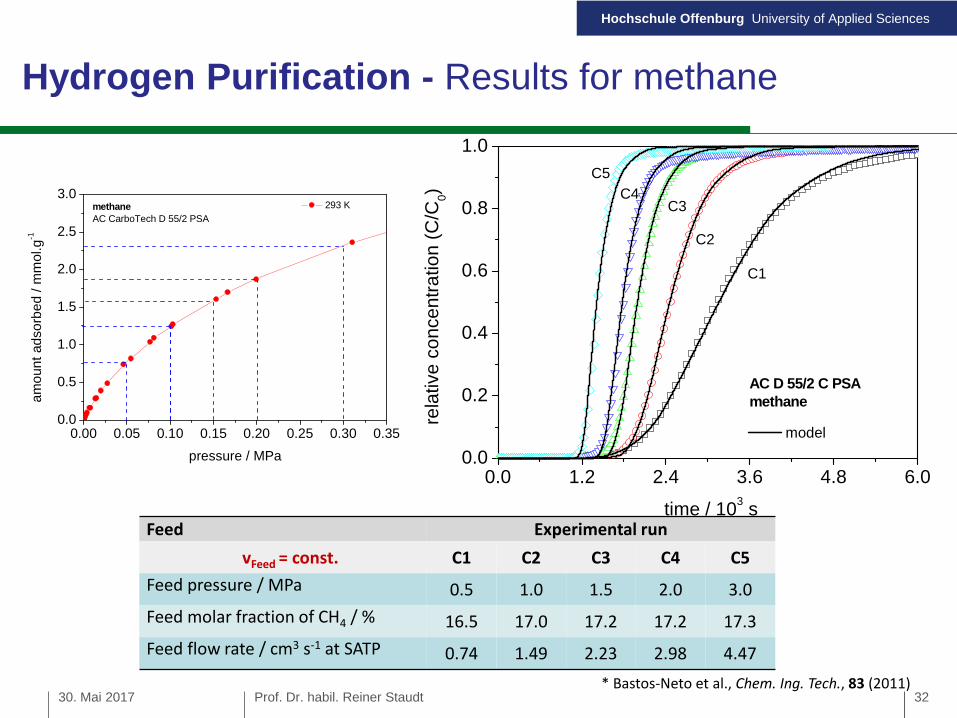
* Bastos-Neto et al., Chem. Ing. Tech., 83 (2011)
0.0 1.2 2.4 3.6 4.8 6.00.0
0.2
0.4
0.6
0.8
1.0
AC D 55/2 C PSAmethane
C5
model
C1
C4
C2
C3
rela
tive
co
nce
ntr
atio
n(C
/C0)
time / 103
s
Hydrogen Purification - Results for methane
Feed Experimental run
vFeed = const. C1 C2 C3 C4 C5
Feed pressure / MPa 0.5 1.0 1.5 2.0 3.0
Feed molar fraction of CH4 / % 16.5 17.0 17.2 17.2 17.3
Feed flow rate / cm3 s-1 at SATP 0.74 1.49 2.23 2.98 4.47
0.00 0.05 0.10 0.15 0.20 0.25 0.30 0.350.0
0.5
1.0
1.5
2.0
2.5
3.0293 K
am
oun
tad
so
rbe
d/
mm
ol.g
-1
pressure / MPa
methaneAC CarboTech D 55/2 PSA
30. Mai 2017 Prof. Dr. habil. Reiner Staudt 32
Hochschule Offenburg University of Applied Sciences
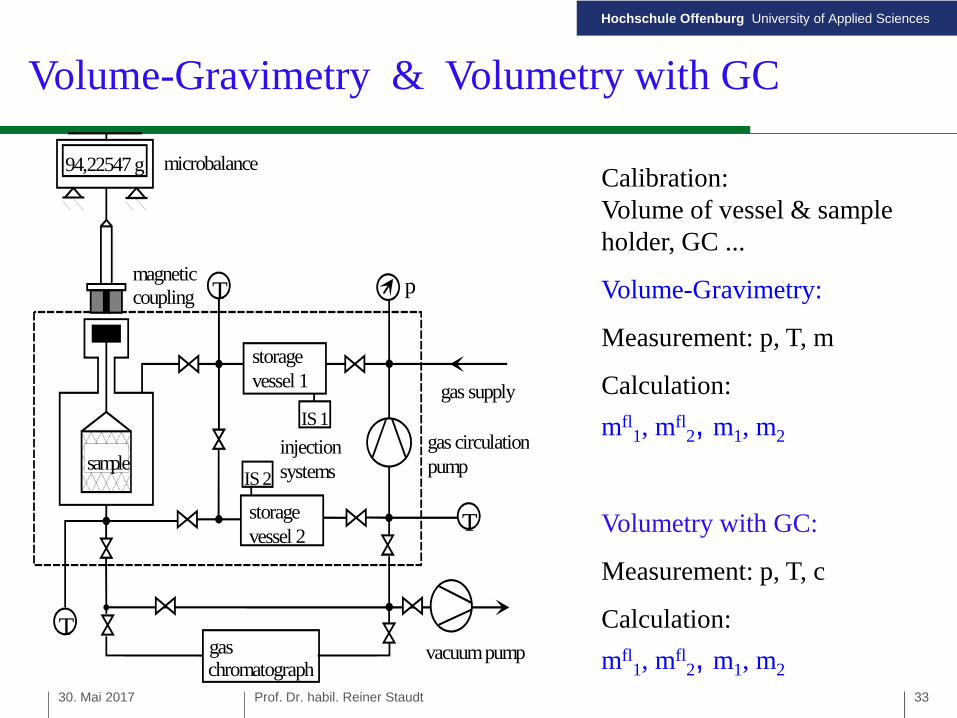
94,22547 g
T
T p
gas supply
vacuumpump
gas circulationpump
storagevessel 1
storagevessel 2
microbalance
sample
T
gaschromatograph
magneticcoupling
IS 1
IS 2
injectionsystems
Calibration:Volume of vessel & sampleholder, GC ...
Volume-Gravimetry:
Measurement: p, T, m
Calculation:
mfl1, mfl
2, m1, m2
Volumetry with GC:
Measurement: p, T, c
Calculation:
mfl1, mfl
2, m1, m2
Volume-Gravimetry & Volumetry with GC
30. Mai 2017 Prof. Dr. habil. Reiner Staudt 33
Hochschule Offenburg University of Applied Sciences
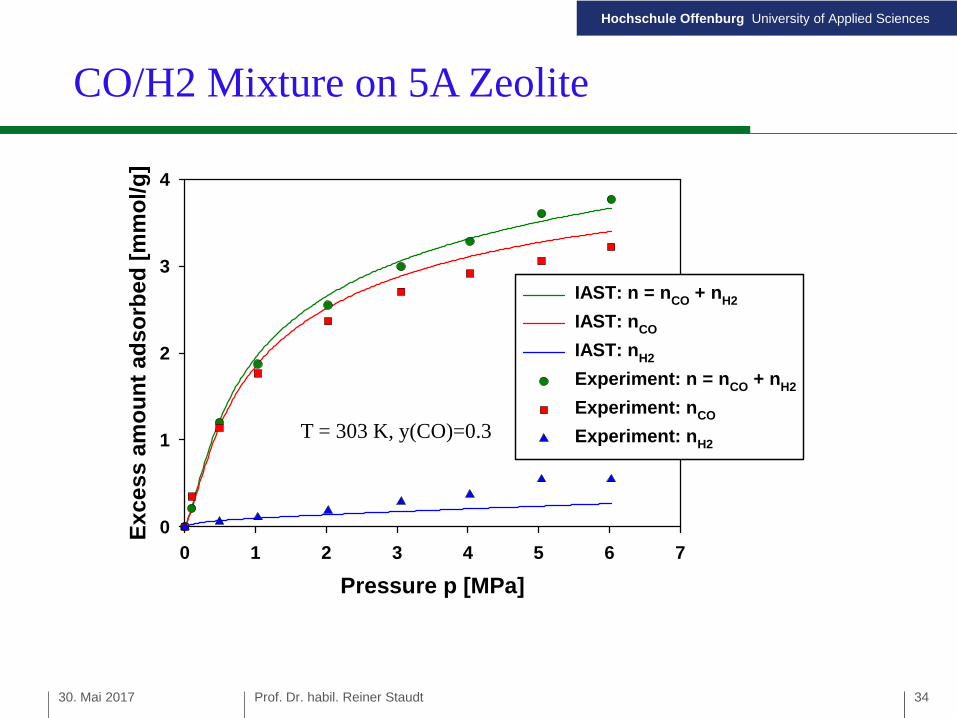
CO/H2 Mixture on 5A Zeolite
Pressure p [MPa]
0 1 2 3 4 5 6 7
Ex
ce
ss
am
ou
nt
ad
so
rbe
d[m
mo
l/g
]
0
1
2
3
4
IAST: n = nCO + nH2
IAST: nCO
IAST: nH2
Experiment: n = nCO + nH2
Experiment: nCO
Experiment: nH2
30. Mai 2017 Prof. Dr. habil. Reiner Staudt
T = 303 K, y(CO)=0.3
34
Hochschule Offenburg University of Applied Sciences
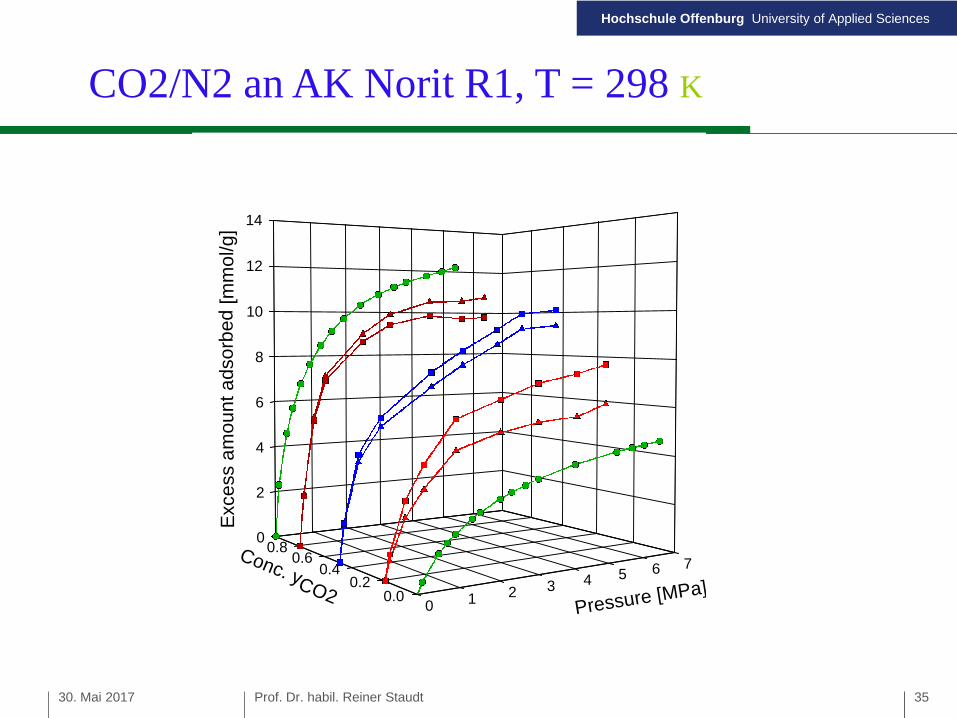
CO2/N2 an AK Norit R1, T = 298 K
0
2
4
6
8
10
12
14
0 1 2 3 4 5 6 7
0.00.2
0.40.6
0.8
Exc
ess
am
ou
nta
dso
rbed
[mm
ol/g]
Pressure [MPa]
Conc. yCO2
30. Mai 2017 Prof. Dr. habil. Reiner Staudt 35
Hochschule Offenburg University of Applied Sciences
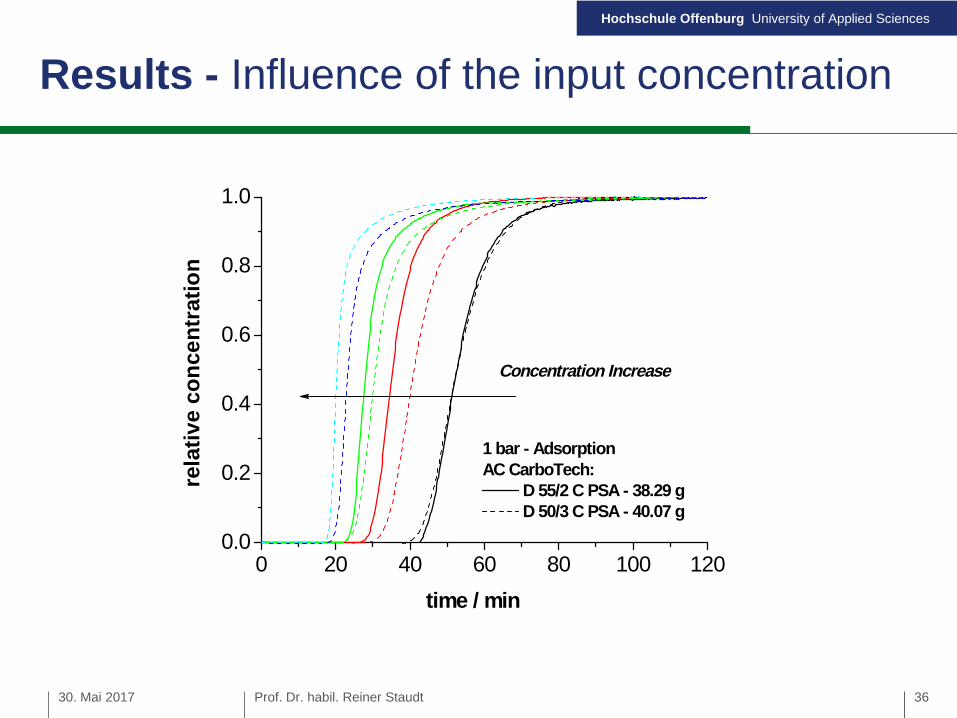
Results - Influence of the input concentration
0 20 40 60 80 100 1200.0
0.2
0.4
0.6
0.8
1.0
time / min
rela
tiv
eco
nce
ntr
ati
on
1 bar - AdsorptionAC CarboTech:
D 55/2 C PSA - 38.29 gD 50/3 C PSA - 40.07 g
Concentration Increase
30. Mai 2017 Prof. Dr. habil. Reiner Staudt 36
Hochschule Offenburg University of Applied Sciences
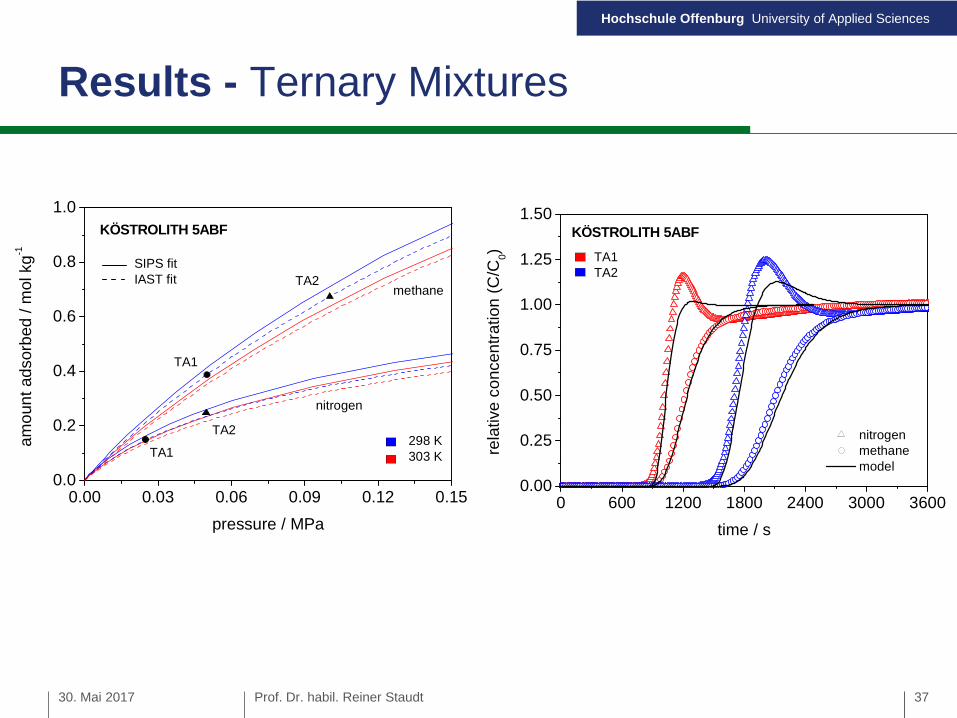
Results - Ternary Mixtures
0 600 1200 1800 2400 3000 36000.00
0.25
0.50
0.75
1.00
1.25
1.50
nitrogenmethanemodel
KÖSTROLITH 5ABF
rela
tive
co
ncen
tration
(C/C
0)
time / s
TA1TA2
0.00 0.03 0.06 0.09 0.12 0.150.0
0.2
0.4
0.6
0.8
1.0
TA2
TA2
TA1
KÖSTROLITH 5ABF
nitrogen
am
oun
tad
sorb
ed
/m
olkg
-1
pressure / MPa
SIPS fitIAST fit
298 K303 K
methane
TA1
30. Mai 2017 Prof. Dr. habil. Reiner Staudt 37
Hochschule Offenburg University of Applied Sciences
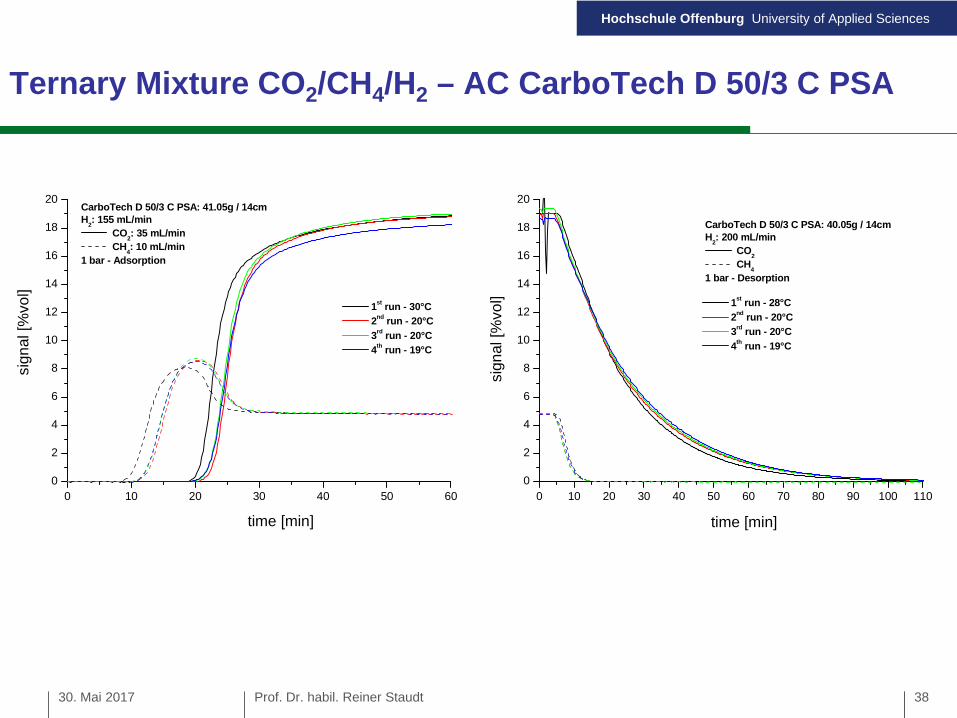
Ternary Mixture CO2/CH4/H2 – AC CarboTech D 50/3 C PSA
0 10 20 30 40 50 60
0
2
4
6
8
10
12
14
16
18
20
time [min]
sig
nal[%
vo
l]
CarboTech D 50/3 C PSA: 41.05g / 14cmH
2: 155 mL/min
CO2: 35 mL/min
CH4: 10 mL/min
1 bar - Adsorption
1st
run - 30°C
2nd
run - 20°C
3rd
run - 20°C
4th
run - 19°C
0 10 20 30 40 50 60 70 80 90 100 110
0
2
4
6
8
10
12
14
16
18
20
time [min]
sig
nal[%
vo
l] 1st
run - 28°C
2nd
run - 20°C
3rd
run - 20°C
4th
run - 19°C
CarboTech D 50/3 C PSA: 40.05g / 14cmH
2: 200 mL/min
CO2
CH4
1 bar - Desorption
30. Mai 2017 Prof. Dr. habil. Reiner Staudt 38
Hochschule Offenburg University of Applied Sciences
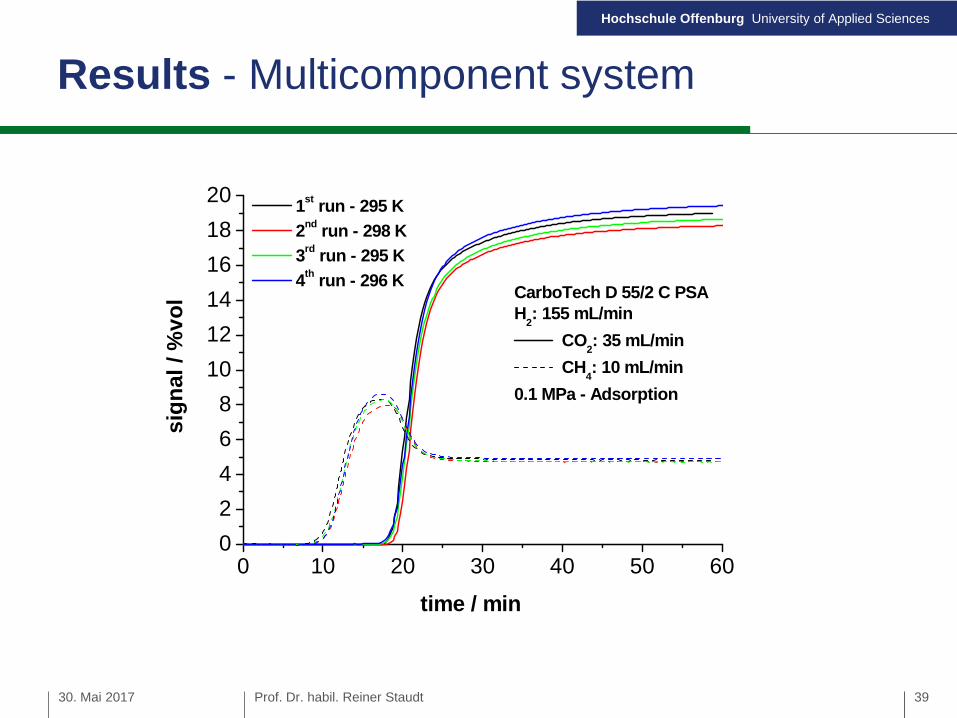
Results - Multicomponent system
0 10 20 30 40 50 600
2
4
6
8
10
12
14
16
18
20
time / min
sig
na
l/
%v
ol
1st
run - 295 K
2nd
run - 298 K
3rd
run - 295 K
4th
run - 296 KCarboTech D 55/2 C PSAH
2: 155 mL/min
CO2: 35 mL/min
CH4: 10 mL/min
0.1 MPa - Adsorption
30. Mai 2017 Prof. Dr. habil. Reiner Staudt 39
Hochschule Offenburg University of Applied Sciences
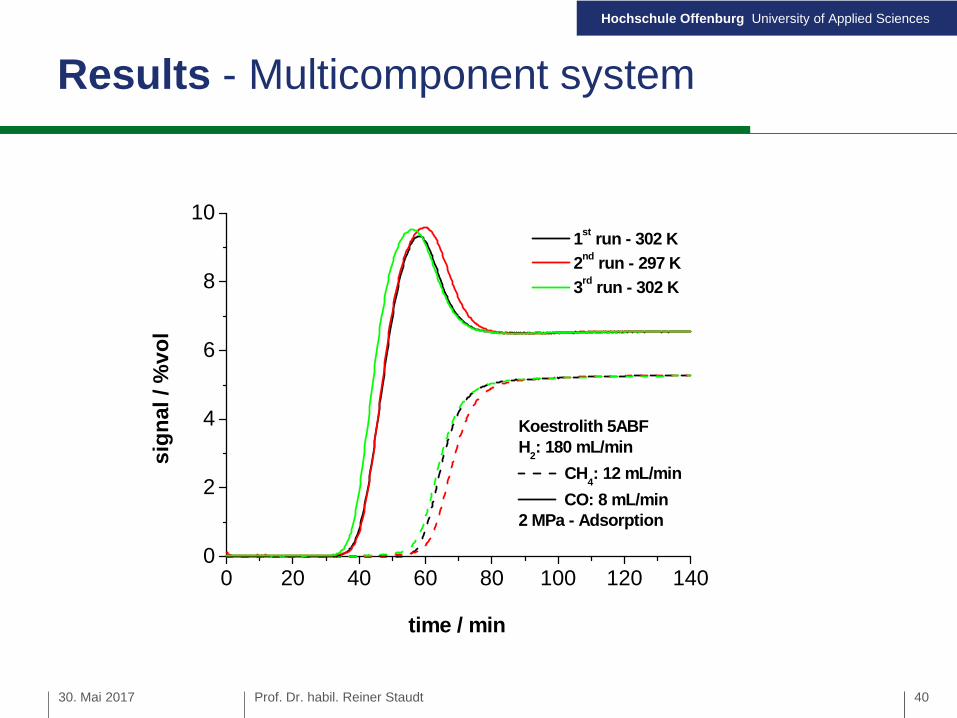
0 20 40 60 80 100 120 1400
2
4
6
8
10
sig
nal
/%
vo
l
time / min
1st
run - 302 K
2nd
run - 297 K
3rd
run - 302 K
Koestrolith 5ABFH
2: 180 mL/min
CH4: 12 mL/min
CO: 8 mL/min2 MPa - Adsorption
30. Mai 2017 Prof. Dr. habil. Reiner Staudt
Results - Multicomponent system
40
Hochschule Offenburg University of Applied Sciences
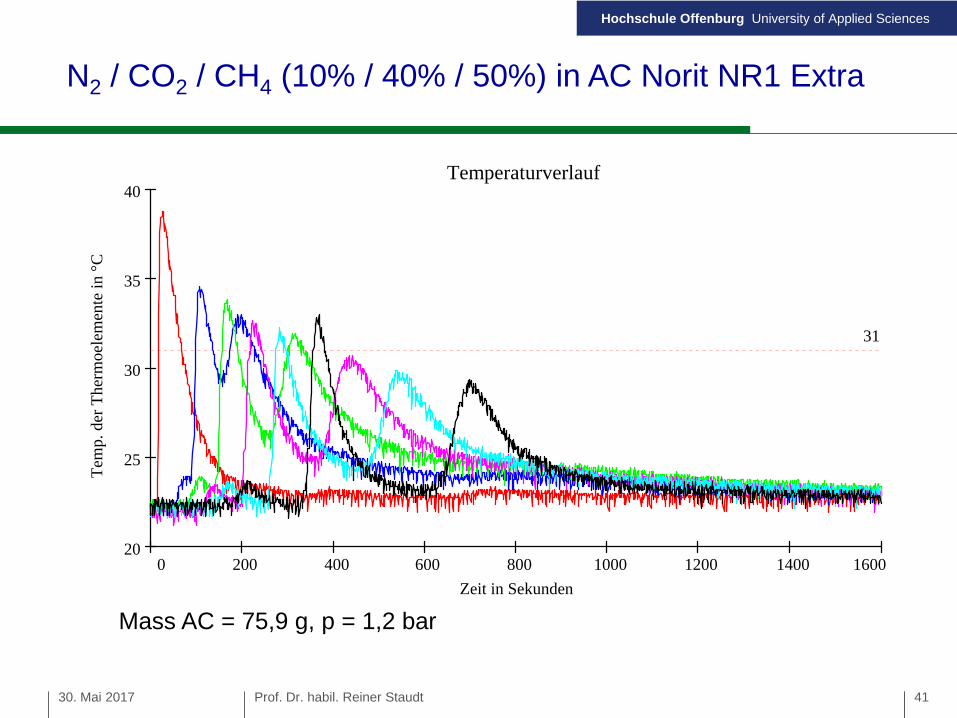
0 200 400 600 800 1000 1200 1400 160020
25
30
35
40Temperaturverlauf
Zeit in Sekunden
Tem
p.d
erT
herm
oele
men
tein
°C
31
N2 / CO2 / CH4 (10% / 40% / 50%) in AC Norit NR1 Extra
Mass AC = 75,9 g, p = 1,2 bar
30. Mai 2017 Prof. Dr. habil. Reiner Staudt 41
Hochschule Offenburg University of Applied Sciences
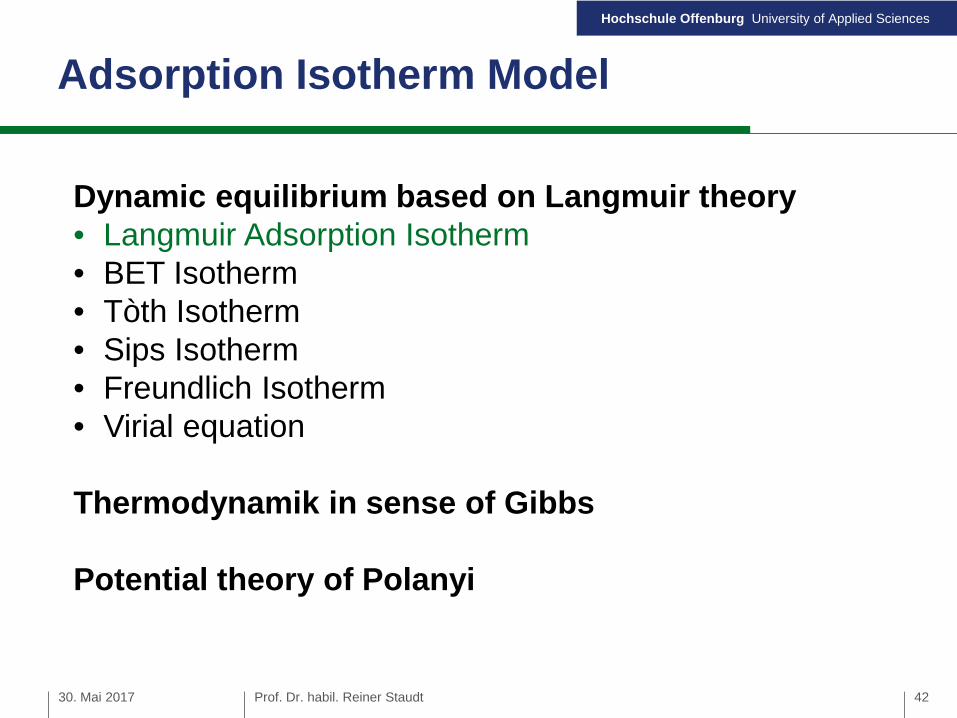
Adsorption Isotherm Model
30. Mai 2017 Prof. Dr. habil. Reiner Staudt
Dynamic equilibrium based on Langmuir theory• Langmuir Adsorption Isotherm• BET Isotherm• Tòth Isotherm• Sips Isotherm• Freundlich Isotherm• Virial equation
Thermodynamik in sense of Gibbs
Potential theory of Polanyi
42
Hochschule Offenburg University of Applied Sciences
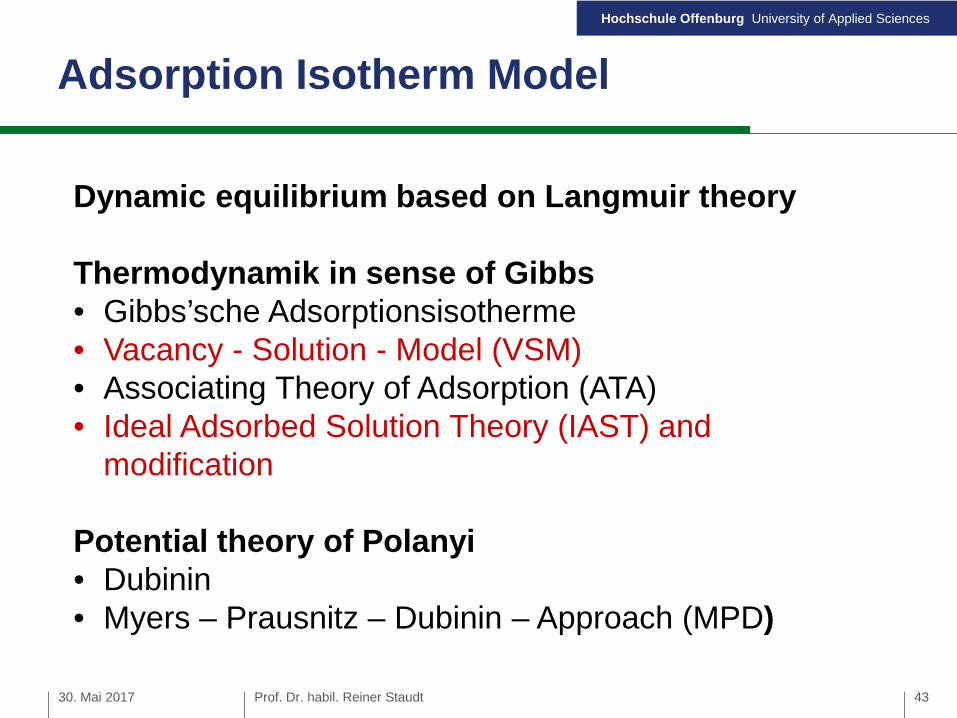
Adsorption Isotherm Model
30. Mai 2017 Prof. Dr. habil. Reiner Staudt
Dynamic equilibrium based on Langmuir theory
Thermodynamik in sense of Gibbs• Gibbs’sche Adsorptionsisotherme• Vacancy - Solution - Model (VSM)• Associating Theory of Adsorption (ATA)• Ideal Adsorbed Solution Theory (IAST) and
modification
Potential theory of Polanyi• Dubinin• Myers – Prausnitz – Dubinin – Approach (MPD)
43
Hochschule Offenburg University of Applied Sciences
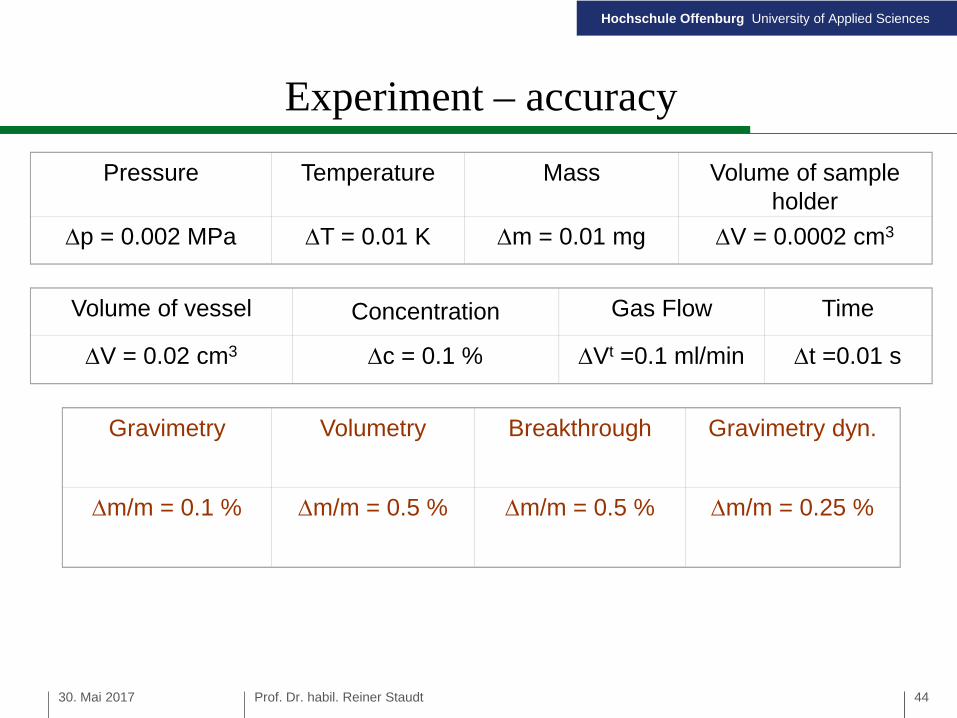
Experiment – accuracy
Gravimetry Volumetry Breakthrough Gravimetry dyn.
Dm/m = 0.1 % Dm/m = 0.5 % Dm/m = 0.5 % Dm/m = 0.25 %
Pressure Temperature Mass Volume of sampleholder
Dp = 0.002 MPa DT = 0.01 K Dm = 0.01 mg DV = 0.0002 cm3
Volume of vessel Concentration Gas Flow Time
DV = 0.02 cm3 Dc = 0.1 % DVt =0.1 ml/min Dt =0.01 s
30. Mai 2017 Prof. Dr. habil. Reiner Staudt 44
Hochschule Offenburg University of Applied Sciences
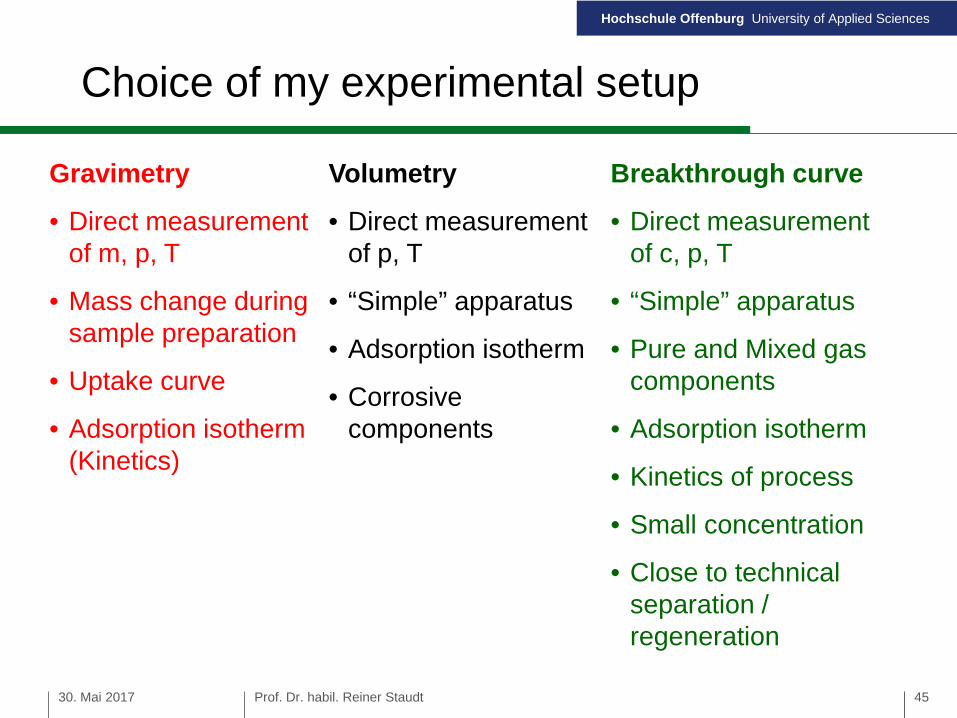
Choice of my experimental setup
Gravimetry
• Direct measurementof m, p, T
• Mass change duringsample preparation
• Uptake curve
• Adsorption isotherm(Kinetics)
Volumetry
• Direct measurementof p, T
• “Simple” apparatus
• Adsorption isotherm
• Corrosivecomponents
Breakthrough curve
• Direct measurementof c, p, T
• “Simple” apparatus
• Pure and Mixed gascomponents
• Adsorption isotherm
• Kinetics of process
• Small concentration
• Close to technicalseparation /regeneration
30. Mai 2017 Prof. Dr. habil. Reiner Staudt 45
Hochschule Offenburg University of Applied Sciences
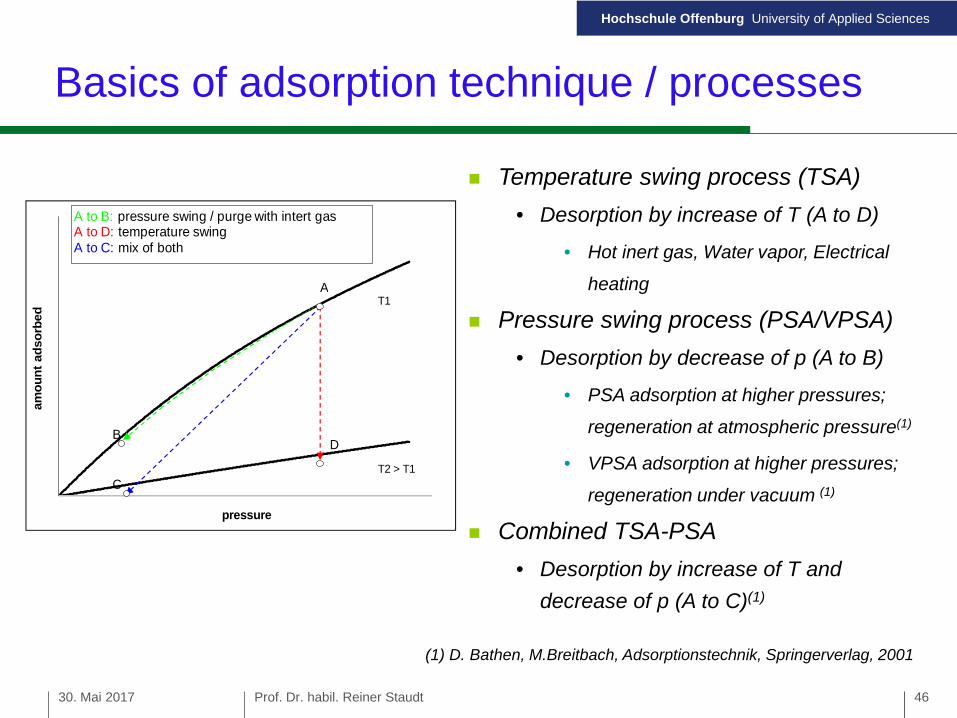
0
5
10
15
20
25
30
0 200 400 600 800 1000 1200 1400 1600
am
ou
nt
ad
so
rbed
pressure
T1
T2 > T1
A
DB
C
A to B: pressure swing / purge with intert gasA to D: temperature swingA to C: mix of both
Basics of adsorption technique / processes
Temperature swing process (TSA)
• Desorption by increase of T (A to D)
• Hot inert gas, Water vapor, Electrical
heating
Pressure swing process (PSA/VPSA)
• Desorption by decrease of p (A to B)
• PSA adsorption at higher pressures;
regeneration at atmospheric pressure(1)
• VPSA adsorption at higher pressures;
regeneration under vacuum (1)
Combined TSA-PSA
• Desorption by increase of T and
decrease of p (A to C)(1)
(1) D. Bathen, M.Breitbach, Adsorptionstechnik, Springerverlag, 2001
30. Mai 2017 Prof. Dr. habil. Reiner Staudt 46
Hochschule Offenburg University of Applied Sciences
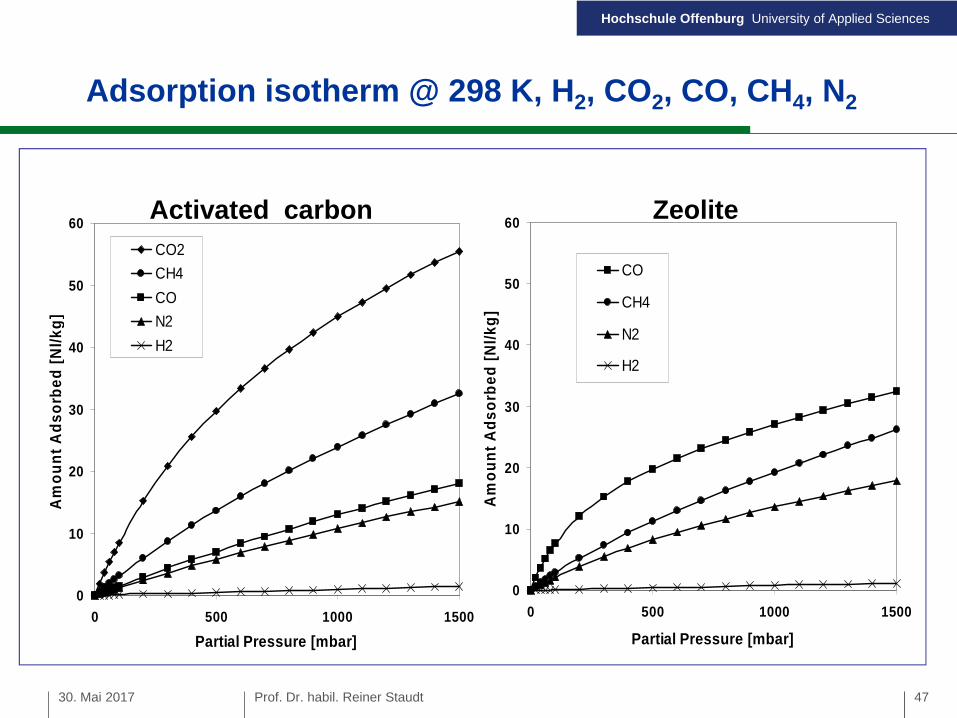
Adsorption isotherm @ 298 K, H2, CO2, CO, CH4, N2
Activated carbon Zeolite
0
10
20
30
40
50
60
0 500 1000 1500
Partial Pressure [mbar]
Am
ou
nt
Ad
so
rbe
d[N
l/k
g]
CO2
CH4
CO
N2
H2
0
10
20
30
40
50
60
0 500 1000 1500
Partial Pressure [mbar]
Am
ou
nt
Ad
so
rbe
d[N
l/k
g]
CO
CH4
N2
H2
30. Mai 2017 Prof. Dr. habil. Reiner Staudt 47
Hochschule Offenburg University of Applied Sciences
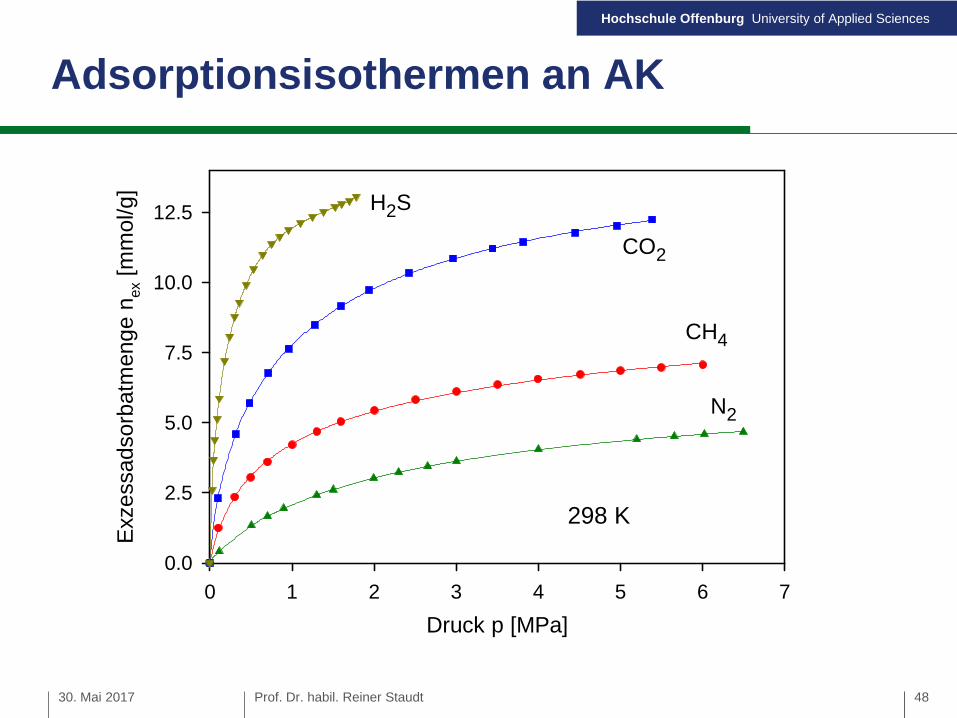
Adsorptionsisothermen an AK
Prof. Dr. habil. Reiner Staudt
Druck p [MPa]
0 1 2 3 4 5 6 7
Exz
essad
so
rbatm
en
ge
nex
[mm
ol/g
]
0.0
2.5
5.0
7.5
10.0
12.5
N2
CH4
CO2
H2S
298 K
30. Mai 2017 48
Hochschule Offenburg University of Applied Sciences
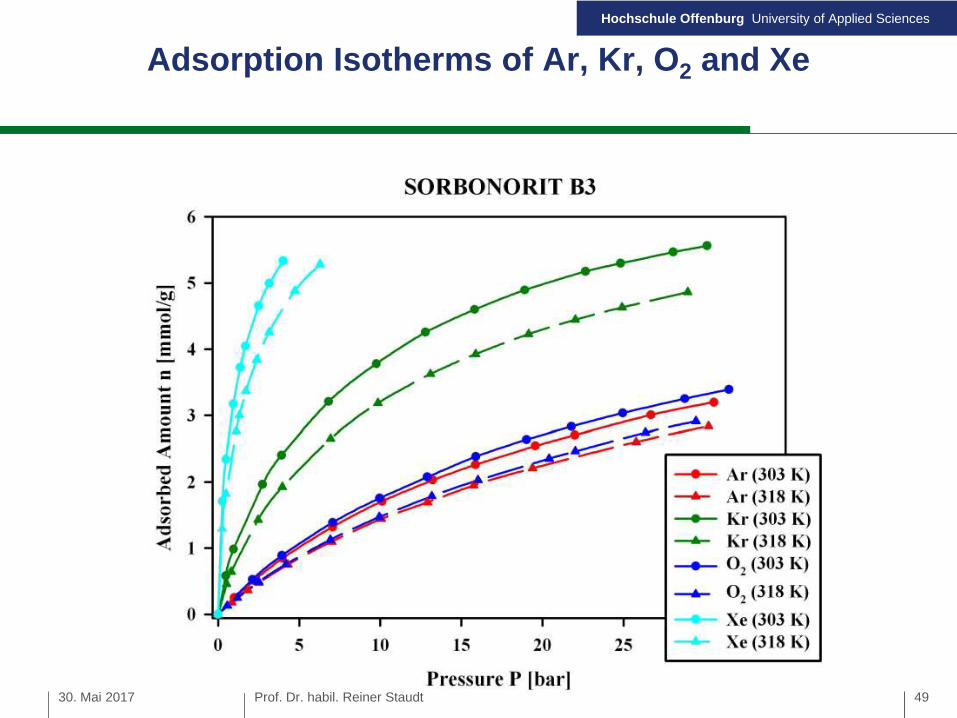
Adsorption Isotherms of Ar, Kr, O2 and Xe
30. Mai 2017 Prof. Dr. habil. Reiner Staudt 49
Hochschule Offenburg University of Applied Sciences
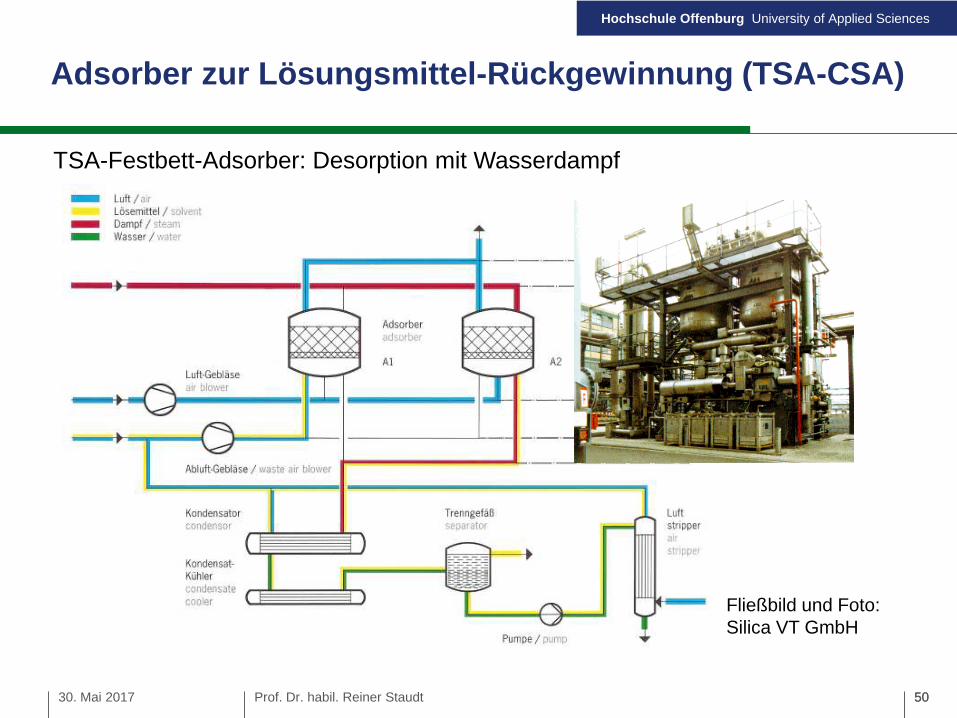
Adsorber zur Lösungsmittel-Rückgewinnung (TSA-CSA)
Fließbild und Foto:Silica VT GmbH
TSA-Festbett-Adsorber: Desorption mit Wasserdampf
30. Mai 2017 Prof. Dr. habil. Reiner Staudt 5050
Hochschule Offenburg University of Applied Sciences
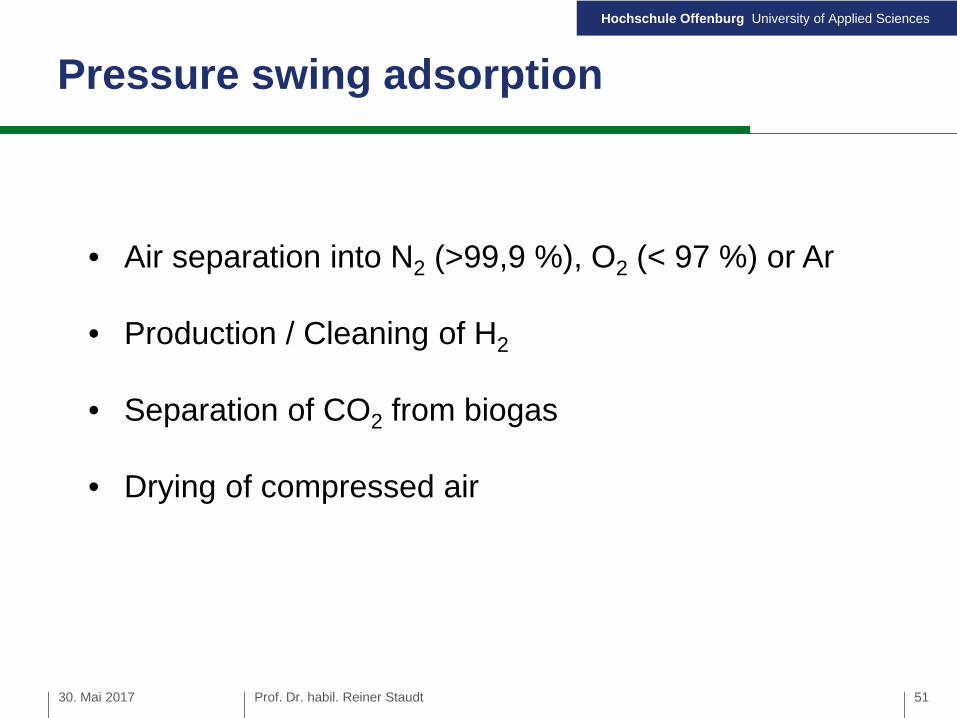
Pressure swing adsorption
30. Mai 2017 Prof. Dr. habil. Reiner Staudt
• Air separation into N2 (>99,9 %), O2 (< 97 %) or Ar
• Production / Cleaning of H2
• Separation of CO2 from biogas
• Drying of compressed air
51
Hochschule Offenburg University of Applied Sciences
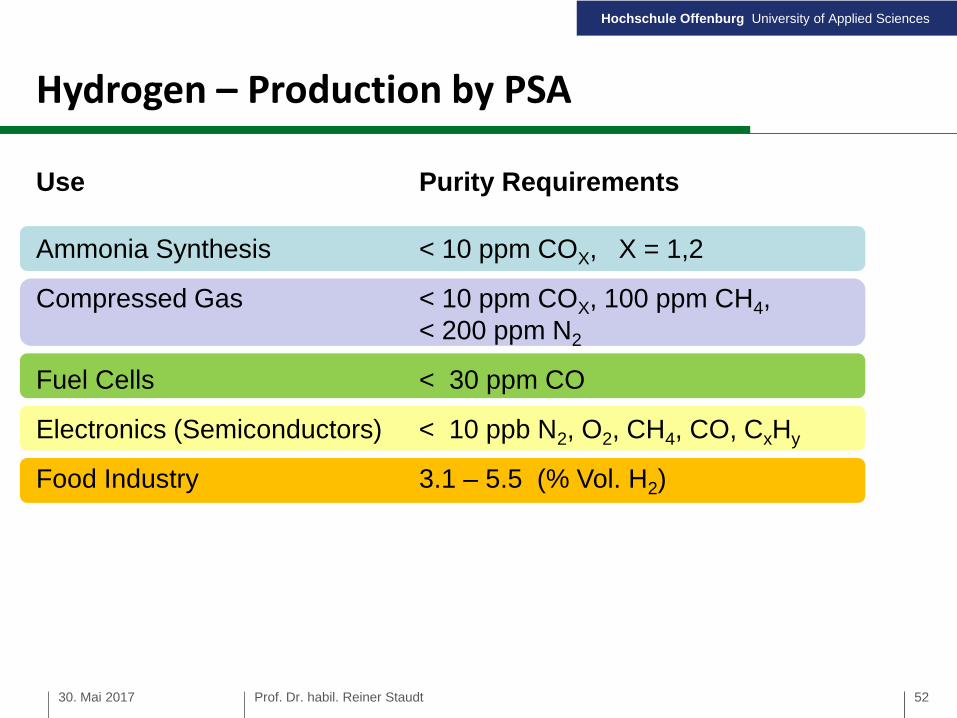
Hydrogen – Production by PSA
Use Purity Requirements
Ammonia Synthesis < 10 ppm COX, X = 1,2
Compressed Gas < 10 ppm COX, 100 ppm CH4,< 200 ppm N2
Fuel Cells < 30 ppm CO
Electronics (Semiconductors) < 10 ppb N2, O2, CH4, CO, CxHy
Food Industry 3.1 – 5.5 (% Vol. H2)
30. Mai 2017 Prof. Dr. habil. Reiner Staudt 52
Hochschule Offenburg University of Applied Sciences
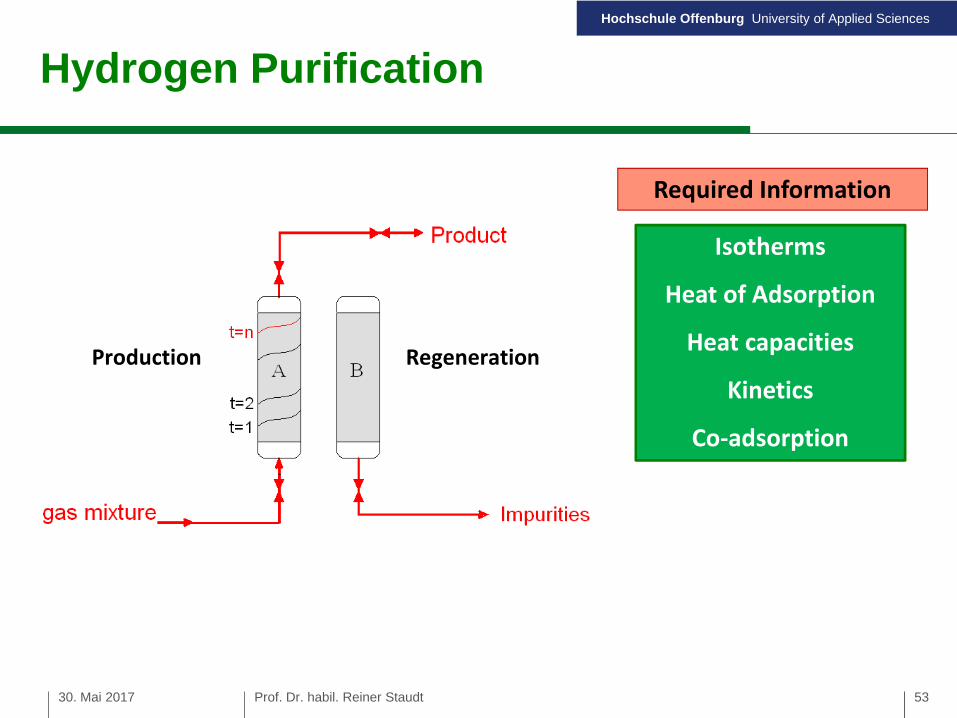
Required Information
Hydrogen Purification
Isotherms
Heat of Adsorption
Heat capacities
Kinetics
Co-adsorption
Production Regeneration
30. Mai 2017 Prof. Dr. habil. Reiner Staudt 53
Hochschule Offenburg University of Applied Sciences
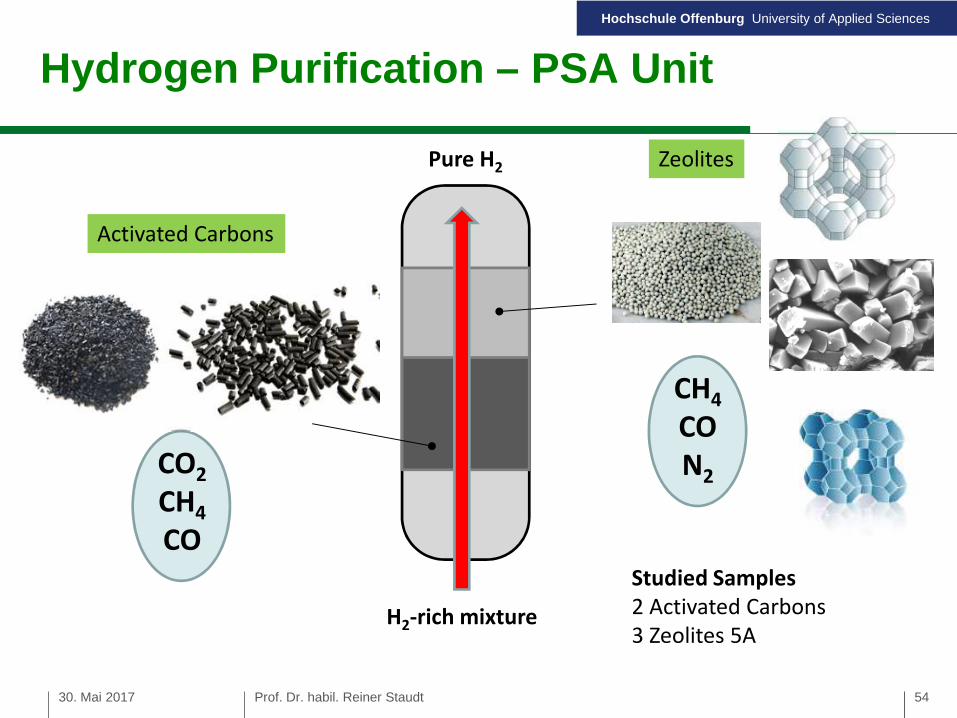
Activated Carbons
Zeolites
CO2
CH4
CO
CH4
CON2
H2-rich mixture
Studied Samples2 Activated Carbons3 Zeolites 5A
Hydrogen Purification – PSA Unit
30. Mai 2017 Prof. Dr. habil. Reiner Staudt 54
Pure H2
Hochschule Offenburg University of Applied Sciences
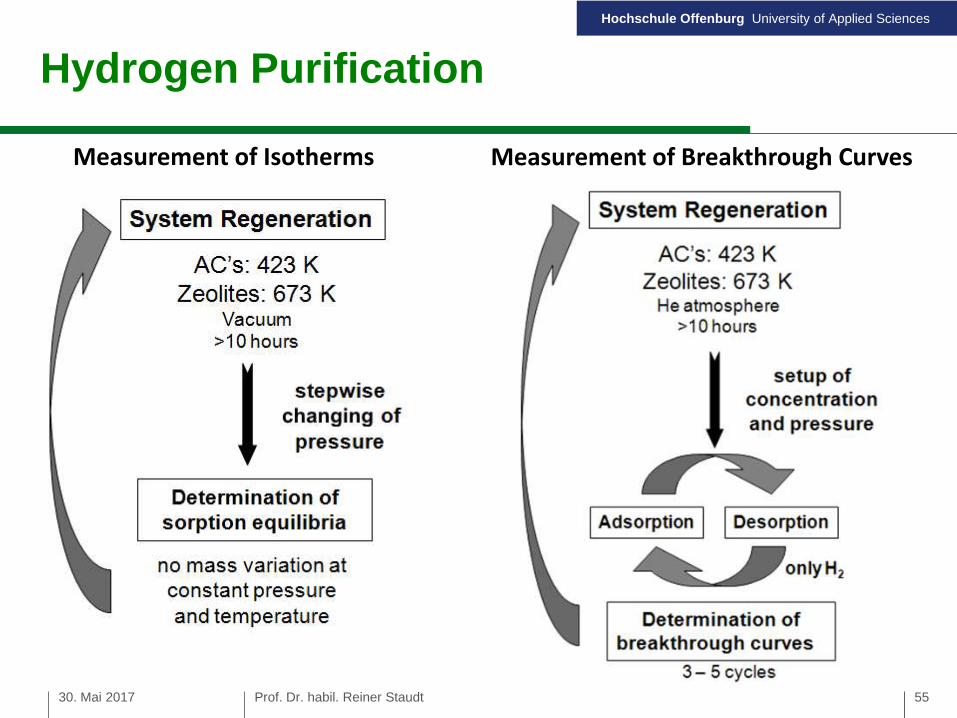
Measurement of Isotherms Measurement of Breakthrough Curves
Hydrogen Purification
30. Mai 2017 Prof. Dr. habil. Reiner Staudt 55
Hochschule Offenburg University of Applied Sciences
1E-3 0.01 0.1 10.01
0.1
1
10AC D 55/2 C PSAmethane
Toth model at 298 KToth model at 303 KA seriesB seriesC series
am
ou
nt
ad
sorb
ed
/m
olk
g-1
pressure / MPa
A3
A2
A1
B1
B4
B2
B3
C5
C1
C4
C2C3
0.01 0.1 0.60.2
1
3
F4
F3 F2
F1
E3 E4
E2
E1E1Toth model at 298 KToth model at 303 K
KÖSTROLITH 5ABF
carbon monoxide
pressure / MPa
am
oun
tad
sorb
ed
/m
olk
g-1
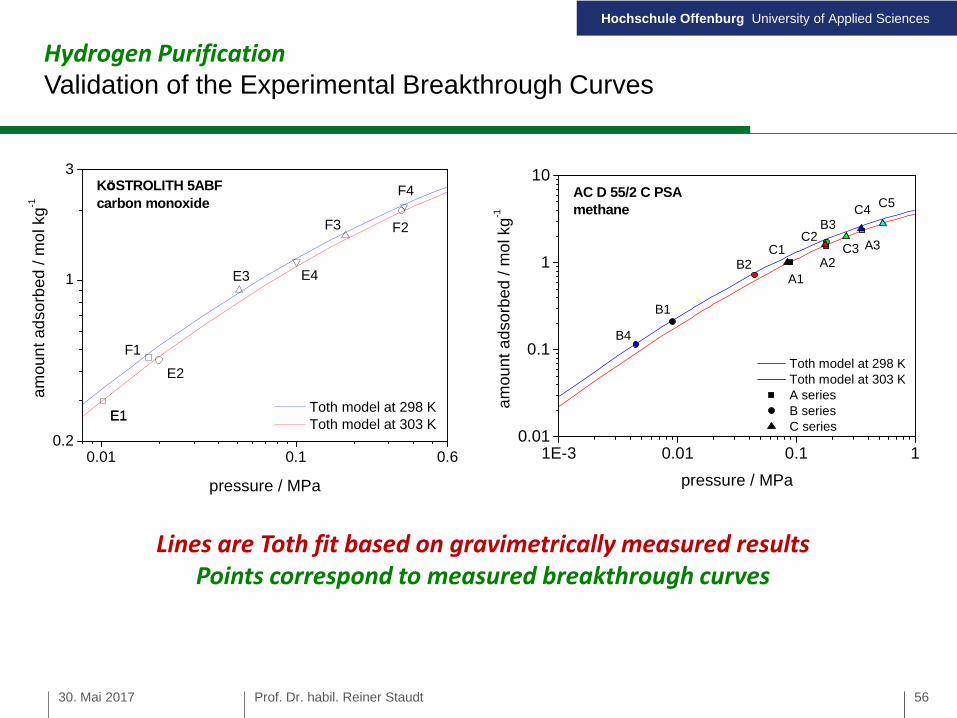
Hydrogen PurificationValidation of the Experimental Breakthrough Curves
Lines are Toth fit based on gravimetrically measured resultsPoints correspond to measured breakthrough curves
30. Mai 2017 Prof. Dr. habil. Reiner Staudt 56
Hochschule Offenburg University of Applied Sciences
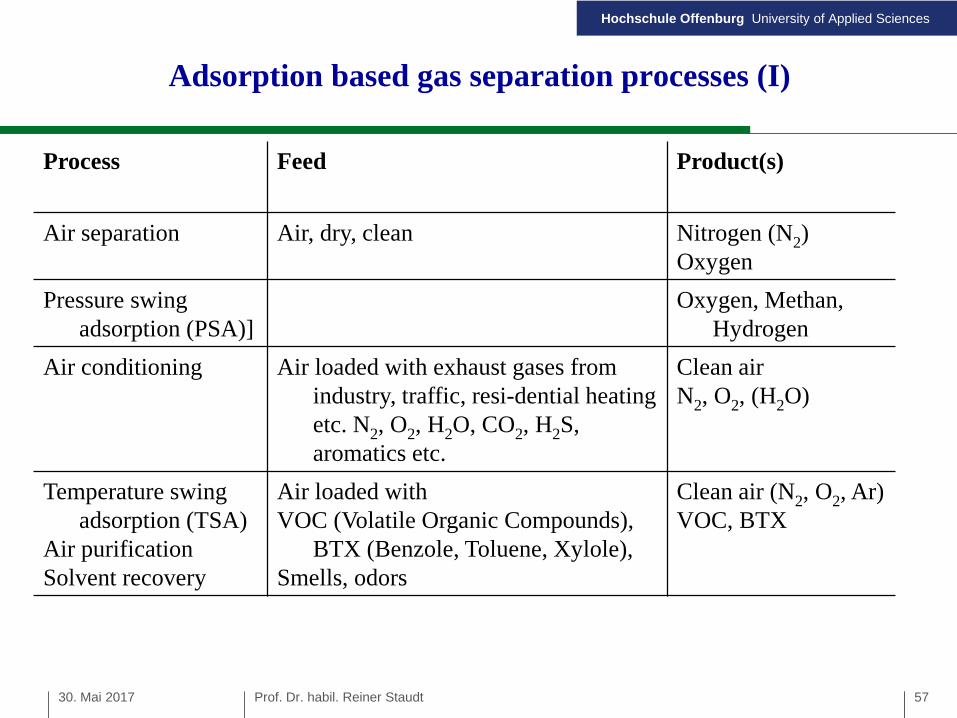
Adsorption based gas separation processes (I)
Process Feed Product(s)
Air separation Air, dry, clean Nitrogen (N2)Oxygen
Pressure swingadsorption (PSA)]
Oxygen, Methan,Hydrogen
Air conditioning Air loaded with exhaust gases fromindustry, traffic, resi-dential heatingetc. N2, O2, H2O, CO2, H2S,aromatics etc.
Clean airN2, O2, (H2O)
Temperature swingadsorption (TSA)
Air purificationSolvent recovery
Air loaded withVOC (Volatile Organic Compounds),
BTX (Benzole, Toluene, Xylole),Smells, odors
Clean air (N2, O2, Ar)VOC, BTX
30. Mai 2017 Prof. Dr. habil. Reiner Staudt 57
Hochschule Offenburg University of Applied Sciences
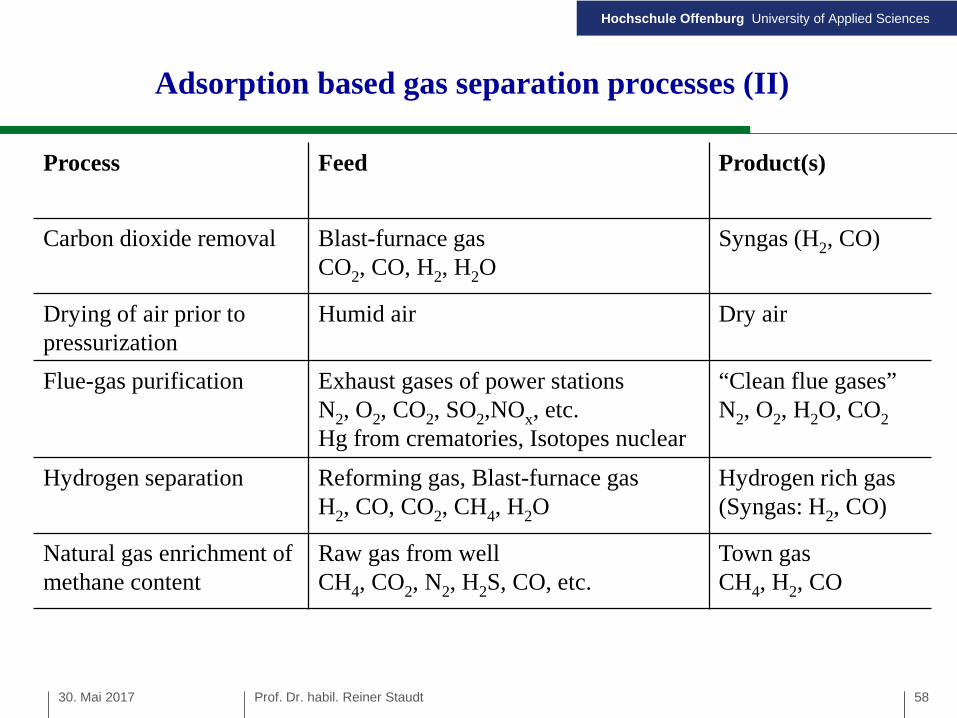
Adsorption based gas separation processes (II)
Process Feed Product(s)
Carbon dioxide removal Blast-furnace gasCO2, CO, H2, H2O
Syngas (H2, CO)
Drying of air prior topressurization
Humid air Dry air
Flue-gas purification Exhaust gases of power stationsN2, O2, CO2, SO2,NOx, etc.Hg from crematories, Isotopes nuclear
“Clean flue gases”N2, O2, H2O, CO2
Hydrogen separation Reforming gas, Blast-furnace gasH2, CO, CO2, CH4, H2O
Hydrogen rich gas(Syngas: H2, CO)
Natural gas enrichment ofmethane content
Raw gas from wellCH4, CO2, N2, H2S, CO, etc.
Town gasCH4, H2, CO
30. Mai 2017 Prof. Dr. habil. Reiner Staudt 58
Hochschule Offenburg University of Applied Sciences
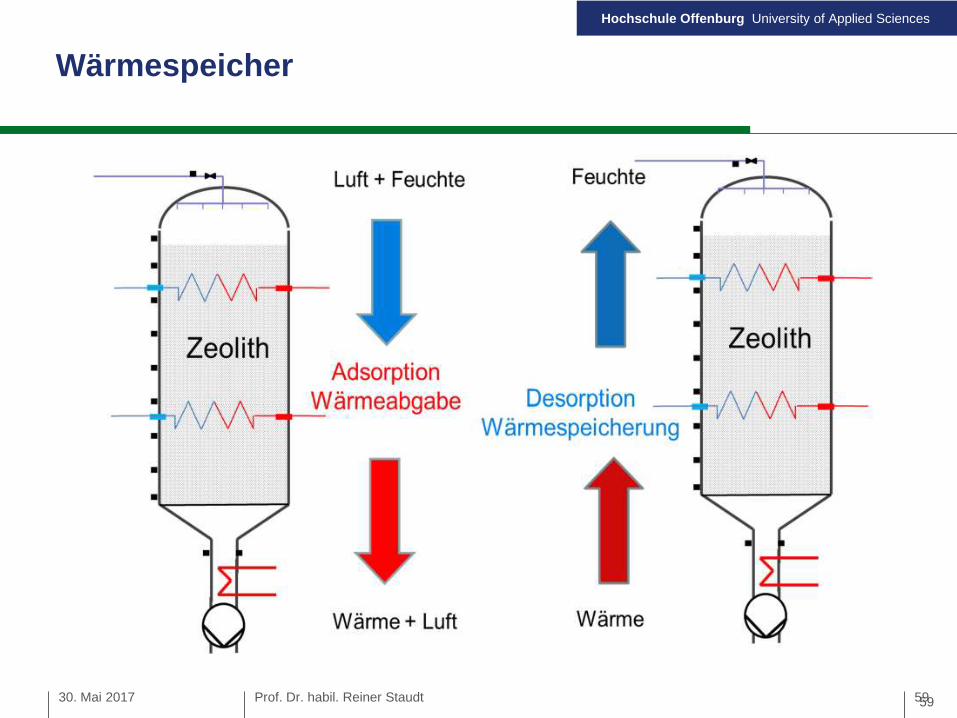
Wärmespeicher
30. Mai 2017 Prof. Dr. habil. Reiner Staudt 5959
Hochschule Offenburg University of Applied Sciences
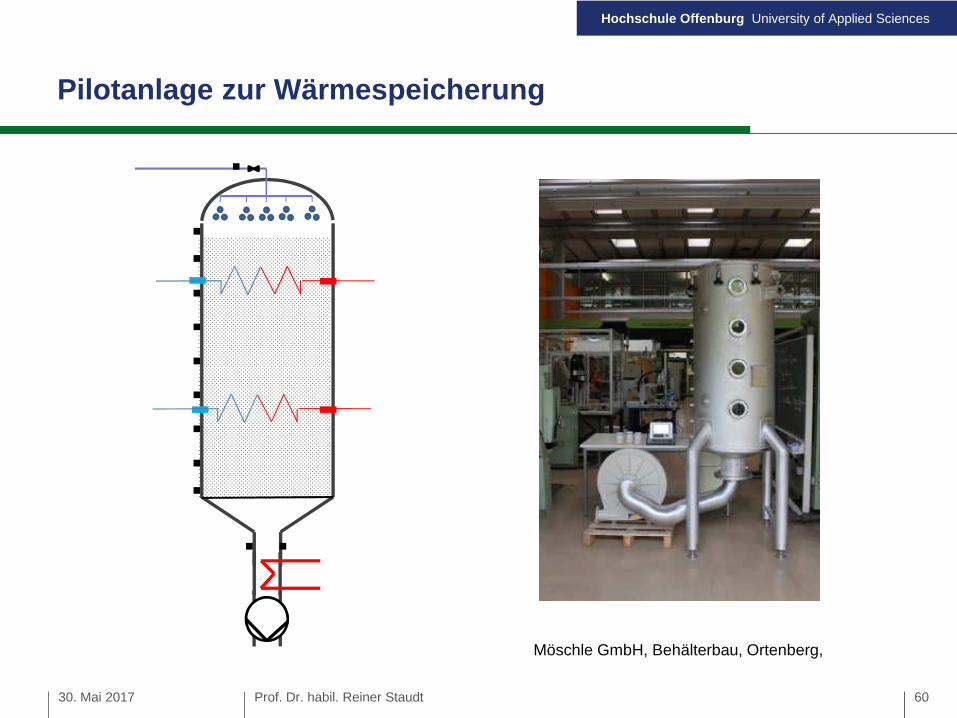
Pilotanlage zur Wärmespeicherung
30. Mai 2017 Prof. Dr. habil. Reiner Staudt
Möschle GmbH, Behälterbau, Ortenberg,
60
Hochschule Offenburg University of Applied Sciences
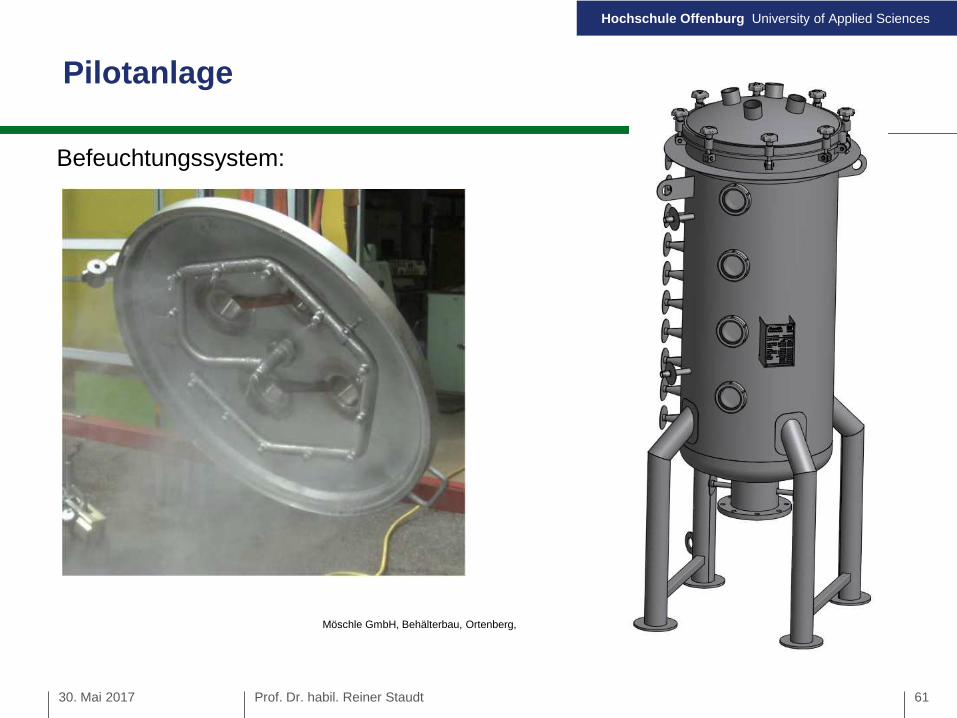
Pilotanlage
Möschle GmbH, Behälterbau, Ortenberg,
30. Mai 2017 Prof. Dr. habil. Reiner Staudt
Befeuchtungssystem:
61
Hochschule Offenburg University of Applied Sciences
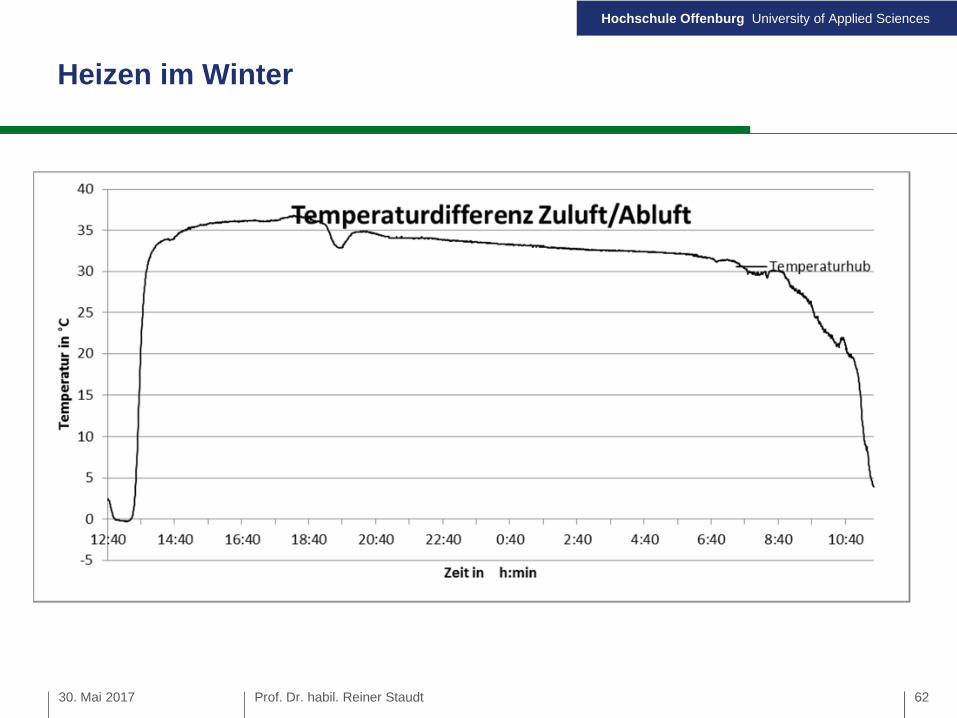
Heizen im Winter
30. Mai 2017 Prof. Dr. habil. Reiner Staudt 62
Hochschule Offenburg University of Applied Sciences
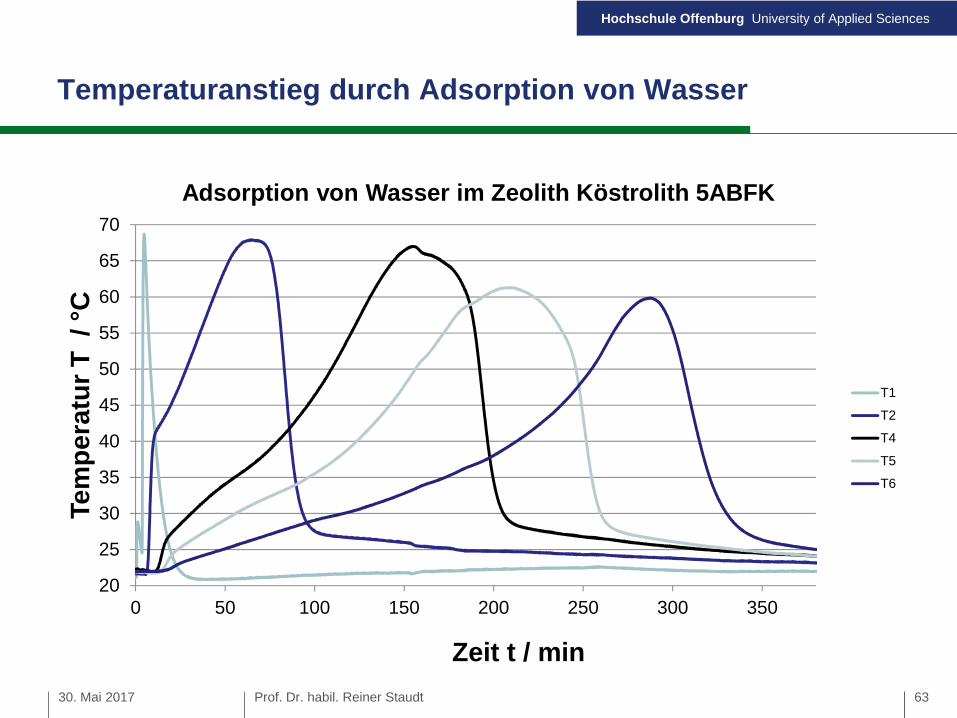
Temperaturanstieg durch Adsorption von Wasser
30. Mai 2017 Prof. Dr. habil. Reiner Staudt
20
25
30
35
40
45
50
55
60
65
70
0 50 100 150 200 250 300 350
Te
mp
era
tur
T/
°C
Zeit t / min
Adsorption von Wasser im Zeolith Köstrolith 5ABFK
T1
T2
T4
T5
T6
63
Hochschule Offenburg University of Applied Sciences
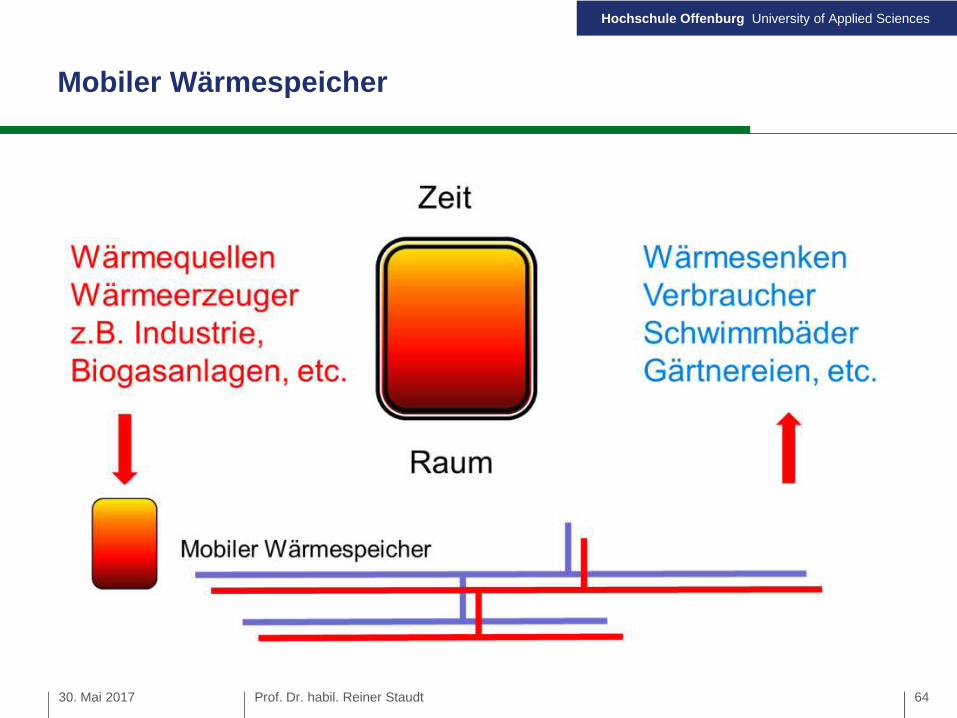
Mobiler Wärmespeicher
30. Mai 2017 Prof. Dr. habil. Reiner Staudt 64
Hochschule Offenburg University of Applied Sciences
My Conclusion
Dynamic characterisation of adsorption process delivers:
1. Adsorption Isotherm
2. Transport coefficient
3. Heat production / Temperature change during process
30. Mai 2017 Prof. Dr. habil. Reiner Staudt
Dynamic measurements are applicable for
1. Experimental simulation of real technical adsorption process
2. Wide range of pressure and temperature
3. Low concentrations, multicomponent gas,…
Simple and robust apparatus
65
Hochschule Offenburg University of Applied Sciences
Acknowledgement
We greatfully acknowledge
Lea Treick, Phillip Schandelmaier (Bach. Sc.)
Dr. A. Möller, Dr. J. Möllmer
Prof. Dr. Moisés Bastos Neto
Land Baden-Württemberg, Industry on Campus
30. Mai 2017 Prof. Dr. habil. Reiner Staudt
BMBF - KMU Innovativ
66

Hochschule Offenburg University of Applied Sciences
30. Mai 2017 Prof. Dr. habil. Reiner Staudt 67