hiv, hepatitis and sti hiv hepatitis metrics for ... for monitoring the cascade of hiv testing, care...
TRANSCRIPT

Metrics for monitoring thecascade of HIV testing,care and treatment servicesin Asia and the Pacific
For more information, please contact:HIV, Hepatitis and STIWHO Western Pacific Regional Office P.O. Box 2932 1000 Manila Philippines Email: [email protected]://www.wpro.who.int/hiv
Metrics for m
onitoring the cascade of HIV
testing, care and treatment services in A
sia and the Pacific
HIVHepatitis
& STI

Metrics for monitoring the cascade of HIV testing,
care and treatment services in Asia and the Pacific

ii
WHO Library Cataloguing-in-Publication Data Metrics for monitoring the cascade of HIV testing, care and treatment services in Asia and the Pacific
1. AIDS-Related opportunistic infections – diagnosis, prevention and control. 2. HIV infections – diagnosis, prevention and control, therapy. 3. Health services accessibility. I. World Health Organization Regional Office for the Western Pacific.
ISBN 978 92 9061 682 5 (NLM Classification: WC 503.1)
© World Health Organization 2014
All rights reserved. Publications of the World Health Organization are available on the WHO website (www.who.int) or can be purchased from WHO Press, World Health Organization, 20 Avenue Appia, 1211 Geneva 27, Switzerland (tel.: +41 22 791 3264; fax: +41 22 791 4857; email: [email protected]).
Requests for permission to reproduce or translate WHO publications – whether for sale or for non-commercial distribution – should be addressed to WHO Press through the WHO website (www.who.int/about/licensing/copyright_form/en/index.html). For WHO Western Pacific Regional Publications, request for permission to reproduce should be addressed to Publications Office, World Health Organization, Regional Office for the Western Pacific, P.O. Box 2932, 1000, Manila, Philippines (fax: +632 521 1036, email: [email protected]).The designations employed and the presentation of the material in this publication do not imply the expression of any opinion whatsoever on the part of the World Health Organization concerning the legal status of any country, territory, city or area or of its authorities, or concerning the delimitation of its frontiers or boundaries. Dotted lines on maps represent approximate border lines for which there may not yet be full agreement.
The mention of specific companies or of certain manufacturers’ products does not imply that they are endorsed or recommended by the World Health Organization in preference to others of a similar nature that are not mentioned. Errors and omissions excepted, the names of proprietary products are distinguished by initial capital letters.
All reasonable precautions have been taken by the World Health Organization to verify the information contained in this publication. However, the published material is being distributed without warranty of any kind, either expressed or implied. The responsibility for the interpretation and use of the material lies with the reader. In no event shall the World Health Organization be liable for damages arising from its use.
The mark “CDC” is owned by the US Dept. of Health and Human Services and is used with permission. Use of this logo is not an endorsement by HHS or CDC of any particular product, service or enterprise.

Acknowledgements viAcronyms OOOOOOOOOOOO viiExecutive Summary viii1. Background 1 1.1 Introduction 1 1.2 Objectives 4 1.3 Target audience 5 1.4 Guiding principles 5 1.5 Process for developing the metrics 62. Metrics for monitoring the cascade of HIV testing, care and treatment services 7 2.1 Conceptual framework 7 2.2 Recommended indicators 7 2.3 Data requirements 113. Presentation and use of the data 12 3.1 Graphic presentation of HIV services cascade using cumulative cross-sectional data 13 3.2 Graphic presentation of HIV service cascade using cohort data 15 3.3 Graphic presentation TB/HIV cascade 18 3.4 Graphic presention of cascade of prevention of mother-to-child transmission services 19 3.5 Dashboard of indicators 22 Annex: Detailed description of indicators 24References 48
Contents
iii

iviv
Metrics for monitoring the cascade of HIV testing, care and treatment services in Asia and the Pacific
Table 1. Indicator list of metrics for monitoring the cascade of HIV testing, care and treatmentservicesinAsiaandthePacific
Table 2. Data requirements for construction of the cumulative cross-sectional cascade of HIV services for people living with HIV
Table 3. Data requirements for construction of the cascade of HIV services for the cohort of newly diagnosed people living with HIV
Table 4. Data requirements for construction of the TB/HIV cascade
Table 5. Data requirements for construction of the PMTCT cascade
List of tables
iv
vv
Figure 1. HIV treatment and care cascade
Figure 2. Loss to follow-up along the HIV care cascade
Figure 3. The PMTCT cascade to reduce vertical transmission of HIV
Figure 4. Cascade of HIV care services for TB/HIV co-infection
Figure 5. Conceptual framework of Metrics for Monitoring the Cascade of HIV Testing, CareandTreatmentServicesinAsiaandthePacific
Figure 6. Example of cumulative cross-sectional cascade graph of HIV services for people living with HIV
Figure 7. HIV services for a cohort of PLHIV diagnosed in 20XX
Figure 8. Cascade graph of diagnosis and treatment of TB/HIV co-infections in 20XX
Figure 9. Cascade graphs for prevention of mother-to-child transmission of HIV
Figure 10. Example of dashboard presentation for selected HIV programme indicators
Figure 11. Alternative dashboard presentation of HIV programme indicators Figure 12. Example of trend graph to show performance over time for a single indicator
List of figures
v

vi
Metrics for monitoring the cascade of HIV testing, care and treatment services in Asia and the Pacific
This document was developed by the World Health Organization (WHO) Regional OfficesfortheWesternPacific(WPRO)andSouth-EastAsia(SEARO).WHOwishestoacknowledge the contributions of the following individuals.
Government partners:Mean Chhi Vun, National Centre for HIV/AIDS and STD, Cambodia; Tuon Sovanna, National Maternal and Child Health Center, Cambodia; Ma Ye, National Center for AIDS Prevention and Control, China; Genesis Samonte, National Epidemiology Center, Philippines; Bui Duc Duong, Do Thi Nhan, Viet Nam Administration of HIV/AIDS Control; and the participants in the Workshop on Strengthening Monitoring of HIV Care andAntiretroviralTherapyintheWesternPacificRegionheldon27-29November2012inVientiane, Lao People’s Democratic Republic.
Partner agencies:Vladanka Andreeva, Amala Reddy, Joint United Nations Programme on HIV/AIDS (UNAIDS); Gerard Servais, Asian Development Bank (ADB); Vincent Wong, Sr., Lily Asrat, Maria Au, United States Agency for International Development (USAID); Michelle McConnell, William P. Killam, Nguyen Thi Nguyet Phuong, Achara Teeraratkul, US Centers for Disease Control and Prevention (US CDC); David Burns, National Institutes of Health, USA (NIH); William Miller, University of North Carolina; Fumihiko Yokota, Clinton Health Access; David Wilson, Lei Zhang, Kirby Institute, University of New South Wales; Laurent Ferradini, Gary West, Suresh Rangarajan, FHI360; Shinsuke Miyano, National Center for Global Health and Medicine, Japan; Annette Sohn, TREATAsia.
World Health Organization (WHO): Masaya Kato, Nguyen Van, Fujita Masami, Nicole Seguy, Lan Zhang, Oscar Barreneche, Fetty Wijayanti, Razia Narayan Pendse, Amaya Maw Naing, Teodora Wi, Fabian Ndenzako, Dominique Ricard, Chika Hayashi, Howard Sobel, Nobuyuki Nishikiori, Katsunori Osuga, Hiromi Obara, Katrin Engelhardt, Dongbao Yu, Ying-Ru Lo.
The work was coordinated and finalized by Dongbao Yu and Ying-Ru Lo. The draftversion was prepared by Celine Costello Daly (principal author) and Tobi Saidel.
Acknowledgements
vii
AIDS acquiredimmunodeficiencysyndromeANC antenatal careART antiretroviral therapyARV antiretroviralCD4 T-lymphocyte cell bearing CD4 receptor GARPR Global AIDS Response Progress ReportingHIV humanimmunodeficiencyvirusM&E monitoring and evaluationMSM men who have sex with menPEPFAR President’s Emergency Plan for AIDS ReliefPLHIV person (people) living with HIVPMTCT prevention of mother-to-child transmissionPWID persons (people) who inject drugsSW sex workerTB tuberculosisUIC uniqueidentifiercodeUNAIDS Joint United Nations Programme on HIV/AIDSUNICEF United Nations Children’s FundUSAID United States Agency for International DevelopmentWHO World Health Organization
Acronyms

viii
Metrics for monitoring the cascade of HIV testing, care and treatment services in Asia and the Pacific
Achievement of universal access to HIV care services and ART will require more effective use of data to identify service gaps in the cascade of HIV care performance and improve programmes and services to meet targets. Monitoring and evaluation frameworks are needed to track the entire cascade of HIV care services, with greater attention to linkages and retention throughout the continuum of care.
The overall aim of the Metrics for Monitoring the Cascade of HIV Testing, Care and Treatment Services in Asia and the Pacific is to improve HIV services throughout the continuum of care, from diagnosis to achievement of viral suppression, with the ultimate goals of universalaccesstocareandpreventionoffurthertransmissionintheAsia-Pacificregion.The metrics can assist country programmes in prioritizing key indicators to assess and improve performance throughout the cascade of HIV services, including case-finding,pre-ART care and lifelong ART, as well as access to and retention within services, and transitions between services in a timely manner.
The metrics apply a public health approach to monitoring HIV care services, focusing on a minimum set of priority high-level indicators for routine monitoring. Indicators measuring TB/HIV co-infection detection and management and the cascade of PMTCT services are integrated into the metrics. Countries are encouraged to adapt the indicators and analysis plan according to the national and local context. The metrics provide a framework for assessment and improvement of programmes and are intended for use by programme managers and implementers at the national, provincial, district and facility levels.
The metrics consist of a conceptual framework and 21 indicators. The indicators are divided into two categories: cascade and programme indicators. Cascade indicators directly relate to diagnosis, enrolment and retention of people living with HIV across the HIV testing, care and treatment cascade of services from HIV diagnosis to linkage to care and treatment, identification and treatment of TB/HIV co-infections and prevention ofmother-to-childtransmission. Programme indicators measure the aspects of service delivery required for efficientandeffectiveperformancethroughoutthecontinuumofcare.
The metrics provide a framework for the analysis and presentation of data at national and subnational levels to assist programme managers in identifying loss of patient engagement (sometimes described as “leakage”) in the HIV service delivery system and highlighting missed opportunities for effectively accessing, retaining, and re-engaging people living with HIV along the continuum of care.
Cascade graphs portray the big picture of overall progress along the continuum of care andprovideavisualsnapshotofeachofitscomponents.Cascadeanalysisidentifiesgapsand/orleaksintheHIVcarecascadeandfacilitatesthetargetingofspecificinterventionsto the highest priority programme areas according to need or likely impact. Detailed instructions for building four different cascades are provided in the following sections, including a cascade of HIV care services using cumulative cross-sectional data, a second cascade of HIV care services using cohort data, a TB/HIV cascade, and the PMTCT cascade.
Programme monitoring outputs can also be presented as a dashboard of indicators, which providesacross-sectionalsnapshotofperformanceonkeyindicatorsforaspecifictimeperiod. Rather than focusing on the progress of individuals throughout the cascade, the
Executive summary

Executive summary
ix
dashboard gives actionable information on how well the programme is performing at each step along the continuum of care.
Because the metrics consist of high-level indicators, performance on each indicator is influencedbymanyfactors.Cascadegraphsand indicatordataareastartingpoint forfurther investigation to understand the determinants of performance and to identify solutions. Programme performance across the continuum of care is affected by several factors, including the quality and content of services; accessibility and acceptability of services; resource availability; and linkages between services.
Interpretationoftheindicatordataisenhancedbytriangulationofthefindingswithotheravailable sources of data (e.g. national M&E framework indicator data, quality indicator data, servicemapping,observationfindings, surveydataanddataaudits).Discussionswith stakeholders provide further assistance in the assessment of the role of policies, the health system, the community and the individual in contributing to leakage along the continuum of care. Once the determinants of the gaps and bottlenecks are identified,the health care team and other stakeholders can work together to identify solutions to maximize retention and linkages along the cascade of HIV care services.

Metrics for monitoring the cascade of HIV testing, care and treatment services in Asia and the Pacific
1
1.1 Introduction
InAsia and thePacific, an estimated 4.9millionpeoplewere livingwithHIV in 2012.Although the rate of new HIV infections has decreased over the last decade, there are still an estimated 353 000 new infections each year in the region. (1) HIV treatment services have been rapidly scaled up and as a result, the number of people receiving antiretroviral therapy(ART)hasincreasedmorethanfourfoldoverthepastfiveyears,from280000in2006to1250000bytheendof2012.Nevertheless,asubstantialtreatmentgapremains−only51%ofthoseeligiblehadaccesstoARTinAsiaandthePacificin2012.(2)
Although the number of new infections is declining in the region, the number of people in need of treatment is expected to increase in coming years. Those who are already infected are progressing to later stages of the disease and those on ART are surviving longer. Recent research showing the prevention and treatment benefits of earlierinitiation of ART has led to the expansion of eligibility criteria, further increasing the demand for ART services. (3, 4, 5)
In response to these challenges, WHO and the Joint United Nations Programme on HIV/AIDS (UNAIDS) launched the Treatment 2.0 initiative in 2010. The principles and priorities of Treatment 2.0 are designed to achieve universal access to HIV care and treatment services and maximize the preventive benefits of ART by improving theirefficiency,coverageandimpact. (6)
In 2013, WHO released consolidated guidelines for a public health approach to the diagnosis, care and treatment of HIV infection. (5) The guidelines recommend earlier initiation of ART for adults and adolescents with a CD4 count of 500 cells/mm3 or less. Triple-drug therapy is recommended for several populations regardless of CD4 count, including HIV-positive partners of serodiscordant couples, pregnant and breastfeeding women, children under five years of age, and persons with active tuberculosis (TB)infectionor severechronic liverdiseasedue tohepatitisBvirus.Theguidelines reflectadvances in the HIV response over recent years, including new technologies and approaches that allow decentralization of service delivery. They also provide operational guidance for strengthening early diagnosis and improving linkages and retention across the continuum of care.
Achievement of universal access will require more effective use of data to identify gaps in performance and improve programmes and services to meet targets. A culture of data use for programme improvement at all levels, from the facility level to national programme management, will be needed to improve uptake and retention of people livingwithHIV(PLHIV)andmaximizethebenefitsofHIVcareandtreatmentservicesfor improved survival and reduced transmission of HIV. Identifying pregnant women, infants and tuberculosis patients who are HIV-infected, linking them to care and ART services, and promoting retention in care are important components of universal access to HIV care and treatment.
Monitoring and evaluation frameworks need to track the entire cascade of services, with greater attention to linkages and retention throughout the continuum of care. These metrics distill a core set of indicators to focus attention on the cascade of HIV care services, taking into account the prevention benefit of treatment, and integratesprevention of mother-to-child transmission (PMTCT) and the identification andtreatment of TB/HIV co-infections.
1. Background
1

1.1.1 The cascade of HIV treatment and care services
To achieve universal access to HIV treatment and care with the outcome of viral suppression, each HIV-positive individual must progress along the continuum of care in a timely and efficient manner. The cascade of HIV care presented in these metrics begins with HIVinfection, followed by diagnosis, enrolment in care, initiation of ART and viral suppression (Fig. 1). Although not shown here, important steps for prevention of infection and promotion of early diagnosis complete the total cascade of prevention, care and treatment.
Figure 1. HIV treatment and care cascade
Source: Consolidated guidelines on the use of antiretroviral drugs for treating and preventing HIV infection: recommendations for a public health approach. Geneva: World Health Organization; 2013
Many potential opportunities for delayed diagnosis and patient attrition exist along the cascade of services and contribute to mortality and continued HIV transmission. Initial diagnosis is often delayed until the late stages of disease due to delays in testing. The few available data on retention from the time of diagnosis to initiation of ART indicate that a high proportion of people living with HIV are lost in the transitions from testing to pre-ART care and from pre-ART care to ART. As a result, late initiation of ART continues to be a major driver of mortality in the region and worldwide. (7, 8) In addition, many patients do not continue with lifelong therapy once they start ART (Fig. 2). The global mean for retentiononARTfallsfrom86%after12monthsoftreatmentto72%afterfiveyears.(1) Thereisawidespreadneedformoreefficientcase-finding,earlierenrolmentandretentionin pre-ART care, timely initiation of ART when eligible, and retention and adherence in lifelong treatment.
Figure 2. Loss to follow-up along the HIV care cascade
Source: WHO. Meeting report on framework for metrics to support effective treatment as prevention, 2-3 April 2012. Geneva, 2012. Adapted from Gardner EM et al. The spectrum of engagement of HIV care and its relevance to test-and-treat strategies for prevention of HIV infection. Clinical Infectious Diseases, 2011:52, 793-800
Background
22

Metrics for monitoring the cascade of HIV testing, care and treatment services in Asia and the Pacific
3
1.1.2 The cascade of services for prevention of mother-to-child transmission (PMTCT) of HIV
Box 1: Four prongs of comprehensive prevention of mother-to-child transmission
Prong 1Primary prevention (preventing new HIV infections in women)
Prong 2 Family planning (preventing unintended pregnancies in HIV-infected women)
Prong 3 ART/ARV interventions (prevention of vertical transmission)
Prong 4 Care, treatment and follow-up (post-pregnancy)
WHO. Towards elimination of mother-to-child transmission of HIV. 2010
The global community’s goal is elimination of mother-to-child transmission of HIV by 2015 and reduced maternal mortality due to HIV. (9) In Asia, regional targets for 2015 support this initiative, including overall targets of reducing new paediatric HIV infections by 90% and parent-to-child HIV infections to <5% by 2015 (from 2009 baselines). (10)
Preventing mother-to-child transmission of HIV requires a multi-pronged approach (see text box). The third prong, prevention of vertical transmission of HIV, is made up of the HIV testing and treatment cascade for pregnant women and their infants. The PMTCT cascade starts with HIV screening and diagnosis of pregnant women and continues with appropriate antiretroviral treatment of HIV-positive pregnant women and HIV-exposed infants according to national guidelines (Figure 3).
Figure 3. The PMTCT cascade to reduce vertical transmission of HIV
In the post-partum period, HIV-positive women and HIV-positive infants need to be linked to continued HIV care services and started on ART, if eligible according to national guidelines. The 2013 WHO consolidated guidelines include recommendations for expanded treatment of pregnant women, including Option B+ for lifetime ART regardless of CD4 count, as well as early infant diagnosis and treatment. (5)
Strengthened linkages between services and improved retention along the PMTCT cascade are needed to reach the goal for reduction of mother-to-child infections. However, testing rates for pregnant women range from as high as slightly more than half (53%) intheWesternPacifictoaslowas21%inSouth-EastAsiain2012.(11) Only 19% of the estimated HIV-positive pregnant women received antiretroviral drugs as prophylaxis to preventmother-to-childtransmissionintheAsia-Pacificregion,whichisbelowtheglobalaverage of 62%. (12)
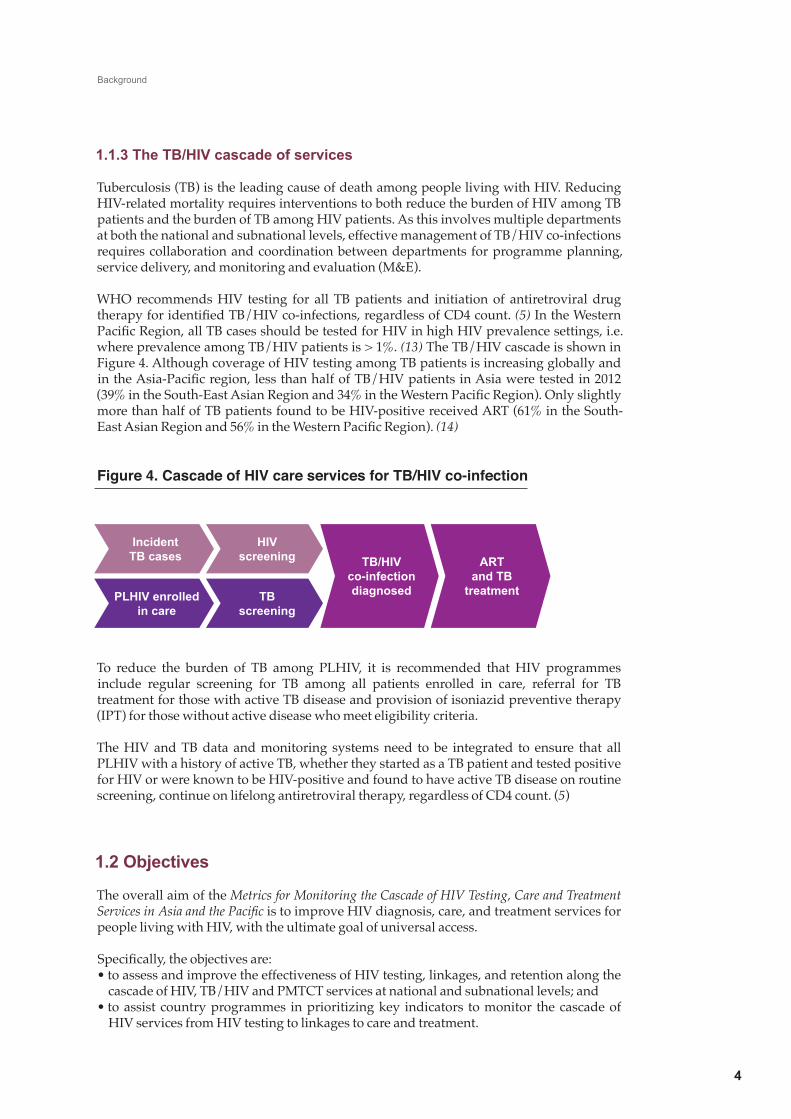
1.1.3 The TB/HIV cascade of services
Tuberculosis (TB) is the leading cause of death among people living with HIV. Reducing HIV-related mortality requires interventions to both reduce the burden of HIV among TB patients and the burden of TB among HIV patients. As this involves multiple departments at both the national and subnational levels, effective management of TB/HIV co-infections requires collaboration and coordination between departments for programme planning, service delivery, and monitoring and evaluation (M&E).
WHO recommends HIV testing for all TB patients and initiation of antiretroviral drug therapyforidentifiedTB/HIVco-infections,regardlessofCD4count.(5) In the Western PacificRegion,allTBcasesshouldbetestedforHIVinhighHIVprevalencesettings,i.e.where prevalence among TB/HIV patients is > 1%. (13) The TB/HIV cascade is shown in Figure 4. Although coverage of HIV testing among TB patients is increasing globally and intheAsia-Pacificregion,lessthanhalfofTB/HIVpatientsinAsiaweretestedin2012(39%intheSouth-EastAsianRegionand34%intheWesternPacificRegion).Onlyslightlymore than half of TB patients found to be HIV-positive received ART (61% in the South-EastAsianRegionand56%intheWesternPacificRegion).(14)
Figure 4. Cascade of HIV care services for TB/HIV co-infection
To reduce the burden of TB among PLHIV, it is recommended that HIV programmes include regular screening for TB among all patients enrolled in care, referral for TB treatment for those with active TB disease and provision of isoniazid preventive therapy (IPT) for those without active disease who meet eligibility criteria.
The HIV and TB data and monitoring systems need to be integrated to ensure that all PLHIV with a history of active TB, whether they started as a TB patient and tested positive for HIV or were known to be HIV-positive and found to have active TB disease on routine screening, continue on lifelong antiretroviral therapy, regardless of CD4 count. (5)
1.2 Objectives
The overall aim of the Metrics for Monitoring the Cascade of HIV Testing, Care and Treatment Services in Asia and the Pacific is to improve HIV diagnosis, care, and treatment services for people living with HIV, with the ultimate goal of universal access.
Specifically,theobjectivesare:•toassessandimprovetheeffectivenessofHIVtesting,linkages,andretentionalongthe
cascade of HIV, TB/HIV and PMTCT services at national and subnational levels; and•toassistcountryprogrammesinprioritizingkeyindicators tomonitor thecascadeof
HIV services from HIV testing to linkages to care and treatment.
Background
4
Metrics for monitoring the cascade of HIV testing, care and treatment services in Asia and the Pacific
5
1.3 Target audience
The metrics are intended for use by programme managers, M&E officers andimplementers (including technical working groups and planning committees for HIV/AIDS, maternal and child health and TB/HIV) at the national, provincial, district and facility levels.
1.4 Guiding principles
1.4.1 Public health approach
The metrics apply a public health perspective to monitoring HIV care services. The public health approach focuses on the health needs of populations, rather than individuals. A public health approach aims for access to services at the population level to provide the highest standard of care that is feasible within available resources.
1.4.2 Minimum number of key indicators
The metrics focus on key output and health outcome indicators to monitor the cascade of HIV care services and provide a snapshot of programme performance throughout the continuum of care. The number of indicators is limited to a minimum set of priority indicators for routine monitoring.
The metrics are a synthesis of existing global guidance to provide programme planners and implementers with a pathway for streamlined monitoring of progress toward universal access to HIV care and treatment services. Although established global indicators are included wherever possible, additional indicators are recommended to strengthen monitoring for stages of the cascade not adequately addressed by currently recommended global indicators. New indicators are introduced primarily in the early stages of the HIV cascade: for monitoring of linkages from testing to enrolment in care, and retention prior to initiation of ART.
1.4.3 Implementation at multiple levels: national and subnational
The metrics are intended for use at all levels, from national to provincial, district and facilitylevels.Indicatorshavebeenmodifiedwherenecessarytoaccommodatedifferencesin data availability between national and subnational levels.
1.4.4 Adaptation according to local contextCountries are encouraged to adapt the indicators and analysis for implementation accordingtothenationalandlocalcontext.Thismayentailchangestothedefinitionofindicators due to local variations in the type of data available, or inclusion of additional indicatorsbasedoncountry-specificneeds,ascoordinatedbytheM&Eworkinggroup.
1.4.5 Encouraging data use at all levelsThe metrics provide a framework for assessment and improvement of programmes at both the subnational and national levels. The metrics prioritize data use for programme management and improvement over collecting data for reporting purposes.
Coordination between HIV, maternal and child health, and tuberculosis programmes is needed to gather data on the full set of indicators, assess performance on HIV care services, address gaps and plan programme improvements.
1.5 Process for developing the metrics
The metrics were developed through a regional consultative process. Draft guidelines and indicators were developed after a systematic review of global reporting indicators.(10, 15, 16, 17, 18, 19, 20, 21, 22, 23, 24, 32) National HIV care and treatment quality improvement guidelines and indicators were also reviewed from countries in the region. (25, 26, 27, 28, 29) In-depth discussions and review of proposed indicators were conducted with nationalofficersfromHIV,TBandMCHprogrammesandrepresentativesofdevelopmentpartners in the region. A panel of external experts formed an advisory group and reviewed draft versions of the metrics.
A field test was conducted in Cambodia and Viet Nam in October 2013. In addition,national HIV programmes in China, Indonesia and Myanmar assessed the availability ofdataforcalculationoftheindicators.Fieldtestfindingsandcommentsfromreviewerswereaddressedandincorporatedintothefinaldocument.
Background
6

Metrics for monitoring the cascade of HIV testing, care and treatment services in Asia and the Pacific
7
This section introduces Metrics for monitoring the cascade of HIV testing, care and treatment services in Asia and the Pacific. It lays out the conceptual framework, describes the indicators included, and addresses the data requirements for using the metrics.
2.1 Conceptual framework
The Metrics for Monitoring the Cascade of HIV Testing, Care and Treatment Services in Asia and the Pacific monitor HIV services throughout the continuum of care, from diagnosis toachievementofviral suppression.Themetrics cover case-finding,pre-ARTcareandlifelong ART. The indicators focus on access to services, retention within services, and transition between services in a timely manner, all of which contribute to the ultimate goals of universal access and prevention of further transmission. Indicators measuring TB/HIV co-infection detection and management and the cascade of PMTCT services are integrated into the metrics. The conceptual framework for the metrics is depicted in Figure 5.
It is important to note that prevention and many additional services are not directly measured by the metrics, but are essential contributors to the quality of HIV care and treatment and contribute to overall programme performance. These include sexual and reproductive health services (i.e. STI treatment and family planning); strong community linkages for care (i.e. home-based care and support groups); meaningful involvement of people living with HIV; ancillary care services (e.g. psychosocial, dental, nutritional, legal); and palliative care.
2.2 Recommended indicators
The recommended indicators for the Metrics for Monitoring the Cascade of HIV testing, care and treatment Services for Asia and the Pacific are listed in Table 1. The indicators are divided into two categories: cascade and programme indicators. Cascade indicators directly relate to diagnosis, enrolment and retention of people living with HIV across the cascade of services. The indicators for the HIV, TB/HIV and PMTCT cascades are presented separately. Programme indicators measure the aspects of service delivery required for efficientandeffectiveperformancethroughoutthecontinuumofcare.
Detailed descriptions of the indicators are provided in the Annex.
2. Metrics for monitoring the cascade of HIV testing, care and treatment services

Figure 5. Conceptual framework of Metrics for monitoring the cascade of HIV testing, care and treatment services in Asia and the Pacific
Metrics for Monitoring the Cascade of HIV Testing, Care and Treatment Services
8
Metrics for monitoring the cascade of HIV testing, care and treatment services in Asia and the Pacific
9
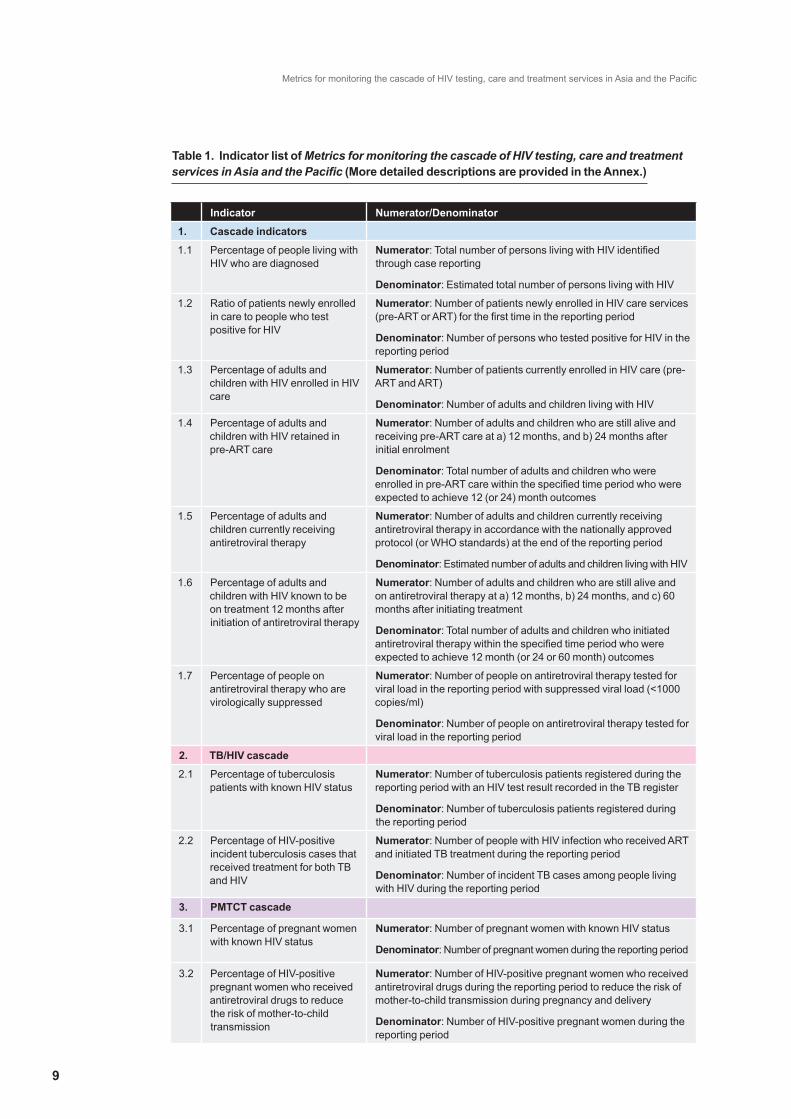
Table 1. Indicator list of Metrics for monitoring the cascade of HIV testing, care and treatment services in Asia and the Pacific (More detailed descriptions are provided in the Annex.)
Indicator Numerator/Denominator
1. Cascade indicators
1.1 Percentage of people living with HIV who are diagnosed
Numerator: Total number of persons living with HIV identified through case reporting
Denominator: Estimated total number of persons living with HIV
1.2 Ratio of patients newly enrolled in care to people who test positive for HIV
Numerator: Number of patients newly enrolled in HIV care services (pre-ART or ART) for the first time in the reporting period
Denominator: Number of persons who tested positive for HIV in the reporting period
1.3 Percentage of adults and children with HIV enrolled in HIV care
Numerator: Number of patients currently enrolled in HIV care (pre-ART and ART)
Denominator: Number of adults and children living with HIV
1.4 Percentage of adults and children with HIV retained in pre-ART care
Numerator: Number of adults and children who are still alive and receiving pre-ART care at a) 12 months, and b) 24 months after initial enrolment
Denominator: Total number of adults and children who were enrolled in pre-ART care within the specified time period who were expected to achieve 12 (or 24) month outcomes
1.5 Percentage of adults and children currently receiving antiretroviral therapy
Numerator: Number of adults and children currently receiving antiretroviral therapy in accordance with the nationally approved protocol (or WHO standards) at the end of the reporting period
Denominator: Estimated number of adults and children living with HIV
1.6 Percentage of adults and children with HIV known to be on treatment 12 months after initiation of antiretroviral therapy
Numerator: Number of adults and children who are still alive and on antiretroviral therapy at a) 12 months, b) 24 months, and c) 60 months after initiating treatment
Denominator: Total number of adults and children who initiated antiretroviral therapy within the specified time period who were expected to achieve 12 month (or 24 or 60 month) outcomes
1.7 Percentage of people on antiretroviral therapy who are virologically suppressed
Numerator: Number of people on antiretroviral therapy tested for viral load in the reporting period with suppressed viral load (<1000 copies/ml)
Denominator: Number of people on antiretroviral therapy tested for viral load in the reporting period
2. TB/HIV cascade
2.1 Percentage of tuberculosis patients with known HIV status
Numerator: Number of tuberculosis patients registered during the reporting period with an HIV test result recorded in the TB register
Denominator: Number of tuberculosis patients registered during the reporting period
2.2 Percentage of HIV-positive incident tuberculosis cases that received treatment for both TB and HIV
Numerator: Number of people with HIV infection who received ART and initiated TB treatment during the reporting period
Denominator: Number of incident TB cases among people living with HIV during the reporting period
3. PMTCT cascade
3.1 Percentage of pregnant women with known HIV status
Numerator: Number of pregnant women with known HIV status
Denominator: Number of pregnant women during the reporting period
3.2 Percentage of HIV-positive pregnant women who received antiretroviral drugs to reduce the risk of mother-to-child transmission
Numerator: Number of HIV-positive pregnant women who received antiretroviral drugs during the reporting period to reduce the risk of mother-to-child transmission during pregnancy and delivery
Denominator: Number of HIV-positive pregnant women during the reporting period
Metrics for Monitoring the Cascade of HIV Testing, Care and Treatment Services
10
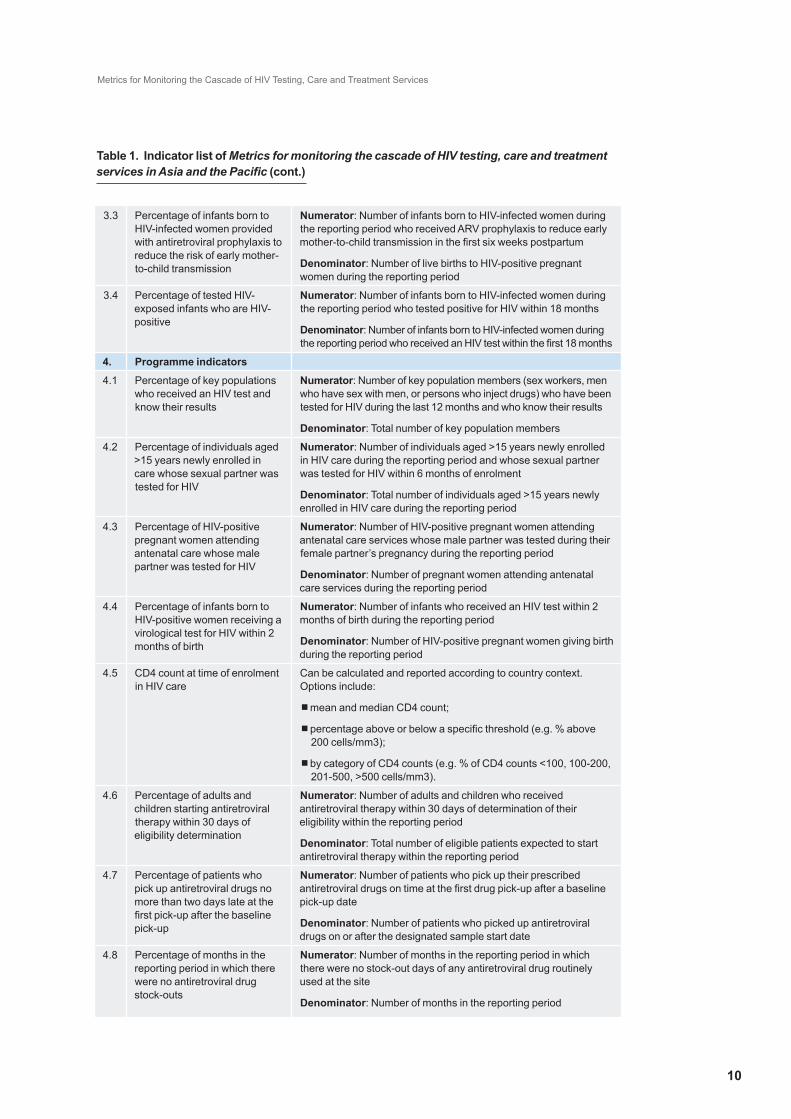
3.3 Percentage of infants born to HIV-infected women provided with antiretroviral prophylaxis to reduce the risk of early mother-to-child transmission
Numerator: Number of infants born to HIV-infected women during the reporting period who received ARV prophylaxis to reduce early mother-to-child transmission in the first six weeks postpartum
Denominator: Number of live births to HIV-positive pregnant women during the reporting period
3.4 Percentage of tested HIV-exposed infants who are HIV-positive
Numerator: Number of infants born to HIV-infected women during the reporting period who tested positive for HIV within 18 months
Denominator: Number of infants born to HIV-infected women during the reporting period who received an HIV test within the first 18 months
4. Programme indicators
4.1 Percentage of key populations who received an HIV test and know their results
Numerator: Number of key population members (sex workers, men who have sex with men, or persons who inject drugs) who have been tested for HIV during the last 12 months and who know their results
Denominator: Total number of key population members
4.2 Percentage of individuals aged >15 years newly enrolled in care whose sexual partner was tested for HIV
Numerator: Number of individuals aged >15 years newly enrolled in HIV care during the reporting period and whose sexual partner was tested for HIV within 6 months of enrolment
Denominator: Total number of individuals aged >15 years newly enrolled in HIV care during the reporting period
4.3 Percentage of HIV-positive pregnant women attending antenatal care whose male partner was tested for HIV
Numerator: Number of HIV-positive pregnant women attending antenatal care services whose male partner was tested during their female partner’s pregnancy during the reporting period
Denominator: Number of pregnant women attending antenatal care services during the reporting period
4.4 Percentage of infants born to HIV-positive women receiving a virological test for HIV within 2 months of birth
Numerator: Number of infants who received an HIV test within 2 months of birth during the reporting period
Denominator: Number of HIV-positive pregnant women giving birth during the reporting period
4.5 CD4 count at time of enrolment in HIV care
Can be calculated and reported according to country context. Options include:
n mean and median CD4 count;
n percentage above or below a specific threshold (e.g. % above 200 cells/mm3);
n by category of CD4 counts (e.g. % of CD4 counts <100, 100-200, 201-500, >500 cells/mm3).
4.6 Percentage of adults and children starting antiretroviral therapy within 30 days of eligibility determination
Numerator: Number of adults and children who received antiretroviral therapy within 30 days of determination of their eligibility within the reporting period
Denominator: Total number of eligible patients expected to start antiretroviral therapy within the reporting period
4.7 Percentage of patients who pick up antiretroviral drugs no more than two days late at the first pick-up after the baseline pick-up
Numerator: Number of patients who pick up their prescribed antiretroviral drugs on time at the first drug pick-up after a baseline pick-up date
Denominator: Number of patients who picked up antiretroviral drugs on or after the designated sample start date
4.8 Percentage of months in the reporting period in which there were no antiretroviral drug stock-outs
Numerator: Number of months in the reporting period in which there were no stock-out days of any antiretroviral drug routinely used at the site
Denominator: Number of months in the reporting period
Table 1. Indicator list of Metrics for monitoring the cascade of HIV testing, care and treatment services in Asia and the Pacific (cont.)

Metrics for monitoring the cascade of HIV testing, care and treatment services in Asia and the Pacific
11
2.3 Data requirements
The indicators included in the metrics rely primarily on routine monitoring data to promote regular assessment of programme performance at the national and subnational levels. For global indicators that are based on modelled estimates for calculation, an option for using routine monitoring data has been proposed to make them relevant at the subnational level where estimates are not available. For some indicators, triangulating the routinely collected data with information from other sources, such as behavioural and biological surveillance or other surveys, can improve reliability and provide additional information on performance.
The use of unique identifier codes (UIC) with routine monitoring data can improve the validity of the metrics indicators and enable programme managers to monitor the progress of individuals through the cascade of services. Unique identifier codes areparticularly helpful for monitoring the linkages between services in the early part of the cascade. Their use can reduce double counting for people who undergo multiple HIV tests and allow programmes to track individuals as they transition between services and locations.
Whenuniqueidentifiercodesareavailable,itbecomespossibletographthefullcascadeof services for a cohort of PLHIV, from diagnosis to viral suppression (see section 3.2). Cascade graphs can be presented for subgroups by key population, age and gender if data are available. In addition, mother-baby pairs can be linked in the full PMTCT cascade.
Modelled estimates obtained from Spectrum1 or the Asian Epidemic Model (AEM) are required for some indicators. These estimates are usually calculated in conjunction with Global AIDS Response Progress reporting (GARPR) and are generally available at the national level in Asian countries, but not at the subnational level. Wherever possible, options for calculating the indicators using routine monitoring data at the subnational level are presented in the detailed descriptions of the indicators (see Annex).
Population size estimates for key populations (sex workers, men who have sex with men, and people who inject drugs) are required for indicator 4.1, “Percentage of key populations who received an HIV test and know their results”. A discussion of the required estimates is available in the detailed description of the indicator in the Annex .
The quality of data for each indicator should be carefully considered and the strengths and limitations of each data source should be ascertained when interpreting indicator values. The reliability of data is dependent on the quality of the data collection and reporting process. Routine data quality assurance procedures are important for ensuring accurate reporting. In addition, it is important to understand the source of data and how the data are reported when calculating the indicators. A thorough understanding of how the information system databases are connected and updated is vital for discovering duplication or discrepancies in reporting between departments (e.g. TB and HIV, MCH and HIV) so that differences can be resolved. Tracing the data path back to the source and understandinghowhealthcareprovidersrecordthefindingsatthepointofcareprovidesthe information needed to assess the completeness of the data and the potential for duplicationormisclassification.
11
1 Spectrum is a suite of easy to use policy tools. The latest Spectrum (with built-in EPP) v.4.50 can be downloaded from http://www.unaids.org/en/dataanalysis/datatools/spectrumepp2011/ (accessed 14 February 2013).

This section offers examples of different ways to present the metrics indicator data and explains how to interpret and use the results.
The Metrics for monitoring the cascade of HIV testing, care and treatment services in Asia and the Pacific provide a framework for the analysis and presentation of data at the facility, district, provincial and national levels on a regular basis. Indicator data for national monitoring and evaluation are often recorded and reported, but not analysed and used sufficiently by implementers,especially at the local level. Graphic presentation of findingsisoneofthewaystomakeroutinemonitoringdata more accessible, and therefore more useful in programme management and improvement. Cascade graphs, indicator dashboards, and trend graphs assist programme managers in identifying losses (sometimes described as “leakage”) and missed opportunities along the continuum of care. They identify areas where programmes do not effectively access and retain PLHIV.
Cascade graphs portray the big picture of overall progress along the continuum of care, while at the same time, providing a visual snapshot of each of its components. There are many ways to present cascades, depending on the group being captured. It is important to clearly describe the criteria for inclusion in each cascade and explain the limitations of the data for each bar shown in the graph. Detailed instructions for building four different cascades are provided in the following sections.
The HIV programme goal is to reach universal access throughout the cascade of services. When that goal is fully achieved and all people living with HIV are diagnosed, enrolled in care, and retained on ART with viral suppression, all of the bars of the cascade graph will bemaximized.Themajorgapsandbottlenecksintheprogrammecanbeidentifiedinareaswhere the number of PLHIV reported in one component of services is much lower than in the previous service along the continuum of care. In other words, large differences in the heights of consecutive bars in the cascade graph can identify areas in need of improvement. (Note that the bars can never reach the same height all the way across the cascade. Some drop-offs are expected, e.g. not all PLHIV enrolled in care are eligible for ART.)
A dashboard of indicators provides a cross-sectional snapshot of programme performance on key indicators for a specific time period. Rather than focusing on the progress ofindividuals throughout the cascade, it gives actionable information on how well the programme is performing at each step along the continuum of care. Since the indicators do not require cohort analysis, some or all of the indicators can be updated more frequently, especiallypriorityindicatorsidentifiedasbeinginneedofimprovement.Thedashboardindicatorscanbemeasuredwithoutuniqueidentifiercodesorelectronicdatabases.
3. Presentation and use of the data
121212
Box 2: Evaluating performance along the cascade of HIV testing, care and treatment services
• What proportion of the target population is covered by HIV testing programmes?
• How many PLHIV are aware of their status (tested and diagnosed)?
• How many of the PLHIV who know their status are enrolled in care?
• How many PLHIV are retained in care?
• Are all eligible PLHIV receiving ART?
• How many of the PLHIV on ART are virologically suppressed?

Metrics for monitoring the cascade of HIV testing, care and treatment services in Asia and the Pacific
13
Data interpretation: The graphs and dashboards provide a snapshot of programme performance and assist programme managers to ask the right questions. They are a starting point for further investigation to understand the determinants of performance and to identify solutions.
Because the metrics consists of high-level indicators, performance on each indicator is influenced bymany factors. Programme performance across the continuum of careis affected by the quality and content of services (e.g. the quality of pre- and post-test counselling, ART provision, and opportunistic infection management); accessibility and acceptability of services (e.g. availability of services tailored to key populations, location andhoursofservice,waitingtimes,andconfidentiality);resources(e.g.adequatenumberof facilities and staff, and continuous supply of drugs, reagents, and other supplies), and linkages between services (from HIV testing to HIV care services, between TB and ART services, and between antenatal, paediatrics and ART services).
Related indicator data from programme indicators in the metrics and from the national monitoringandevaluationframeworkmayhelpinterpretthefindings.Processindicators(such as those used by the HIVQUAL Project2) and other information collected through observation can be valuable in the process. Interviews and meetings with stakeholders will be needed to assess the role of policies, the health system, the community and the individual in contributing to gaps and leakage along the continuum of care.
Finally, and most importantly, the health care team and other stakeholders need to work together to generate solutions. Factors underlying identified gaps and bottlenecks canbe determined and the information can be used to influence changes at the nationalprogramme and policy level. At the subnational level, solutions can be developed and monitored through quality improvement processes and/or routine supportive supervision systems.
When assessing identified gaps and bottlenecks inthe continuum of care services, it is important to firstassess the reliability of the data. Each indicator should be understood in the context of the reporting process, startingfromthepointofcaretothefinalcollatedvalue,to identify potential duplication, incomplete, and/or misclassificationofdata.
3.1 Graphic presentation of the HIV services cascade using cumulative cross-sectional data
The cumulative cross-sectional data include information on all persons infected with HIV who are alive at a point intime.Thedatareflectbotholdandnewevents.Somepeople living with HIV were diagnosed many years ago, while others have been diagnosed in recent months; some PLHIV were enrolled in care and started ART several years ago, while others have started treatment within the past year. The cumulative cross-sectional cascade graph shows the overall status of the HIV programme over time, but does not provide information on the current and up-to-date ability of HIV programmes to diagnose, enrol and retain PLHIV in HIV care services.
2 National HIVQUAL Project website: www.hivqual.org
Box 3: Cumulative cross-sectional cascade of HIV services
Strengths
• Provides a big picture view of programme progress to date
• Identifies the major areas of leakage across the cascade
• Can be shown separately for each key population, and by age and gender when data are available
Limitations
• Does not reflect programme performance for specific time periods
• Requires modelled estimates to present the full cascade
• Depends on accurate and complete case report data
• Accuracy of the estimates depends heavily on the quality of surveillance data

Building the cascade: A description of the data required for each bar in the cascade is shown in Table 2. The earlier stages of the cascade (first two bars) require modelledestimates and complete up-to-date case report data. Routine clinical monitoring data are used for the later part of the cascade, from enrolment in care onwards.
In concentrated epidemics, it is recommended that separate cascade graphs be constructed for different key populations (SW, MSM, PWID), age groups, and genders wherever disaggregated data are available.
Table 2. Data requirements for construction of the cumulative cross-sectional cascade of HIV services for people living with HIV.
Refer to the Annex for detailed indicator descriptions.
An example of a cumulative cross-sectional cascade graph is shown in Figure 6. The availability of modelled estimates of PLHIV varies according to country and level within thecountry.Mostcountrieshavedataforthefirstbar,estimated number of PLHIV at the national level and some will have estimates at the subnational level. There is also limited availability of data for the second bar, diagnosed(numberofPLHIVidentifiedthroughcasereporting) in the region. Few countries regularly update case report data at the national level since it requires extensive time and effort to remove duplicate entries for PLHIV with multiple positive tests and remove the names of PLHIV who have died in situations where a functioning UIC system is not in place. It is more likely to be available and accurate at the subnational level. Data for the third bar, total number of PLHIV enrolled in care (pre-ART and ART), are available at the facility level, but often not included in routine reports. Overall, it is recommended to build as much of the cascade graph as possible with accurate data at each level. Even a partial graph can provide valuable information on retention within HIV care services.
Interpretation of the cascade: cumulative cross-sectional cascade graph in Figure 6. In thisexample,themostsignificantgap(yellowarrow)intheHIVprogrammeisthelinkfromdiagnosistoenrolmentincare.LessthanhalfoftheidentifiedPLHIVappeartohavebeenenrolledincare.Animportantfirststepwouldbetoassessthequalityofthedata.In this case, review of the case report data is needed to check whether it is current with de-duplication of repeated tests and removal of cases that have died. If not, the number of diagnosedPLHIVwouldbeinflated,makingitappearthatthereisagreaterlosstofollow-up between testing positive and enrolling in care than actually exists.
Presentation and use of the data
14
Cascade bar Data required Indicator reference
1. Estimated number of PLHIV Estimated total number of PLHIV Indicator 1.1 denominator
2. Diagnosed Total number of PLHIV currently alive and identified through case reporting
Indicator 1.1 numerator
3. Enrolled in care Total number of PLHIV currently enrolled in HIV care (pre-ART and ART)
Indicator 1.3 numerator
4. On ART Number of adults and children currently receiving ART in accordance with the nationally approved protocol
Indicator 1.5 numerator
5. Viral load test Number of patients on ART who received a viral load test
Indicator 1.7 denominator
6. Suppressed viral load Number of patients on ART who are virologically suppressed (viral load <1000 copies/ml)
Indicator 1.7 numerator

Metrics for monitoring the cascade of HIV testing, care and treatment services in Asia and the Pacific
15
Thedropofffromthefirstbar(estimatedtotalPLHIV)tothethirdbar(numberinenrolledin care), shown by the red arrow, also suggests that many PLHIV are not receiving care. In countries or areas without updated case report data available for the second bar, the cascade graph will not be able to differentiate whether the loss to follow-up occurred prior to testing (between infection and diagnosis) or after testing (between diagnosis and enrolment in care).
Whether or not data for the second bar are available, additional investigation would be required to determine the factors underlying delays in accessing care. Triangulation with other data sources, including programme indicator 4.1 (testing uptake among key populations) in the metrics, and discussions with community and health care stakeholders wouldbeneededtodeterminetheunderlyingreasonsfortheidentifiedgapinenrolmentin HIV care. Further analysis of the data could also identify subpopulations (key populations, age group, gender or geographic location) with low rates of enrolment.
More information would be needed to assess the proportion of PLHIV enrolled in care who are receiving ART and the proportion of those who have received a viral load test and are virally suppressed. Interpretation of the results would depend on national guidelines for initiation of ART and viral load testing. Additional information on the proportion of PLHIV accessing care early in the course of disease would affect the evaluation of this value. If the majority of PLHIV were already in an advanced stage of disease at the time of initial enrolment in care, a higher proportion would be eligible for ART. Further investigation of the CD4 count at time of enrolment (indicator 4.5), as well as review of other clinical quality of care indicators would provide additional information when consideringtheprogrammaticimplicationsofthesefindings.
Figure 6. Example of cumulative cross-sectional cascade graph of HIV services for people living with HIV
3.2 Graphic presentation of the HIV service cascade using cohort data
The HIV service cascade graph using cohort data is based on a subset of PLHIV diagnosed duringaspecifictimeperiod,usuallyaspecificcalendaryear.Themembersofthecohortmust be followed for a minimum of one year to construct the full cascade graph. By that time, the PLHIV who became eligible for ART during the initial year of the cohort will have had time to progress through the entire cascade to 12-month retention on ART and results of viral load testing. Those who were diagnosed at earlier stages of disease and were not immediately eligible for ART will require a longer follow-up period to

move through all of the stages in the continuum of care. The graph can be further extended by adding bars for ART retention at 24, 48 and 60 months, with a correspondingly longer follow-up period.
The advantages of this type of cascade graph are two-fold: to track individuals as they progress through the stages of the cascade and to provide information on programme performance for specific time-periods. Aseries of consecutive cohorts can be graphed to compare progress in terms of linkages and retention over time.
Building the cascade: Table 3 provides a description of the data required for each bar in the cohort cascade. Constructionofthefullcascaderequiresuniqueidentifiercodes and in most cases, an electronic database. In areas where these are not available, a partial cascade can be constructed for the cohort of PLHIV who enrol in care duringaspecificcalendaryearusingnamesand/orotheridentifierscommonlyinusewithinclinicalsettings.
As with the cross-sectional cascade in concentrated epidemics, it is recommended that separate graphs be constructed for each key population (SW, MSM, PWID), age group and gender in areas wherever disaggregated data are available.
Table 3. Data requirements for construction of the cascade of HIV services for the cohort of newly diagnosed people living with HIV
Refer to the Annex for detailed indicator descriptions.
Presentation and use of the data
16
Box 4: Cohort cascade of HIV services
Strengths
• Shows programme performance for specific time-periods and changes in performance over time
• Tracks individuals as they progress through the continuum of care
• Can be shown separately for each key population, and by age and gender when data are available
Limitations
• Requires unique identifier codes and in most cases, an electronic database
• Requires follow-up data
• Difficult if the target population is highly mobile
• Is labour-intensive and costly
Cascade bar Data required Indicator reference
1. Diagnosed Total number of PLHIV identified through case reporting during the 12-month period specified for the cohort
Indicator 1.2
denominator
2. Enrolled in care Total number of PLHIV diagnosed during the 12-month period specified for the cohort and enrolled in HIV care (pre-ART and ART)
Indicator 1.2
numerator
3. Initiated ART Total number of PLHIV diagnosed during the 12-month period specified for the cohort who initiated ART
Indicator 1.5
numerator
4. Retained on ART for 12 months
Number of PLHIV diagnosed during the 12-month period specified for the cohort and are still alive and on ART 12 months after initiation of ART (optional: add cascade bars for 24, 36, 48 and 60 months)
Indicator 1.6
numerator
5. Viral load test Number of patients diagnosed during the 12-month period specified for the cohort who received a viral load test
Indicator 1.7 denominator
6. Suppressed viral load Number of PLHIV diagnosed during the 12-month period specified for the cohort with suppressed viral load (<1000 copies/ml)
Indicator 1.7
numerator

Metrics for monitoring the cascade of HIV testing, care and treatment services in Asia and the Pacific
17
An example of a cascade graph of HIV services for a cohort of PLHIV followed for two years is shown in Figure 7. The data for each bar of the cohort cascade graph are based on onlythosePLHIVdiagnosedduringthespecifiedcalendaryear.Thefirstbar,number of PLHIV identified through case reporting (diagnosed), requires a complete and up-to-date case reportlistwithdeletionofduplicates.Inthecaseofthecohortcascade,allnewlyidentifiedPLHIV are followed over time. Those who die are not excluded from the initial cohort since death and loss to follow-up are outcomes of interest.
The second bar, enrolled in care, includes members of the cohort who initially enrol in care, whether or not they are retained in care. Similarly, the third bar, initiated ART, includes all members of the cohort who started treatment. The fourth bar, retained on ART for 12 months, shows the proportion of patients who continue on antiretroviral therapy and the sixth bar measures viral suppression. In situations where a low proportion of ART patients receive viralloadtesting,anadditionalbar(thefifth)showingthenumbertestedcanbeinsertedasshown in the cumulative cross-sectional cascade graph described in the previous section.
Interpretation of the cascade: As in the previous cascade in section 3.1, the most substantial gap (yellow arrow) shown in the example in Figure 7 is between diagnosis andenrolmentincare.OnlyabouthalfofthePLHIVdiagnosedduringaspecificcalendaryear enrolled in care by the end of the two-year follow-up period. Since these data are generatedforindividualsandlinkedbyuniqueidentifiercodes,thisfindingislikelytoreflectthetruesituation.However,itwouldbenecessarytofirstcheckforduplicationandresulting overestimation of the number of PLHIV diagnosed and included in the cohort in thefirstbarbeforedrawingconclusions.
The interpretation of subsequent bars in the graph after enrolment in care would be similar to the cumulative cross-sectional cascade graph illustrated at Figure 6. The number of PLHIV expected to initiate ART during the two-year period depends on their stage of disease at the time of initial diagnosis and enrolment in care. In other words, it depends on their CD4 count at the time of entry into the cohort. Additional clinical information wouldbeneededtoassesstheprogrammaticimplicationsofthefindingsafterthestageofenrolment in care.
Figure 7. HIV services for a cohort of PLHIV diagnosed in 20XX
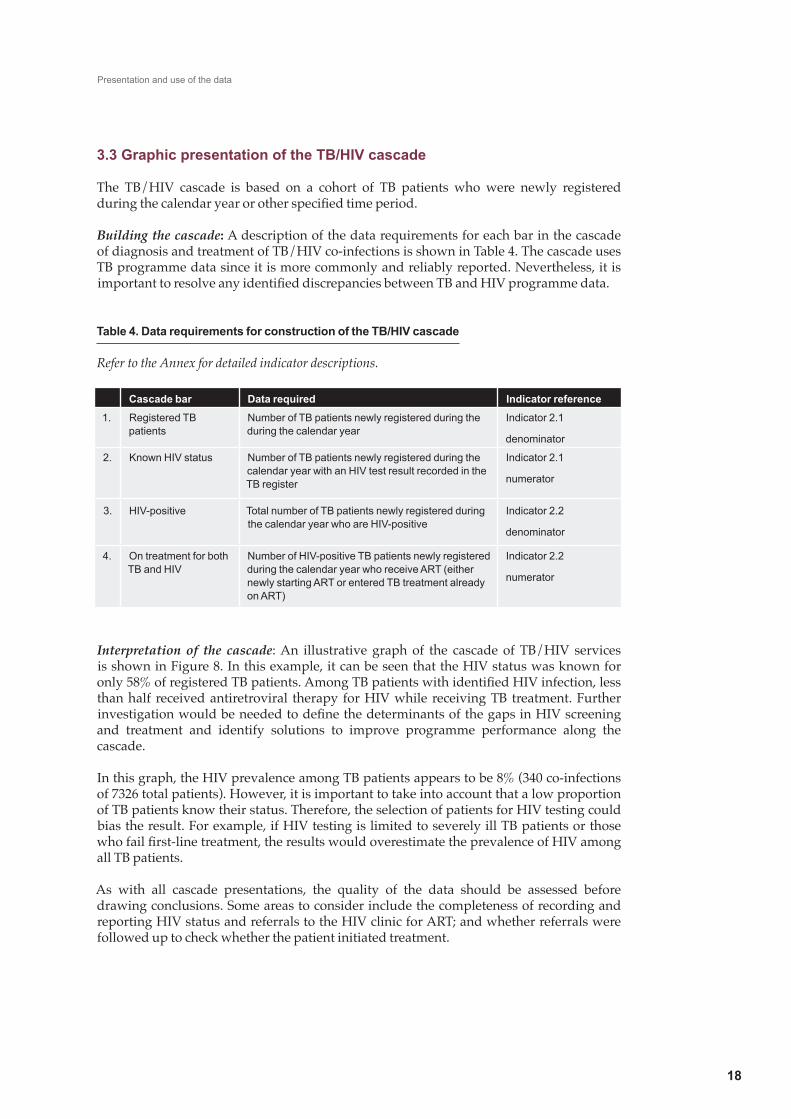
3.3 Graphic presentation of the TB/HIV cascade
The TB/HIV cascade is based on a cohort of TB patients who were newly registered duringthecalendaryearorotherspecifiedtimeperiod.
Building the cascade: A description of the data requirements for each bar in the cascade of diagnosis and treatment of TB/HIV co-infections is shown in Table 4. The cascade uses TB programme data since it is more commonly and reliably reported. Nevertheless, it is importanttoresolveanyidentifieddiscrepanciesbetweenTBandHIVprogrammedata.
Table 4. Data requirements for construction of the TB/HIV cascade
Refer to the Annex for detailed indicator descriptions.
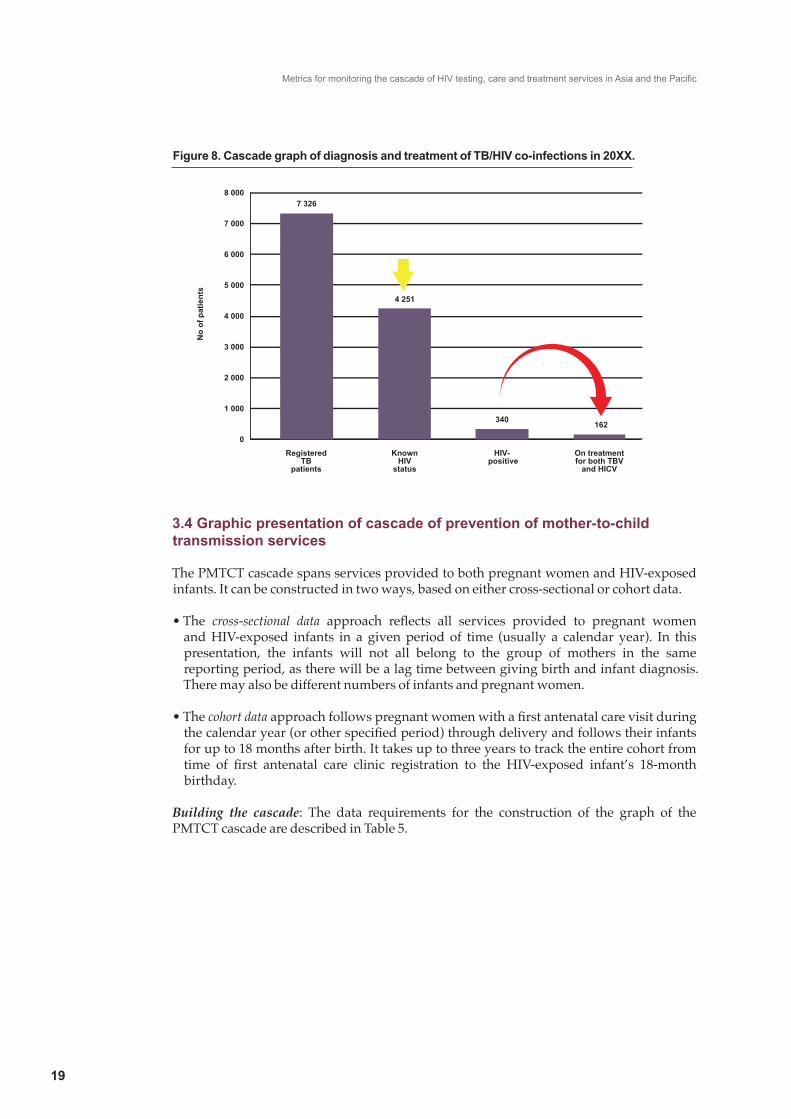
Interpretation of the cascade: An illustrative graph of the cascade of TB/HIV services is shown in Figure 8. In this example, it can be seen that the HIV status was known for only58%ofregisteredTBpatients.AmongTBpatientswithidentifiedHIVinfection,lessthan half received antiretroviral therapy for HIV while receiving TB treatment. Further investigationwouldbeneededtodefinethedeterminantsofthegapsinHIVscreeningand treatment and identify solutions to improve programme performance along the cascade.
In this graph, the HIV prevalence among TB patients appears to be 8% (340 co-infections of 7326 total patients). However, it is important to take into account that a low proportion of TB patients know their status. Therefore, the selection of patients for HIV testing could bias the result. For example, if HIV testing is limited to severely ill TB patients or those whofailfirst-linetreatment,theresultswouldoverestimatetheprevalenceofHIVamongall TB patients.
As with all cascade presentations, the quality of the data should be assessed before drawing conclusions. Some areas to consider include the completeness of recording and reporting HIV status and referrals to the HIV clinic for ART; and whether referrals were followed up to check whether the patient initiated treatment.
Presentation and use of the data
18
Cascade bar Data required Indicator reference
1. Registered TB patients
Number of TB patients newly registered during the during the calendar year
Indicator 2.1
denominator
2. Known HIV status Number of TB patients newly registered during the calendar year with an HIV test result recorded in the TB register
Indicator 2.1
numerator
3. HIV-positive Total number of TB patients newly registered during the calendar year who are HIV-positive
Indicator 2.2
denominator
4. On treatment for both TB and HIV
Number of HIV-positive TB patients newly registered during the calendar year who receive ART (either newly starting ART or entered TB treatment already on ART)
Indicator 2.2
numerator
Metrics for monitoring the cascade of HIV testing, care and treatment services in Asia and the Pacific
19
Figure 8. Cascade graph of diagnosis and treatment of TB/HIV co-infections in 20XX.
3.4 Graphic presentation of cascade of prevention of mother-to-child transmission services
The PMTCT cascade spans services provided to both pregnant women and HIV-exposed infants. It can be constructed in two ways, based on either cross-sectional or cohort data.
•The cross-sectional data approach reflects all services provided to pregnant womenand HIV-exposed infants in a given period of time (usually a calendar year). In this presentation, the infants will not all belong to the group of mothers in the same reporting period, as there will be a lag time between giving birth and infant diagnosis. There may also be different numbers of infants and pregnant women.
•Thecohort dataapproachfollowspregnantwomenwithafirstantenatalcarevisitduringthecalendaryear(orotherspecifiedperiod)throughdeliveryandfollowstheirinfantsfor up to 18 months after birth. It takes up to three years to track the entire cohort from time of first antenatal care clinic registration to the HIV-exposed infant’s 18-monthbirthday.
Building the cascade: The data requirements for the construction of the graph of the PMTCT cascade are described in Table 5.
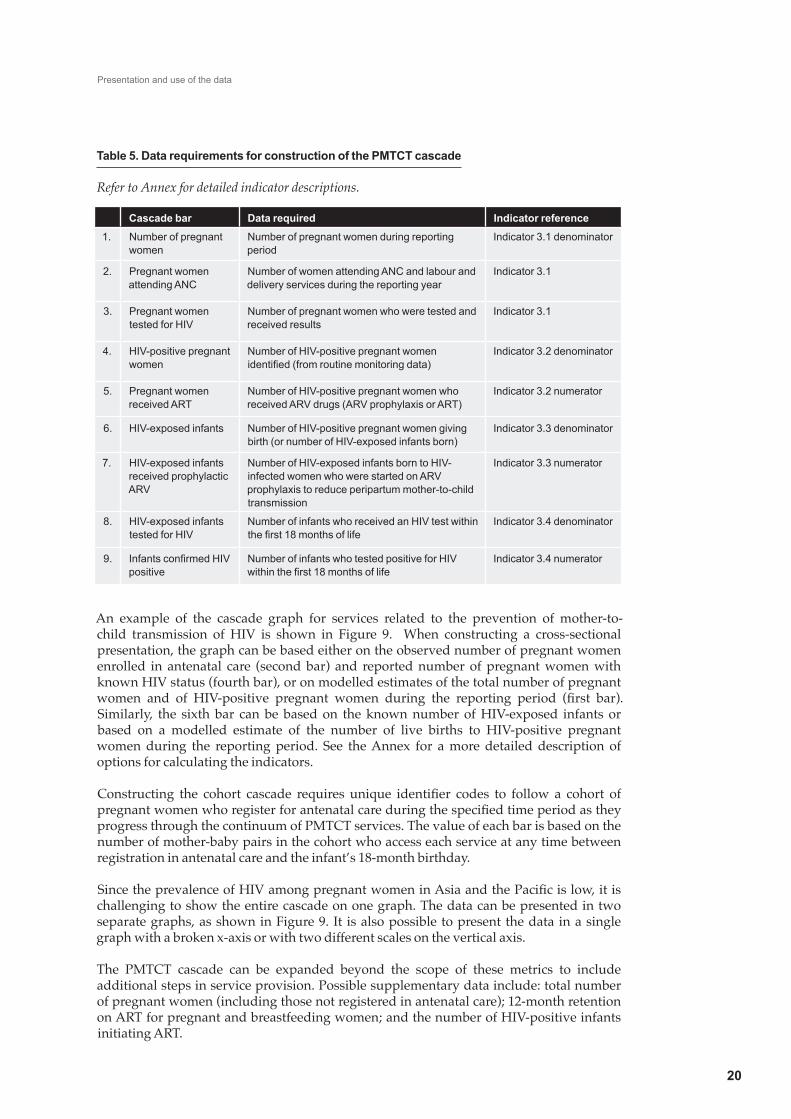
Table 5. Data requirements for construction of the PMTCT cascade
Refer to Annex for detailed indicator descriptions.
An example of the cascade graph for services related to the prevention of mother-to-child transmission of HIV is shown in Figure 9. When constructing a cross-sectional presentation, the graph can be based either on the observed number of pregnant women enrolled in antenatal care (second bar) and reported number of pregnant women with known HIV status (fourth bar), or on modelled estimates of the total number of pregnant women and of HIV-positive pregnant women during the reporting period (first bar).Similarly, the sixth bar can be based on the known number of HIV-exposed infants or based on a modelled estimate of the number of live births to HIV-positive pregnant women during the reporting period. See the Annex for a more detailed description of options for calculating the indicators.
Constructing the cohort cascade requires unique identifier codes to follow a cohort ofpregnantwomenwhoregisterforantenatalcareduringthespecifiedtimeperiodastheyprogress through the continuum of PMTCT services. The value of each bar is based on the number of mother-baby pairs in the cohort who access each service at any time between registration in antenatal care and the infant’s 18-month birthday.
SincetheprevalenceofHIVamongpregnantwomeninAsiaandthePacificislow,itischallenging to show the entire cascade on one graph. The data can be presented in two separate graphs, as shown in Figure 9. It is also possible to present the data in a single graph with a broken x-axis or with two different scales on the vertical axis.
The PMTCT cascade can be expanded beyond the scope of these metrics to include additional steps in service provision. Possible supplementary data include: total number of pregnant women (including those not registered in antenatal care); 12-month retention on ART for pregnant and breastfeeding women; and the number of HIV-positive infants initiating ART.
Presentation and use of the data
20
Cascade bar Data required Indicator reference
1. Number of pregnant women
Number of pregnant women during reporting period
Indicator 3.1 denominator
2. Pregnant women attending ANC
Number of women attending ANC and labour and delivery services during the reporting year
Indicator 3.1
3. Pregnant women tested for HIV
Number of pregnant women who were tested and received results
Indicator 3.1
4. HIV-positive pregnant women
Number of HIV-positive pregnant women identified (from routine monitoring data)
Indicator 3.2 denominator
5. Pregnant women received ART
Number of HIV-positive pregnant women who received ARV drugs (ARV prophylaxis or ART)
Indicator 3.2 numerator
6. HIV-exposed infants Number of HIV-positive pregnant women giving birth (or number of HIV-exposed infants born)
Indicator 3.3 denominator
7. HIV-exposed infants received prophylactic ARV
Number of HIV-exposed infants born to HIV-infected women who were started on ARV prophylaxis to reduce peripartum mother-to-child transmission
Indicator 3.3 numerator
8. HIV-exposed infants tested for HIV
Number of infants who received an HIV test within the first 18 months of life
Indicator 3.4 denominator
9. Infants confirmed HIV positive
Number of infants who tested positive for HIV within the first 18 months of life
Indicator 3.4 numerator

Metrics for monitoring the cascade of HIV testing, care and treatment services in Asia and the Pacific
21
Interpretation of the cascade: In the example shown in Figure 9, the largest gaps in the programme are in providing antiretroviral drugs to HIV-positive pregnant women and HIV-exposed infants (shown by yellow arrows). Further investigation of the data would be needed to establish the data quality and completeness of reporting, as well as the type of antiretroviral regimens provided and whether there were geographical variations in coverage. Discussions with all relevant stakeholders, from both maternal and child health and HIV services, are needed to understand the determinants of the overall low treatment coverage and identify strategies for improvement.
AnothergapidentifiedintheexampleisthelowproportionofHIV-exposedinfantstestedforHIVwithinthefirstyearoflife(shownbytheredarrow).SincerecordingandreportingHIV testing data requires coordination between maternal and child health services and the paediatrics department, it is important to assess the completeness of reporting before drawing any conclusions. Once the quality of the data is established, further assessment of barriers to HIV testing of infants is needed, followed by development of an action plan to address the challenges and improve programme performance.
Assessment of the proportion of pregnant women with known HIV status depends on the national guidelines for HIV screening during pregnancy. Some countries with concentrated epidemics recommend screening only among women with high risk of HIV, while others recommend HIV testing for all pregnant women.
Figure 9. Cascade graphs for prevention of mother-to-child transmission of HIV

3.5 Dashboard of indicators
All of the indicators in the metrics, both cascade and programme indicators, can be presented on a dashboard to show performance. When the cascade indicators are shown on a dashboard, it is important to understand that they are a cross-sectional representation and thus represent different groups of individuals in different stages of the cascade. For example, indicator 1.2 (ratio of newly diagnosed to newly enrolled in care) is measuring PLHIV in the early phases of the cascade, while indicator 1.6 (12-month ART retention) is based on PLHIV in the later phases. While the cascade indicators can be shown either as bar graphs (Figures 10 and 11) or on a dashboard, the programme indicators can only be presented on a dashboard.
Building the dashboard: There are many creative ways to present dashboard data, using a combination of charts and graphs to show the results. Dashboards can be complex and require considerable skill to create. On the other hand, they can be very simple.
Figures 10 and 11 are examples of two different dashboard presentations for the HIV programme indicators, both of which are easy to construct. In Figure 10, the indicators are presented as a percentage and assessed according to color-coded categories. In this example, values under 50% are coded red, 50-79% are yellow, and values of 80% or higher are coded green. The range for each of the color categories can be adjusted according to local context. Although all of the categories are the same for each indicator in the example shown in Figure 10, the category range can be adjusted for each indicator according to the local targets for that indicator. In Figure 11, the same data are presented as a bar graph, with color-coded bars to represent low, medium and high values on the indicators.
Figure 10. Example of dashboard presentation for selected HIV programme indicators
Presentation and use of the data
22
Box 5: Dashboard of indicators
Strengths
• Shows recent programme performance and actionable information
• Simple calculation of indicators so can be updated frequently
• Can be used for both cascade and programme indicators
• Does not necessarily require unique identifier codes or electronic database
Limitations
• Does not track individuals as they progress through the continuum of care
• Each indicator measures a different group of individuals
4 Programme indicators Value 0-49% 50-79% 80-100%
4.1 % of MSM tested for HIV in the past 12 months
40%
4.2 % of PLHIV enrolled in care whose partner has been tested
56%
4.5 % CD4 count above 200 cells/mm3 at time of enrollment in HIV care
81%
4.6 % of PLHIV starting ART within 30 days of eligibility
92%
4.7 % of on time drug pick-up 85%
4.8 % of months with no ARV stock-outs 100%

Metrics for monitoring the cascade of HIV testing, care and treatment services in Asia and the Pacific
23
Figure 11. Alternative dashboard presentation of HIV programme indicators
(Key: red 0-49%; yellow 50-79%; green >80%)
In this hypothetical example, it can be clearly seen that the area most in need of increased attention and improvement is coverage of HIV testing among men who have sex with men (MSM).Aswithalloftheindicatorsinthemetrics,thefirststepistoassessthequalityofthe data used in calculating the value. A detailed description of the data requirements and challenges involved in accurate reporting is included in Annex 1. Further investigation of the coverage for different geographical areas and other key populations and performance on additional programme indicators not included in the metrics will provide more information. In addition, discussions with health care and community stakeholders will contribute to understanding the determinants of the low testing coverage and identify strategies for improvement.
For programme assessment, it is also helpful to present the trend over time for individual indicators to assess progress/improvements over time (Figure 12).
Figure 12. Example of trend graph to show performance over time for a single indicator
Source: Cambodia NCHADS. Continuous quality improvement programme.
Annex: Detailed description of indicators
2424
1.1 Percentage of people living with HIV who are diagnosed
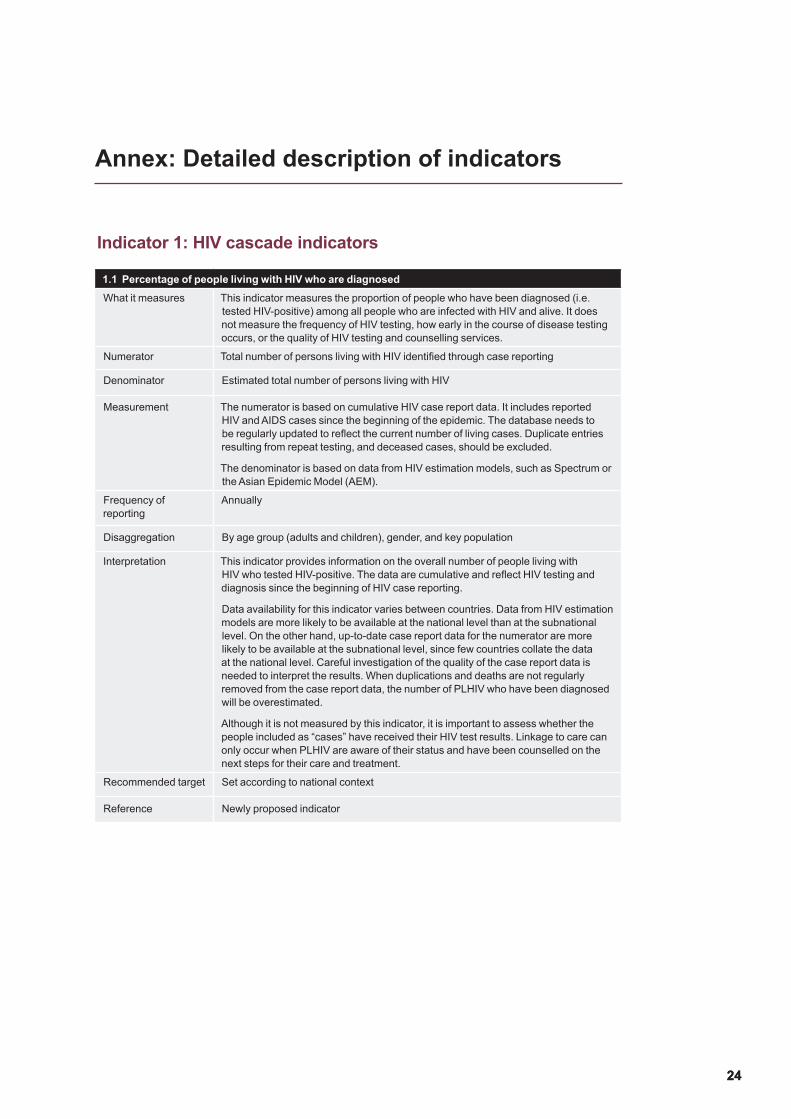
What it measures This indicator measures the proportion of people who have been diagnosed (i.e. tested HIV-positive) among all people who are infected with HIV and alive. It does not measure the frequency of HIV testing, how early in the course of disease testing occurs, or the quality of HIV testing and counselling services.
Numerator Total number of persons living with HIV identified through case reporting
Denominator Estimated total number of persons living with HIV
Measurement The numerator is based on cumulative HIV case report data. It includes reported HIV and AIDS cases since the beginning of the epidemic. The database needs to be regularly updated to reflect the current number of living cases. Duplicate entries resulting from repeat testing, and deceased cases, should be excluded.
The denominator is based on data from HIV estimation models, such as Spectrum or the Asian Epidemic Model (AEM).
Frequency of reporting
Annually
Disaggregation By age group (adults and children), gender, and key population
Interpretation This indicator provides information on the overall number of people living with HIV who tested HIV-positive. The data are cumulative and reflect HIV testing and diagnosis since the beginning of HIV case reporting.
Data availability for this indicator varies between countries. Data from HIV estimation models are more likely to be available at the national level than at the subnational level. On the other hand, up-to-date case report data for the numerator are more likely to be available at the subnational level, since few countries collate the data at the national level. Careful investigation of the quality of the case report data is needed to interpret the results. When duplications and deaths are not regularly removed from the case report data, the number of PLHIV who have been diagnosed will be overestimated.
Although it is not measured by this indicator, it is important to assess whether the people included as “cases” have received their HIV test results. Linkage to care can only occur when PLHIV are aware of their status and have been counselled on the next steps for their care and treatment.
Recommended target Set according to national context
Reference Newly proposed indicator
Indicator 1: HIV cascade indicators

Metrics for monitoring the cascade of HIV testing, care and treatment services in Asia and the Pacific
25
1.2 Ratio of patients newly enrolled in care to people who test positive for HIV
What it measures This indicator measures the linkage between diagnosis and HIV care and treatment. It measures access to and uptake of HIV care and treatment services following a positive HIV test. In situations where unique identifier codes (UIC) are not available, this indicator measures the ratio of PLHIV newly enrolled in care to PLHIV diagnosed during the reporting period. It is a proxy measure for the proportion of newly diagnosed PLHIV who enroll in care. The actual proportion can be measured only in areas where UIC are available.
When UIC are available, this indicator measures the proportion of HIV-positive individuals who are enrolled in HIV care and treatment services after testing positive.
Numerator Number of patients newly enrolled in HIV care services (pre-ART or ART) for the first time in the reporting period
Denominator Number of persons who tested positive for HIV in the reporting period
Measurement By routine patient monitoring data (HIV testing and counselling registers and HIV clinic records)
The numerator is limited to PLHIV who are enrolled in HIV care services for the first time. HIV care includes both pre-ART care and ART. Enrolled in care is defined as registered in HIV care and received a clinical assessment of ART eligibility (by clinical staging, CD4 count, and/or viral load test).
PLHIV who are returning to HIV care and treatment after a period of treatment interruption and patients transferring in from another care facility should not be counted in the numerator. Efforts should be made to avoid double-counting individuals who access care at multiple service delivery sites.
Likewise, people who seek repeat HIV testing to confirm their results may be double-counted in the denominator. Efforts should be made to determine the percentage of people who re-test to correct for this. HIV testing and counselling programmes should also ensure that routine confirmatory tests (as part of the HIV testing algorithm) are not counted in the denominator.
With unique identifier codes:
When unique identifiers are assigned at the time of diagnosis, this indicator can be calculated as the percentage of persons who received a positive HIV test during the reporting period and enrolled in HIV care and treatment services within a defined period of time after diagnosis. The time period between diagnosis and enrolment can be adjusted according to the local context. Modifications to the definition of the indicator to be used with UICs are shown below:
Numerator: Number of persons who received a positive HIV test during the reporting period and enrolled in HIV care and treatment within a defined period of time after diagnosis
Denominator: Total number of persons who receive a positive HIV test during the reporting period
Frequency of reporting Annually
Disaggregation By age group (adults and children), gender, and key population
Indicator 1: HIV cascade indicators (cont.)

Annex
26
1.2 Ratio of patients newly enrolled in care to people who test positive for HIV (cont.)
Interpretation In the absence of unique identifiers, this ratio serves as a proxy measure for the percentage of newly diagnosed HIV patients who access care and treatment in a timely fashion. It does not track whether specific HIV-positive individuals enrol in care and can be measured only in geographical areas where both HIV testing and treatment services are available.
When the ratio approaches 1, it suggests that people who have been diagnosed with HIV are adequately accessing HIV care and treatment services.
When registration and clinical assessment for ART eligibility occurs at the point of testing, some patients may not return for a clinic visit after receiving their results. Therefore, the indicator may not measure meaningful enrolment in care in such cases.
Several factors contribute to the lack of precision of the calculated ratio, including double counting, misclassification of PLHIV who returned after a period of treatment interruption, delayed enrolment in care and treatment services after a positive test, and movement of PLHIV in or out of the catchment area to access care and treatment services. Small variations in the ratio may reflect these influences rather than provide information about linkages between services. Nevertheless, a very low ratio (i.e. <0.7) suggests suboptimal access to care and requires further investigation.
When UIC are available, this indicator measures timely enrolment in care and treatment services after diagnosis.
Recommended target Set according to national and local context.
When UICs are not available, a suggested target ratio is >0.7.
Reference Adaptation of indicator D1 in HIV Testing and Counselling M&E guide, based on the field test of the metrics (21)
Indicator 1: HIV cascade indicators (cont.)
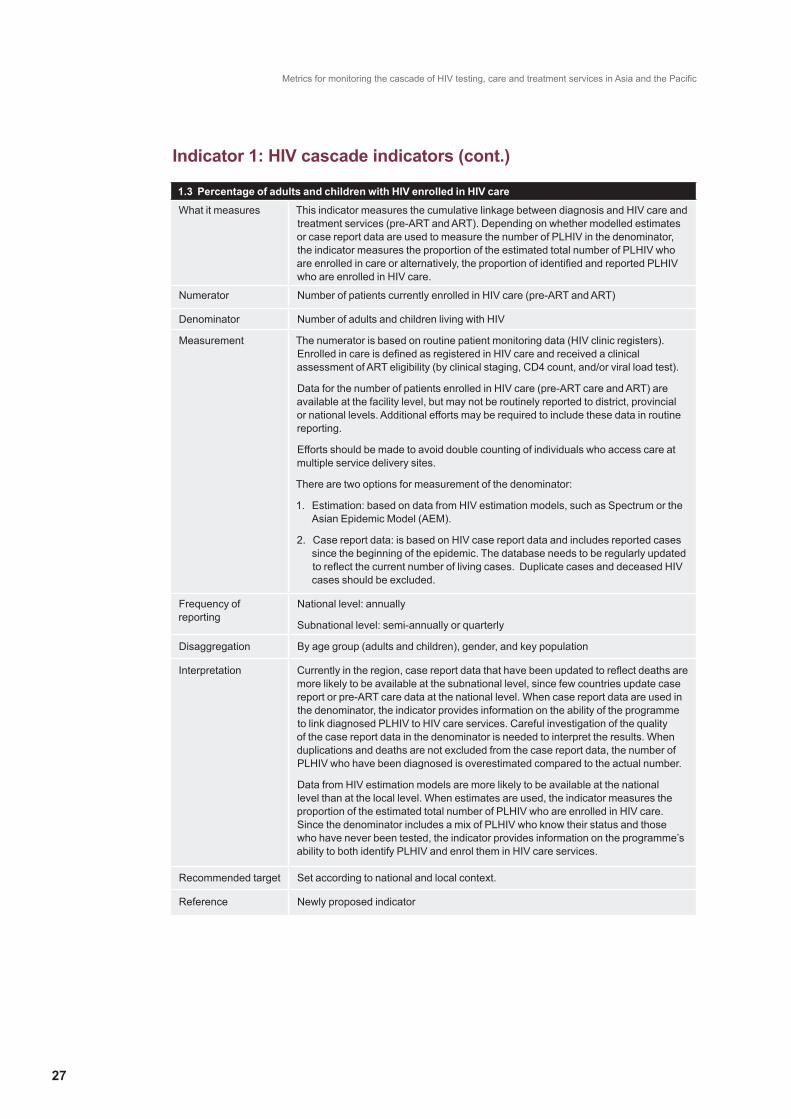
Metrics for monitoring the cascade of HIV testing, care and treatment services in Asia and the Pacific
27
1.3 Percentage of adults and children with HIV enrolled in HIV care
What it measures This indicator measures the cumulative linkage between diagnosis and HIV care and treatment services (pre-ART and ART). Depending on whether modelled estimates or case report data are used to measure the number of PLHIV in the denominator, the indicator measures the proportion of the estimated total number of PLHIV who are enrolled in care or alternatively, the proportion of identified and reported PLHIV who are enrolled in HIV care.
Numerator Number of patients currently enrolled in HIV care (pre-ART and ART)
Denominator Number of adults and children living with HIV
Measurement The numerator is based on routine patient monitoring data (HIV clinic registers). Enrolled in care is defined as registered in HIV care and received a clinical assessment of ART eligibility (by clinical staging, CD4 count, and/or viral load test).
Data for the number of patients enrolled in HIV care (pre-ART care and ART) are available at the facility level, but may not be routinely reported to district, provincial or national levels. Additional efforts may be required to include these data in routine reporting.
Efforts should be made to avoid double counting of individuals who access care at multiple service delivery sites.
There are two options for measurement of the denominator:
1. Estimation: based on data from HIV estimation models, such as Spectrum or the Asian Epidemic Model (AEM).
2. Case report data: is based on HIV case report data and includes reported cases since the beginning of the epidemic. The database needs to be regularly updated to reflect the current number of living cases. Duplicate cases and deceased HIV cases should be excluded.
Frequency of reporting
National level: annually
Subnational level: semi-annually or quarterly
Disaggregation By age group (adults and children), gender, and key population
Interpretation Currently in the region, case report data that have been updated to reflect deaths are more likely to be available at the subnational level, since few countries update case report or pre-ART care data at the national level. When case report data are used in the denominator, the indicator provides information on the ability of the programme to link diagnosed PLHIV to HIV care services. Careful investigation of the quality of the case report data in the denominator is needed to interpret the results. When duplications and deaths are not excluded from the case report data, the number of PLHIV who have been diagnosed is overestimated compared to the actual number.
Data from HIV estimation models are more likely to be available at the national level than at the local level. When estimates are used, the indicator measures the proportion of the estimated total number of PLHIV who are enrolled in HIV care. Since the denominator includes a mix of PLHIV who know their status and those who have never been tested, the indicator provides information on the programme’s ability to both identify PLHIV and enrol them in HIV care services.
Recommended target Set according to national and local context.
Reference Newly proposed indicator
Indicator 1: HIV cascade indicators (cont.)
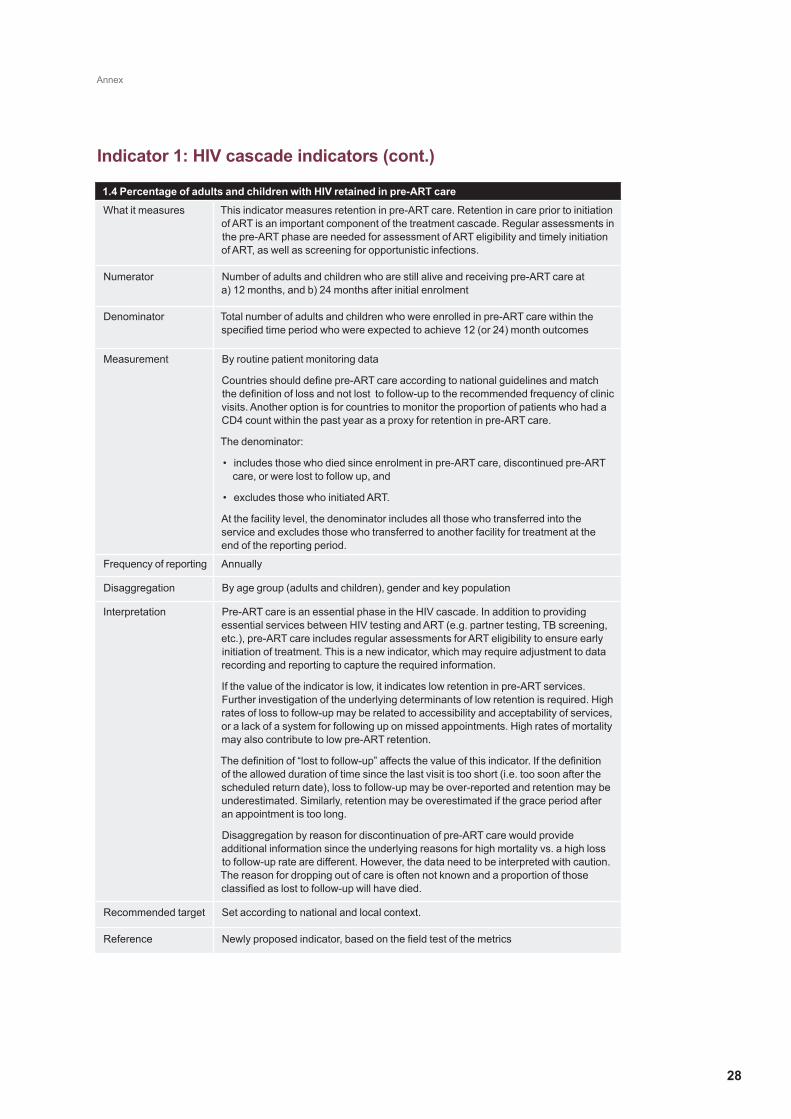
Annex
28
1.4 Percentage of adults and children with HIV retained in pre-ART care
What it measures This indicator measures retention in pre-ART care. Retention in care prior to initiation of ART is an important component of the treatment cascade. Regular assessments in the pre-ART phase are needed for assessment of ART eligibility and timely initiation of ART, as well as screening for opportunistic infections.
Numerator Number of adults and children who are still alive and receiving pre-ART care at a) 12 months, and b) 24 months after initial enrolment
Denominator Total number of adults and children who were enrolled in pre-ART care within the specified time period who were expected to achieve 12 (or 24) month outcomes
Measurement By routine patient monitoring data
Countries should define pre-ART care according to national guidelines and match the definition of loss and not lost to follow-up to the recommended frequency of clinic visits. Another option is for countries to monitor the proportion of patients who had a CD4 count within the past year as a proxy for retention in pre-ART care.
The denominator:
• includes those who died since enrolment in pre-ART care, discontinued pre-ART care, or were lost to follow up, and
• excludes those who initiated ART.
At the facility level, the denominator includes all those who transferred into the service and excludes those who transferred to another facility for treatment at the end of the reporting period.
Frequency of reporting Annually
Disaggregation By age group (adults and children), gender and key population
Interpretation Pre-ART care is an essential phase in the HIV cascade. In addition to providing essential services between HIV testing and ART (e.g. partner testing, TB screening, etc.), pre-ART care includes regular assessments for ART eligibility to ensure early initiation of treatment. This is a new indicator, which may require adjustment to data recording and reporting to capture the required information.
If the value of the indicator is low, it indicates low retention in pre-ART services. Further investigation of the underlying determinants of low retention is required. High rates of loss to follow-up may be related to accessibility and acceptability of services, or a lack of a system for following up on missed appointments. High rates of mortality may also contribute to low pre-ART retention.
The definition of “lost to follow-up” affects the value of this indicator. If the definition of the allowed duration of time since the last visit is too short (i.e. too soon after the scheduled return date), loss to follow-up may be over-reported and retention may be underestimated. Similarly, retention may be overestimated if the grace period after an appointment is too long.
Disaggregation by reason for discontinuation of pre-ART care would provide additional information since the underlying reasons for high mortality vs. a high loss to follow-up rate are different. However, the data need to be interpreted with caution. The reason for dropping out of care is often not known and a proportion of those classified as lost to follow-up will have died.
Recommended target Set according to national and local context.
Reference Newly proposed indicator, based on the field test of the metrics
Indicator 1: HIV cascade indicators (cont.)

Metrics for monitoring the cascade of HIV testing, care and treatment services in Asia and the Pacific
29
1.5 Percentage of adults and children currently receiving antiretroviral therapy
What it measures This indicator measures progress toward universal access for antiretroviral therapy for all people living with HIV. This indicator can only be measured where HIV estimates are available, usually at the national level.
Numerator Number of adults and children currently receiving antiretroviral therapy in accordance with the nationally approved treatment protocol (or WHO standards) at the end of the reporting period
Denominator Estimated number of adults and children living with HIV
Measurement The numerator is based on routine patient monitoring data. The numerator:
• includes the number of adults and children who ever started ART minus those patients who are not currently on treatment at the end of the reporting period (died, stopped treatment, or lost to follow-up).
• does not include patients on ART only for prevention of mother-to-child transmission or post exposure prophylaxis. HIV-positive pregnant women who are on lifelong ART (Option B+ or started ART before pregnancy) are included.
The denominator is based on data from HIV estimation models, such as Spectrum or the Asian Epidemic Model (AEM).
Frequency of reporting Annually
Disaggregation By age group (adults and children), gender, and key population (if data are available)
Interpretation Basing the indicator on the total number of PLHIV in the denominator will result in lower coverage levels than reported in the past, especially if national guidelines follow 2010 WHO eligibility criteria. Approximately 85% of PLHIV are eligible for ART under the updated WHO treatment recommendations issued in 2013. It is important to note that even though the denominator is generated by estimating the total number of PLHIV, this does not imply that all PLHIV should receive ART. It does, however, provide a stable denominator for assessing trends in treatment coverage over time, irrespective of changing treatment guidelines.
This indicator does not provide information on the treatment regimen prescribed (i.e. whether it follows national guidelines) or treatment adherence (i.e. whether the regimen was taken as prescribed).
Several factors contribute to ART coverage, including service delivery infrastructure and quality, accessibility and cost of services, and patient perceptions of effectiveness and side effects of treatment.
Recommended target Set according to national and local context.
Reference Global AIDS Response Progress Reporting/Universal Access indicator 4.1 (15); 3-interlinked patient monitoring system (18)
Indicator 1: HIV cascade indicators (cont.)
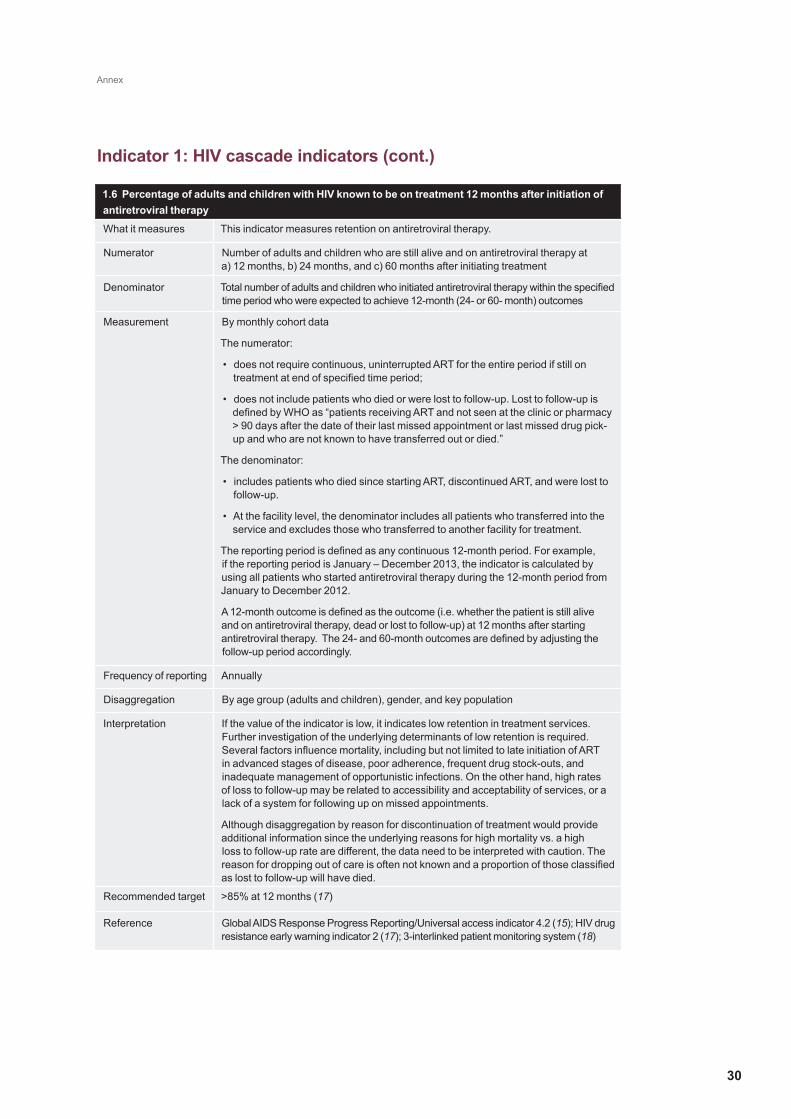
Annex
30
1.6 Percentage of adults and children with HIV known to be on treatment 12 months after initiation of antiretroviral therapy
What it measures This indicator measures retention on antiretroviral therapy.
Numerator Number of adults and children who are still alive and on antiretroviral therapy at a) 12 months, b) 24 months, and c) 60 months after initiating treatment
Denominator Total number of adults and children who initiated antiretroviral therapy within the specified time period who were expected to achieve 12-month (24- or 60- month) outcomes
Measurement By monthly cohort data
The numerator:
• does not require continuous, uninterrupted ART for the entire period if still on treatment at end of specified time period;
• does not include patients who died or were lost to follow-up. Lost to follow-up is defined by WHO as “patients receiving ART and not seen at the clinic or pharmacy > 90 days after the date of their last missed appointment or last missed drug pick-up and who are not known to have transferred out or died.”
The denominator:
• includes patients who died since starting ART, discontinued ART, and were lost to follow-up.
• At the facility level, the denominator includes all patients who transferred into the service and excludes those who transferred to another facility for treatment.
The reporting period is defined as any continuous 12-month period. For example, if the reporting period is January – December 2013, the indicator is calculated by using all patients who started antiretroviral therapy during the 12-month period from January to December 2012.
A 12-month outcome is defined as the outcome (i.e. whether the patient is still alive and on antiretroviral therapy, dead or lost to follow-up) at 12 months after starting antiretroviral therapy. The 24- and 60-month outcomes are defined by adjusting the follow-up period accordingly.
Frequency of reporting Annually
Disaggregation By age group (adults and children), gender, and key population
Interpretation If the value of the indicator is low, it indicates low retention in treatment services. Further investigation of the underlying determinants of low retention is required. Several factors influence mortality, including but not limited to late initiation of ART in advanced stages of disease, poor adherence, frequent drug stock-outs, and inadequate management of opportunistic infections. On the other hand, high rates of loss to follow-up may be related to accessibility and acceptability of services, or a lack of a system for following up on missed appointments.
Although disaggregation by reason for discontinuation of treatment would provide additional information since the underlying reasons for high mortality vs. a high loss to follow-up rate are different, the data need to be interpreted with caution. The reason for dropping out of care is often not known and a proportion of those classified as lost to follow-up will have died.
Recommended target >85% at 12 months (17)
Reference Global AIDS Response Progress Reporting/Universal access indicator 4.2 (15); HIV drug resistance early warning indicator 2 (17); 3-interlinked patient monitoring system (18)
Indicator 1: HIV cascade indicators (cont.)
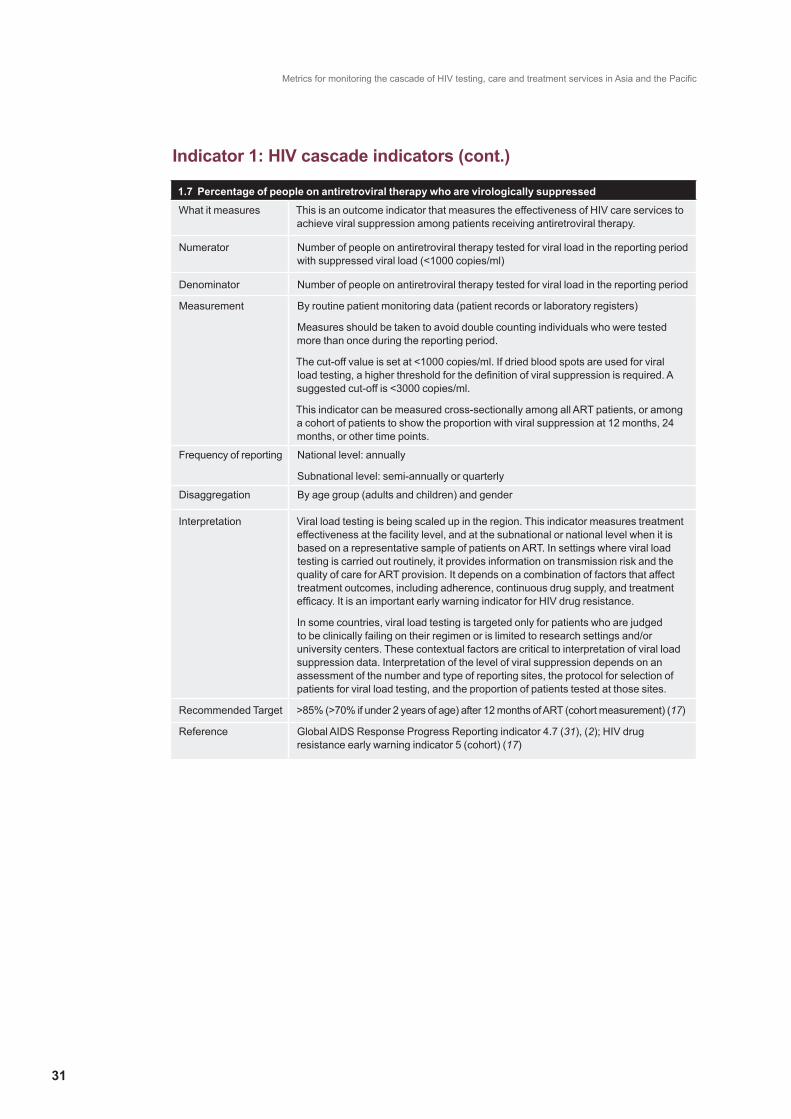
Metrics for monitoring the cascade of HIV testing, care and treatment services in Asia and the Pacific
31
1.7 Percentage of people on antiretroviral therapy who are virologically suppressed
What it measures This is an outcome indicator that measures the effectiveness of HIV care services to achieve viral suppression among patients receiving antiretroviral therapy.
Numerator Number of people on antiretroviral therapy tested for viral load in the reporting period with suppressed viral load (<1000 copies/ml)
Denominator Number of people on antiretroviral therapy tested for viral load in the reporting period
Measurement By routine patient monitoring data (patient records or laboratory registers)
Measures should be taken to avoid double counting individuals who were tested more than once during the reporting period.
The cut-off value is set at <1000 copies/ml. If dried blood spots are used for viral load testing, a higher threshold for the definition of viral suppression is required. A suggested cut-off is <3000 copies/ml.
This indicator can be measured cross-sectionally among all ART patients, or among a cohort of patients to show the proportion with viral suppression at 12 months, 24 months, or other time points.
Frequency of reporting National level: annually
Subnational level: semi-annually or quarterly
Disaggregation By age group (adults and children) and gender
Interpretation Viral load testing is being scaled up in the region. This indicator measures treatment effectiveness at the facility level, and at the subnational or national level when it is based on a representative sample of patients on ART. In settings where viral load testing is carried out routinely, it provides information on transmission risk and the quality of care for ART provision. It depends on a combination of factors that affect treatment outcomes, including adherence, continuous drug supply, and treatment efficacy. It is an important early warning indicator for HIV drug resistance.
In some countries, viral load testing is targeted only for patients who are judged to be clinically failing on their regimen or is limited to research settings and/or university centers. These contextual factors are critical to interpretation of viral load suppression data. Interpretation of the level of viral suppression depends on an assessment of the number and type of reporting sites, the protocol for selection of patients for viral load testing, and the proportion of patients tested at those sites.
Recommended Target >85% (>70% if under 2 years of age) after 12 months of ART (cohort measurement) (17)
Reference Global AIDS Response Progress Reporting indicator 4.7 (31), (2); HIV drug resistance early warning indicator 5 (cohort) (17)
Indicator 1: HIV cascade indicators (cont.)

Annex
32
2.1 Percentage of tuberculosis patients with known HIV status
What it measures This indicator assesses HIV case-finding among newly registered tuberculosis patients for HIV. It measures the percentage of TB patients with an HIV test result recorded in the TB register.
Numerator Number of tuberculosis patients registered during the reporting period with an HIV test result recorded in the TB register
Denominator Number of tuberculosis patients registered during the reporting period
Measurement By routine patient monitoring data (TB register)
The numerator includes both patients tested after enrolment in the TB register and patients with known HIV status at time of initial TB registration. Patients should have documented evidence of a positive HIV test (and/or enrolment in HIV care) or a negative HIV test at a reliable laboratory within the previous 3-6 months.
Frequency of reporting National level: annually
Subnational level: quarterly
Disaggregation By age group and gender
Interpretation A high value for this indicator suggests good collaboration between HIV and TB programmes.
Disaggregation by known and unknown HIV status at the time of initial registration in the TB clinic can provide more information. The subset of TB patients who were tested for HIV after enrolment in TB treatment (i.e. unknown status at the time of initial registration) can provide information on the ability of TB clinic services to make referrals for HIV testing and counselling and to follow up and record the results.
Recommended target Set according to national and local context. This indicator should approach 100%. (21)
Reference TB/HIV M&E Guide indicator C.1.1 (20); HIV testing and counselling M&E Guide indicator E2 (21); 3-interlinked patient monitoring system (18)
Indicator 2: TB/HIV cascade indicators
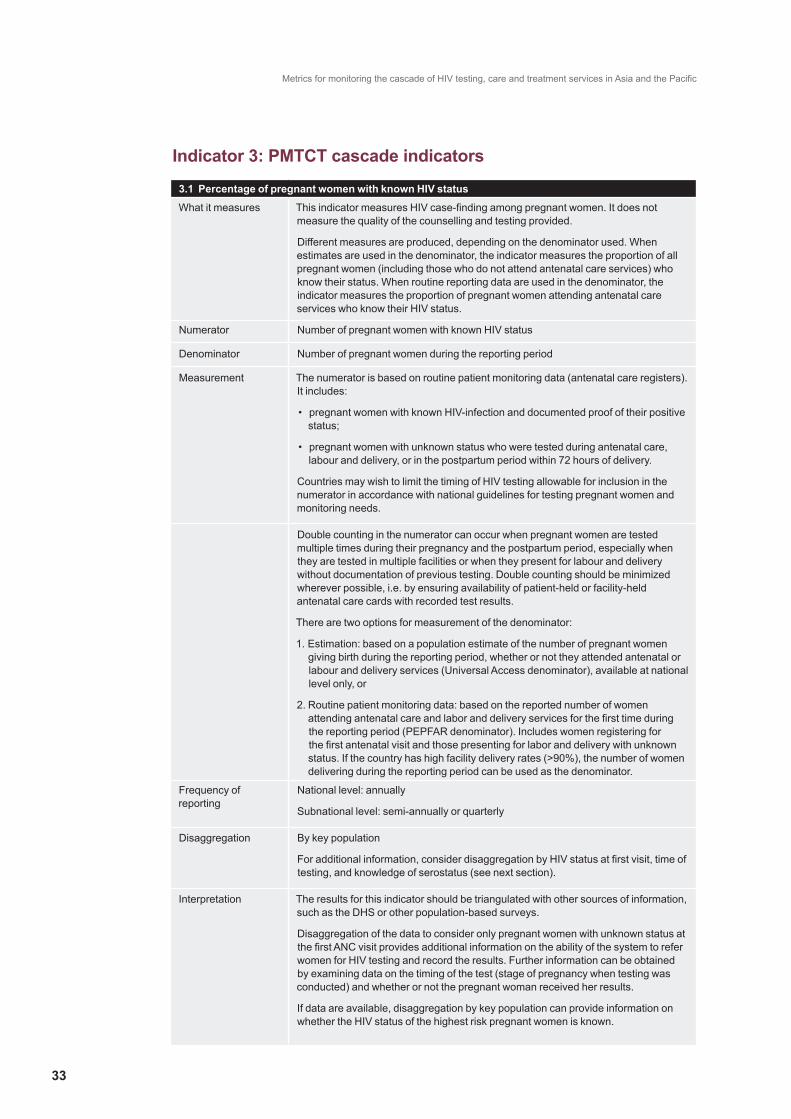
Metrics for monitoring the cascade of HIV testing, care and treatment services in Asia and the Pacific
33
Indicator 3: PMTCT cascade indicators
3.1 Percentage of pregnant women with known HIV status
What it measures This indicator measures HIV case-finding among pregnant women. It does not measure the quality of the counselling and testing provided.
Different measures are produced, depending on the denominator used. When estimates are used in the denominator, the indicator measures the proportion of all pregnant women (including those who do not attend antenatal care services) who know their status. When routine reporting data are used in the denominator, the indicator measures the proportion of pregnant women attending antenatal care services who know their HIV status.
Numerator Number of pregnant women with known HIV status
Denominator Number of pregnant women during the reporting period
Measurement The numerator is based on routine patient monitoring data (antenatal care registers). It includes:
• pregnant women with known HIV-infection and documented proof of their positive status;
• pregnant women with unknown status who were tested during antenatal care, labour and delivery, or in the postpartum period within 72 hours of delivery.
Countries may wish to limit the timing of HIV testing allowable for inclusion in the numerator in accordance with national guidelines for testing pregnant women and monitoring needs.
Double counting in the numerator can occur when pregnant women are tested multiple times during their pregnancy and the postpartum period, especially when they are tested in multiple facilities or when they present for labour and delivery without documentation of previous testing. Double counting should be minimized wherever possible, i.e. by ensuring availability of patient-held or facility-held antenatal care cards with recorded test results.
There are two options for measurement of the denominator:
1. Estimation: based on a population estimate of the number of pregnant women giving birth during the reporting period, whether or not they attended antenatal or labour and delivery services (Universal Access denominator), available at national level only, or
2. Routine patient monitoring data: based on the reported number of women attending antenatal care and labor and delivery services for the first time during the reporting period (PEPFAR denominator). Includes women registering for the first antenatal visit and those presenting for labor and delivery with unknown status. If the country has high facility delivery rates (>90%), the number of women delivering during the reporting period can be used as the denominator.
Frequency of reporting
National level: annually
Subnational level: semi-annually or quarterly
Disaggregation By key population
For additional information, consider disaggregation by HIV status at first visit, time of testing, and knowledge of serostatus (see next section).
Interpretation The results for this indicator should be triangulated with other sources of information, such as the DHS or other population-based surveys.
Disaggregation of the data to consider only pregnant women with unknown status at the first ANC visit provides additional information on the ability of the system to refer women for HIV testing and record the results. Further information can be obtained by examining data on the timing of the test (stage of pregnancy when testing was conducted) and whether or not the pregnant woman received her results.
If data are available, disaggregation by key population can provide information on whether the HIV status of the highest risk pregnant women is known.
Annex
34
3.1 Percentage of pregnant women with known HIV status (cont.)
Recommended target >90%(10)
The indicator target may need to be adjusted according to the national strategy in low prevalence and concentrated epidemics where HIV testing among pregnant women is recommended for specific sub-populations (by geographic area or risk level).
Reference Universal access indicator 3.4;(15) 3ILPMS, PEPFAR indicator P1.1.D; (24) HIV testing and counselling M&E guide indicator E1; (21) Elimination of new paediatric HIV infections in Asia-Pacific 2011-2015;(10) PMTCT M&E guide core indicator 3; (23) EMTCT M&E guide additional indicator. (2), (32) The proposed denominator option for use of routine monitoring data is based on the field test of the metrics.
Indicator 3: PMTCT cascade indicators (cont.)

Metrics for monitoring the cascade of HIV testing, care and treatment services in Asia and the Pacific
35
3.2 Percentage of HIV-positive pregnant women who received antiretroviral drugs to reduce the risk of mother-to-child transmission
What it measures This indicator measures coverage of antiretroviral prophylaxis and/or initiation of lifelong treatment among HIV-positive pregnant women during pregnancy and delivery.
When estimates are used in the denominator, the indicator measures the proportion of the estimated total number of HIV-positive pregnant women who receive antiretroviral drugs. When routine reporting data are used in the denominator, the indicator measures the proportion of identified HIV-positive pregnant women who are provided with antiretroviral drugs for PMTCT. The indicator does not measure postpartum regimens or adherence to treatment.
Numerator Number of HIV-positive pregnant women who received antiretroviral drugs during the reporting period to reduce the risk of mother-to-child transmission during pregnancy and delivery
Denominator Number of HIV-positive pregnant women during the reporting period
Measurement The numerator is based on routine patient monitoring data (antenatal care, and labour and delivery registers).
There are two options for the denominator:
1. Estimation: based on the estimated number of HIV-positive pregnant women within the reporting period determined by projection models (such as Spectrum or the Asian Epidemic Model (AEM)). If projections are unavailable, the estimated number of women who gave birth in the reporting period can be multiplied by the most recent national estimate of HIV prevalence in pregnant women. Available at national level only.
2. Routine patient monitoring data: reported number of known HIV-positive pregnant women identified within the reporting period from routine patient monitoring data.
Frequency of reporting Annually
Disaggregation By treatment regimen as follows:
1. Lifelong therapy: triple antiretroviral drug therapy for lifelong treatment (regardless of CD4 and clinical staging - Option B+)
a. Newly initiated on ART during the current pregnancy
b. Already on ART at the beginning of the current pregnancy
2. Triple maternal antiretroviral drug prophylaxis (Option B)
3. Maternal zidovudine (AZT) plus single dose nevirapine (Option A) – not currently recommended, but should be recorded until completely phased out
4. Maternal single-dose nevirapine only – not recommended, but should be recorded until completely phased out
Interpretation When disaggregated by regimen, this indicator provides information on progress toward more effective antiretroviral drug regimens and implementation of lifelong treatment for all HIV-positive pregnant women regardless of immune status (Option B+) as recommended by WHO.3
Differences in ART coverage for mothers and infants should be explored to determine the programmatic determinants and identify solutions to barriers to treatment of both mothers and infants. This indicator can be compared to indicator 3.3, the proportion of HIV-exposed infants who receive ARV drugs. Comparison of the two indicators is most valuable in situations where the mother-infant pairs are linked in the database. However in the setting of unlinked data, it must be taken into account that the pregnant mothers do not necessarily correspond to the infants. Women who are pregnant during one time period may deliver in another time period.
Indicator 3: PMTCT cascade indicators (cont.)

Annex
36
3.2 Percentage of HIV-positive pregnant women who received antiretroviral drugs to reduce the risk of mother-to-child transmission (cont.)
Recommended target >90% (10, 32)
Reference Global AIDS Response Progress Reporting indicator 3.1 (15); 3-interlinked patient monitoring system (18); PMTCT M&E guide core indicator 5 (23); PEPFAR indicator 1.2.D (24); EMTCT M&E guide core indicator (32); Elimination of new paediatric HIV infections in Asia-Pacific 2011-2015. (10) The proposed denominator option for use of routine monitoring data is based on the field test of the metrics.
3 WHO-recommended regimens for ART for PMTCT include (5): Option B+: Triple antiretroviral drug regimen during pregnancy, continued for life, regardless of CD4 count. Option B: For HIV-infected pregnant women with CD4 counts <500 cells/mm3, triple antiretroviral drug regimen during pregnancy and continued for life. For HIV-infected pregnant women with CD4 count >500 cells/mm3, triple antiretroviral drug regimen during pregnancy, discontinued after delivery and cessation of breastfeeding.
Indicator 3: PMTCT cascade indicators (cont.)
Metrics for monitoring the cascade of HIV testing, care and treatment services in Asia and the Pacific
37
3.3 Percentage of infants born to HIV-infected women provided with antiretroviral prophylaxis to reduce the risk of early mother-to-child transmission
What it measures This indicator measures progress in providing antiretroviral prophylaxis to HIV-exposed infants to reduce mother-to-child transmission of HIV.
When estimates are used in the denominator, the indicator measures the proportion of the estimated total number of HIV-exposed infants who receive ARV drugs. When routine reporting data are used in the denominator, the indicator measures the proportion of identified HIV-exposed infants who are treated.
Numerator Number of infants born to HIV-infected women during the reporting period who received ARV prophylaxis to reduce early mother-to-child transmission in the first six weeks postpartum
Denominator Number of live births to HIV-positive pregnant women during the reporting period
Measurement The numerator is based on routine patient monitoring data. There are three options for measuring the numerator:
1. At the point of ARV drug dispensing: this option is recommended for sites with low facility delivery rates. Systems should be in place to minimize double-counting when drugs are provided on more than one visit or at more than one drug pick-up point.
2. At the time of delivery: this is the most reliable method in setting with high facility delivery rates. The number of HIV-exposed infants who receive ARV drugs before discharge from the labour and delivery ward is reported from the labour and delivery register.
3. At postnatal or child health sites: this option is recommended in setting where postnatal visit attendance is high and the HIV status of the child is recorded in the patient registers.
There are two options for measurement of the denominator:
1. Estimation: The estimated number of HIV-positive pregnant women can be used as a proxy for the number of infants in need of prophylaxis, determined by projection models (such as Spectrum or the Asian Epidemic Model (AEM)). An alternative method in settings where projections are unavailable is to multiply the estimated number of women who gave birth in the past 12 months by the most recent national estimate of HIV prevalence in pregnant women. Available at national level only.
2. Routine patient monitoring data to determine the number of live births to identified HIV-positive pregnant women.
Frequency of reporting Annually
Disaggregation None recommended
Interpretation The indicator measures the proportion of infants who were provided with ARVs, but does not provide information on how many infants were treated with the drugs. It is not a measure of adherence.
This indicator can be compared to indicator 3.2, the proportion of HIV-positive pregnant women who receive ARV drugs during their pregnancy. However, if the indicators are calculated for the same time period with unlinked data, the pregnant mothers are a different group than the infants. Women who are pregnant during one time period may deliver in another time period. Comparison of the two indicators is most valuable in situations where the mother-infant pairs are linked in the database. Differences in ART coverage for mothers and infants should be explored to determine the programmatic determinants and identify solutions to barriers to treatment of both mothers and infants.
Recommended target >90% (10)
Reference Universal access 3.7 (15); PMTCT M&E guide core indicator 6 (23); EMTCT M&E guide additional indicator (32); Elimination of new paediatric HIV infections in Asia-Pacific 2011-2015. (10) The proposed denominator option for use of routine monitoring data is based on the field test of the metrics.
Indicator 3: PMTCT cascade indicators (cont.)
Annex
38
3.4 Percentage of tested HIV-exposed infants who are HIV-positive
What it measures This indicator measures the HIV-positivity rate of infants born to HIV-positive mothers who are tested. It does not measure the true transmission rate because it is based on the subset of infants who receive an HIV test in the first 18 months of life. It does, however, provide information on progress toward prevention of mother-to-child transmission among infants who are retained in care.
The Global AIDS Response Progress Reporting indicator 3.3 can be used to measure the transmission rate based on modelled estimates. (31)
Numerator Number of infants born to HIV-infected women during the reporting period who tested positive for HIV within 18 months
Denominator Number of infants born to HIV-infected women during the reporting period who received an HIV test within the first 18 months
Measurement By routine patient monitoring data. Measurement of this indicator requires coordination between MCH, HIV and paediatrics services.
Frequency of reporting Annually
Disaggregation None recommended
Interpretation This indicator measures the proportion of HIV exposed infants who test positive for HIV among a subset of all HIV-exposed infants. The results are based only on infants who have been followed up after delivery. It includes HIV positives with virologic testing within 2 months of birth, and those tested positive at 18 months for the babies who are breastfed by the HIV-positive mothers. These are likely to be the infants from mother-infant pairs that received ARVs for prevention of mother-to-child transmission of HIV. Therefore, the identified proportion of infected infants will be an underestimate of overall vertical transmission.
The data for this indicator are most valuable when the numerator and denominator are considered separately. When using this indicator to construct the PMTCT cascade graph, the number of HIV-exposed infants who are tested (denominator) can also be compared to the number of live births to known HIV-positive pregnant women (denominator of indicator 3.3) to determine the proportion of HIV-exposed infants who are tested in the first year of life. This provides additional information on follow-up of HIV-exposed infants.
The numerator, number of identified HIV-positive infants, provides a list for follow-up and monitoring of ART initiation, adherence and retention of infants and young children along the cascade of services.
Recommended target Set according to national and local context.
Reference Newly proposed indicator
Indicator 3: PMTCT cascade indicators (cont.)

Metrics for monitoring the cascade of HIV testing, care and treatment services in Asia and the Pacific
39
4. Programme indicators
4.1 Percentage of key populations who received an HIV test and know their results
What it measures This indicator measures utilization of HIV testing services (case-finding) among key populations. This indicator does not provide information on the quality of services or whether counselling was conducted at the time of testing.
Numerator Number of key population members (sex workers, men who have sex with men, transgenders, and people who inject drugs) who have been tested for HIV during the last 12 months and who know their results
Denominator Total number of key population members
Measurement By routine monitoring data for the numerator and population size estimates for the denominator
The numerator requires an HIV testing and counselling client register that can distinguish key population categories and take into account both community-based and facility-based testing. However, members of key population groups may not identify their risk factors at the time of testing, resulting in misclassification of risk group. Unique identifiers are recommended where possible to avoid double counting of persons who are tested more than once during the reporting period.
For the denominator, most countries have available national key population size estimates4, which were developed using a combination of extrapolation techniques and/or population-based proportions. However, these are likely to be rough estimates and not precise enough to be used as denominators for testing data at the national level.
Key population size estimates are also needed for calculating the indicator at subnational level, but these are not uniformly available in all areas. In areas without existing population size estimates, it may be possible to derive estimates by making some assumptions about similarities (or differences) between locations with and without data. However, estimates developed using this method should be used with caution because they may not be accurate.
Survey data can be used as an alternative method of calculating this indicator and this method is the basis for Global AIDS Response Progress Reporting (GARPR). Although surveys provide a direct proportion of key populations who have been tested in the previous 12 months and know their results, they are usually conducted infrequently and only in a subset of sites that are not nationally representative. Typically there are wide geographical variations in testing coverage, depending on the availability and effectiveness of outreach and testing services. At the subnational level, surveys are a useful source of information in areas where they have recently been conducted.
When size estimations for key populations or recent survey data are not available for the catchment area, routine patient monitoring data from outreach services can provide an alternative denominator. In this case, interpretation of results must take into consideration that this will result in a different measure entirely. It will reflect uptake of testing services only among key populations reached through outreach services. Nevertheless, this may provide some information on the ability of programmes to regularly test key population members.
Frequency of reporting National level: annually
Subnational level: semi-annually or quarterly
Disaggregation By key population and age group (<15 and >15 years)
In concentrated epidemics, key populations usually include sex workers, men who have sex with men, transgenders, and people who inject drugs. The specific populations monitored will depend on local relevance and feasibility.

Annex
40
4.1 Percentage of key populations who received an HIV test and know their results (cont.)
Interpretation Reaching the target for this indicator depends on outreach and education coverage of key populations and HIV testing and counselling services that are accessible, acceptable, and trusted by the community.
This indicator is difficult to measure in most countries due to lack of complete and reliable reporting systems for both positive and negative HIV test results and risk factors of people accessing testing services. In addition, reliable population size estimates are often not available for key populations. Nevertheless, it is a key indicator for HIV programme effectiveness in concentrated epidemics. Triangulation of all sources of coverage data is needed to determine the best estimate of HIV test coverage among key populations.
Recommended target Set according to national and local context.
Reference Global AIDS Response Progress Reporting indicators 1.9/1.13/2.4. (15) HIV testing and counselling M&E guide indicator C4a. (21) The proposed option for use of routine monitoring data is based on the field test of the metrics.
4 For more information, see Guidelines on Estimating the Size of Populations Most at Risk to HIV. WHO, UNAIDS 2010 http://www.who.int/hiv/pub/surveillance/final_estimating_populations_en.pdf (accessed 20 January 2014).
4. Programme indicators (cont.)

Metrics for monitoring the cascade of HIV testing, care and treatment services in Asia and the Pacific
41
4.2 Percentage of individuals aged >15 years newly enrolled in care whose sexual partner was tested for HIV
What it measures This indicator monitors the uptake of HIV testing among partners of people living with HIV newly enrolled in care. It does not take into account multiple sexual partners or changing partners during the reporting period.
Numerator Number of individuals aged >15 years newly enrolled in HIV care during the reporting period and whose sexual partner was tested for HIV within 6 months of enrolment
Denominator Total number of individuals aged >15 years newly enrolled in HIV care during the reporting period
Measurement By routine monitoring. This is a new indicator, which may require adjustment to data recording and reporting to capture the required information.
Partners are defined as persons in an ongoing sexual relationship, irrespective of the length or stability of their relationship.(4)
The numerator includes people living with HIV who have proof of HIV testing of at least one sexual partner within 6 months of enrolment in HIV care (pre-ART or ART). Partners can be tested on site or the index case can provide proof of partner test results. Proof of a negative HIV test should be dated after the index case’s enrolment date or within 30 days before enrolment. If the partner is HIV-positive, proof of the test results (any date) or enrolment in HIV care services is required.
Frequency of reporting
National level: annually
Subnational level: semi-annually or quarterly
Disaggregation By key population and gender of the index case
Interpretation The results of this indicator provide information on the ability of post-test counsellors and clinicians to encourage early partner testing, an important entry point to care. Immediate initiation of ART is recommended for the HIV-positive partner in serodiscordant couples (5) and the couple should be counselled on HIV prevention. Identified HIV-positive partners should be enrolled in HIV care. Performance on this indicator is also dependent on the accessibility and availability of HIV testing services.
Complete reporting requires updated patient records. Partner HIV status often cannot be verified at the time of enrolment in care and requires documentation and reporting at a follow-up visit.
Recommended target Set according to national and local context
Reference Adaptation of indicator G1a in HIV testing and counselling M&E Guide (21) based on the field test of the metrics
4. Programme indicators (cont.)

Annex
42
4.3 Percentage of HIV-positive pregnant women attending antenatal care services whose male partner was tested for HIV
What it measures This indicator measures the proportion of HIV-positive pregnant women whose male sexual partners were tested in the previous 12 months. It does not take into account multiple sexual partners or a change in sexual partners during the pregnancy.
This indicator is a variation on the globally recommended indicator for testing male partners of all pregnant women attending antenatal care services. While testing partners of all pregnant women (irrespective of test results) is relevant in generalized epidemics, the variation presented here, which limits testing to only the partners of HIV-positive pregnant women, is more appropriate for concentrated epidemics.
Numerator Number of HIV-positive pregnant women attending antenatal care services whose male partner was tested during their female partner’s pregnancy during the reporting period
Denominator Number of HIV-positive pregnant women attending antenatal care services during the reporting period
Measurement By routine patient monitoring (antenatal clinic and/or counselling and testing register)
Partners are defined as persons in an ongoing sexual relationship, irrespective of the length or stability of their relationship. (33)
Male partners can be tested on site or provide proof of their test results done elsewhere.
At least one partner must be tested in the case of multiple male sexual partners.
Frequency of reporting
National level: annually
Subnational level: semi-annually or quarterly
Disaggregation By key population, if applicable
Interpretation The results of this indicator provide information on the ability of post-test counsellors and ANC providers to encourage and follow up on partner testing, an important entry point into care. ART is recommended for the HIV-positive partner in serodiscordant couples (5) and both members of the serodiscordant couple should be counselled on HIV prevention. Identified HIV-positive partners should be enrolled in care. Performance on this indicator is also dependent on the accessibility and availability of HIV testing services.
Recommended target Set according to national and local context
Reference Adaptation of the following indicators is based on the field test of the metrics: Universal access indicator 3.5 (15); PMTCT M&E additional indicator 3 (23); HIV testing and counselling M&E indicator G1b (21); EMTCT M&E guide additional indicator (32)
4. Programme indicators (cont.)

Metrics for monitoring the cascade of HIV testing, care and treatment services in Asia and the Pacific
43
4.4 Percentage of infants born to HIV-positive women receiving a virological test for HIV within 2 months of birth
What it measures This indicator measures the extent to which infants born to HIV-infected women receive early virological testing to determine their HIV status and eligibility for ART.
Different measures are produced, depending on the denominator used. When estimates are used in the denominator, the indicator measures the proportion of the estimated total number of HIV-exposed infants who are tested within 2 months of birth. When routine reporting data are used in the denominator, the indicator measures the proportion of identified HIV-exposed infants who are tested early.
Numerator Number of infants who received an HIV test within 2 months of birth during the reporting period
Denominator Number of HIV-positive pregnant women giving birth during the reporting period
The numerator is based on routine patient monitoring data (from laboratory registers). Although multiple tests before the age of 2 months is relatively rare, double counting can occur. The numerator should reflect the number of infants receiving virological testing within 2 months of birth, not the number of samples tested at the laboratory.
There are two options for measurement of the denominator:
1. Estimation (available at national level only): based on projection models (such as Spectrum or the Asian Epidemic Model (AEM)), the estimated number of HIV-positive pregnant women within the reporting period (“the number of pregnant women needing PMTCT” in Spectrum) is used as a proxy for the number of infants born to HIV-positive mothers. Alternatively, the estimated number of women who gave birth in the past 12 months can be multiplied by the most recent national estimate of HIV prevalence in pregnant women if projections are unavailable.
2. Routine patient monitoring data: the reported number of live births to known HIV-positive mothers within the reporting period. Alternatively, the reported number of known HIV-positive pregnant women identified within the reporting period can be used as a proxy for the number of infants born.
Frequency of reporting
Annually
Disaggregation None
Interpretation This is a programme quality indicator to assess early infant diagnosis (within the first 2 months of life). It does not measure the total number of HIV-exposed infants who are tested in the first 18 months of life (denominator for indicator 3.4). For that reason, it is not included in the PMTCT cascade graph. Nevertheless, it provides important information about the postpartum follow-up of HIV-exposed infants and the programme’s ability to identify HIV-positive infants for early initiation of ART.
Recommended target
Set according to national and local context
Reference Global AIDS Response Progress Reporting indicator 3.2 (15); PMTCT M&E guide core indicator 9 (23); HTC M&E guide indicator H2b (21); EMTCT M&E guide additional indicator (32)
4. Programme indicators (cont.)
Annex
44
4.5 CD4 count at time of enrolment in HIV care
What it measures This indicator measures how early in the course of disease people living with HIV receive care and treatment services
Options There are several options for calculation of this indicator:
1. Mean and median CD4 count: sum total of initial CD4 counts of patients newly enrolled in HIV care (pre-ART and ART) services within the reporting period, and expressed as mean or median.
2. Percentage of CD4 counts above or below a specific threshold (e.g. % of CD4 counts above or below 200 cells/mm3): the number of patients newly enrolled in HIV care (pre-ART and ART) services within the reporting period with CD4 counts above or below the determined threshold
3. By category of CD4 counts (e.g. % of CD4 counts <100, 101-200, 201-500, >500 cells/mm3): the number of patients newly enrolled in HIV care (pre-ART and ART) services within the reporting period with CD4 counts that fall into the range of each category
Relevant population
Total number of patients newly enrolled in HIV care (pre-ART and ART) services within the reporting period
Measurement By routine patient monitoring data (from clinic or laboratory registers). Calculation of mean or median CD4 count requires an electronic database system if it is based on a large number of patients.
Selection of the option for calculation of the indicator is based on national context. The threshold for option 2 and the ranges of the categories for option 3 can be adjusted according to national treatment guidelines and programme needs at the national and subnational levels. In settings with a small number of newly enrolled patients, presenting this indicator as the proportion of new patients with a CD4 count above or below a specific threshold is recommended.
Frequency of reporting
National level: annually
Subnational level: semi-annually or quarterly
Disaggregation By age group (adults and children), gender, and key populations
Interpretation The CD4 count at time of initial enrolment in care is a proxy measure to determine how early in the course of disease PLHIV access care and treatment services. It depends on a combination of the timing of initial testing and diagnosis, as well as the time interval between diagnosis and enrolment in HIV care services. It is also influenced by the availability and coverage of routine CD4 count assessments at the time of initial enrolment in care.
An additional variation on this indicator is to measure the CD4 count at different times in the continuum of care. Ideally, measuring the indicator at the time of diagnosis would give information on how early testing occurs in the course of disease. (22) Another important time for measurement is at initiation of ART to monitor early treatment to reduce mortality and subsequent transmission.
When presenting this indicator as mean and median CD4 count (option 1), it is important to present both values and to understand what each represents. The mean is the population average, while the median is the mid-point of all of the values (i.e. half of the CD4 counts are higher than the median and half are lower). CD4 count outliers (very high or very low counts) can greatly influence the mean, especially when the sample size is not very large. Medians are less sensitive to extreme values and therefore more reflective of the “norm” for the population. Neither value provides all of the information when presented singly. In combination, the mean and median provide a comprehensive picture of the data, especially when combined with the range (highest and lowest value).
Results of the field test of the metrics suggest that presenting this indicator as the proportion above or below a threshold or by category is most valuable to programme managers.
Recommended target
Set according to national and local context
Reference Newly proposed indicator, based on the field test of the metrics
4. Programme indicators (cont.)
Metrics for monitoring the cascade of HIV testing, care and treatment services in Asia and the Pacific
45
4.6 Percentage of adults and children starting antiretroviral therapy within 30 days of eligibility determination
What it measures This indicator measures the time required to initiate ART once a patient has been determined to be eligible for treatment. However, it does not measure how early in the course of disease ART is provided. In addition, this indicator cannot distinguish between delayed initiation of ART and loss to follow-up.
Numerator Number of adults and children who received antiretroviral therapy within 30 days of determination of their eligibility within the reporting period
Denominator Total number of eligible patients expected to start antiretroviral therapy within the reporting period
Measurement By routine patient monitoring
ART eligibility is defined according to national guidelines.
The acceptable number of intervening days between determination of eligibility and initiation of ART is a country-specific determination and may change over time. Specification of a 30-day period is indicative and should be adapted to the national or local context.
Frequency of reporting National level: annually
Subnational level: semi-annually or quarterly
Disaggregation By age group (adults and children), gender, and key population
Interpretation This indicator measures the quality of HIV clinical service provision in terms of linkage of eligible patients to ART in a timely fashion after their eligibility is determined. It does not provide information on the performance of the system in determining eligibility. The timeliness and frequency of assessments of eligibility (by CD4 count or other eligibility factors such as active TB, serodiscordant partner, pregnancy, or hepatitis B infection) are an important factor in the linkage to ART along the continuum of care.
Recommended target Set according to national and local context
Reference Newly proposed indicator, based on the field test of the metrics
4. Programme indicators (cont.)

Chapter
46
4.7 Percentage of patients who pick up antiviral drugs no more than two days late at the first pick-up after the baseline pick-up
What it measures This indicator measures on-time visits during the reporting period, which are necessary for patient adherence and reduction of HIV drug resistance. However, it does not measure whether patients take their medications regularly as prescribed.
Numerator Number of patients who pick up their prescribed antiretroviral drugs on time at the first drug pick-up after a baseline pick-up date
Denominator Number of patients who picked up antiretroviral drugs on or after the designated sample start date
Measurement By routine patient monitoring data (pharmacy register). In cases where pharmacy data are not reported, the early warning indicators advisory group recommends periodic sampling of dispensing practices.
“On-time” drug pick-up is defined as picking up drugs within 2 days of the previous prescription running out, if drugs are taken according to schedule.
In situations where pharmacy data are not available or appropriate for determining on-time drug pick-up, the alternative indicator, the percentage of patients on ART who attended all their scheduled or expected clinical consultations on time, may be substituted. It is defined as the number of patients on ART who attended all their scheduled or expected clinical consultations on time during the reporting period (numerator), divided by the total number of patients on ART during the reporting period (denominator). The definition of on-time visit is determined by country. Early warning for HIV drug resistance indicator guidelines recommend either on the same day or within seven days of the scheduled or expected consultation.
For both options, patients who are classified as transferred out, dead or having discontinued ART are not included in the denominator.
Frequency of reporting National level: annually
Subnational level: quarterly
Disaggregation By age group (adults and children), gender and key population group
Interpretation The indicator is based on pharmacy records and measures whether patients leave the clinic with medications. This requires both an on-time clinic visit and drugs to be in stock. Several factors influence this indicator. In addition to accessibility and acceptability of clinic services, ARV drug stock-outs (indicator 4.8) can reduce adherence measures.
Recommended target >90% (17)
Reference HIV drug resistance early warning indicator 1 (17)
4. Programme indicators (cont.)
Metrics for monitoring the cascade of HIV testing, care and treatment services in Asia and the Pacific
47
4.8 Percentage of months in the reporting period in which there were no antiretroviral drug stock-outs
What it measures This indicator measures whether facilities have maintained a continuous supply of required antiretroviral drugs, a key factor for treatment effectiveness and prevention of HIV drug resistance. It does not supply information on the duration of stock-outs. This indicator can also be applied to other opportunistic infection drugs required for HIV treatment.
Numerator Number of months in the reporting period in which there were no stock-out days of any antiretroviral drug routinely used at the site
Denominator Number of months in the reporting period
Measurement By routine monitoring data (pharmacy records)
If data are not routinely reported to district, provincial or national levels, a survey of sites will be required.
Frequency of reporting
National level: annually
Subnational level: semi-annually or quarterly
Disaggregation By specific drug
Interpretation This indicator provides information on ARV drug availability during the reporting period but does not provide information on why the stock-out occurred or for how many essential ARV drugs were affected. Further investigation of the reasons behind drug stock-outs is needed. Factors range from global level shortages to underestimated needs projections and ordering at the local level.
Some areas of the drug management logistics system to consider include:
• at the facility level: projection of needs and timely ordering,
• in the national distribution system: order processing and timely distribution of drugs, central stores stock management
• in the national procurement process: forecasting need, international ordering, budget and availability of funding, global supply of ARVs.
Recommended target 100% (17)
Reference HIV drug resistance early warning indicator 3 (17)
4. Programme indicators (cont.)

1. Global report: UNAIDS report on the global AIDS epidemic 2013. Geneva: UNAIDS; 2013 (http://www.unaids.org/en/media/unaids/contentassets/documents/epidemiology/2013/gr2013/UNAIDS_Global_Report_2013_en.pdf, accessed 26 November 2013).
2. HIVinAsiaandthePacific:UNAIDSreport2013.Geneva:UNAIDS;2013(http://www.aidsdatahub.org/sites/default/files/publication/UNAIDS-2013-Asia-Pacific-report.pdf,accessed13December2013).
3. Programmatic update: antiretroviral treatment as prevention (TasP) of HIV and TB. Geneva: World Health Organization; 2012 (http://whqlibdoc.who.int/hq/2012/WHO_HIV_2012.12_eng.pdf, accessed 26 October 2012).
4. CohenMS,ChenYQ,McCauleyM,GambleT,HosseinipourMC,KumarasamyN,etal.PreventionofHIV-1infectionwithearlyantiretroviraltherapy.NEnglJMed,2011,365:493-505.
5. Consolidated guidelines on the use of antiretroviral drugs for treating and preventing HIV infection: recommendations for a public health approach. Geneva: World Health Organization; 2013.
6. World Health Organization, UNAIDS. The treatment 2.0 framework for action: catalysing the next phase of treatment, care and support. Geneva: World Health Organization; 2011 (http://whqlibdoc.who.int/publications/2011/9789241501934_eng.pdf, accessed 26 October 2012).
7. Retention in HIV programmes: defining the challenges and identifying solutions: meeting report,13-15 September 2011. Geneva: World Health Organization; 2012 (http://www.unaids.org.cn/pics/20120814164046.pdf, accessed 26 October 2012).
8. World Health Organization, UNAIDS, UNICEF. Global HIV response: epidemic update and health sector progress towards universal access: progress report 2011. Geneva: World Health Organization; 2011 (http://whqlibdoc.who.int/publications/2011/9789241502986_eng.pdf, accessed 26 October 2012).
9. Global plan towards the elimination of new HIV infections among children by 2015 and keeping their mothersalive,2011-2015.Geneva:UNAIDS;2011(http://www.unaids.org/en/media/unaids/contentassets/documents/unaidspublication/2011/20110609_JC2137_Global-Plan-elimination-HIV-Children_en.pdf,accessed 26 November 2013).
10.EliminationofnewpaediatricHIVinfectionsandcongenitalsyphilis inAsia-Pacific2011-2015:conceptualframework monitoring and evaluation guide. Bangkok: UNICEF; 2011 (http://www.unicef.org/eapro/PPTCT_CF_and_ME_guide_17Aug11.pdf, accessed 26 November 2013).
11.HIVandAIDSriskstochildrenandadolescentsstilltoohighinAsia&PacificsaysUNICEF[pressreleaseon the Internet]. Bangkok: UNICEF; 2013 (http://www.unicef.org/eapro/media_21833.html, accessed 13 January 2014)
12.HIV in Asia and the Pacific, UNAIDS report 2013. Bangkok: UNAIDS; 2013 (http://www.unaids.org/en/ media/unaids/contentassets/documents/unaidspublication/2013/2013_HIV-Asia-Pacific_en.pdf, accessed 13 January 2014).
13.RegionalStrategy toStopTuberculosis in theWesternPacific2011-2015.Manila:WHORegionalOfficefor the Western Pacific; 2011 (http://www.wpro.who.int/tb/RegionalStrategy_201115__web.pdf, accessed 26 May 2014).
14. Global tuberculosis report 2013. Geneva: World Health Organization; 2013 (http://www.who.int/tb/publications/global_report/en/, accessed 26 November 2013).
15. UNAIDS , UNICEF, World Health Organization . Global AIDS response progress reporting 2013: construction of core indicators for monitoring the 2011 UN Political Declaration on HIV. Geneva: World Health Organization; 2013 (http://www.unaids.org/en/media/unaids/contentassets/documents/document/2013/GARPR_2013_guidelines_en.pdf, accessed 26 May 2014).
16. HIV drug resistance early warning indicators: World Health Organization indicators to monitor HIV drug resistance prevention at antiretroviral treatment sites. Geneva: World Health Organization; June 2010 update (http://new.paho.org/hq/dmdocuments/2010/hivdr-early-warning-indicators---updated-april-2010.pdf,accessed 26 May 2014).
17. Meeting report on assessment of World Health Organization HIV drug resistance early warning indicators: reportof theEarlyWarning IndicatorAdvisoryPanelmeeting,11-12August2011.Geneva:WorldHealthOrganization; 2012 (http://apps.who.int/iris/bitstream/10665/75186/1/9789241503945_eng.pdf, accessed on 26 October 2012).
18. World Health Organization, UNAIDS, UNICEF, Global Fund to Fight AIDS, TB and Malaria. Three interlinked patient monitoring systems for HIV care/ART, MCH/PMTCT (including malaria prevention during pregnancy), and TB/HIV: standardized minimum data set and illustrative tools. Geneva: World Health Organization; 2009 (http://www.who.int/hiv/pub/imai/forms_booklet.pdf, accessed on 26 October 2012).
References
4848

Metrics for monitoring the cascade of HIV testing, care and treatment services in Asia and the Pacific
49
19. Patient monitoring guidelines for HIV care and antiretroviral therapy (ART). Geneva: World Health Organization;2006(http://www.who.int/3by5/capacity/ptmonguidelinesfinalv1.PDF,accessedon26October2012).
20. World Health Organization, United States President’s Emergency Plan for Aids Relief, UNAIDS. A guide to monitoring and evaluation for collaborative TB/HIV activities. Geneva: World Health Organization; 2009 (http://whqlibdoc.who.int/publications/2009/9789241598194_eng.pdf, accessed on 26 October 2012).
21. Guide for monitoring and evaluating national HIV testing and counselling (HTC) programmes: field-test version. Geneva: World Health Organization; 2011 (http://whqlibdoc.who.int/publications/ 2011/9789241501347_eng.pdf, accessed on 26 October 2012).
22. Meeting report on framework for metrics to support effective treatment as prevention, 2–3 April 2012. Geneva: World Health Organization; 2012 (http://apps.who.int/iris/bitstream/10665/75387/1/9789241504331
_eng.pdf, accessed on 26 October 2012).
23.Monitoring and evaluating the prevention of mother-to-child transmission of HIV: a guide for nationalprogrammes: preliminary version for AIDS 2010. Geneva: World Health Organization; 2010.
24. Next generation indicators reference guide: version 1.1. Washington, DC: United States President’s Emergency Plan for Aids Relief; 2009 (http://www.pepfar.gov/documents/organization/81097.pdf, accessed 6 December 2012).
25. Standard operating procedure (SOP) for the continuous quality improvement for continuum of care for people living with HIV in Cambodia. Phnom Penh: National Centre for HIV/ AIDS, Dermatology and STD; 2012.
26. Vietnam AIDS Administration, Ministry of Health. HIVQUAL Vietnam indicators. Hanoi: Ministry of Health; 2012.
27. Papua New Guinea National Department of Public Health. Adult HIVQUAL Papua New Guinea (PNG) indicators. Port Moresby: National Department of Public Health; 2009.
28. National Quality Improvement Indicators Set for Performance Evaluation, National AIDS/STD Prevention and Control. Beijing: Chinese Center for Disease Control and Prevention; 2013.
29.IndicatorsforHIVQUAL-T,v.5..Bangkok:MinistryofPublicHealth;[dateunknown].
30. An introduction to indicators. Geneva: UNAIDS; 2010 (Monitoring and evaluations fundamentals series; http://www.unaids.org/en/media/unaids/contentassets/documents/document/2010/8_2-Intro-to-Indicators FMEF.pdf, accessed 8 February 2013).
31. UNAIDS, UNICEF, World Health Organization. Global AIDS response progress reporting 2014: construction of core indicators for monitoring the 2011 United Nations political declaration on HIV and AIDS. Geneva: UNAIDS; 2014 (http://www.unaids.org/en/media/unaids/contentassets/documents/document/2014/GARPR_ 2014_guidelines_en.pdf, accessed 26 May 2014).
32. Global monitoring framework and strategy for the global plan towards the elimination of new HIV infections among children by 2015 and keeping their mothers alive (EMTCT). Geneva: World Health Organization; 2012 (http://www.who.int/hiv/pub/me/monitoring_framework/en/index.html, accessed 18 December 2013).
33. Guidance on couples HIV testing and counselling including antiretroviral therapy for treatment and prevention in serodiscordant couples: recommendations for a public health approach. Geneva: World Health Organization; 2012 (http://www.who.int/hiv/pub/guidelines/9789241501972/en/, accessed 4 December 2012).
Metrics for monitoring thecascade of HIV testing,care and treatment servicesin Asia and the Pacific
For more information, please contact:HIV, Hepatitis and STIWHO Western Pacific Regional Office P.O. Box 2932 1000 Manila Philippines Email: [email protected]://www.wpro.who.int/hiv
Metrics for m
onitoring the cascade of HIV
testing, care and treatment services in A
sia and the Pacific
HIVHepatitis
& STI