hiv and sti department - centre for infections reducing the burden of undiagnosed hiv infection dr...
TRANSCRIPT
HIV and STI Department - Centre for Infections
Reducing the burden of undiagnosed HIV infection
Dr Valerie DelpechHIV & STI DepartmentCentre for InfectionsHPA
HIV and STI Department - Centre for Infections
Outline
New DiagnosesOverall trends in UK and International
HIV IncidenceUASTARHS
Testing Impact on transmission
HIV and STI Department - Centre for Infections
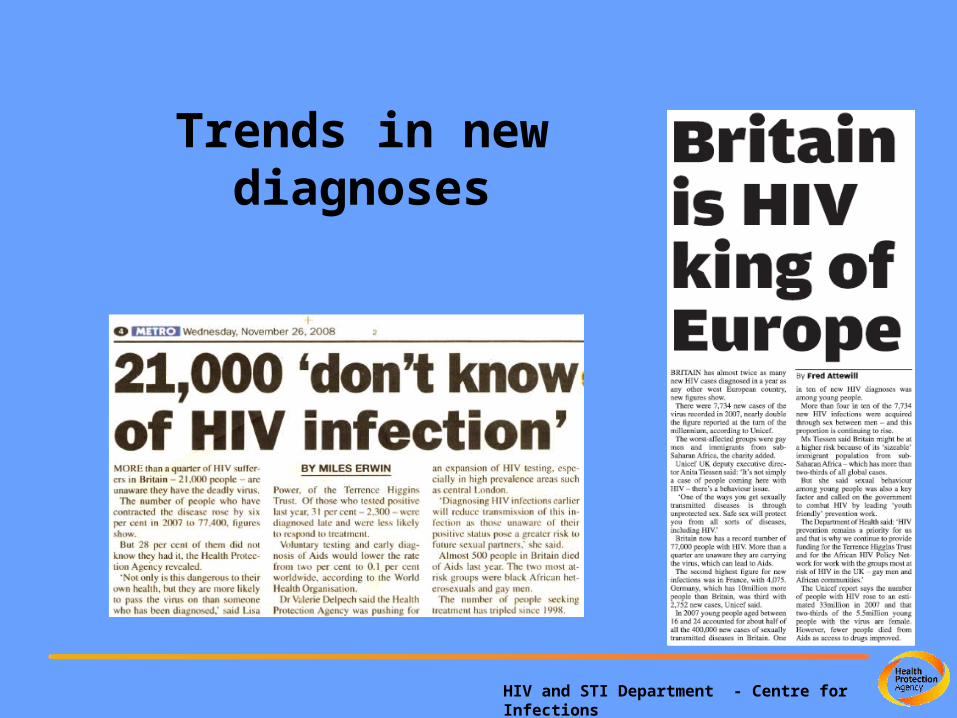
Trends in new diagnoses
HIV and STI Department - Centre for Infections
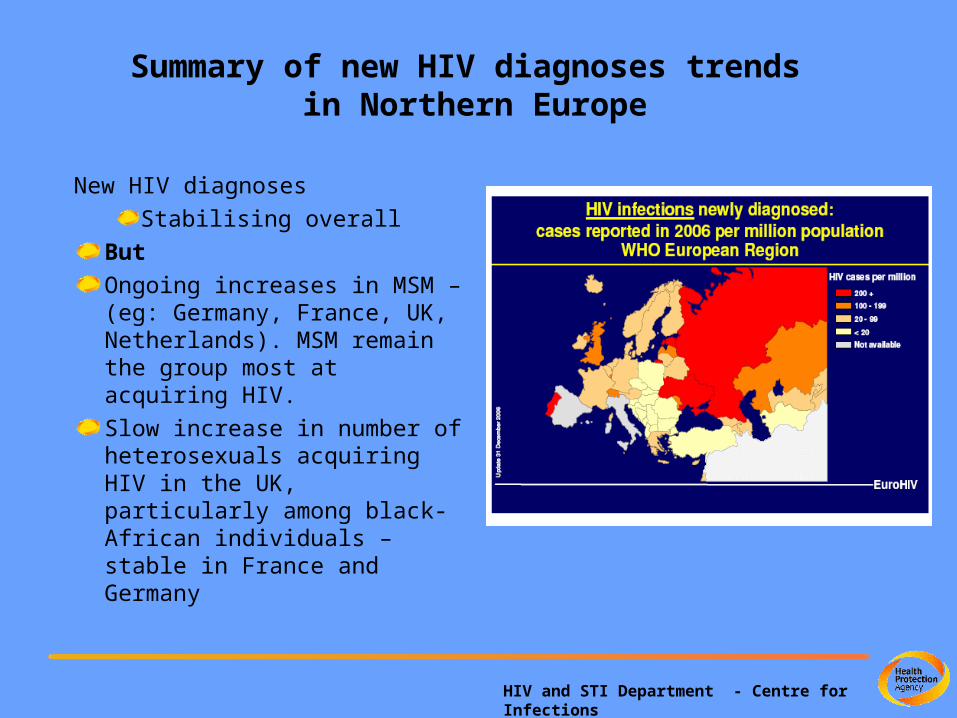
Summary of new HIV diagnoses trends in Northern Europe
New HIV diagnosesStabilising overall
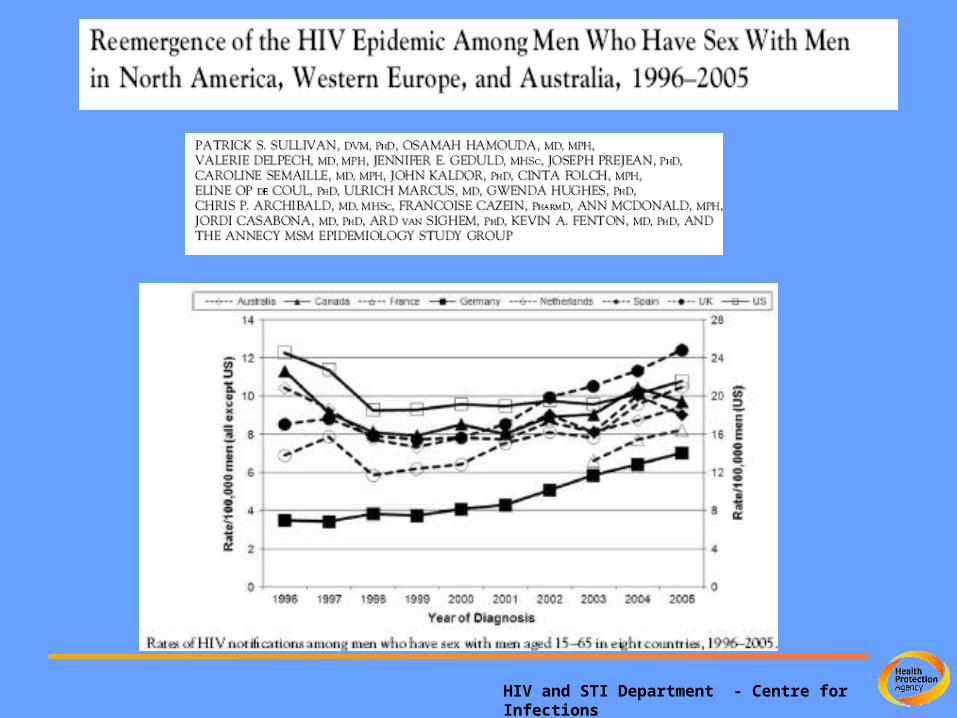
ButOngoing increases in MSM – (eg: Germany, France, UK, Netherlands). MSM remain the group most at acquiring HIV. Slow increase in number of heterosexuals acquiring HIV in the UK, particularly among black-African individuals – stable in France and Germany
HIV and STI Department - Centre for Infections
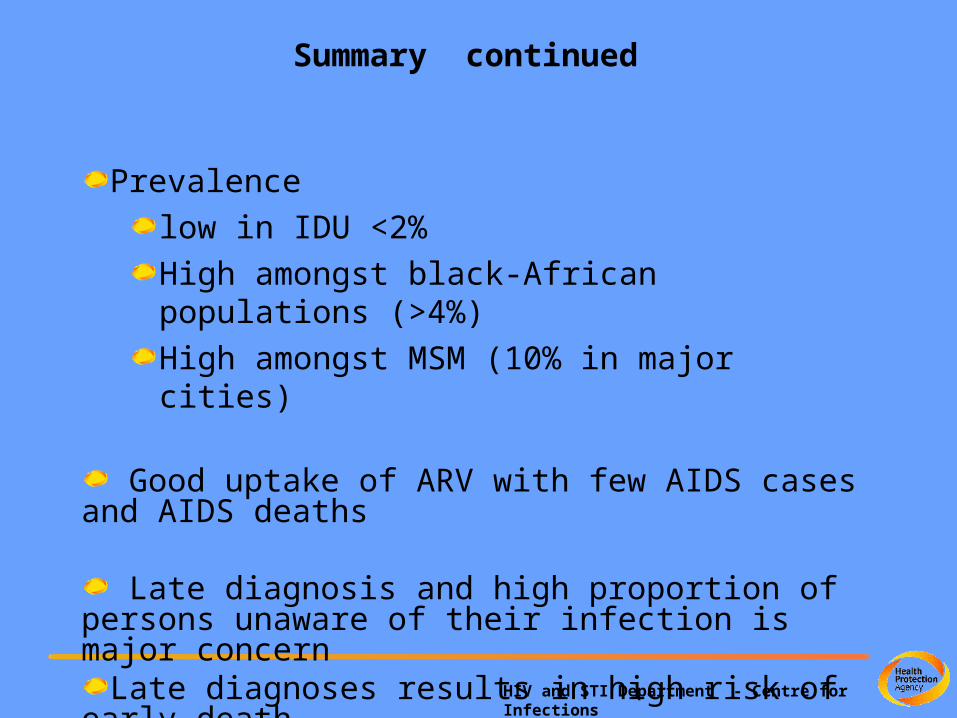
Summary continued
Prevalence low in IDU <2%High amongst black-African populations (>4%)High amongst MSM (10% in major cities)
Good uptake of ARV with few AIDS cases and AIDS deaths
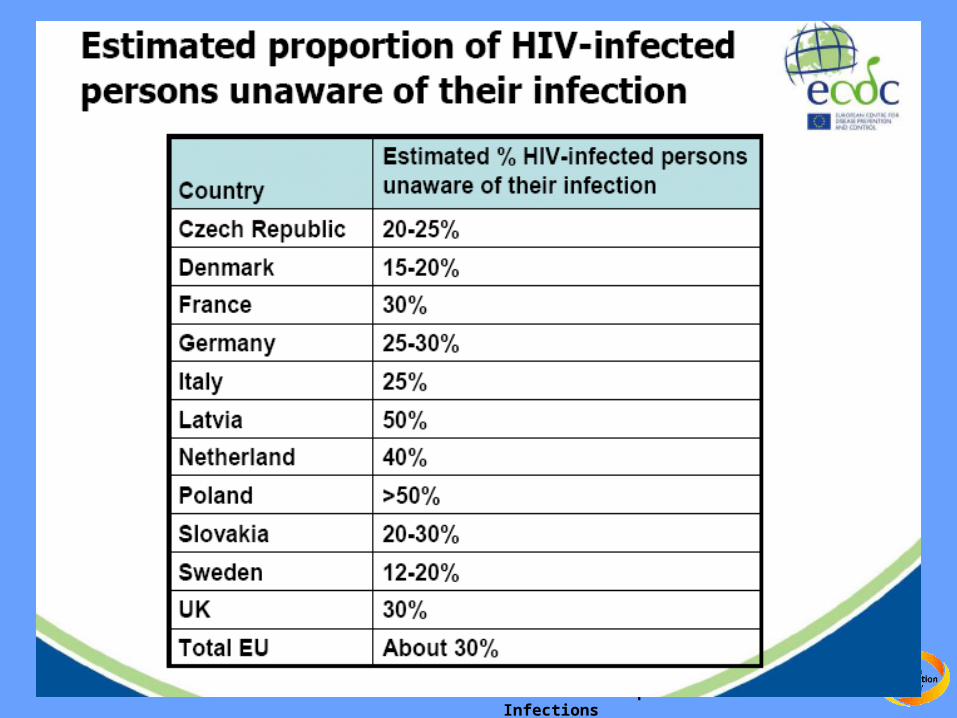
Late diagnosis and high proportion of persons unaware of their infection is major concern
Late diagnoses results in high risk of early death.

HIV and STI Department - Centre for Infections
New HIV diagnoses by prevention group, UK: 1999-2008
0
1000
2000
3000
4000
5000
6000
1999 2000 2001 2002 2003 2004 2005 2006 2007 2008
Year of first HIV diagnosis in the UK
Num
bers
of new
HIV
dia
gnose
s
MSM (adjusted)
MSM (observed)
Heterosexuals (adjusted)
Heterosexuals (observed)
IDU (adjusted)
IDU (observed)
Proportional adjustment for missing information; 2008 also adjusted for reporting delay
HIV and STI Department - Centre for Infections
HIV and STI Department - Centre for Infections
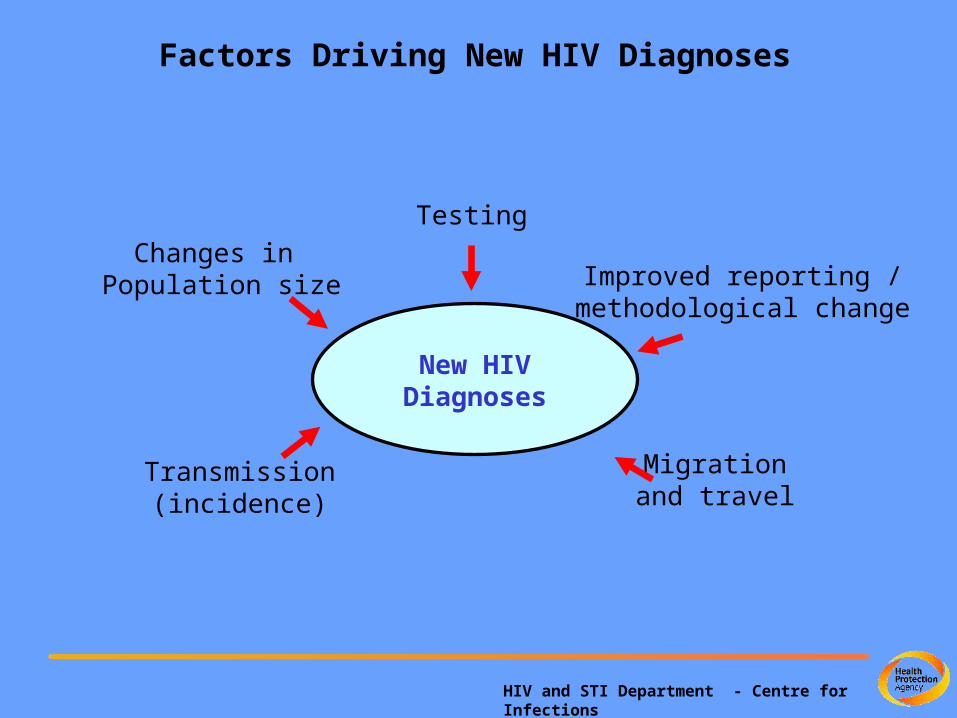
Factors Driving New HIV Diagnoses
New HIVDiagnoses
Changes in Population size
Testing
Improved reporting / methodological change
Migrationand travel
Transmission(incidence)

HIV and STI Department - Centre for Infections
HIV Incidence
HIV and STI Department - Centre for Infections
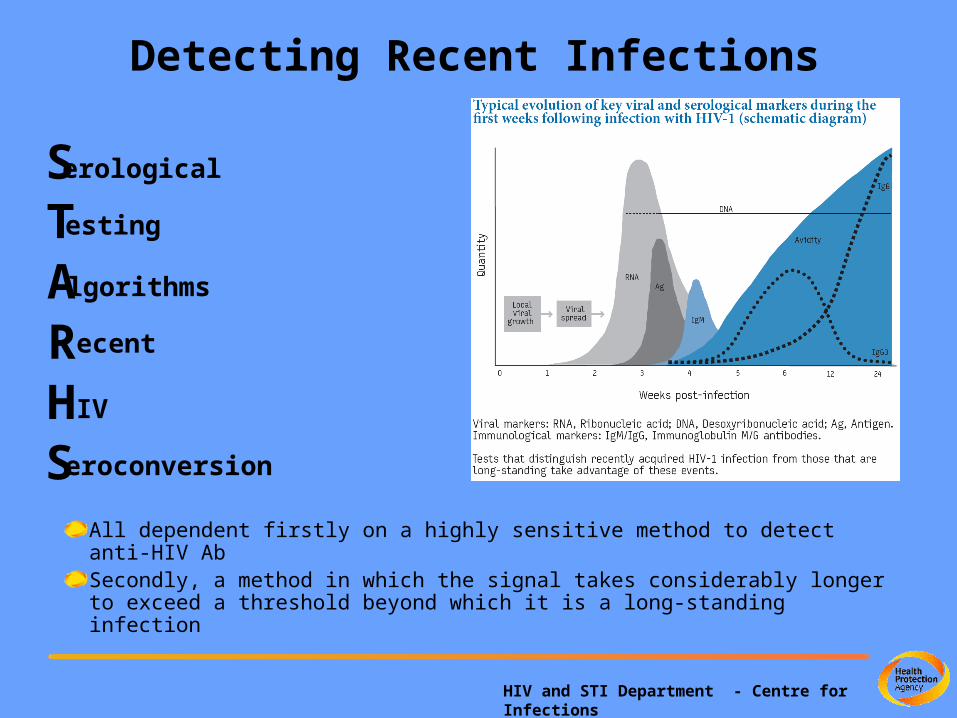
Detecting Recent Infections
STA
HR
S
erological
esting
lgorithms
ecent
IV
eroconversion
All dependent firstly on a highly sensitive method to detect anti-HIV AbSecondly, a method in which the signal takes considerably longer to exceed a threshold beyond which it is a long-standing infection
HIV and STI Department - Centre for Infections
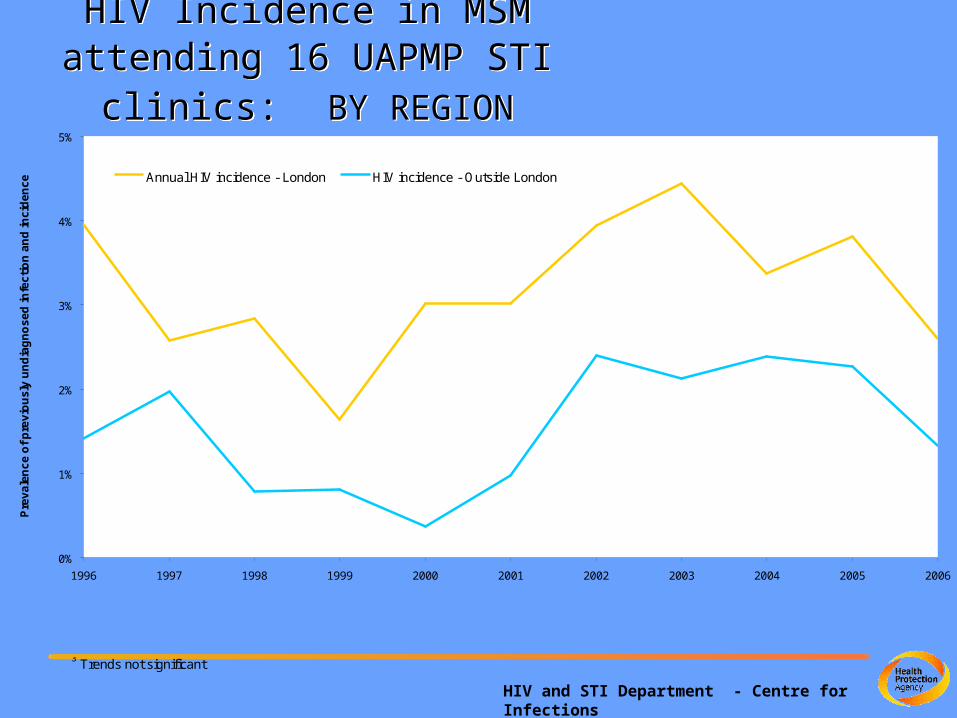
HIV Incidence in MSM attending 16 UAPMP STI clinics: BY REGION
HIV Incidence in MSM attending 16 UAPMP STI clinics: BY REGION
0%
1%
2%
3%
4%
5%
1996 1997 1998 1999 2000 2001 2002 2003 2004 2005 2006
Pre
va
len
ce
of
pre
vio
us
ly u
nd
iag
no
se
d in
fec
tio
n a
nd
inc
ide
nc
e Annual HIV incidence - London HIV incidence - Outside London
1Previously undiagnosed HIV infection includes those diagnosed at the clinic attendance and those remaining undiagnosed but excludes those diagnosed earlier.2 Estimated using the Serological Testing Algorithm for Recent HIV Seroconversion (STARHS)3 Trends not significantUnlinked anonymous surveillance in 16 sentinel GUM clinics
HIV and STI Department - Centre for Infections
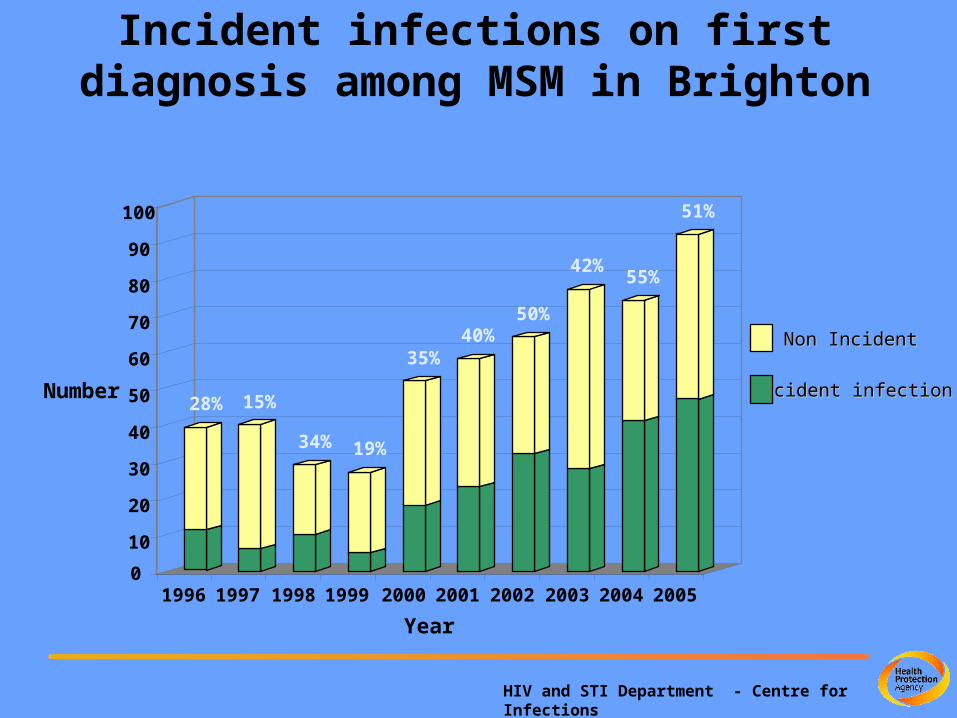
Non IncidentNon Incident
Incident infectionIncident infection
0
10
20
30
40
50
60
70
80
90
100
Number
1996 1997 1998 1999 2000 2001 2002 2003 2004 2005
Year
28% 15%
34% 19%
35%40%
50%
42%55%
51%
Incident infections on first diagnosis among MSM in Brighton
HIV and STI Department - Centre for Infections
HIV testing
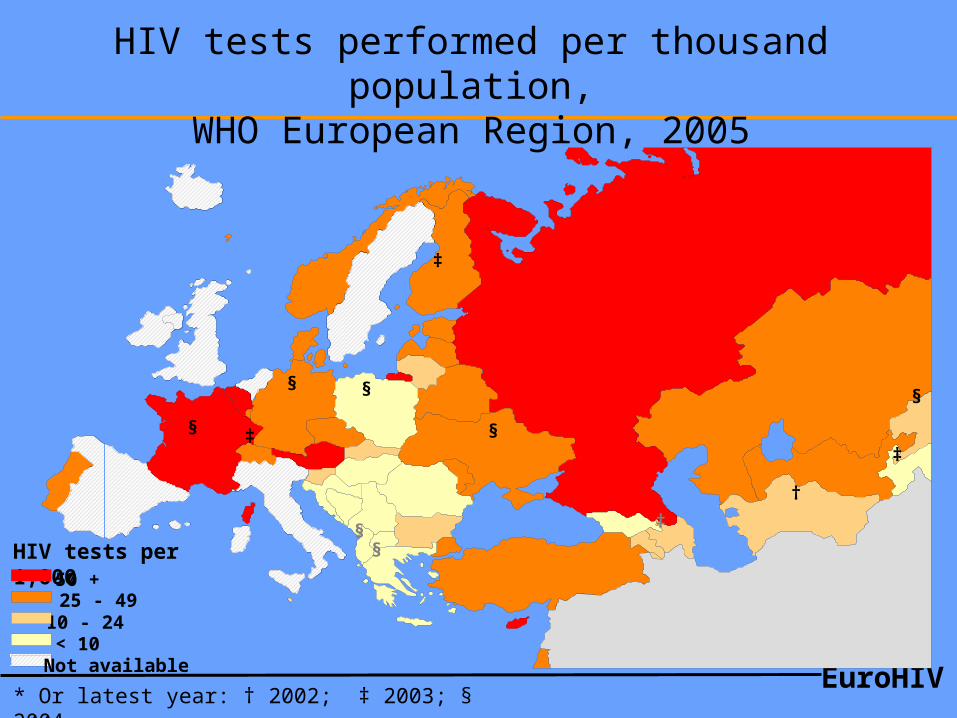
EuroHIV* Or latest year: † 2002; ‡ 2003; § 2004
†
‡
‡
‡
‡
§
§ §
§ §
§
§
HIV tests per 1,00050 +25 - 4910 - 24 < 10Not available
HIV tests performed per thousand population,
WHO European Region, 2005
HIV and STI Department - Centre for Infections
Improving HIV testing: Sexual Health Strategy (2001-2011)
By end 2004, all STI clinic attendees offered an HIV test on their first STI screening (and subsequently according to risk).
Uptake by those offered HIV test should be 60% by the end of 2007 (surpassed).
The proportion of HIV positive individuals leaving the GUM undiagnosed should be reduced by 50% by 2007 (not yet achieved).
HIV and STI Department - Centre for Infections
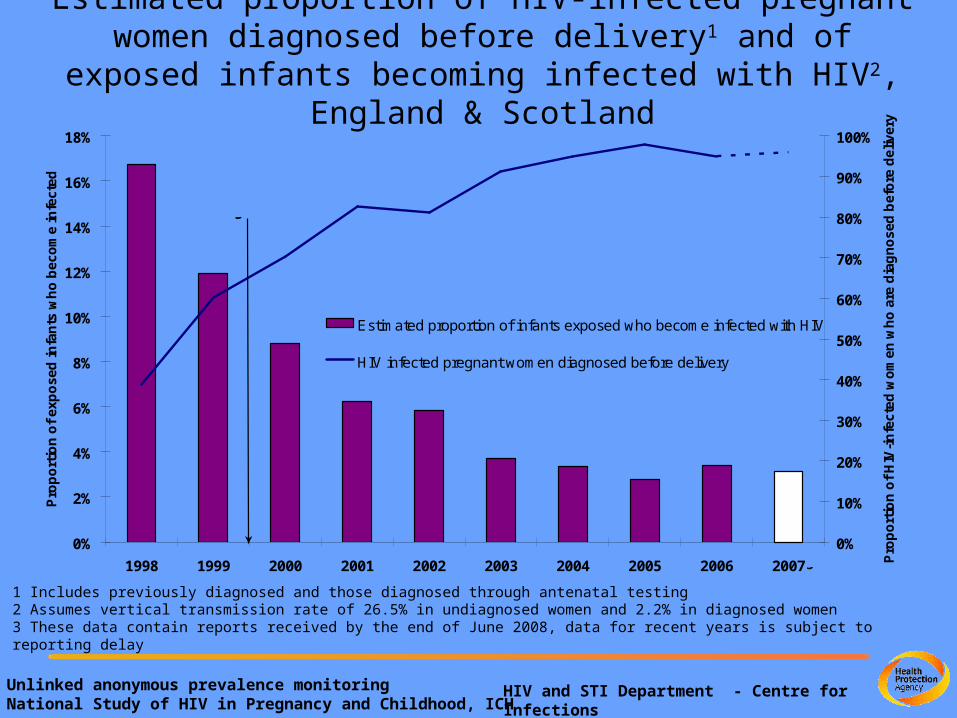
Estimated proportion of HIV-infected pregnant women diagnosed before delivery1 and of exposed
infants becoming infected with HIV2, England & Scotland
1 Includes previously diagnosed and those diagnosed through antenatal testing2 Assumes vertical transmission rate of 26.5% in undiagnosed women and 2.2% in diagnosed women3 These data contain reports received by the end of June 2008, data for recent years is subject to reporting delay
Unlinked anonymous prevalence monitoringNational Study of HIV in Pregnancy and Childhood, ICH
0%
2%
4%
6%
8%
10%
12%
14%
16%
18%
1998 1999 2000 2001 2002 2003 2004 2005 2006 2007
Pro
po
rtio
n o
f ex
po
sed
in
fan
ts w
ho
bec
om
e in
fect
ed
0%
10%
20%
30%
40%
50%
60%
70%
80%
90%
100%
Pro
po
rtio
n o
f H
IV-i
nfe
cted
wo
men
wh
o a
re d
iag
no
sed
bef
ore
del
iver
y
Estimated proportion of infants exposed who become infected with HIV
HIV infected pregnant women diagnosed before delivery
Antenatal HIV screening introduced
3
HIV and STI Department - Centre for Infections
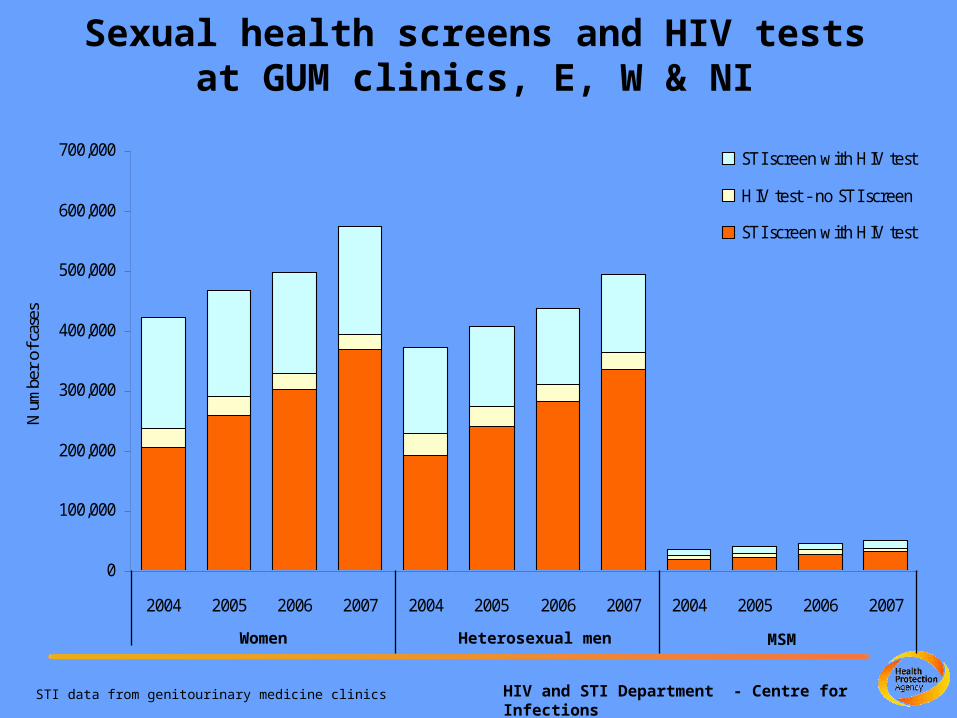
Sexual health screens and HIV tests at GUM clinics, E, W & NI
STI data from genitourinary medicine clinics
0
100,000
200,000
300,000
400,000
500,000
600,000
700,000
2004 2005 2006 2007 2004 2005 2006 2007 2004 2005 2006 2007
Num
ber
of c
ases
STI screen with HIV test
HIV test - no STI screen
STI screen with HIV test
Women Heterosexual men
MSM
HIV and STI Department - Centre for Infections
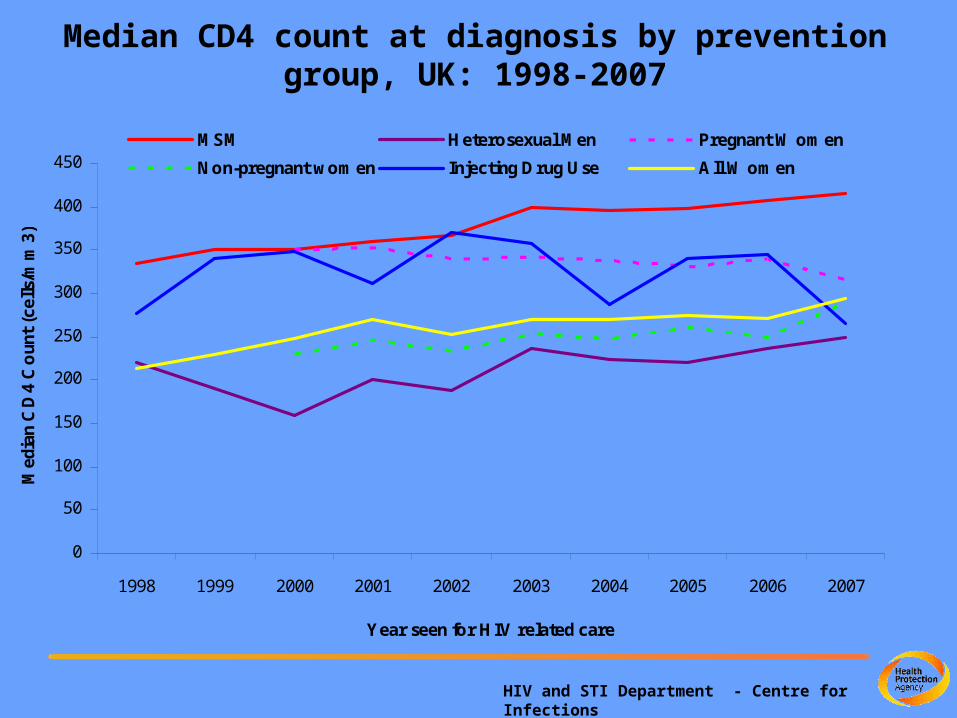
Median CD4 count at diagnosis by prevention group, UK: 1998-2007
0
50
100
150
200
250
300
350
400
450
1998 1999 2000 2001 2002 2003 2004 2005 2006 2007
Year seen for HIV related care
Med
ian
CD
4 C
oun
t (c
ells
/mm
3)
MSM Heterosexual Men Pregnant Women
Non-pregnant women Injecting Drug Use All Women
HIV and STI Department - Centre for Infections
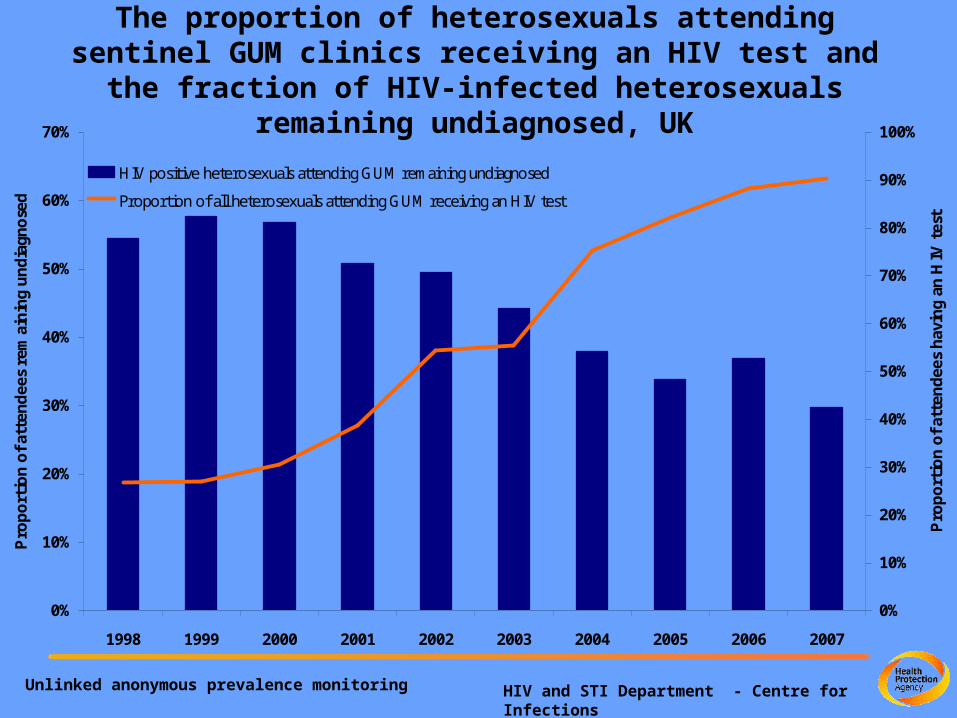
The proportion of heterosexuals attending sentinel GUM clinics receiving an HIV test and the fraction
of HIV-infected heterosexuals remaining undiagnosed, UK
Unlinked anonymous prevalence monitoring
0%
10%
20%
30%
40%
50%
60%
70%
1998 1999 2000 2001 2002 2003 2004 2005 2006 2007
Pro
port
ion
of a
tten
dees
rem
ainin
g un
dia
gnose
d
0%
10%
20%
30%
40%
50%
60%
70%
80%
90%
100%
Pro
port
ion
of a
tten
dees
hav
ing
an H
IV tes
t
HIV positive heterosexuals attending GUM remaining undiagnosed
Proportion of all heterosexuals attending GUM receiving an HIV test
HIV and STI Department - Centre for Infections
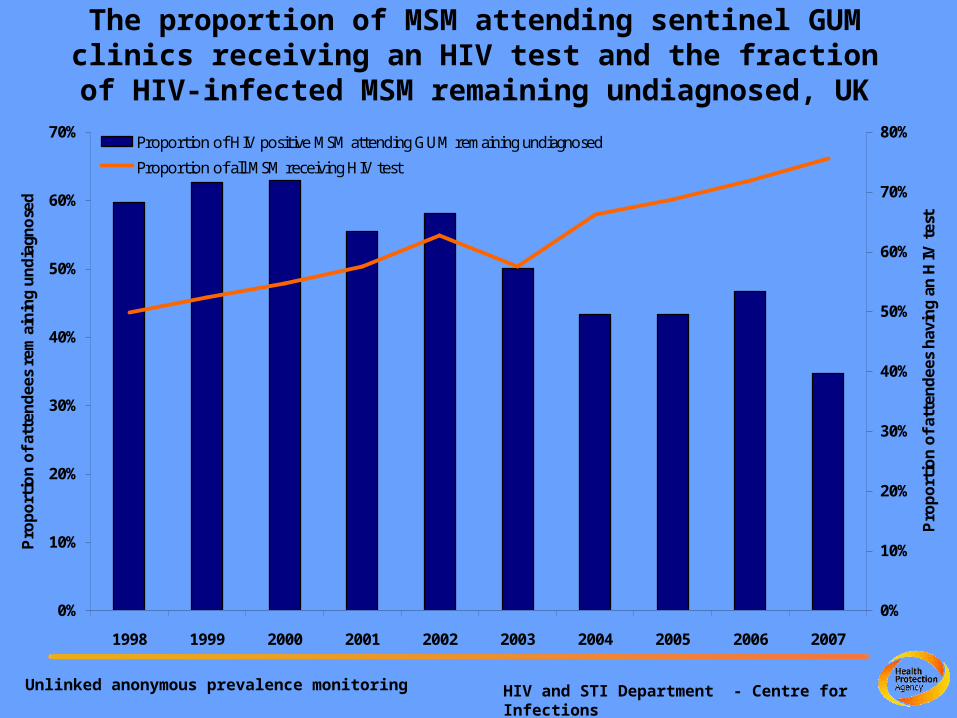
The proportion of MSM attending sentinel GUM clinics receiving an HIV test and the fraction of HIV-infected MSM remaining undiagnosed, UK
Unlinked anonymous prevalence monitoring
0%
10%
20%
30%
40%
50%
60%
70%
1998 1999 2000 2001 2002 2003 2004 2005 2006 2007
Pro
port
ion
of a
tten
dees
rem
ainin
g un
dia
gnose
d
0%
10%
20%
30%
40%
50%
60%
70%
80%
Pro
port
ion
of a
tten
dees
hav
ing
an H
IV tes
t
Proportion of HIV positive MSM attending GUM remaining undiagnosed
Proportion of all MSM receiving HIV test
HIV and STI Department - Centre for Infections
Undiagnosed Infection& late diagnosis
HIV and STI Department - Centre for Infections
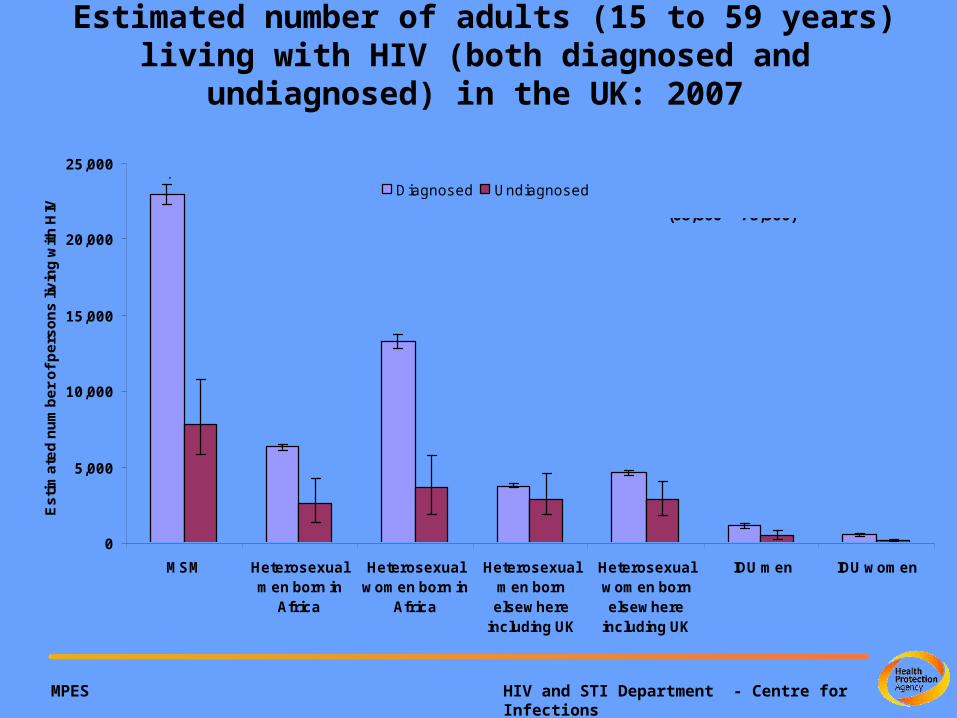
Estimated number of adults (15 to 59 years) living with HIV (both diagnosed and
undiagnosed) in the UK: 2007
0
5,000
10,000
15,000
20,000
25,000
MSM Heterosexualmen born in
Africa
Heterosexualwomen born in
Africa
Heterosexualmen bornelsewhere
including UK
Heterosexualwomen bornelsewhere
including UK
IDU men IDU women
Es
tim
ate
d n
um
be
r o
f p
ers
on
s li
vin
g w
ith
HIV
Diagnosed Undiagnosed
550
13,250
Total 73,300(68,800 – 78,500)
22,950
2,650
6,300
3,6503,750 2,850 4,600 2,850
1,200
450 150
7,850
MPES
HIV and STI Department - Centre for Infections
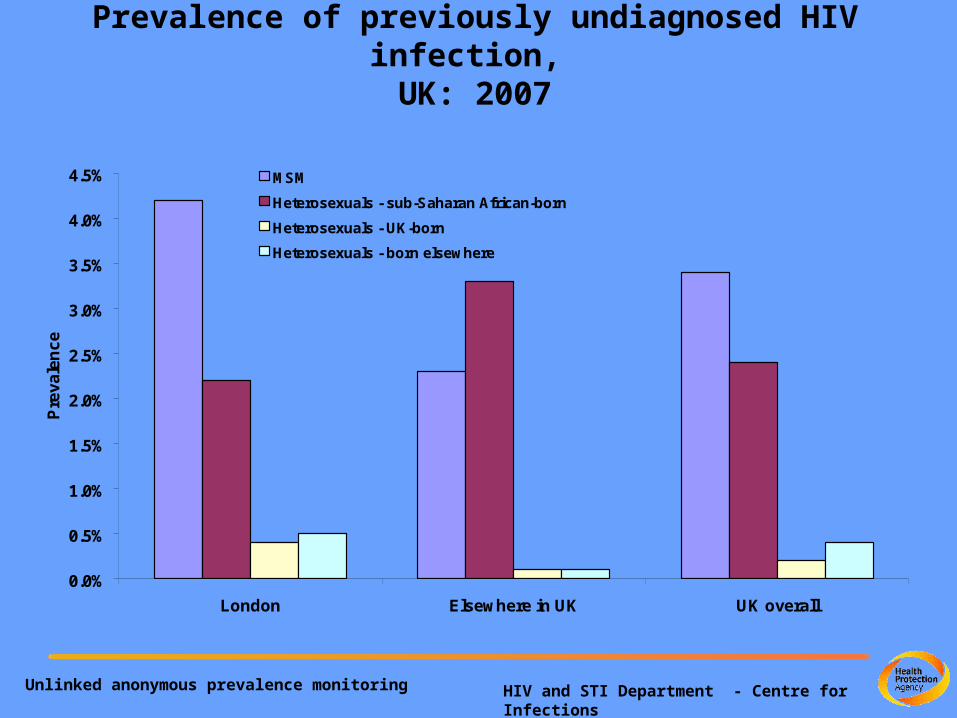
Prevalence of previously undiagnosed HIV infection, UK: 2007
Unlinked anonymous prevalence monitoring
0.0%
0.5%
1.0%
1.5%
2.0%
2.5%
3.0%
3.5%
4.0%
4.5%
London Elsewhere in UK UK overall
Pre
va
len
ce
MSM
Heterosexuals - sub-Saharan African-born
Heterosexuals - UK-born
Heterosexuals - born elsewhere
HIV and STI Department - Centre for Infections
HIV and STI Department - Centre for Infections
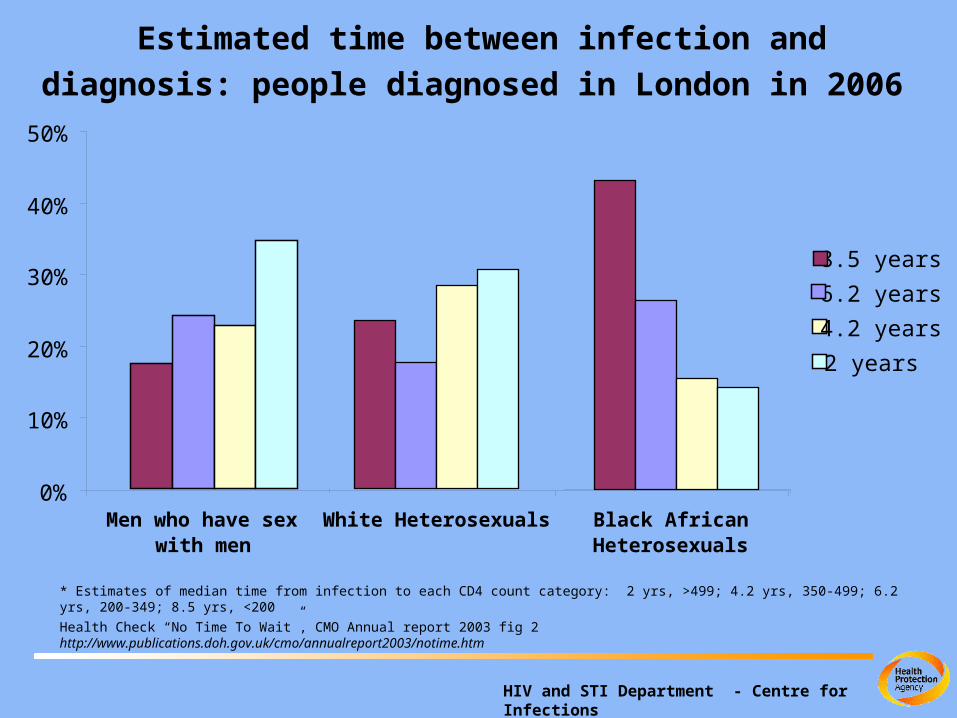
* Estimates of median time from infection to each CD4 count category: 2 yrs, >499; 4.2 yrs, 350-499; 6.2 yrs, 200-349; 8.5 yrs, <200
Health Check “No Time To Wait”, CMO Annual report 2003 fig 2 http://www.publications.doh.gov.uk/cmo/annualreport2003/notime.htm
Estimated time between infection and diagnosis: people diagnosed in London in 2006
0%
10%
20%
30%
40%
50%
Men who have sexwith men
White Heterosexuals Black AfricanHeterosexuals
8.5 years
6.2 years
4.2 years
2 years
HIV and STI Department - Centre for Infections
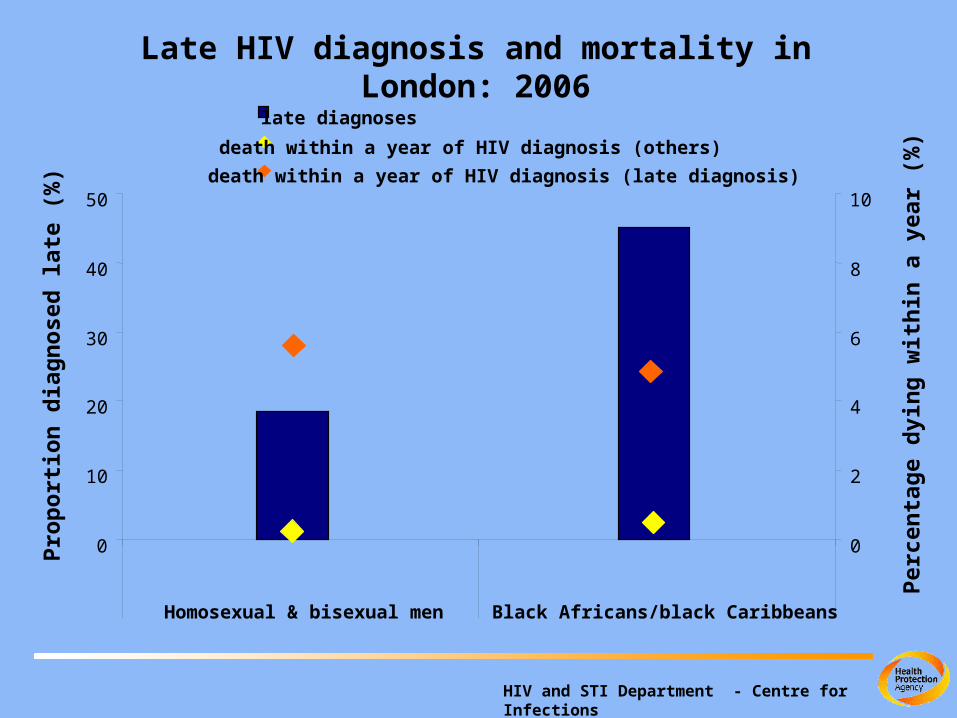
Late HIV diagnosis and mortality in London: 2006
0
10
20
30
40
50
Homosexual & bisexual men Black Africans/black Caribbeans
Pro
po
rtio
n d
iag
no
sed
late
(%
)
0
2
4
6
8
10
Pe
rcen
tag
e d
yin
g w
ith
in a
yea
r (%
)
late diagnoses
death within a year of HIV diagnosis (others)
death within a year of HIV diagnosis (late diagnosis)
HIV and STI Department - Centre for Infections
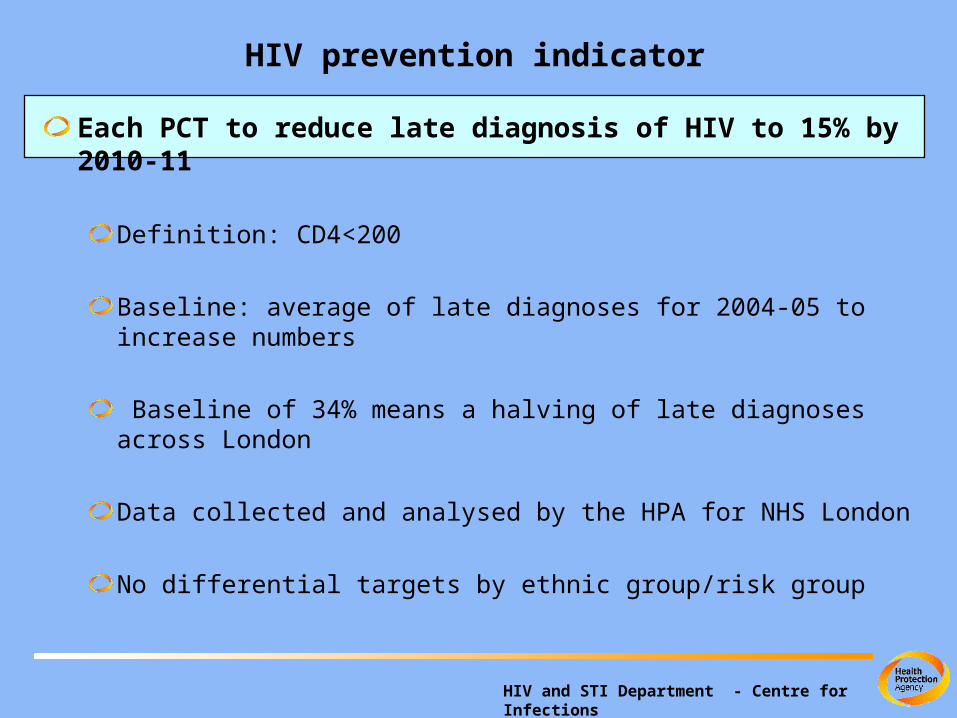
HIV prevention indicator
Each PCT to reduce late diagnosis of HIV to 15% by 2010-11
Definition: CD4<200
Baseline: average of late diagnoses for 2004-05 to increase numbers
Baseline of 34% means a halving of late diagnoses across London
Data collected and analysed by the HPA for NHS London
No differential targets by ethnic group/risk group
HIV and STI Department - Centre for Infections
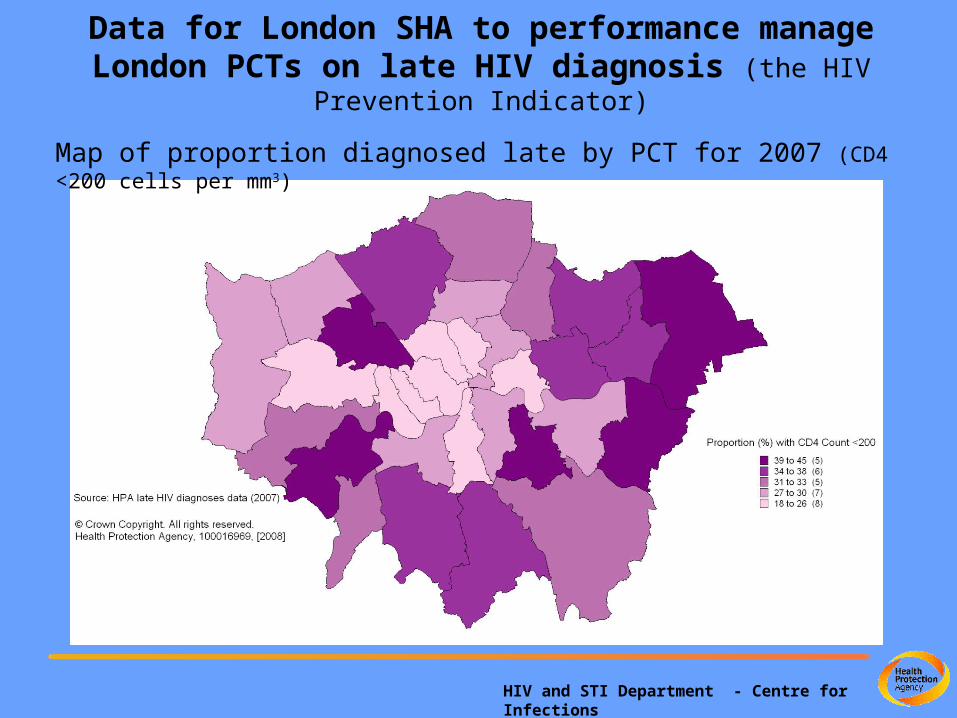
Map of proportion diagnosed late by PCT for 2007 (CD4 <200 cells per mm3)
Data for London SHA to performance manage London PCTs on late HIV diagnosis (the HIV
Prevention Indicator)
HIV and STI Department - Centre for Infections
Expanding HIV testing
HIV and STI Department - Centre for Infections
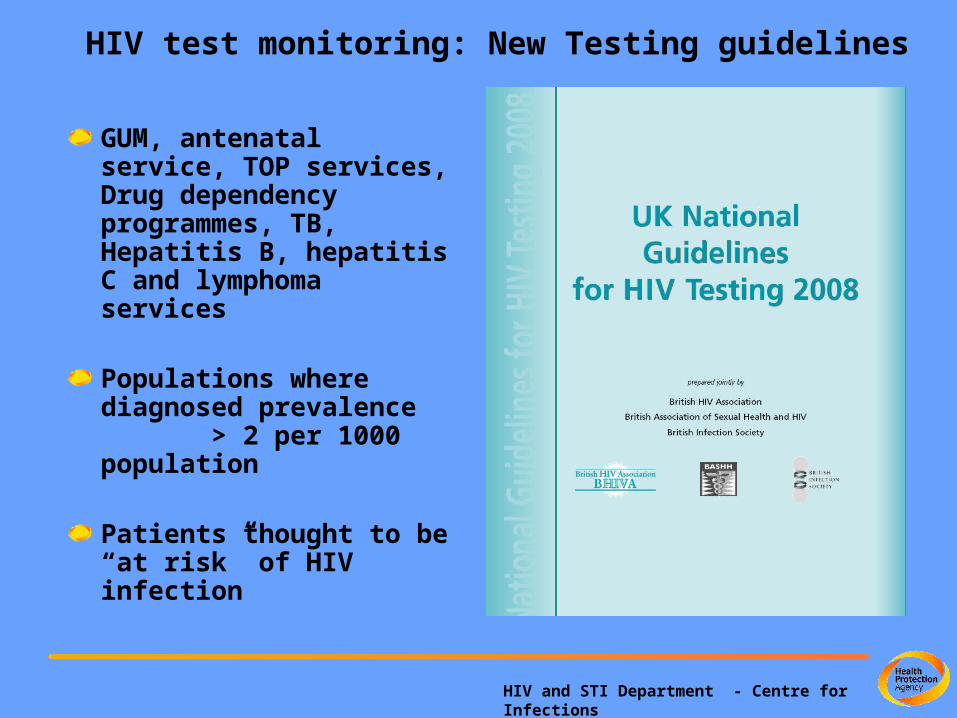
GUM, antenatal service, TOP services, Drug dependency programmes, TB, Hepatitis B, hepatitis C and lymphoma services
Populations where diagnosed prevalence > 2 per 1000 population
Patients thought to be “at risk” of HIV infection
HIV test monitoring: New Testing guidelines
HIV and STI Department - Centre for Infections
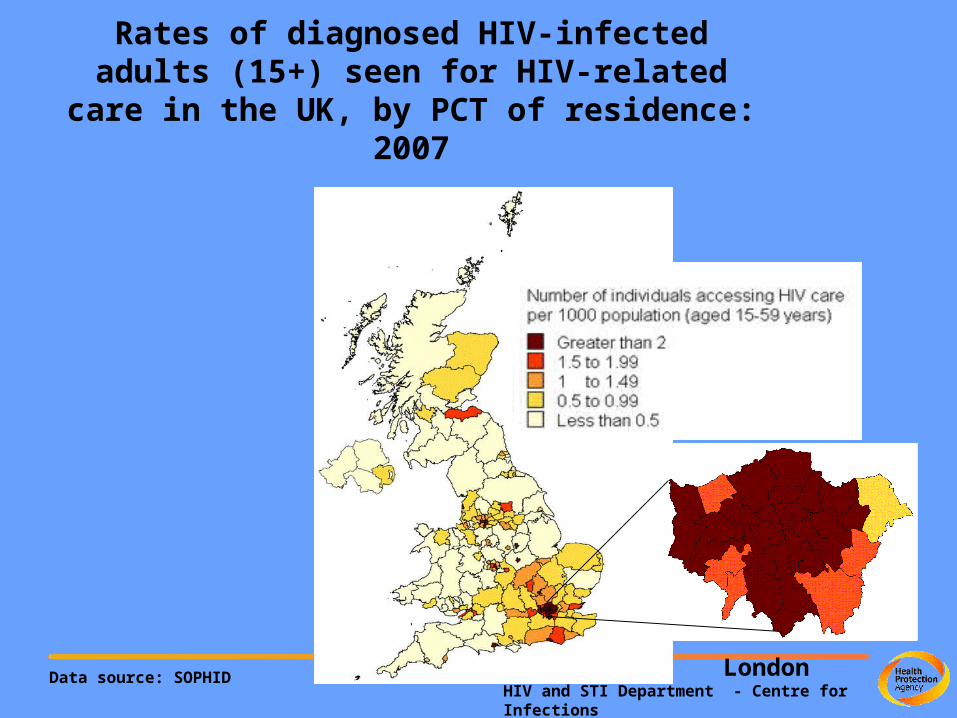
Data source: SOPHID
Rates of diagnosed HIV-infected adults (15+) seen for HIV-related care in the
UK, by PCT of residence: 2007
London
HIV and STI Department - Centre for Infections
DH funded project in 2009
Nov 2008 DH call for project proposals aimed at increasing the offer and uptake of voluntary HIV testing and reduce undiagnosed HIV
Eight projects funded (7 in high prevalence areas) to run for 6-12 months
Hospital setting (3)Community including GP (5)
EvaluationFeasibilityAcceptabilityCost effectivenessEfficacy
HIV and STI Department - Centre for Infections
Funded Projects
Leicester Routine testing 15-59 year olds3 hospitalsMedical admission units
Brighton and SussexRoutine testing 15-59 year oldsAcute general medicineUA arm
LondonRoutine testing 15-65 year olds3 hospitalsEmergency department, selected outpatients departments, acute medical unit
Brighton and HoveRoutine testing 15-59New GP registrations
HIV and STI Department - Centre for Infections
Projects cont.
London (Lewisham)Comparison of 2 modelsHIV testing in GP practices
SheffieldPiloting home samplingIncludes internet use
London (THT)Money transfer and African community shops
London (Metro Centre, West London Gay Men’s Project and Positive East)
HIV testing as part of a broader health screen within African communitiesPeer-led and nurse lead initiatives for MSM testing

HIV and STI Department - Centre for Infections
Preventing Onward Transmission
HIV and STI Department - Centre for Infections
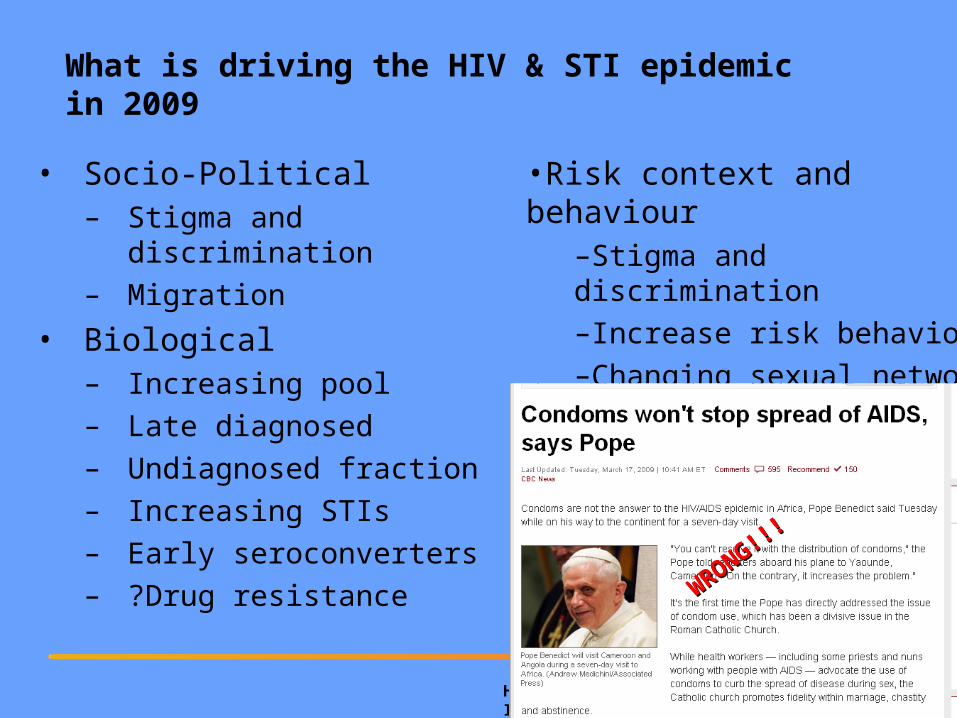
What is driving the HIV & STI epidemic in 2009
• Socio-Political– Stigma and discrimination– Migration
• Biological– Increasing pool – Late diagnosed– Undiagnosed fraction– Increasing STIs– Early seroconverters– ?Drug resistance
•Risk context and behaviour–Stigma and discrimination–Increase risk behaviours–Changing sexual networks
WRONG!!!
WRONG!!!
HIV and STI Department - Centre for Infections
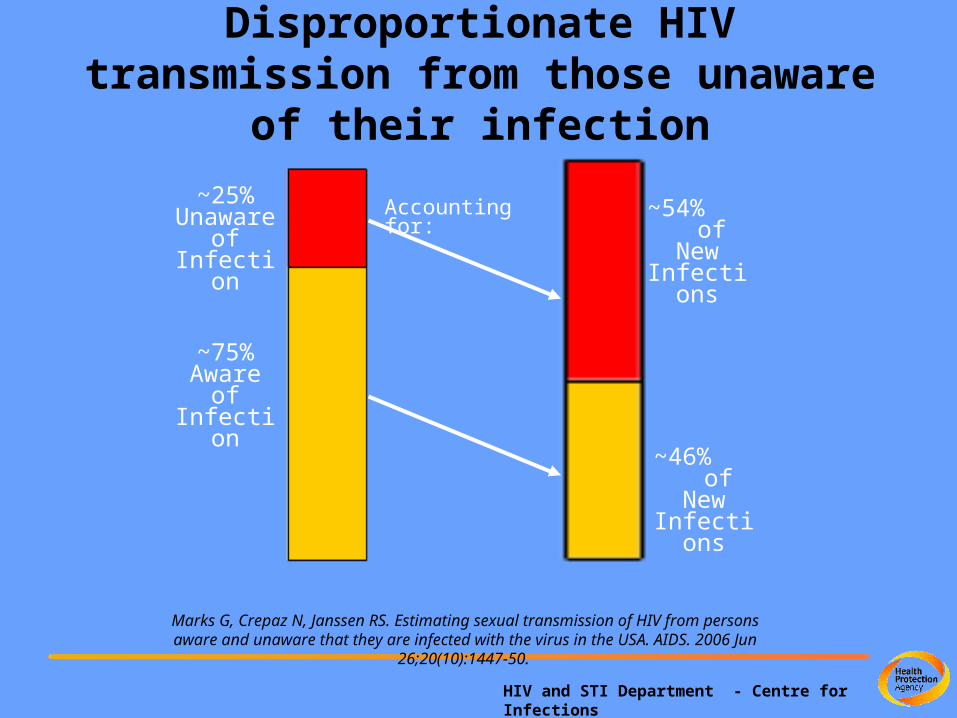
Disproportionate HIV transmission from those unaware
of their infection
~25% Unaware
of Infection
~75% Aware of Infection
Accounting for: ~54% of New
Infections
~46% of New
Infections
Marks G, Crepaz N, Janssen RS. Estimating sexual transmission of HIV from persons aware and unaware that they are infected with the virus in the USA. AIDS. 2006 Jun 26;20(10):1447-50.
HIV and STI Department - Centre for Infections
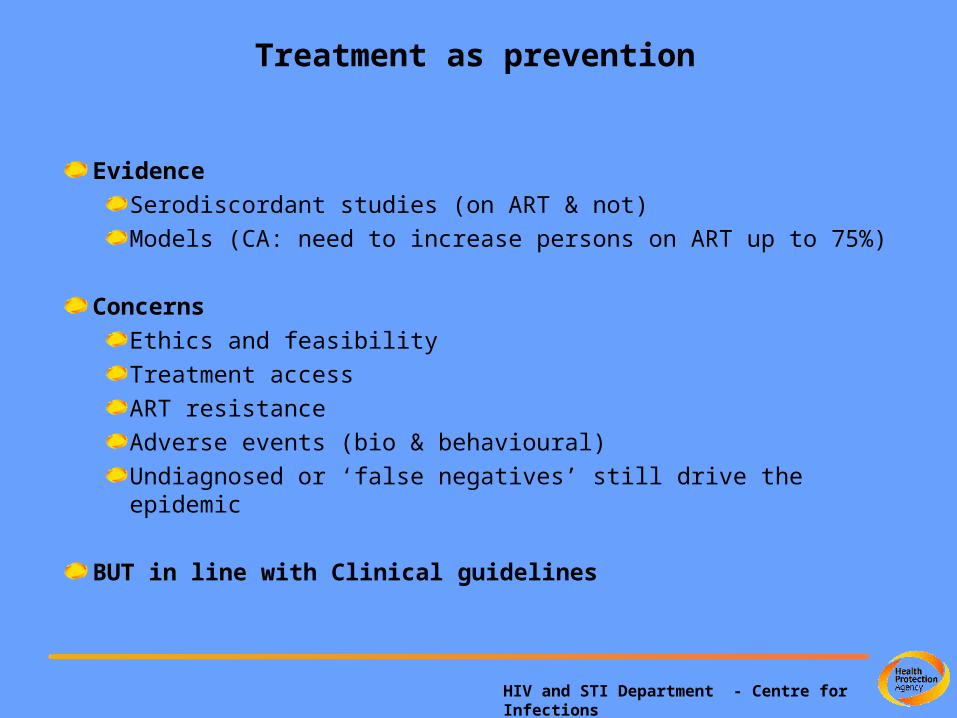
Treatment as prevention
EvidenceSerodiscordant studies (on ART & not)Models (CA: need to increase persons on ART up to 75%)
ConcernsEthics and feasibility Treatment accessART resistanceAdverse events (bio & behavioural)Undiagnosed or ‘false negatives’ still drive the epidemic
BUT in line with Clinical guidelines
HIV and STI Department - Centre for Infections
0%
5%
10%
15%
20%
25%
30%
35%
<200 200-350 >350
other Black African
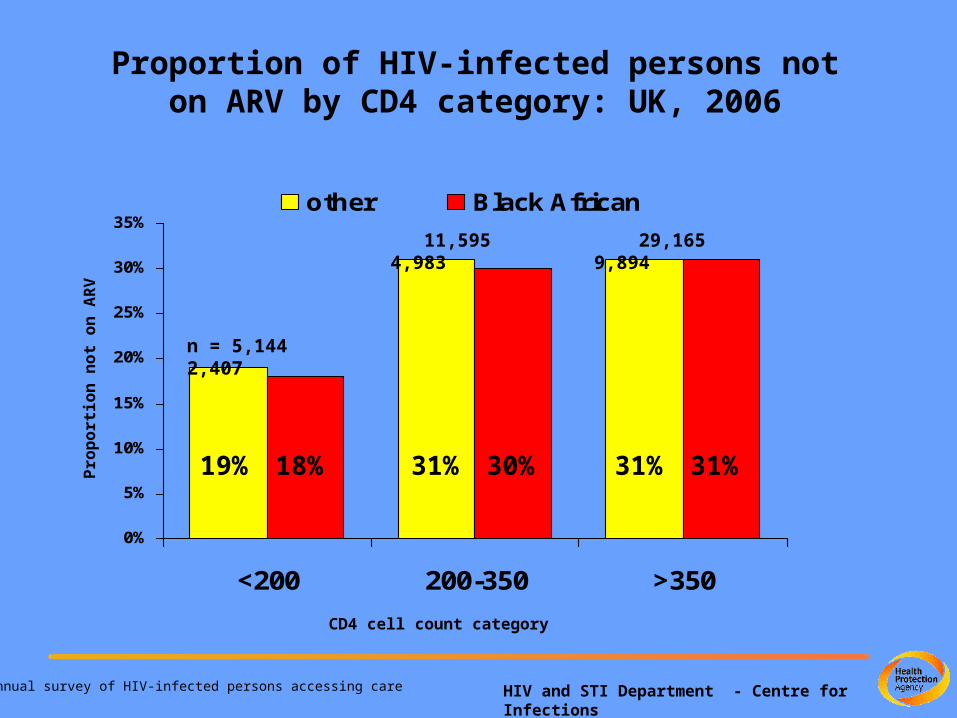
Proportion of HIV-infected persons not on ARV by CD4 category: UK, 2006
CD4 cell count category
31%19% 31%Pro
port
ion
not
on
AR
V
Annual survey of HIV-infected persons accessing care
n = 5,144 2,407
18% 30% 31%
11,595 4,983
29,165 9,894

HIV and STI Department - Centre for Infections
Next steps
• Expanding testing a must – evaluate
• This will lead to earlier treatment
• Revisiting MSM health promotion strategies• New interventions for black African and migrant
populations
• Improving surveillance to better inform programs– rollout STARHS testing to detect incident cases– better monitoring of people in care
HIV and STI Department - Centre for Infections
Thank you
Surveillance – Needs to guide and monitor prevention efforts