historical site assessment: select hanford reach national
TRANSCRIPT

PNNL-13989
Historical Site Assessment: Select Hanford Reach National Monument Lands — Fitzner/Eberhardt Arid Lands Ecology Reserve (ALE), McGee Ranch/Riverlands, and North Slope Units B. G. Fritz R. L. Dirkes T. M. Poston R. W. Hanf July 2003 Prepared for the U.S. Department of Energy under Contract DE-AC06-76RL01830

DISCLAIMER This report was prepared as an account of work sponsored by an agency of the United States Government. Neither the United States Government nor any agency thereof, nor Battelle Memorial Institute, nor any of their employees, makes any warranty, express or implied, or assumes any legal liability or responsibility for the accuracy, completeness, or usefulness of any information, apparatus, product, or process disclosed, or represents that its use would not infringe privately owned rights. Reference herein to any specific commercial product, process, or service by trade name, trademark, manufacturer, or otherwise does not necessarily constitute or imply its endorsement, recommendation, or favoring by the United States Government or any agency thereof, or Battelle Memorial Institute. The views and opinions of authors expressed herein do not necessarily state or reflect those of the United States Government or any agency thereof. PACIFIC NORTHWEST NATIONAL LABORATORY operated by BATTELLE for the UNITED STATES DEPARTMENT OF ENERGY under Contract DE-AC06-76RL01830 Printed in the United States of America Available to DOE and DOE contractors from the Office of Scientific and Technical Information, P.O. Box 62, Oak Ridge, TN 37831-0062; ph: (865) 576-8401 fax: (865) 576-5728 email: [email protected] Available to the public from the National Technical Information Service, U.S. Department of Commerce, 5285 Port Royal Rd., Springfield, VA 22161 ph: (800) 553-6847 fax: (703) 605-6900 email: [email protected] online ordering: http://www.ntis.gov/ordering.htm
This document was printed on recycled paper. (8/00)

PNNL-13989
Historical Site Assessment: Select Hanford Reach National Monument Lands � Fitzner/Eberhardt Arid Lands Ecology Reserve (ALE), McGee Ranch/Riverlands, and North Slope Units B. G. Fritz R. L. Dirkes T. M. Poston R. W. Hanf July 2003 Prepared for the U.S. Department of Energy under Contract DE-AC06-76RL01830 Pacific Northwest National Laboratory Richland, Washington 99352

iii
Summary Consistent with its current mission, the U.S. Department of Energy (DOE) plans to transfer large tracts of the Hanford Site. Specifically, DOE plans to transfer control of a large portion of the Hanford Reach National Monument (HRNM) to the U.S. Fish and Wildlife Service (FWS). Three distinct units of HRNM have been designated for transfer to FWS: • Fitzner/Eberhardt Arid Lands Ecology Reserve (ALE) Unit • McGee Ranch/Riverlands Unit • North Slope Unit (including Wahluke Slope and Saddle Mountain Wildlife Refuge).
To determine and document past operations on these units of the HRNM, a historical site assessment was conducted. The objectives of this assessment were to determine locations where radioactive contam-ination may exist on these units, what activities could have resulted in radioactive contamination of these units, which radionuclides are most likely to exist at locations within these units, and to estimate concen-trations of radionuclides within these units. This assessment used historical environmental monitoring data, an extensive literature review, interviews with individuals who possessed insight about past operations, and a review of old photographs to achieve the objectives of the historical site assessment. Data about air, biota, soil, vegetation, and water samples that were collected through past environ-mental monitoring programs were reviewed. External radiation measurements using thermoluminescent dosimeters (TLD) were also evaluated to provide estimates of direct exposure. Although relatively few environmental samples had been collected directly from the monument for the purpose of characterizing the radionuclide levels present in these environs, past environmental programs have generated significant quantities of environmental data that are useful for these purposes. Conclusions about the level of contamination potentially present on units of the HRNM must be interpreted, interpolated, and extra-polated to some extent from samples collected on and near the monument. In general, the data available indicate that there are very low concentrations of radionuclides on or around the HRNM units evaluated in this review. These concentrations are very near the analytical detection levels in most cases, making comparisons of values from different locations difficult. Further, the data do not indicate a strong likelihood of transport of significant amounts of long-lived radioactive material from Hanford operating areas to any of the HRNM units evaluated in this site assessment. The median radionuclide concentrations in each media were generally similar at each unit. In addition, the majority of the observed concentrations on the monument units were similar to the concentrations observed at reference locations. Reference locations were places far enough away from Hanford to be considered unaffected by Hanford emissions of radionuclides. This implies that atmospheric fallout from above ground weapons testing contributed significantly to the concentrations of manmade radionuclides that were measured by historical sampling programs. The historical data available indicated the concen-trations likely to be present on the monument land were very low and the likelihood was small that a monument unit would exceed typical risk-based threshold concentrations or dose rates. Specific conclu-sions about each monument unit are provided.

iv
• ALE Unit - In general, comparison of environmental measurements on or near ALE to the locations in areas least likely to be affected by Hanford operations (reference locations) revealed that radio-nuclide concentrations from both areas were similar. The radionuclide concentrations observed on the ALE Unit were generally in the range observed at distant locations. Strontium-90 concentrations observed in air on or near the ALE Unit, while extremely low, appeared to be slightly elevated when compared to strontium-90 concentrations observed at distant locations. However, the difference was not statistically significant (two-sample t-test, 95% confidence).
Although the radionuclide levels at the lysimeter plots on ALE were determined to be at or below
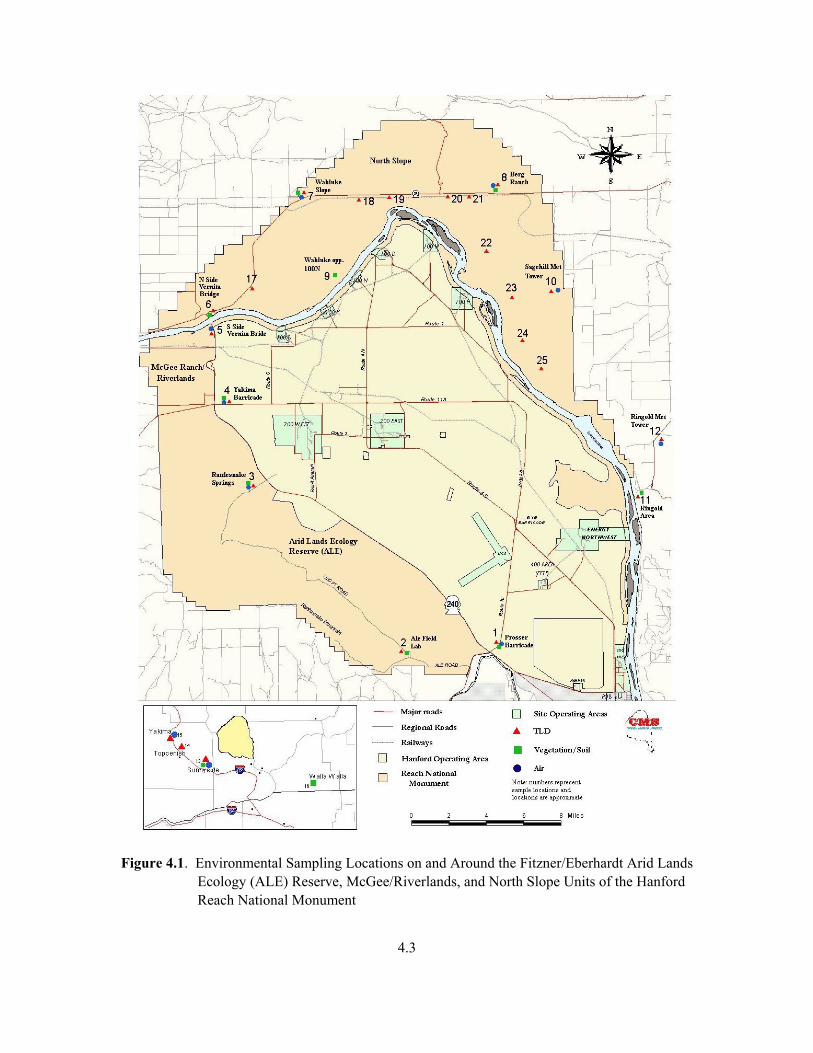
background levels, these areas likely have some potential for residual radioactive material to be present. There was also evidence that the southern portion of the ALE reserve could have received increased atmospheric fallout of radioactive materials (plutonium 239/240) from early operations in the 200 Areas, although the levels observed were very low. Several buildings (6652-G, 6652-H, 6652-I, 6652-J, and 6652-M) on ALE housed activities that may have involved the use of radiological material, and therefore, have some potential for residual contamination.
• McGee Ranch/Riverlands Unit - The McGee Ranch/Riverlands Unit is upstream and predominantly
upwind from the Hanford operating areas, and thus, had a low potential for contamination through the air or water pathway. In general, comparison of environmental measurements on or near the McGee Ranch/Riverlands Unit to locations in areas least likely to be affected by Hanford operations (reference locations) confirmed that radionuclide concentrations from both areas were similar. The radionuclide concentrations observed on McGee Ranch/Riverlands Unit were generally in the range observed at distant locations.
The most likely source of potential radiological contamination remaining on the McGee Ranch/
Riverlands Unit is the Riverlands Classification Yard. The washing of rail cars in the early years of Hanford resulted in radiological contamination dispersed within the yard. This site was cleaned up and released with concentration levels below the Washington Administrative Code requirements for a residential area.
• North Slope Unit - Much of the North Slope Unit is downstream and downwind of past Hanford
operating areas and present cleanup activities. In general, comparison of environmental measure-ments on or near the North Slope Unit to the locations in areas least likely to be affected by Hanford operations (reference locations) determined that radionuclide concentrations from both areas were similar. The radionuclide concentrations observed on the North Slope were generally in the range observed at distant locations.
The southeast corner of the North Slope Unit is the area with the highest potential for radiological
contamination within this unit. There were indications of slight increases in radionuclide concen-trations and/or external radiation levels on and around Savage Island and Ringold. This could have resulted from atmospheric deposition of Hanford effluent, or more likely, from the deposition of waterborne radioactive particles in the sloughs around Savage Island.

v
Acknowledgments This document is the result of a cooperative effort involving individuals from numerous organizations across the Hanford complex, for which the authors are grateful. The Radiological Land Clearance Advisory Group (RLCAG), which was comprised of representatives from the U.S. Department of Energy � Richland Operations Office (DOE-RL), Fluor Hanford, Inc. (FHI), Pacific Northwest National Laboratory (PNNL), Washington Department of Health (WDOH), and the U.S. Fish and Wildlife Service (FWS), proved invaluable in providing direction and guidance throughout the document design, preparation, review, and production processes. The authors extend their gratitude to the following individuals for their contributions:
Robert J. Ford, PNNL Wayne M. Glines, DOE-RL H. Boyd Hathaway, DOE-RL Thom W. Hogg, FHI Ronald L. Ingram, FHI Debra McBaugh, WDOH William J. Millsap, FHI David B. Ottley, FHI Mike Priddy, WDOH Mike Ritter, FWS Dana C. Ward, DOE-RL Ed F. Yancey, FHI Jamie Zeisloft, DOE-RL
The authors would like to acknowledge several key individuals for their contributions toward the completion of a quality final document. Georganne O�Connor and Launa Morasch provided invaluable assistance in coordinating the document; organizing the inputs of multiple authors into a readable and consistent format; editing; and carrying the document through final production. Jennifer Lana was instrumental in the development of meaningful site maps, adding significantly to the readability of the report. The insight provided by Greg Patton during his technical review of the document is also acknowledged. Lila Andor, Rose Urbina, and Kathy Neiderhiser compiled numerous figures and tables and provided extensive word processing support as well. Thank you all.

vii
Contents
Summary ............................................................................................................................................ iii Acknowledgments.............................................................................................................................. vii Acronyms........................................................................................................................................... xiii 1.0 Introduction ............................................................................................................................... 1.1 1.1 Objectives and Scope ........................................................................................................ 1.1 1.2 Report Contents................................................................................................................. 1.3 2.0 Background Information............................................................................................................ 2.1 2.1 Overview of the Hanford Site: DOE Operations.............................................................. 2.1 2.2 Non-DOE Operations........................................................................................................ 2.4 2.3 National Monument Lands................................................................................................ 2.4 2.3.1 ALE Unit ................................................................................................................ 2.5 2.3.2 McGee Ranch/Riverlands Unit .............................................................................. 2.6 2.3.3 North Slope Unit .................................................................................................... 2.6 3.0 Contaminant Transport Pathways Conceptual Model ............................................................... 3.1 3.1 Potential Contaminant Sources: Radiological Wastes, Effluents, HRNM Buildings, and Research Activities ..................................................................................................... 3.1 3.1.1 Solid Waste ............................................................................................................ 3.3 3.1.2 Liquid Waste .......................................................................................................... 3.3 3.1.3 Airborne Emissions ................................................................................................ 3.4 3.1.4 HRNM Buildings and Research Activities ............................................................ 3.5 3.2 Air Transport Pathway ...................................................................................................... 3.5 3.3 Liquid Transport Pathway................................................................................................. 3.7 3.4 Solid Waste Storage and Disposal .................................................................................... 3.7 3.5 Biotic Transport Pathway.................................................................................................. 3.7 4.0 Environmental Data Review and Discussion of Results ........................................................... 4.1 4.1 Environmental Monitoring Programs................................................................................ 4.1 4.1.1 Environmental Data Review .................................................................................. 4.2 4.1.2 External Radiation Surveys .................................................................................... 4.6 4.1.3 Dose Assessments .................................................................................................. 4.7

viii
4.1.4 Evaluation of Historical Photographs..................................................................... 4.7 4.1.5 Biological Monitoring ............................................................................................ 4.8 4.1.6 Interviews ............................................................................................................... 4.9 4.2 Evaluation of Data from the Arid Lands Ecology Reserve Unit....................................... 4.9 4.2.1 Soil Monitoring ...................................................................................................... 4.9 4.2.2 Vegetation Monitoring ........................................................................................... 4.10 4.2.3 Air Monitoring ....................................................................................................... 4.12 4.2.4 Direct Radiation Monitoring .................................................................................. 4.13 4.2.5 Water Monitoring................................................................................................... 4.14 4.2.6 ALE Buildings and Research Activities................................................................. 4.14 4.3 Evaluation of Data from the McGee/Riverlands Unit....................................................... 4.17 4.3.1 Soil Monitoring ...................................................................................................... 4.17 4.3.2 Vegetation Monitoring ........................................................................................... 4.17 4.3.3 Air Monitoring ....................................................................................................... 4.19 4.3.4 Direct Radiation Monitoring .................................................................................. 4.19 4.3.5 Water Monitoring................................................................................................... 4.20 4.3.6 Railroad .................................................................................................................. 4.20 4.4 Evaluation of Data from the North Slope Unit.................................................................. 4.22 4.4.1 Soil Monitoring ...................................................................................................... 4.22 4.4.2 Vegetation Monitoring ........................................................................................... 4.27 4.4.3 Air Monitoring ....................................................................................................... 4.28 4.4.4 Direct Radiation Monitoring .................................................................................. 4.29 4.4.5 Water Monitoring................................................................................................... 4.31 4.4.6 Buildings and Structures ........................................................................................ 4.31 4.5 Reference Concentrations ................................................................................................. 4.31 4.5.1 Reference Soil and Vegetation Data ...................................................................... 4.33 4.5.2 Reference Air Data................................................................................................. 4.33 4.5.3 Reference TLD Data .............................................................................................. 4.33 4.5.4 Reference Water Data ............................................................................................ 4.33 5.0 Conclusions ............................................................................................................................... 5.1 5.1 ALE Unit ........................................................................................................................... 5.1 5.2 McGee Ranch/Riverlands Unit ......................................................................................... 5.2 5.3 North Slope Unit ............................................................................................................... 5.2 6.0 References ................................................................................................................................. 6.1 Appendix A � Personal Communications Summaries ....................................................................... A.1 Appendix B � Summary of Historical Environmental Data .............................................................. B.1 Appendix C � ALE Building Summary............................................................................................. C.1 Appendix D � Bibliography............................................................................................................... D.1

ix
Appendix E � Hanford Sitewide Surface Environmental Surveillance Sampling Locations ............ E.1
Figures 1.1 Hanford Reach National Monument Units............................................................................... 1.2 2.1 The Hanford Site and Surrounding Area.................................................................................. 2.2 3.1 Contaminant Transport Pathways Conceptual Model.............................................................. 3.2 3.2 Hanford Meteorological Monitoring Network Wind Roses at 60-Meter Level,
1986 through 2001..................................................................................................................... 3.6 4.1 Environmental Sampling Locations on and Around the Fitzner/Eberhardt Arid Lands
Ecology Reserve, McGee/Riverlands, and North Slope Units of the Hanford Reach National Monument................................................................................................................... 4.3
4.2 Points of Interest Within the ALE Unit Boundary .................................................................... 4.11 4.3 ALE Headquarters Buildings, Lysimeter Plot, and Elk Pen in the 1970s ................................. 4.15 4.4 Buildings and Structures on the Peak of Rattlesnake Mountain................................................ 4.16 4.5 Points of Interest Within the McGee/Riverlands Unit Boundary .............................................. 4.18 4.6 Riverlands Classification Yard in the 1940s as Seen from the Air ........................................... 4.23 4.7 Close-Up View of the Riverlands Classification Yard, 1940s .................................................. 4.23 4.8 Riverlands Classification Yard in the 1990s as Seen from the Air ........................................... 4.24 4.9 Monitoring Locations On or Near the North Slope Unit ........................................................... 4.25

x
Tables 3.1 Radioactive Air Emissions from Hanford Operations ............................................................. 3.4 4.1 Routine Environmental Sampling Location Names and Sampling Periods for Locations on and Near the HRNM ........................................................................................................... 4.4 4.2 Radionuclides Evaluated in this Review and their Respective Half-Lives .............................. 4.5 4.3 Estimated Maximally Exposed Individual Doses to a Member of the Public From Hanford Emissions ................................................................................................................... 4.8 4.4 Results from Historical Soil Samples Collected on the Fitzner/Eberhardt Arid Lands
Ecology Reserve Unit .............................................................................................................. 4.10 4.5 Results of 1979 Soil Samples Collected Along 1,200-Foot Road on the ALE Reserve .......... 4.11 4.6 Results from Historical Vegetation Samples Collected on the Fitzner/Eberhardt Arid
Lands Ecology Reserve Unit.................................................................................................... 4.12 4.7 Results from Historical Air Samples Collected on the Fitzner/Eberhardt Arid Lands
Ecology Reserve Unit .............................................................................................................. 4.13 4.8 External Radiation Dose Rates Measured by Thermoluminescent Dosimeters on the Fitzner/Eberhardt Arid Lands Ecology Reserve Unit .............................................................. 4.14 4.9 Radionuclide Concentrations in Soil Samples Collected on the McGee/Riverlands
Unit in 1992 ............................................................................................................................. 4.18 4.10 Results from Historical Air Samples Collected on the McGee/Riverlands Unit ..................... 4.19 4.11 External Radiation Dose Rates Measured by TLDs on the McGee/Riverlands Unit............... 4.20 4.12 Results from Historical Water Sampling Near the McGee/Riverlands Unit............................ 4.21 4.13 Maximum Concentrations of Gamma-Emitting Radionuclides for Soil Samples Collected
at Riverland Classification Yard in 1993 ................................................................................. 4.22 4.14 Results from Historical Soil Samples Collected on the North Slope Unit ............................... 4.24 4.15 Radionuclide Concentrations in Soil from a 1992 Research Study Along the Columbia River Shoreline........................................................................................................ 4.26 4.16 Results of Control Location Soil Samples Collected for 1994 Study ...................................... 4.26 4.17 Median Radionuclide Concentrations from Unreported Results of Samples Collected in 1971 and 1972 .......................................................................................................................... 4.27
xi
4.18 Results from Historical Vegetation Samples Collected on the North Slope Unit .................... 4.28 4.19 Results of Control Location Vegetation Samples Collected for 1994 Study ........................... 4.28 4.20 Results from Historical Air Samples Collected on the North Slope Unit ................................ 4.29 4.21 External Radiation Dose Rates Measured by Thermoluminescent Dosimeters on the North Slope Unit ...................................................................................................................... 4.30 4.22 Results from Historical Water Sampling Near the North Slope Unit ...................................... 4.32 4.23 Results from Historical Soil Sampling at Reference Locations ............................................... 4.34 4.24 Results from Historical Vegetation Sampling at Reference Locations .................................... 4.35 4.25 Results from Historical Air Sampling at Reference Locations ................................................ 4.36 4.26 External Radiation Dose Rates Measured by TLDs at Reference Locations ........................... 4.36
xiii
Acronyms
ALE Fitzner-Eberhardt Arid Lands Ecology Reserve
CFR Code of Federal Regulations
DOE U.S. Department of Energy
EPA U.S. Environmental Protection Agency
FFTF Fast Flux Test Facility
FHI Fluor Hanford Inc.
FWS U.S. Fish and Wildlife Service
HEIS Hanford Environmental Information System
HEPA High Efficiency Particulate Arrestor
HRNM Hanford Reach National Monument
MEI Maximally Exposed Individual
MTCA Model Toxics Control Act
PCB Polychlorinated Biphenyls
PNNL Pacific Northwest National Laboratory
PUREX Plutonium-Uranium Extraction Plant
TLD Thermoluminescent Dosimeter
WAC Washington Administrative Code
WDOH Washington State Department of Health

1.1
1.0 Introduction For more than 40 years, U.S. Department of Energy (DOE) Hanford Site facilities were dedicated primarily to the production of plutonium for national defense and management of the resulting waste. The current Hanford Site mission focuses on cleaning up and shrinking the size of the site from 1,518 square kilometers to 194 square kilometers by 2012. The cleanup mission includes restoring the Columbia River corridor, transitioning the Central Plateau, and preparing for the future by getting ready for long-term stewardship of DOE lands (DOE 2001). Consistent with the current mission, DOE plans to transfer portions of the Hanford Site to other federal agencies or private entities within the next 3 to 5 years. Current plans include the transfer of a large part of DOE-owned land on the Hanford Reach National Monument (HRNM) to the U.S. Fish and Wildlife Service (FWS). Three distinct portions of HRNM have been designated for transfer to FWS: (1) The Fitzner/Eberhardt Arid Lands Ecology Reserve (ALE) Unit, (2) the McGee/Riverlands Units, and (3) the North Slope Unit. These Units are shown in Figure 1.1. The land release assessment included (1) reviewing historical environmental data collected on and around some HRNM units, and (2) developing a contaminant transport conceptual model. The purpose of the model was to document the environmental pathways through which radiological contaminants may have been deposited onto, or are otherwise present, at HRNM sites and to focus subsequent monitoring activities on the land release process. 1.1 Objectives and Scope The objectives of this historical site assessment are to: • Describe activities known or suspected to have taken place on and around HRNM units evaluated by
this assessment that would, or would likely, have led to radioactive contamination (buildings and land).
• Describe existing key environmental data useful in determining whether there is a potential for
elevated radionuclide concentrations. • Provide a map of the lands of interest illustrating the locations of potentially elevated radiological
contaminant concentrations. • Develop a conceptual model of contaminant transport to identify potential pathways for radioactive
contaminant transport to certain HRNM units and guide the design of subsequent sampling programs.

1.2
Figure 1.1. Hanford Reach National Monument Units

1.3
The conceptual model provided a simplified representation of the potential pathways through which contaminants from operating facilities at Hanford may have been transported to specific HRNM units. Components included in the conceptual model and which are discussed in more detail in this report are: • Contaminant sources (radiological wastes, effluents, operational activities) • Air transport pathway • Liquid transport pathway • Solid waste storage and disposal pathway • Biotic transport pathway
1.2 Report Contents Section 2 of this report describes the Hanford Site and those lands designated for transfer to FWS, past Hanford Site operations, current missions, land uses, and activities performed on the HRNM sites. The contaminant transport conceptual model is presented in Section 3. Section 4 describes the envi-ronmental monitoring programs and discusses the data review and results. Conclusions are outlined in Section 5. References are provided in Section 6. Appendices A through E provide supporting information.

2.1
2.0 Background Information Understanding the historical missions and activities at the Hanford Site is essential in reviewing and interpreting environmental data collected in conjunction with past and current activities at Hanford. It is also the fundamental basis used to develop the conceptual model of contaminant transport. This under-standing will be critical in designing and implementing any radiological surveys and environmental sampling plans that may be needed to provide the necessary data for the radiological release of the HRNM lands. 2.1 Overview of the Hanford Site: DOE Operations The Hanford Site was established in 1943 to produce plutonium for some of the nuclear weapons tested and used in World War II. The site was selected by the U.S. Army Corps of Engineers because it was remote from major populated areas and had (1) ample electrical power from Grand Coulee Dam, (2) a functional railroad, (3) clean water from the nearby Columbia River, and (4) sand and gravel that could be used to construct large concrete structures. Hanford was the first plutonium production facility in the world. The Hanford Site lies within the semiarid Pasco Basin of the Columbia Plateau in southeastern Washington State (Figure 2.1). The site presently occupies an area of 1,518 square kilometers located north of the city of Richland and the confluence of the Yakima and Columbia Rivers (DOE 1999). Much of the site (including the majority of HRNM under consideration in this site assessment) served as a safety and security buffer around the production facilities. The Hanford Site has restricted public access and continues to provide a buffer zone for smaller industrialized areas on the site that historically were used for production of nuclear materials, waste storage, and waste disposal. The Columbia River flows eastward through the north part of the Hanford Site and then turns south, forming part of the eastern site boundary. The Yakima River flows near a portion of the south boundary and joins the Columbia River at the city of Richland. The major DOE operational, administrative, and research areas on and around the Hanford Site (Figure 2.1) include the following: • The 100 Areas are located along the south shore of the Columbia River from river mile 368 upstream
to river mile 384. These are the sites of nine retired plutonium production reactors, including the dual-purpose N Reactor (in the 100 N Area). The first eight reactors were constructed between 1943 and 1955 and entered retirement starting in 1964 with the DR Reactor and concluding with the KE Reactor in January 1971 (UNI 1981). The ninth reactor, N Reactor, was completed in 1963 and was a modified design that circulated cooling water through the reactor core in a closed-loop cooling system. Beginning in 1966, heat from the closed-loop system was used to produce steam that was sold to Energy Northwest to generate 860 megawatts of electricity at the adjacent Hanford Generating Plant. From the early 1960s until its shutdown in 1987, N Reactor produced weapons-grade material.

2.2
Figure 2.1. The Hanford Site and Surrounding Area

2.3
Electricity production continued during this operating period but was actually a by-product of the weapons production program. All the Hanford production reactors and most associated facilities in the 100 Areas have been shut down. Each of the 100 Area reactor sites is currently in some stage of cleanup, decommissioning, or restoration. The 100 Areas collectively occupy ~10 square kilometers.
• The 200 West and 200 East Areas are located on a plateau in the center of the Hanford Site. These
areas are located ~8 and 11 kilometers respectively, south and west of the Columbia River. These areas house facilities that received and dissolved irradiated fuel from the reactors in the 100 Areas and then separated out the plutonium and other products. The facilities are now in various stages of decontamination and decommissioning or alternate use. The 200 Areas cover ~15.5 square kilometers.
• The 300 Area is located just north of the city of Richland. From the early 1940s until the advent
of the cleanup mission, most research and development activities at the Hanford Site were carried out in the 300 Area. The 300 Area was also the location of nuclear fuel fabrication. Nuclear fuel in the form of pipe-like cylinders (fuel elements) was fabricated from metallic uranium delivered from offsite production facilities. A few former fuel fabrication buildings and facilities are now used for other purposes or some are in various stages of cleanup or restoration. This area covers ~1.5 square kilometers.
• The 400 Area is the location of the Fast Flux Test Facility (FFTF). In addition to research and
development activities in the 300 Area, the Hanford Site has supported several test facilities. The largest is the Fast Flux Test Facility, located ~8 kilometers northwest of the 300 Area and covers ~0.6 square kilometer. This special nuclear reactor was designed to test various types of nuclear fuel. The facility operated for ~13 years and was shut down in 1993. The reactor was a unique design that used liquid sodium metal as the primary coolant. The heated liquid sodium was cooled with atmospheric air in heat exchangers. Spent fuel from the facility resides in the 400 Area, while other waste was transported to the 200 Areas. With the exception of the spent fuel, no major amounts of radioactive waste were stored or disposed of at the Fast Flux Test Facility site. Current plans call for FFTF to be decommissioned, and the liquid sodium was drained from the reactors secondary cooling loops in the spring of 2003.
• The 600 Area includes all of the Hanford Site not occupied by the 100, 200, 300, and 400 Areas.
• The former 700 Area is an obsolete designation that included all DOE facilities located within the city
of Richland. • The former 1100 Area is located generally between the 300 Area and the city of Richland. This area
included site support services such as general stores and transportation maintenance. On October 1, 1998, this area was transferred to the Port of Benton as a part of DOE�s economic diversification efforts and is no longer part of the Hanford Site. However, DOE contractors continue to lease facilities in this area.

2.4
• The Richland North Area (off the site) includes DOE and contractor facilities, mostly leased office buildings, generally located in the northern part of the city of Richland.
2.2 Non-DOE Operations Non-DOE radiological operations and activities on Hanford Site leased land or in leased facilities include commercial power production by Energy Northwest (1.4 square kilometers) and operation of a commercial low-level radioactive waste burial site by U.S. Ecology, Inc. (0.5 square kilometer). Energy Northwest, formerly known as the Washington Public Power Supply System, operates a nuclear power plant now known as the Columbia Generating Station (WNP-2) on land leased from DOE on the Hanford Site. The site is situated about 16 kilometers north of the city of Richland and about 4 kilometers west of the Columbia River. Originally, three reactors were planned at this location, WNP-1, WNP-2, and WNP-4, but the WNP-2 Reactor was the only one completed. Near the city of Richland, immediately adjacent to the south boundary of the Hanford Site, Framatome ANP, Inc. operates a commercial nuclear fuel fabrication facility, and Allied Technology Group Corporation operates a low-level radioactive waste decontamination, super compaction, and packaging facility. Several non-radiological operations exist on or near DOE land. The National Science Foundation has built the Laser Interferometer Gravitational-Wave Observatory facility for gravitational wave studies. R. H. Smith Distributing operates vehicle-fueling stations in North Richland and in the 200 Areas. Livingston Rebuild Center, Inc. has leased the 1171 Building, North Richland, to rebuild train locomotives. Johnson Controls, Inc. operates 42 diesel and natural gas package boilers to produce steam in the 200 and 300 Areas (replacing the old coal-fired steam plants) and also has compressors supplying compressed air to the site. 2.3 National Monument Lands On June 9, 2000, the Hanford Reach and portions of other undeveloped lands on the Hanford Site area were designated a national monument (Figure 1.1) by the Clinton Administration (65 FR 144). On June 14, 2001, DOE and FWS signed a memorandum of understanding covering management responsi-bilities for the monument lands. The monument includes 792.5 square kilometers of the Hanford Site. FWS currently administers three management units of the monument including: (1) the Fitzner/Eberhardt Arid Lands Ecology Reserve Unit (ALE Unit), a 310.8 square kilometer tract in the southwest portion of the Site; (2) the Saddle Mountain Unit, a 129.5 square kilometer tract located north-northwest of the Columbia River and generally south and east of State Highway 24; and (3) the Wahluke Unit, an 225.3 square kilometer tract located north and east of both the Columbia River and the Saddle Mountain Unit. The Saddle Mountain Unit and the Wahluke Unit together are generally referred to as the North Slope Unit. Portions of the HRNM administered only by DOE includes the McGee Ranch/Riverlands Unit (located on the west portion of the Hanford Site and bordered by State Highway 24, the Columbia River, private land in the Cold Creek Valley, and the Yakima Firing Center), the Columbia River islands of Benton County, the Columbia River Corridor (0.4 kilometer inland from the river shoreline) on the Hanford (Benton County) side of the river, and the sand dunes area located along the Columbia River

2.5
north of Energy Northwest. Approximately 1.6 square kilometers along the north side of the Columbia River, west of the Vernita Bridge, and south of State Highway 243 are managed by the Washington State Department of Fish and Wildlife. 2.3.1 ALE Unit Prior to the Manhatten Project, parts of the ALE Unit were privately owned ranches around Sniveley Springs and the Benson Ranch. The owners of these ranches were evicted in 1943. In addition to the cultivation of agriculture products (hay, wheat), the land was used for grazing sheep, cattle, and horses. There was also some natural gas exploration on ALE lands in its early history. The ALE Unit was established in 1967 by the U.S. Atomic Energy Commission as a buffer area for Hanford operations and a preserve for native shrub-steppe vegetation. The unit also was proclaimed a National Environmental Research Park in the 1970s. Wildfires in 1984, 1999, and 2000 devastated much of the native vegetation on the ALE Unit and damaged or destroyed some of the historical ranch buildings. There were no weapons production or waste management activities conducted on the ALE Unit. The site contained Nike missile installations at the current location of the ALE headquarters (H-52-L) and the observatory (H-52-C) on top of Rattlesnake Mountain (Harvey 2002). The Nike missile sites were abandoned in 1960 just prior to the closure of Camp Hanford in 1961. The ALE headquarters buildings (6652-C) were used for ecological research from the 1970s into the early 1990s. A small research facility was also constructed near Rattlesnake Springs that operated from the late 1960s through the early 1990s. The ALE Unit was a preferred field ecological research site because it was relatively undisturbed (aside from past grazing and a small amount of agriculture), had a closed intermittent stream, convenient access, roads, electrical power, and it was close to Richland (K. R. Price, C. E. Cushing, W. H. Rickard, personal communications, see Appendix A). Radiological materials were used in some of the research performed on ALE. The research activities can be broken down into two groups: ecological research (i.e., field research) that used radioactive isotopes as tracers, and lysimeter studies that monitored the uptake of actinides by plants. Radionuclides used in the tracer studies have short half-lives and have decayed away, while the half-lives of radionu-clides used in the lysimeter studies have longer half-lives. In the 1960s, Dr. L. K. Bustad, a research scientist at Hanford, studied the uptake of fallout radioactivity in sheep that were allowed to graze on ALE lands; however, no radionuclides were deliberately released to the site or fed to the sheep (W. H. Rickard, personal communication, see Appendix A). These studies are discussed in greater detail in Section 4.2. A 1996 close-out report for the ALE Unit (Bechtel 1996) identified the lysimeter plots as potential sources of radiological contamination. Other locations on the ALE reserve that were identified as potential areas of radiological contamination included several facilities that housed laboratories (buildings 6652-G, 6652-H, 6652-I, 6652-J, and 6652-M). The report also stated that two separate sets of charac-terization samples were collected on the lysimeter plots and analyzed for radiological contamination. At the conclusion of the second study, a small amount of soil (0.2 cubic meter) was removed from one lysimeter plot.

2.6
2.3.2 McGee Ranch/Riverlands Unit The McGee Ranch/Riverlands Unit is located on the northwest portion of the Hanford Site, bordered by State Highway 24, the Columbia River, private land in the Cold Creek Valley. This unit includes a former pioneer ranch, McGee Ranch. As in the case for all of the newly formed Hanford Site, residents were evicted in 1943. Two anti-aircraft installations along Highway 24 were in this unit until Camp Hanford was removed in 1961 (Harvey 2002). Some military exercises were conducted around 1968 or 1969, following the closure of Camp Hanford (K. R. Price, personal communication, see Appendix A.). None of the military operations conducted on the McGee/Riverlands Unit involved the use of radioactive materials. In the 1980s, a private business used the thermal artesian wells on the McGee Ranch to raise tropical fish. This operation eventually failed (K. R. Price, personal communication, see Appendix A). The Riverlands part of this unit was more involved with the early history of the Hanford Site. The Riverland Classification Yard was an area comprised of a strip of land 1,768 meters long and 122 meters wide, located 4.8 kilometers west of the 100 B Area near the Midway Substation on the Columbia River side of the existing track spur of the Chicago, Milwaukee, St. Paul and Pacific Railroad that operated between Beverly and Hanford. The Riverland Classification Yard was constructed in 1943 and was decommissioned in 1964 (Keating and Harvey 2002). Railroad cars that had transported contaminated material were washed at the Riverlands complex resulting in the establishment of radiological control zones for low level ground contamination. These control zones at the railroad site were cleaned-up, surveyed and released during the 1990s. While most ecological research was performed on the ALE Unit, some field plant physiology studies were conducted on McGee Ranch. However, none of these studies involved the used of radioactive materials, with the possible exception of soil density (neutron) probes, which would not be expected to result in radiological contamination of the unit. In 1996, DOE, U.S. Environmental Protection Agency (EPA), and Washington State Department of Ecology (Ecology) agreed that no further cleanup actions were required on the McGee Ranch/Riverlands Unit (also known as operable unit 100-IU-1). The record of decision (DOE 1996) states that previous cleanup activities had cleaned up all contaminants to levels below Washington Administrative Code (WAC) 173-340 Model Toxics Control Act (MTCA) residential standards. This included both radiation and non-radiation contamination. 2.3.3 North Slope Unit The North Slope Unit is located north and east of the Columbia River and is made up of the Saddle Mountain Unit and the Wahluke Unit. Both units contain irrigation return ponds and ditches that support migratory waterfowl. Some of these ponds have been decommissioned and are simply dry basins at this time. No nuclear production took place nor were any waste management facilities constructed on the North Slope Unit.
2.7
During the Camp Hanford Era (1959 to 1961), the North Slope Unit supported a Hanford firing range, seven anti-aircraft artillery batteries, one military munitions storage site, and six Nike missile sites. One of the missile sites was modified to handle Hercules missiles that were capable of delivering nuclear warheads. The Hercules missiles could be outfitted with either a conventional warhead, or a nuclear warhead (Harvey 2002). It is unclear, however, if nuclear warheads were ever deployed on the Hanford Site. Richard Roos claimed to be quite certain that for a short period of time (several months) there was a nuclear warhead stored in one of the Army �storage igloos� (personal communication, see Appendix A). None of the other military sites on the North Slope Unit produced or used radioactive materials. The North Slope supports a diverse shrub-steppe ecosystem. However, because of its remote location across the Columbia River and the long commuting distance for Hanford Site ecological researchers, the North Slope Unit was not used for research, and there was no use of radioactive materials as tracers or for other research purposes. In 1996, a DOE record of decision (DOE 1996) documented an agreement between DOE, EPA, and Ecology. This record of decision stated that no further cleanup of the North Slope Unit (also known as operable unit 100-IU-3) was required. The previous expedited response actions were sufficient to reduce concentrations of all contaminants of concern to levels below WAC 173-340 (MTCA) residential standards (DOE 1996). These levels are considered adequate to protect human health and the environment by both EPA and Ecology.
3.1
3.0 Contaminant Transport Pathways Conceptual Model The purpose of the conceptual model for contaminant transport is to identify any potential pathways through which radioactive contaminants may have been transported to the HRNM units evaluated and provide a basis for the future design of an environmental sampling program. Listed below are mechanisms that influence the fate and transport of radionuclides through the environment and influence the amount of exposure a person might receive at various receptor locations. For this report, only radioactive contamination is considered. Once a contaminant (i.e., radionuclide) is released into the environment it may be: • Transported (e.g., migrate downstream in solution or on suspended sediment, travel through the
atmosphere, or be carried offsite in contaminated wildlife) • Transformed physically or chemically (e.g., deposition, precipitation, volatilization, photolysis,
oxidation, reduction, hydrolysis, or radionuclide decay) • Transformed biologically (e.g., incorporation of radionuclide into a biochemical) • Accumulated in the receiving media (e.g., sorbed strongly in the soil column, stored in organism
tissues) The conceptual model, Figure 3.1, provides a representation of the potential pathways through which radionuclides from operating facilities at Hanford may have been transported to HRNM units being evaluated. Components of the conceptual model, which are discussed in more detail, are: • Contaminant sources (radiological wastes and effluents) and Buildings and Research Activities • Air transport pathway • Liquid transport pathway • Solid waste storage and disposal • Biotic transport pathway
The significance of each pathway was determined from measurements and calculations that estimate the amount of radioactive material transported along each pathway and by comparing the concentrations or potential doses to standards or guides to protect the environmental and public health. The primary pathway for movement of radioactive materials from Hanford sources is the atmosphere. 3.1 Potential Contaminant Sources: Radiological Waste, Effluent, HRNM
Buildings, and Research Activities Hanford Site operations have produced liquid, solid, and gaseous waste and effluent over the years. Most waste resulting from site operations had the potential to contain radioactive materials. An annual

3.2
Figure 3.1. Contaminant Transport Pathways Conceptual Model radiological air emissions report (Rokkan et al. 2002) is prepared for the Hanford Site in accordance with the Code of Federal Regulations (CFR), Title 40, Part 61 (40 CFR 61), Subpart H and Washington Administrative Code (WAC) Chapter 246-247. The report (Rokkan et al. 2002) documents the annual radionuclide air emissions from DOE facilities on the Hanford Site and the resulting effective dose equivalent to a hypothetical maximally exposed individual (MEI) of the public. An environmental release report (Diediker 1999) is also produced annually for the Hanford Site pursuant to the reporting require-ments in DOE Orders 5400.1 and 5484.1. The report is included in the annual Hanford Site environ-mental report (i.e., Poston et al. 2001) and summarizes the environmental releases from Hanford Site DOE facilities. The Columbia Generating Station, Framatome ANP, and Allied Technology are all non-DOE facilities that could generate gaseous emissions, liquid effluent, and solid waste. Based on Columbia Generating Station effluent and environmental reports, it is unlikely that operations at the station have resulted in any significant contribution to the radionuclide concentrations observed on any of the HRNM

3.3
units being evaluated. The location of Framatome and Allied Technologies makes it unlikely that any effluents from these facilities would have reached HRNM. The nature of Hanford�s solid waste, liquid effluent, and gaseous emissions are discussed in more detail in the following sections. 3.1.1 Solid Waste Some high-level solid waste, such as large pieces of machinery and equipment, were placed onto railroad flatcars and stored in underground tunnels on the Hanford Site. Both intermediate- and low-level solid waste, consisting of tools, machinery, paper, or wood, was placed into covered trenches at storage and disposal sites known as �burial grounds.� Beginning in 1970, solid waste was segregated according to the makeup of the waste material. Solids contaminated with plutonium and other transuranic materials were packaged in special containers and stored in trenches covered with soil for possible later retrieval. Non-radioactive solid waste was usually burned in �burning grounds.� This practice was discontinued in the late 1960s in response to the Clean Air Act, and the materials were subsequently buried at sanitary landfill sites. Solid and liquid waste was transported between operating areas on the Hanford Site using railcars. As a result, some railcars were contaminated with low levels of radioactivity. The railcars that had transported contaminated material were cleaned periodically at the Riverland Classification Yard, located on the portion of the HRNM Unit known as Riverlands, immediately southwest of Vernita Bridge. As a result of these cleaning operations, radiological control zones for low-level surface contamination were established. These control zones were cleaned-up, surveyed, and released during the 1990s (DOE 1996). A more detailed account of the Riverland Classification Yard is provided in Section 4.3.6. 3.1.2 Liquid Waste High-level liquid waste at Hanford is stored in large underground tanks. Intermediate-level liquid waste streams were usually routed to underground structures of various types called �cribs.� Occasion-ally, trenches were filled with liquid waste and then covered with soil after the waste had soaked into the ground. Low-level liquid waste streams were usually routed to surface impoundments (ditches and ponds). These storage and disposal sites, with the exception of high-level waste tanks, and one state-approved land disposal site, are now designated inactive. However, documentation exists that shows several radiological contaminants present in past liquid waste discharges have migrated through the vadose zone (the area between the ground surface and the water table) beneath the disposal sites to the groundwater. The flow of groundwater on the Hanford Site is from the northwest to the southeast, away from ALE and McGee Ranch/Riverlands Units. Some of these contaminants are known to have traveled southeast through the groundwater to the Columbia River and are entering the river along the Hanford Reach shoreline. Hydrological conditions on the opposite side of the Columbia River preclude the flow of this contaminated groundwater under the river to HRNM east of the Columbia River. Almost all unrestricted discharges of radioactive liquid waste to the ground were discontinued in 1997. Currently, the only discharge of radioactive liquid waste to the ground at Hanford is at the 616-A crib (a state-permitted facility also known as the State-Approved Land Disposal Site), which receives radioactive liquid waste (tritium) from the Effluent Treatment Facility. These liquid discharges

3.4
to the ground from DOE facilities are approved by the state of Washington through individual discharge permits. National Pollutant Discharge Elimination System permits issued by EPA govern liquid discharges to the Columbia River (40 CFR 122). In addition to liquid effluent being discharged to liquid waste disposal sites, radionuclides also were discharged directly to the Columbia River during the operation of the original eight single-pass produc-tion reactors along the river (DeFord 2002; Heeb and Bates 1994). Single-pass reactors used Columbia River water to cool the fuel elements in the reactor core. The cooling water flowed past the fuel elements in the process tubes, was stored temporarily in retention basins, then was released to the river. Operation of the single-pass reactors continued until the last one was shut down in 1971 (UNI 1981). A ninth reactor, N Reactor, did not discharge directly to the Columbia River. However, contaminated effluent from N Reactor was discharged to trenches near the river, and radionuclides are known to have entered the groundwater beneath the trenches and subsequently traveled to, and entered, the river along the shoreline. All potential radioactively contaminated liquid effluent from the Columbia Generating Station is discharged into the Columbia River via an instream discharge point. Since this is a considerable distance downstream of HRNM, this effluent is unlikely to have a significant impact on the HRNM lands. 3.1.3 Airborne Emissions DOE operations at Hanford have released radionuclides to the atmosphere via stacks and vents. Although the atmospheric emissions from Hanford operations have drastically decreased since the late 1980s, current waste management and cleanup efforts continue to result in atmospheric releases. In addition, resuspended contaminated soil from the 100 and 200 Areas could easily be transported by wind to some HRNM units. Table 3.1 outlines a number of radionuclides released to the atmosphere from Hanford operations. These radionuclides could potentially have been deposited directly onto HRNM lands. Permits from EPA, Ecology, and the Washington State Department of Health (WDOH) govern the discharge of gaseous effluents from DOE facilities to the atmosphere at Hanford.
Table 3.1. Radioactive Air Emissions from Hanford Operations
Tritium Tc-99 Ce-144 U-235 C-14 Ru-106 Pm-147 U-236 Ar-41 Sb-113 Eu-154 U-238 Co-60 Sb-125 Eu-155 Pu-238 Zn-65 I-129 Pb-212 Pu-239/40 Kr-85 I-131 Rn-220 Pu-241 Sr-90 Cs-134 Rn-222 Am-241 Zr-95 Cs-137 U-234 Am-243

3.5
3.1.4 HRNM Buildings and Research Activities There are a number of buildings on the ALE Unit. The buildings were used for military operations, scientific research, emergency preparedness, and other activities. A detailed document review of the history of each building is beyond the scope of this assessment. Personal interviews with staff (see Appendix A) indicate that transport of radioactive materials onto HRNM units for research activities occurred. This included a flow study of Rattlesnake Springs and lysimeter studies discussed later in this report. It is possible that the radioactive material used in those studies was stored in buildings on the ALE Unit. Personal communication with Boyd Hathaway (see Appendix A) also indicated that a field laboratory (6652H) on the ALE Unit supported research that involved radioactive materials. In addition, there are indications that radiological material may have been used in other facilities (6652-G, 6652-I, 6652-J, and 6652-M). Appendix C outlines the current status and projected uses of the buildings currently on the ALE Unit. 3.2 Air Transport Pathway The primary pathway for movement of radioactive materials from Hanford sources to HRNM is the atmosphere. Potential sources of contaminants entering the air pathway include: • active atmospheric releases include those DOE facilities that currently discharge radioactive materials
directly to the air, Energy Northwest, and Framatome • passive atmospheric releases include those facilities or operations that release radioactive material to
the atmosphere in a manner other than a direct discharge (e.g., tank ventilation systems, waste disposal site vents, volatilization during waste clean-up activities)
• unplanned releases include radioactive materials released to the air as a result of an unusual event
(e.g., an accident within a facility, fire burning contaminated vegetation) • wind-blown atmospheric releases include resuspension of radionuclides that are entrained in surface
soil at a concentration higher than background levels (e.g., surface of waste sites, or other contami-nated areas)
As shown in Figure 3.2, the wind roses at each of the major operating areas (100, 200, 300, and 400) at Hanford indicate that the wind direction is highly variable, with a significant component at each location that blows toward various portions of HRNM. Similar patterns are evident from each of the individual operating areas based on wind roses generated from the Hanford Meteorological Monitoring Network 10-meter towers (Hoitink et al. 2002). As such, radionuclides emitted from facilities in these areas have the potential to have been deposited on HRNM at various locations. This is clearly demon-strated in the results of the Hanford Environmental Dose Reconstruction Project (Farris et al. 1994; Thiede et al. 1994; Hanf and Thiede 1994; Heeb 1994). In addition, surface contamination that may have been, or is, present in the 100, 200, 300, and/or 400 Areas could have been resuspended by high winds and transported to HRNM sites as well.

3.6
Figure 3.2. Hanford Meteorological Monitoring Network Wind Roses at 60-Meter Level, 1986 through 2001 (from Hoitink et al. 2002)

3.7
3.3 Liquid Transport Pathway While there never has been direct discharge of liquid waste onto any of the HRNM units evaluated in this review as a result of operations at Hanford, contaminated liquid effluent was discharged directly to the Columbia River during the years of reactor operations. As a result of this practice, radionuclides have been deposited on the shoreline of HRNM (Sula 1980; Cooper and Woodruff 1993; Cooper 1995). These radionuclides may be remobilized during high river flows and redeposited downstream, either along the shoreline as the river flows drop or submerged in areas of sediment deposition within the river itself. In addition, the radionuclides deposited along the shoreline may be resuspended and transported inland by high winds as discussed in Section 3.2. 3.4 Solid Waste Storage and Disposal The storage and disposal of solid waste do not constitute a direct pathway from the storage or disposal site to HRNM. However, solid waste disposal sites may have been accessed and contaminants mobilized into the air, water, or biotic transport pathways. Of specific note is the waste in some 200 Area disposal sites that has been remobilized by biota and brought to the surface where it may be redeposited by the biota directly on HRNM land or resuspended by high winds and transported onto HRNM land. These transport mechanisms are discussed in more detail in their respective sections within this chapter. 3.5 Biotic Transport Pathway Several biological vectors could have transported radiological contaminants from Hanford facilities to HRNM. However, the transport of significant quantities of radionuclides onto HRNM land is unlikely. Various species of wildlife and plants have the potential to transport contaminants from one point to another. Insects (fruit flies), birds (waterfowl, perching birds, swallows, pigeons, raptors), rabbits, deer, elk, and coyotes have been implicated in the transport of contaminants at the Hanford Site in the past (Johnson et al. 1994; Caldwell and Rickard 1979; O�Farrell et al. 1973). Contaminants may be available for biotic uptake through a variety of sources. These include past effluent discharges, open sources of contaminants such as low-level liquid waste disposal ponds, biotic (plant and animal) intrusion into liquid and solid waste disposal sites, waste management facilities (e.g., liquid waste diversion boxes), and waste clean-up activities. Biotic transport and results of recent biological monitoring activities performed as part of the site-wide Surface Environmental Surveillance Project are discussed in Section 4.

4.1
4.0 Environmental Data Review and Discussion of Results The purposes of the environmental data review are to summarize current levels of radionuclide concentrations on and around several HRNM units and determine whether elevated concentrations of radionuclides exist. This section discusses the primary environmental monitoring programs that provided the environmental data that were reviewed for this report, and the process used to screen the data. This section also provides an evaluation of activities known to have taken place on, or in the vicinity of the HRNM units being evaluated. A brief summary of a review of historical aerial photographs also is provided. Historical documents and topical technical reports also were reviewed to identify useful information. These documents provided information on past environmental sampling efforts, effluents, emission monitoring, potential sources of contamination, and DOE actions. Reviewing these documents also helped assure that no potential contamination pathways were overlooked. The HRNM units evaluated at the ALE, McGee Ranch/Riverlands, and North Slope Units. 4.1 Environmental Monitoring Programs PNNL Surface Environmental Surveillance Project: The Surface Environmental Surveillance Project is a multi-media environmental monitoring effort conducted for DOE by PNNL to measure the concentrations of radionuclides and chemicals in environmental media and assess the potential effects of these materials on the environment and the public. Samples of air, surface water, sediment, soil, natural vegetation, agricultural products, fish, and wildlife are collected routinely on and off the Hanford Site. Although the Surface Environmental Surveillance Project is an extensive program, few sampling locations exist on the HRNM Units. However, sampling locations near HRNM were found to be useful in evaluating the potential for elevated radionuclide concentrations to exist on these units. The sampling locations and useful data are discussed in Section 4.1.1. Maps illustrating all current PNNL environmental sampling locations are provided in Appendix E. Washington State Department of Health (WDOH): WDOH conducts oversight monitoring at the Hanford Site to assure data reported are adequate and accurate. A portion of the samples collected by DOE contractors are split with WDOH. Contractor samples are analyzed by their contract analytical laboratories, while WDOH samples are analyzed by the state�s public health laboratory. WDOH reviews the analytical results for any discrepancies and trends and for indications of elevated radionuclide concentrations. Based on these comparisons, WDOH makes a determination about the quality of all environmental monitoring data each year. Comparisons of the state data to data collected by DOE contractors usually show slight disparities that relate to differences in laboratory procedures and in the types of dosimeters used to measure ambient gamma radiation. Energy Northwest: Routine monitoring on and around Energy Northwest is conducted to evaluate environmental effects of the Columbia Generating Station on the surrounding environment. Energy Northwest issues two annual reports that summarize its data and evaluate any effects its operations have
4.2
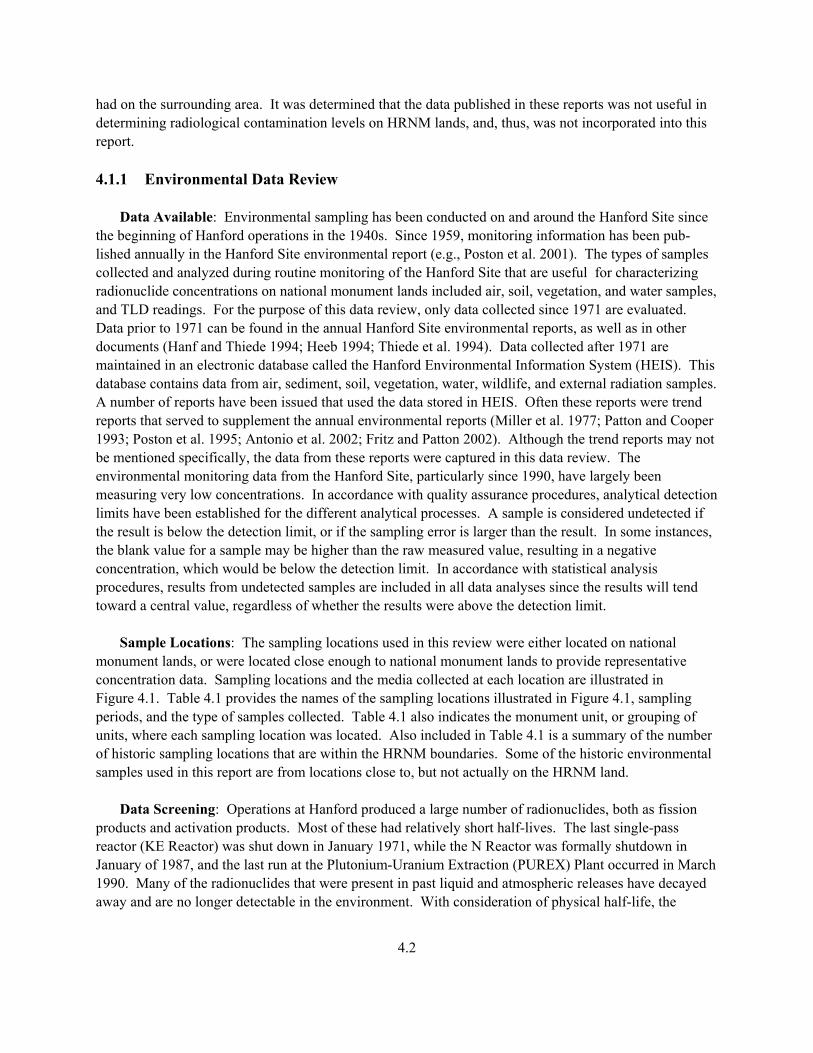
had on the surrounding area. It was determined that the data published in these reports was not useful in determining radiological contamination levels on HRNM lands, and, thus, was not incorporated into this report. 4.1.1 Environmental Data Review Data Available: Environmental sampling has been conducted on and around the Hanford Site since the beginning of Hanford operations in the 1940s. Since 1959, monitoring information has been pub-lished annually in the Hanford Site environmental report (e.g., Poston et al. 2001). The types of samples collected and analyzed during routine monitoring of the Hanford Site that are useful for characterizing radionuclide concentrations on national monument lands included air, soil, vegetation, and water samples, and TLD readings. For the purpose of this data review, only data collected since 1971 are evaluated. Data prior to 1971 can be found in the annual Hanford Site environmental reports, as well as in other documents (Hanf and Thiede 1994; Heeb 1994; Thiede et al. 1994). Data collected after 1971 are maintained in an electronic database called the Hanford Environmental Information System (HEIS). This database contains data from air, sediment, soil, vegetation, water, wildlife, and external radiation samples. A number of reports have been issued that used the data stored in HEIS. Often these reports were trend reports that served to supplement the annual environmental reports (Miller et al. 1977; Patton and Cooper 1993; Poston et al. 1995; Antonio et al. 2002; Fritz and Patton 2002). Although the trend reports may not be mentioned specifically, the data from these reports were captured in this data review. The environmental monitoring data from the Hanford Site, particularly since 1990, have largely been measuring very low concentrations. In accordance with quality assurance procedures, analytical detection limits have been established for the different analytical processes. A sample is considered undetected if the result is below the detection limit, or if the sampling error is larger than the result. In some instances, the blank value for a sample may be higher than the raw measured value, resulting in a negative concentration, which would be below the detection limit. In accordance with statistical analysis procedures, results from undetected samples are included in all data analyses since the results will tend toward a central value, regardless of whether the results were above the detection limit. Sample Locations: The sampling locations used in this review were either located on national monument lands, or were located close enough to national monument lands to provide representative concentration data. Sampling locations and the media collected at each location are illustrated in Figure 4.1. Table 4.1 provides the names of the sampling locations illustrated in Figure 4.1, sampling periods, and the type of samples collected. Table 4.1 also indicates the monument unit, or grouping of units, where each sampling location was located. Also included in Table 4.1 is a summary of the number of historic sampling locations that are within the HRNM boundaries. Some of the historic environmental samples used in this report are from locations close to, but not actually on the HRNM land. Data Screening: Operations at Hanford produced a large number of radionuclides, both as fission products and activation products. Most of these had relatively short half-lives. The last single-pass reactor (KE Reactor) was shut down in January 1971, while the N Reactor was formally shutdown in January of 1987, and the last run at the Plutonium-Uranium Extraction (PUREX) Plant occurred in March 1990. Many of the radionuclides that were present in past liquid and atmospheric releases have decayed away and are no longer detectable in the environment. With consideration of physical half-life, the
4.3
Figure 4.1. Environmental Sampling Locations on and Around the Fitzner/Eberhardt Arid Lands Ecology (ALE) Reserve, McGee/Riverlands, and North Slope Units of the Hanford Reach National Monument

4.4
Table 4.1. Routine Environmental Sampling Location Names and Sampling Periods for Locations on and Near the HRNM
Map #(a) Location Name HRNM Unit Sampling Period
Map #(a) Location Name HRNM Unit
Sampling Period
Soil TLD 1 Prosser Barricade ALE 1974-present 1 Prosser Barricade ALE 1973-present 2 ALE Field Lab ALE 1971-present 2 ALE Field Lab ALE 1971-1990 3 Rattlesnake Springs ALE 1971-present 3 Rattlesnake Spr. ALE 1971-present 4 Yakima Barricade ALE 1971-present 4 Yakima Barricade ALE 1971-present 6 N end Vernita Bridge North Slope 1971-present 5 S end Vernita Bridge McGee 1971-present 7 Wahluke Slope North Slope 1971-present 6 N end Vernita Bridge North Slope 1971-1977 8 Berg Ranch North Slope 1971-present 7 Wahluke Slope North Slope 1971-present 9 Wahluke Opp. 100N North Slope 1971-1974 8 Berg Ranch North Slope 1971-1990
11 Ringold Area North Slope 1971-present 10 Sagehill Met Tower North Slope 1983-1991 13 Sunnyside Distant 1977-present 11 Ringold Area North Slope 1971-1974 16 Walla Walla Distant 1985-present 12 Ringold Met Tower North Slope 1983-present
Vegetation 17 Wahluke CP 17 North Slope 1971-1977 1 Prosser Barricade ALE 1974-1989 18 Wahluke CP 18 North Slope 1971-1977 2 ALE Field Lab (ERC) ALE 1971-1989 19 Wahluke CP 19 North Slope 1971-1977 3 Rattlesnake Springs ALE 1971-1990 20 Wahluke CP 20 North Slope 1971-1977 4 Yakima Barricade ALE 1971-1993 21 Wahluke CP 21 North Slope 1971-1977 6 N end Vernita Bridge North Slope 1971-1989 22 Wahluke CP 22 North Slope 1971-1977 7 Wahluke Slope North Slope 1971-1990 23 Wahluke CP 23 North Slope 1971-1977 8 Berg Ranch North Slope 1971-1990 24 Wahluke CP 24 North Slope 1971-1977 9 Wahluke Opp.100N North Slope 1971-1974 25 Wahluke CP 46 North Slope 1971-1977
11 Ringold Area North Slope 1971-present 15 Yakima Distant 1986-present 13 Sunnyside Distant 1977-present 13 Sunnyside Distant 1971-1995 16 Walla Walla Distant 1986-1990 14 Toppenish Distant 1995-present
Air 1 Prosser Barricade ALE 1980-present 5 S end Vernita Bridge McGee 1980-present 3 Rattlesnake Springs ALE 1980-present 7 Wahluke Slope North Slope 1980-present 4 Yakima Barricade ALE 1980-present 8 Berg Ranch North Slope 1980-1992
13 Sunnyside Distant 1980-1996 10 Sagehill Met Tower North Slope 1983-1991 15 Yakima Distant 1985-present 12 Ringold Met Tower North Slope 1982-present
Historic Sampling Locations Within HRMN Boundaries HRNM Unit Air Vegetation/Soil TLD
ALE 1 2 2 McGee/Riverlands 1 0 1 North Slope 3 3 13 (a) See Figure 4.1. ALE = Arid Lands Ecology Reserve. HRNM = Hanford Reach National Monument. TLD = Thermoluminescent dosimeter. Met = Meteorology.

4.5
number of radionuclides that need to be addressed can be reduced. The emission of radionuclides to the environment has significantly decreased since the last separations run in 1990. There is no point in assessing data for radionuclides with half-lives less than 2 years, as there will not be detectable amounts present in the environment. A sample of a radionuclide with a half-life of 2 years has decreased in concentration by 80% after 5 years, and by 95% in less than 9 years. Europium-152 (half-life of 13 years) is a radionuclide that was formed as an activation product in the cooling tubes of the single-pass reactors, and released into the Columbia River in the cooling water discharge. For all intents and purposes, europium-152 ceased to be produced in significant quantities with the closure of the last single pass reactor in 1971. In the 31 years between 2002 and 1971, the concentrations of europium-152 should have decreased approximately 80% by radioactive decay, making it unlikely that there are measurable amounts of it in the Hanford environs. Several radionuclides with relatively long half-lives are predominantly associated with contaminated groundwater beneath the Hanford Site. Hanford Site groundwater contam-ination that originates in the 100, 200, or 300 Areas does not migrate beneath the HRNM units evaluated in this assessment because of hydrogeological constants. Small amounts of iodine-129 was released as gaseous effluents from past fuel processing activities, and continue to be released from the 200 East Area (Poston et al. 2002). However, assessments conducted to date at Hanford indicate these contaminants to be present at the femtocuries per gram level and pose no appreciable risk to natural resources or man (Brauer 1974; Soldat 1976; Price et al. 1981; Poston et al. 2001). This historical site assessment focuses only on longer-lived radionuclides that could still potentially be measurable on the HRNM units of interest. Table 4.2 lists the radionuclides produced by Hanford operations that were included in this evaluation. With the end of atmospheric nuclear weapons testing
Table 4.2. Radionuclides Evaluated in this Review and their Respective Half-Lives
Radionuclide Half-Life (years)
Tritium 12.4 Carbon-14 5730 Cobalt-60 5.3 Cesium-137 30 Strontium-90 29 Technetium-99 2.1 x10⁵ Europium-152 13 Europium-154 8.8 Europium-155 5 Uranium-234 2.4 x 10⁵ Uranium-235 7.0 x 10⁵ Uranium-238 4.5 x 10⁹ Plutonium-238 88 Plutonium-239/40 2.4 x 10⁴ Americium-241 430

4.6
and the cessation of weapons material production at Hanford, environmental levels of radionuclides should no longer be increasing. Therefore, it was decided to separate the environmental data into two time periods: 1971 through 1989 and 1990 to 2002. Median values were used to evaluate these data because there were generally not enough data points to calculate a meaningful average. The results of the environmental data review are discussed by unit in Sections 4.2, 4.3, and 4.4. Reference values are outlined in Section 4.5. These data are intended to provide a means to compare the relative magnitudes of the data in Sections 4.2 to 4.4. The reference data in Section 4.5 are not necessarily background, but represents locations where concentration data were likely not significantly impacted by Hanford effluents. Atmospheric radionuclide concentration data prior to 1980 were not considered beneficial to this report, and, therefore, were not included. While air concentration data prior to 1980 could be beneficial in estimating atmospheric deposition to soil, that sort of analysis is beyond the scope of this work. Since historic air concentration data have no direct impact on the air concentrations of the future, the only benefit gained from historic air concentration data is evaluating trends in the data. Twenty years worth of data was considered enough to evaluate trends in air concentration data on HRNM, so data prior to 1980 was not included in this evaluation. It has been theorized that there could be some uranium present in soil on some HRNM units that came from agricultural practices prior to the establishment of the Hanford Site, or from irrigation run off on the North Slope Unit. This theory is speculative, and there is insufficient data to make any conclusions. However, there is substantial evidence of uranium being present in commercial fertilizer, so the theory seems plausible. However, there is no way to distinguish between naturally occurring uranium, uranium deposited from fertilizer, or Hanford origin uranium in the data being analyzed for this report. There was some concern that radionuclides deposited on the surface could migrate down through the soil column, skewing surface soil measurements. Studies of strontium-90, cesium-137 and plutonium-239/240 in soil by Price (1991), Cline and Cadwell (1984), and Cline and Rickard (1972) are the only known studies on the vertical distribution of radionuclides in soil at Hanford. Over 95% of the plutonium-239/240 and cesium-137 were observed to reside in the top 5 centimeters of soil. For strontium-90, the concentration profile extended to nearly 20 centimeters, and the maximum occurred between 2.5 and 5 centimeters (Price 1991). 4.1.2 External Radiation Surveys External radiation surveys have periodically been performed at the Hanford Site. These surveys have been either large scale site-wide efforts with monitoring equipment installed in airplanes, or small land-based efforts carried out by personnel on foot. The last aerial survey for radiological contamination on Hanford Site lands occurred in the summer of 1996. However, the results (maps and external radiation isopleths) have never been published. Previous Site aerial surveys were conducted in 1973-1974 (Tipton 1975; Feimster and Hilton 1982), and in July and August of 1988 (Reiman and Dahlstrom 1990). Aerial surveys used gamma spectrometry to evaluate external radiation fields and determine if cobalt-60, and to a lesser extent, cesium-137 were present. The 1978 aerial survey was limited to Hanford Site operating areas, and the Columbia River corridor. Some small anomalies were observed across the river from 100 N and 100 F Areas, as well as some of the islands off the Columbia River. The 1988 survey showed

4.7
no manmade radiation above background on the ALE, McGee/Riverlands or North Slope Units of the HRNM. Results of the land-based surveys are discussed individually in this report in the sections pertaining to where the survey was conducted (Sections 4.2, 4.3 and 4.4). 4.1.3 Dose Assessments No known radiological dose assessments have been conducted for people using the ALE, McGee/ Riverlands or North Slope Units. However, the Hanford environmental monitoring program conducts annual dose assessments for an MEI, who is assumed to be a member of the public living near the site. Historically, this individual has been modeled as living downwind of the Hanford Site, on the Franklin County shore, and using water from the Columbia River downstream of Hanford effluents. Many of the assumptions used to estimate the MEI dose are not relevant to national monument lands, so the MEI doses calculated for a member of the public may not be relevant to an individual on the national monu-ment. However, since 1991, the annual estimated MEI dose to a member of the public have been at or below 0.051 mrem (Table 4.3). Since the scenario for estimating the offsite MEI involves a resident and considers a water pathway, it is unlikely that a non-resident on the ALE, McGee Ranch/Riverlands or the North Slope Units of HRNM would receive a dose higher than that estimated for the offsite MEI. 4.1.4 Evaluation of Historical Photographs A review of historical photographs dating back to the early 1940s revealed no pertinent information about potential radiological contamination on the HRNM. These photographs were retrieved from the Hanford Declassified Document Retrieval system web page (http://www2.hanford.gov/DDRS/). The photographs reviewed were aerial photos of the entire Hanford Site in May of 1943, and the Columbia River corridor in the spring of 1948. The scale of the photographs available was such that determining if radiological materials were used was impossible. However, there were no indications of undocumented activities such as unexpected land disturbances or unreported facilities.
Table 4.3. Estimated Maximally Exposed Individual (MEI) Doses to a Member of the Public From Hanford Emissions (1991 through 2000)
Year MEI Dose (mrem)1991 0.02 1992 0.02 1993 0.03 1994 0.051 1995 0.023 1996 0.007 1997 0.011 1998 0.022 1999 0.008 2000 0.014

4.8
4.1.5 Biological Monitoring Routine samples of deer, elk, pheasant, quail, and Columbia River fish are collected on and around the Hanford Site. Animals are generally free to move on and off the site, and have the potential to transport radioactive materials onto national monument units. However, there is very little evidence of wildlife containing detectable levels of radionuclides. Animals with a sufficiently large home range to transport radioactive material from the central Hanford area to HRNM units include coyotes, deer, elk, and raptors. Deer and elk could introduce contamination by initially accumulating contaminants in waste manage-ment areas and transporting them to HRNM. There are three mechanisms by which they could deposit contamination into HRNM. Deer and elk could die, shed antlers or hair, and/or deposit contamination in feces or urine (Tiller and Poston 2000). Distinct deer herds on the Hanford Site have been observed around the 100, 200, and 300 Areas. Deer from each of these herds could potentially move onto HRNM units. Elk have been observed (anecdotal accounts) to cross the Columbia River; however, most move-ments onto and off the Hanford Site involve ALE and McGee/Riverland Units. Measurements of contamination in deer since 1971 indicate that concentrations of cesium-137 and strontium-90 have been declining to levels below the analytical detection limit (Eberhardt et al. 1989; Poston and Cooper 1994; Poston et al. 2001). In recent years, strontium-90 has been the only man-made radionuclide detected in deer and elk samples (Poston et al. 2001). In the past, concentrations of strontium-90 in deer bone ranged as high as 65 pCi/g (Eberhardt et al. 1982), but have since dropped to about 10 pCi/g bone (Poston et al. 2001). Contaminated coyote feces has been observed about 5 kilometers east of the 100-B/C crib area (O�Farrell et al. 1973). Home range estimates of coyotes in Washington State range from 54 to 142 square kilometers (USDA Forest Service 2002). With these estimates for home ranges, it is possible for coyotes residing on the Hanford Site to reach any of the HRNM land. During 1995 to 1996, moni-toring and surveillance staff conducted a visual survey for coyote trails and feces to determine if coyotes inhabiting the 200 Areas traveled to the orchards and vineyards located in the Cold Creek Valley along Highway 24, within the McGee/Riverlands Unit. Observations of coyote scat found along the 200 West Area fence line contained fruit (cherries/apples) indicated that the animals could have traveled to the Cold Creek orchards. Raptors (eagles, falcons, hawks, owls) are predatory birds that potentially could become a transport vector for contaminants at Hanford. Some of these birds hunt over large areas that included radiological waste sites where prey may pick up contamination. Studies by Cadwell and Fitzner (1984) evaluated raptor castings (regurgitated material containing indigestible remains of prey) as monitors of possible entry of burrowing mammals into buried waste sites. Castings of raptors collected at Hanford near waste sites contained higher levels of cesium-137 than castings from birds collected at distant areas. Castings are usually deposited where the birds roost and nest. Fecal material may also contain contaminates that could be deposited near roosts and nests. Concentrations of cesium-137 in raptor pellets collected around the Hanford Site have ranged from below detection to 9 pCi/g, but concentrations were generally less than 1 pCi/g (Fitzner et al. 1981).

4.9
Home ranges for raptors reviewed by Cadwell and Fitzner (1984) ranged from 0.8 to 5.8 square kilo-meters depending on species. A circular home range of 5.8 square kilometers would have a radius of 1.4 kilometer. Assuming a suitable nesting site existed on the HRNM within 1.4 kilometer of a waste site, it is possible for raptors to feed on animals residing on the waste site and transport those materials to monument lands. 4.1.6 Interviews In an effort to be sure that all potential sources of radiological contamination to HRNM were con-sidered, interviews were conducted. Individuals with knowledge of historical site activities were ident-ified, and to the extent possible, interviewed. Often these interviews revealed some monitoring work that had been conducted, and published results of the work were located. In some instances, the interviews revealed work, stories and second hand knowledge that could not be supported by any published material. In these instances, the information is referenced as being obtained through personal interviews. A detailed interview log is included in Appendix A. 4.2 Evaluation of Data from the Arid Lands Ecology Reserve Unit Environmental data from on and around the ALE Unit were evaluated to gain information that may be useful in determining whether there may be elevated levels of radiological contamination on the ALE Unit of the HRNM. The following sections describe soil, vegetation, air, radiation and water monitoring. 4.2.1 Soil Monitoring Results from historical soil monitoring on and near the ALE Unit are summarized in Table 4.4 (data obtained from HEIS). On the ALE Reserve, cobalt-60, europium-154, and europium-155 (all with half-lives less than 10 years) were virtually undetectable between 1990 and 2002. This indicates that those isotopes have decayed away and are no longer measurable in soil on the ALE Unit. Strontium-90 and cesium-137 (half-lives ~30 years) concentrations in soil also appear to be decreasing, but concentrations are still measurable. Concentrations of radionuclides with long half-lives, such as uranium and plutonium isotopes, also appeared to decrease over time, which would not be expected based solely on radioactive decay. These apparent decreases could be a result of improved measurement techniques in later years, dilution caused by movement or deposition of wind blown soil, or may simply be a reflection of the variability of environmental data. WDOH occasionally collected soil samples on and around the ALE Unit. Their results were similar to the median results reported in Table 4.4 (WDOH 1999; WDOH 1990; WDOH 1989). In 1979, a special study was conducted on the ALE Unit to investigate the possible deposition of plutonium from 200 Areas emissions (Price and Dirkes 1981). Ten composite soil samples (each consist-ing of five plugs 2.54 centimeters in diameter by 122 centimeters deep) were collected at 1-kilometer intervals along the 1200 Foot Road (Figure 4.2), beginning at a site close to the intersection of Highways 24 and 240, and extending south and east to the point where the 1200 Foot Road joins with Highway 240, near Route 221. Concentrations of plutonium-239/240 ranged from 0.004 to 0.018 pCi/g (Table 4.5). The results suggested that some plutonium from the 200 Areas may have been deposited on the south

4.10
Table 4.4. Results from Historical Soil Samples Collected on the Fitzner/Eberhardt Arid Lands Ecology (ALE) Reserve Unit
ALE Unit Soil Sample Data (pCi/g dry wt) Period Data CO-60 SR-90 CS-137 EU-152 EU-154 EU-155 U(a)
Median 0.003 0.13 0.54 0.15 0.003 0.025 0.29 Maximum 0.12 1.6 1.6 0.19 0.25 0.089 0.80 Number of samples 68 67 68 4 31 29 48
1971-1989
Number detected(b) 19 65 67 4 2 4 47
Median -0.005 0.095 0.27 -- -0.017 0.012 -- Maximum 0.0026 0.14 0.42 -- 0.034 0.04 -- Number of samples 9 9 9 -- 9 9 --
1990-2001
Number detected(b) 0 8 9 -- 0 0 --
Period Data U-234 U-235 U-238 PU(a) PU-238 PU-239/240 AM-241
Median -- 0.027 0.68 0.006 0.001 0.011 0.017 Maximum -- 0.28 1.5 0.018 0.011 0.039 0.041 Number of samples -- 11 11 12 68 68 7
1971-1989
Number detected(b) -- 2 11 12 40 67 2
Median 0.11 0.01 0.51 -- 0.00027 0.007 -- Maximum 0.75 0.19 1.0 -- 0.00051 0.014 -- Number of samples 5 9 9 -- 9 9 --
1990-2001
Number detected(b) 5 3 9 -- 7 9 -- (a) Indicates total uranium or total plutonium. (b) Detected samples have concentrations greater than minimum detectable concentration, and concentrations
greater than the 2 sigma counting error.
portion of the ALE Unit. There is a statistically significant difference (two-sample means t-test, 95% con-fidence) between locations 1-5 and 6-10. This study showed a median soil concentration of 0.015 pCi/g of plutonium-239/240 for the locations south of the 200 East Area (6-10) and 0.005 pCi/g for the locations further northwest along the 1200 Foot Road (1-5). The median plutonium-239/240 concen-tration for all sample locations (0.010 pCi/g) is similar to the median concentration of the historical monitoring data on the ALE Unit for the 1971-1989 time period. 4.2.2 Vegetation Monitoring Results from historical vegetation monitoring on and near the ALE Unit are summarized in Table 4.6 (data obtained from HEIS). In vegetation samples collected on the ALE Reserve, cobalt-60, europium-154, europium-155, and americium-241 were rarely reported above their detection limits prior to 1989. Between 1990 and 2002, only one known routine vegetation sample was collected on or near the ALE Unit.
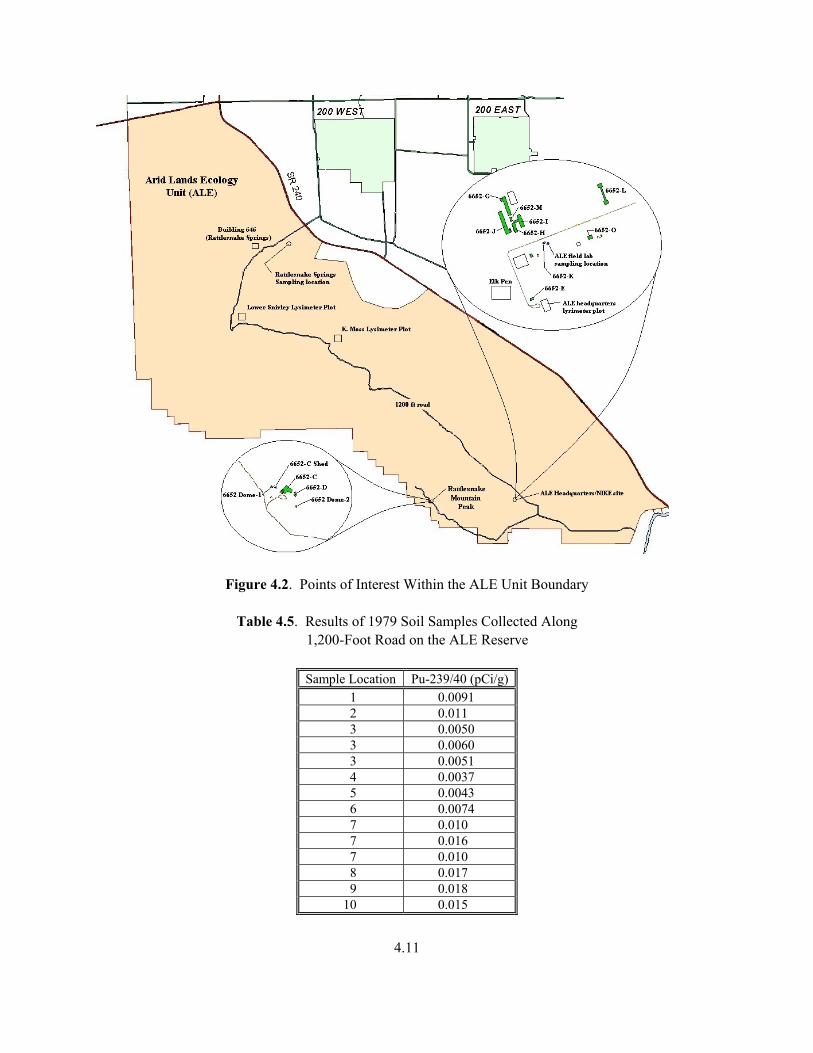
4.11
Figure 4.2. Points of Interest Within the ALE Unit Boundary
Table 4.5. Results of 1979 Soil Samples Collected Along 1,200-Foot Road on the ALE Reserve
Sample Location Pu-239/40 (pCi/g)1 0.0091 2 0.011 3 0.0050 3 0.0060 3 0.0051 4 0.0037 5 0.0043 6 0.0074 7 0.010 7 0.016 7 0.010 8 0.017 9 0.018
10 0.015
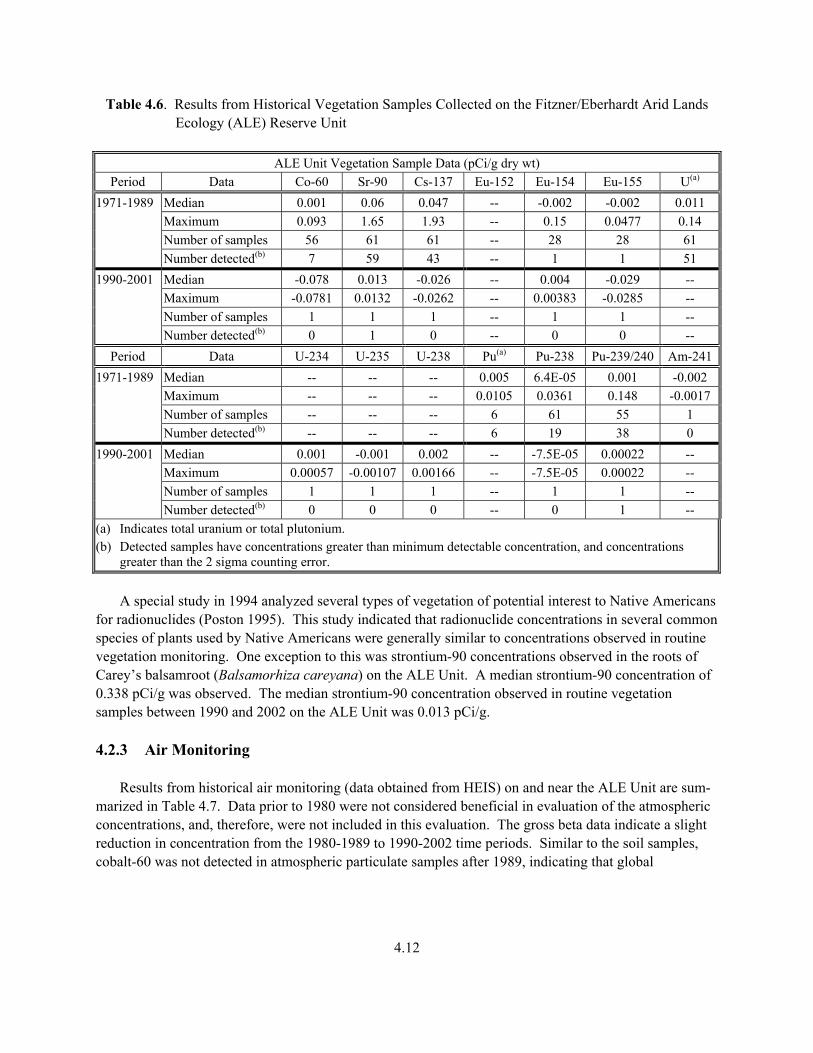
4.12
Table 4.6. Results from Historical Vegetation Samples Collected on the Fitzner/Eberhardt Arid Lands Ecology (ALE) Reserve Unit
ALE Unit Vegetation Sample Data (pCi/g dry wt) Period Data Co-60 Sr-90 Cs-137 Eu-152 Eu-154 Eu-155 U(a)
Median 0.001 0.06 0.047 -- -0.002 -0.002 0.011 Maximum 0.093 1.65 1.93 -- 0.15 0.0477 0.14 Number of samples 56 61 61 -- 28 28 61
1971-1989
Number detected(b) 7 59 43 -- 1 1 51 Median -0.078 0.013 -0.026 -- 0.004 -0.029 -- Maximum -0.0781 0.0132 -0.0262 -- 0.00383 -0.0285 -- Number of samples 1 1 1 -- 1 1 --
1990-2001
Number detected(b) 0 1 0 -- 0 0 -- Period Data U-234 U-235 U-238 Pu(a) Pu-238 Pu-239/240 Am-241
Median -- -- -- 0.005 6.4E-05 0.001 -0.002 Maximum -- -- -- 0.0105 0.0361 0.148 -0.0017 Number of samples -- -- -- 6 61 55 1
1971-1989
Number detected(b) -- -- -- 6 19 38 0 Median 0.001 -0.001 0.002 -- -7.5E-05 0.00022 -- Maximum 0.00057 -0.00107 0.00166 -- -7.5E-05 0.00022 -- Number of samples 1 1 1 -- 1 1 --
1990-2001
Number detected(b) 0 0 0 -- 0 1 -- (a) Indicates total uranium or total plutonium. (b) Detected samples have concentrations greater than minimum detectable concentration, and concentrations
greater than the 2 sigma counting error. A special study in 1994 analyzed several types of vegetation of potential interest to Native Americans for radionuclides (Poston 1995). This study indicated that radionuclide concentrations in several common species of plants used by Native Americans were generally similar to concentrations observed in routine vegetation monitoring. One exception to this was strontium-90 concentrations observed in the roots of Carey�s balsamroot (Balsamorhiza careyana) on the ALE Unit. A median strontium-90 concentration of 0.338 pCi/g was observed. The median strontium-90 concentration observed in routine vegetation samples between 1990 and 2002 on the ALE Unit was 0.013 pCi/g. 4.2.3 Air Monitoring Results from historical air monitoring (data obtained from HEIS) on and near the ALE Unit are sum-marized in Table 4.7. Data prior to 1980 were not considered beneficial in evaluation of the atmospheric concentrations, and, therefore, were not included in this evaluation. The gross beta data indicate a slight reduction in concentration from the 1980-1989 to 1990-2002 time periods. Similar to the soil samples, cobalt-60 was not detected in atmospheric particulate samples after 1989, indicating that global

4.13
Table 4.7. Results from Historical Air Samples Collected on the Fitzner/Eberhardt Arid Lands Ecology (ALE) Reserve Unit
ALE Unit Air Sample Data (pCi/m3) Period Data Alpha Beta Tritium C-14 Co-60 Sr-90 Cs-137 Eu-154
Median 0.001 0.024 3.8 1.35 2.7E-04 7.5E-05 1.8E-04 -- Maximum 0.0042 0.48 1200 1.59 6.6E-03 1.5E-03 9.8E-02 -- Number of samples 424 758 357 19 84 28 84 --
1980-1989
Number detected(b) 373 752 114 18 14 14 16 --
Median 0.001 0.014 0.95 -- 3.4E-05 8.5E-06 2.0E-05 2.5E-04 Maximum 0.028 0.15 330 -- 1.5E-03 2.2E-03 7.3E-04 3.9E-03 Number of samples 542 595 171 -- 94 42 94 89
1990-2001
Number detected(b) 416 595 57 -- 5 12 4 4
Period Data Eu-155 U(a) U-234 U-235 U-238 Pu-238 Pu-239/240 Median -- 7.0E-05 -- -- -- 0 5.9E-07 Maximum -- 2.7E-04 -- -- -- 2.8E-05 4.6E-05 Number of samples -- 13 -- -- -- 29 28
1980-1989
Number detected(b) -- 11 -- -- -- 0 3 Median 4.5E-05 -- 1.6E-05 4.7E-07 1.6E-05 -1.4E-07 4.1E-07 Maximum 1.5E-03 -- 2.8E-05 2.7E-06 3.4E-05 3.1E-06 5.2E-06 Number of samples 89 -- 20 20 20 42 42
1990-2001
Number detected(b) 0 -- 20 3 20 1 12
(a) Indicates total uranium. (b) Detected samples have concentrations greater than minimum detectable concentration, and concentrations
greater than the 2 sigma counting error. concentrations have decreased below levels measurable by the current Hanford Site sampling network. The median concentrations of all of measurable radionuclides in air decreased between the 1980-1989 and the 1990-2002 time periods. WDOH regularly collects and analyzes air samples at the Yakima Barricade (WDOH 1999; WDOH 1990; WDOH 1989). The reported results were only for gross beta and cesium-137. The data were similar to the historical air monitoring median concentrations reported by DOE, although the WDOH results for cesium-137 were rarely above the detection limit. 4.2.4 Direct Radiation Monitoring Results from historical external radiation monitoring on and near the ALE Unit are summarized in Table 4.8 (data obtained from HEIS). The data in Table 4.8 indicate that the external radiation levels on the ALE reserve were higher during the 1990-2002 period than the 1971-1989 period. This apparent increase may be due to the lower number of measurements made between 1990 and 2002 relative to the 1971-1989 time period. The smaller sampling network was focused more on locations likely to have an elevated dose rate. WDOH also regularly collected a TLD reading at the Yakima Barricade location (WDOH 1999; WDOH 1990; WDOH 1989). The median reported external radiation dose rate from that single monitoring location between 1989 and 1994 was 0.24 mR/day.

4.14
Table 4.8. External Radiation Dose Rates Measured by Thermoluminescent Dosimeters on the Fitzner/Eberhardt Arid Lands Ecology (ALE) Reserve Unit
ALE Unit External Radiation Data Period Data TLD (mR/d)
Average 0.21 Median 0.21 Maximum 0.46
1971-1989
Number of samples 907
Average 0.25 Median 0.25 Maximum 0.28
1990-2002
Number of samples 63
In 1997, a ground survey was conducted near Rattlesnake Springs (Figure 4.2), on the ALE reserve (McGuire 1997). The survey was in response to an anomaly observed by an unpublished 1996 aerial survey. The ground survey observed a maximum gamma count rate that was slightly above background, but not statistically relevant. The survey reported no evidence of manmade radiological impact. Also, a 1988 aerial survey (Reiman and Dahlstrom 1990) revealed no evidence of contamination from manmade radionuclides around Rattlesnake Springs. The average external dose rate observed across ALE during the 1988 aerial survey was 8 µR/hour (0.19 mR/day). 4.2.5 Water Monitoring The only known potential source for radiological contamination of surface water on the ALE Unit, other than atmospheric deposition, was a study conducted in 1973 involving radiotracers. The radio-isotopes carbon-14 and chromium-51 were used as tracers in feeding studies of mayfly, black fly, and caddis fly larvae at Rattlesnake Springs (Figure 4.2). The half-life of chromium-51 is 27.8 days, so it would have long ago decayed away below detectable levels. All the radioactive waste generated by this study was discarded as low-level radiological waste. Carbon-14 could still be present around Rattlesnake Springs. 4.2.6 ALE Buildings and Research Activities There are a number of buildings on the ALE Unit that were used for military operations, scientific research, and other activities. A detailed document review of the history of each building is beyond the scope of this assessment. Personal interviews with staff (see Appendix A) indicate that transport of radioactive materials onto the site for research activities occurred. This included the Rattlesnake Springs flow study and the lysimeter studies (Schreckhise and Cline 1980a, 1980b) discussed in Section 2.3.1. Although there are no posted radiological areas, laboratories that performed various experiments

4.15
involving radioactive materials operated in several buildings on the ALE Unit. The buildings with the potential for radiological contamination are 6652-G, 6652-H, 6652-I, 6652-J, and 6652-M. Personal communication with Boyd Hathaway (see Appendix A) also indicated that the ALE field laboratory (6652-H) supported radioactive research activities. Building 646 was also rumored to have had a Radioactive Materials sign posted on it (DOE 1994a). Figures 4.3 and 4.4 are aerial photographs of the ALE headquarters and Rattlesnake Mountain top buildings and structures. Appendix C outlines the current status and projected uses of the buildings currently on the ALE Unit, and a brief description of the buildings considered to have potential radiological contamination. In the 1970s, a research study involving radionuclides was conducted on the ALE Unit to evaluate the uptake of radionuclides by plants (Schreckhise and Cline 1980a, 1980b). This study was conducted at the ALE headquarters lysimeter plot (Figure 4.2). The radioactive material was controlled by lysimeters (PVC pipes, sealed on the bottom and filled with soil). The top layer of soil in the lysimeters was non- contaminated soil to prevent contaminated soil from spilling out of the lysimeter. A wire-mesh cover around the lysimeter plot kept out birds and other animals. Figure 4.3 shows the ALE headquarters area, with the lysimeter plot in the lower right, at the base of what appears to be a large arrow. This study used plutonium-238, plutonium-239, americium-241, curium-244, and neptunium-237, all of which have half-lives greater than 18 years. This study could have potentially resulted in the release of radionuclides to the environment through inadvertent spilling of contaminated soil, or other events. A 1996 closeout report for the ALE Unit stated that two separate sets of characterization samples were collected on the ALE headquarters lysimeter plot and analyzed for radiological contamination (Bechtel 1996). One sample was reported to have a plutonium-238 concentration of 53 pCi/g. A qualitative radiological risk analysis determined the associated exposure risk to be around 0.25 mrem/year. No other samples had concentrations exceeding 1.2 pCi/g. At the conclusion of the second study, a small amount of soil
Figure 4.3. ALE Headquarters Buildings, Lysimeter Plot, and Elk Pen in the 1970s
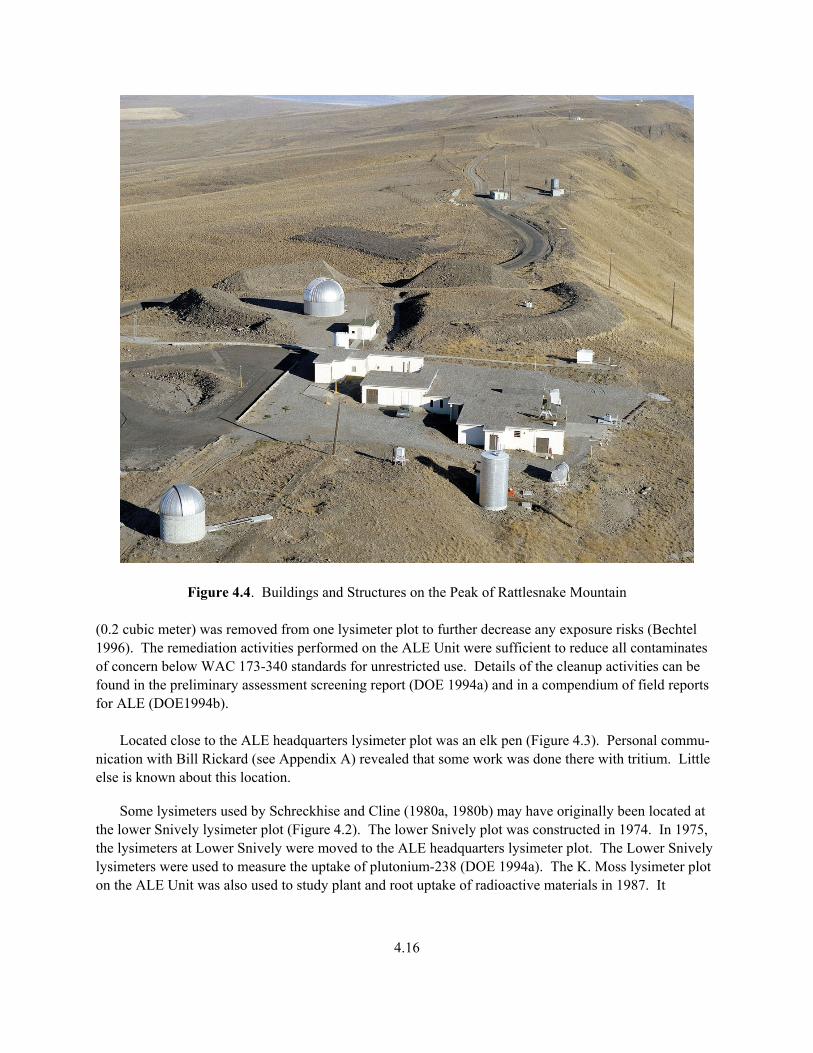
4.16
Figure 4.4. Buildings and Structures on the Peak of Rattlesnake Mountain (0.2 cubic meter) was removed from one lysimeter plot to further decrease any exposure risks (Bechtel 1996). The remediation activities performed on the ALE Unit were sufficient to reduce all contaminates of concern below WAC 173-340 standards for unrestricted use. Details of the cleanup activities can be found in the preliminary assessment screening report (DOE 1994a) and in a compendium of field reports for ALE (DOE1994b). Located close to the ALE headquarters lysimeter plot was an elk pen (Figure 4.3). Personal commu-nication with Bill Rickard (see Appendix A) revealed that some work was done there with tritium. Little else is known about this location. Some lysimeters used by Schreckhise and Cline (1980a, 1980b) may have originally been located at the lower Snively lysimeter plot (Figure 4.2). The lower Snively plot was constructed in 1974. In 1975, the lysimeters at Lower Snively were moved to the ALE headquarters lysimeter plot. The Lower Snively lysimeters were used to measure the uptake of plutonium-238 (DOE 1994a). The K. Moss lysimeter plot on the ALE Unit was also used to study plant and root uptake of radioactive materials in 1987. It
4.17
measured 15 meters by 15 meters. Iodine-131 (t1/2 = 8 days) was used for a radiotracer at this location, so there should be no significant levels of radioactivity left after 15 years (DOE 1994a). Bert Cushing (personal communication, see Appendix A) reported using rubidium-86 in a study of Rattlesnake Springs. The rubidium was released into the stream. Rubidium-86 has an 18.7 day half life, so this material long ago decayed below detectable levels. This study may have used building 646 to house the radioactive material. This building is rumored to have had a radioactive material sign posted on it (DOE 1994a). In the 1980s, Crabtree (1989) conducted a study of social behavior of coyotes that involved radio-tracers. The tracers used were manganese-54 (t1/2 = 280 days), zinc-65 (t1/2 = 245 days), cobalt-57 (t1/2 = 270 days), cadmium-109 (t1/2 = 407 days), antimony-125 (t1/2 = 2.7 years), and cesium-134 (t1/2 = 2.1 years). These tracers were slowly released into the bloodstream of the coyotes and were excreted in urine and feces. Collection of the waste products allowed the researchers to determine the home range of individual coyotes that could be identified by differences in the combinations of the tracers that were placed in the implants. Because of the short half-life of the tracers, only small amounts of antimony-125 or cesium-134 may still be present in the study area on ALE assuming that some animal waste was not recovered in the study. No data was provided regarding the amount of antimony-125 or cesium-134 in used in Crabtree�s research. The radioactive material used in this study was most likely stored (temporarily) in one of the laboratory buildings at the ALE headquarters. 4.3 Evaluation of Data from the McGee/Riverlands Unit Data from past monitoring programs on and near the McGee/Riverlands Unit were evaluated to gain information that may be useful in determining whether there may be elevated levels of contamination on the McGee/Riverlands Unit. The following sections describe soil, vegetation, air, radiation, and water monitoring. 4.3.1 Soil Monitoring There has been no routine monitoring of radionuclides conducted on soil from the McGee/Riverlands Unit. However, in 1992 a special study of external radiation conducted by Cooper and Woodruff (1993) collected a limited number of soil samples on the McGee/Riverlands Unit (Figure 4.5). The samples were collected along the Columbia River shoreline, and served as background measurements in their study. Samples were collected at 100-meter intervals along the survey tracks. At the McGee/Riverlands location, three composite soil samples were collected. The results reported by Cooper and Woodruff (1993) are listed in Table 4.9. 4.3.2 Vegetation Monitoring There has been no known analysis for radionuclides conducted on vegetation from the McGee/ Riverlands Unit.

4.18
Figure 4.5. Points of Interest Within the McGee/Riverlands Unit Boundary
Table 4.9. Radionuclide Concentrations in Soil Samples Collected on the McGee/Riverlands Unit in 1992
McGee/Riverlands Shoreline Soil (pCi/g)
Isotope Minimum Median Maximum 2σ Counting
Error
Co-60 -0.016 0.018 0.019 0.015 Sr-90 0.020 0.020 0.025 0.006 Cs-137 0.55 0.57 0.62 0.065 Eu-152 0.091 0.098 0.14 0.075 Eu-154 -0.012 -0.011 0.032 0.05 Eu-155 0.012 0.051 0.089 0.05 U-234 0.92 0.92 1.3 0.15 U-235 0.028 0.039 0.047 0.015 U-238 0.83 0.89 1.2 0.1 Pu-238 0.00019 0.00027 0.00032 0.00025 Pu-239/240 0.0073 0.0073 0.0098 0.0015
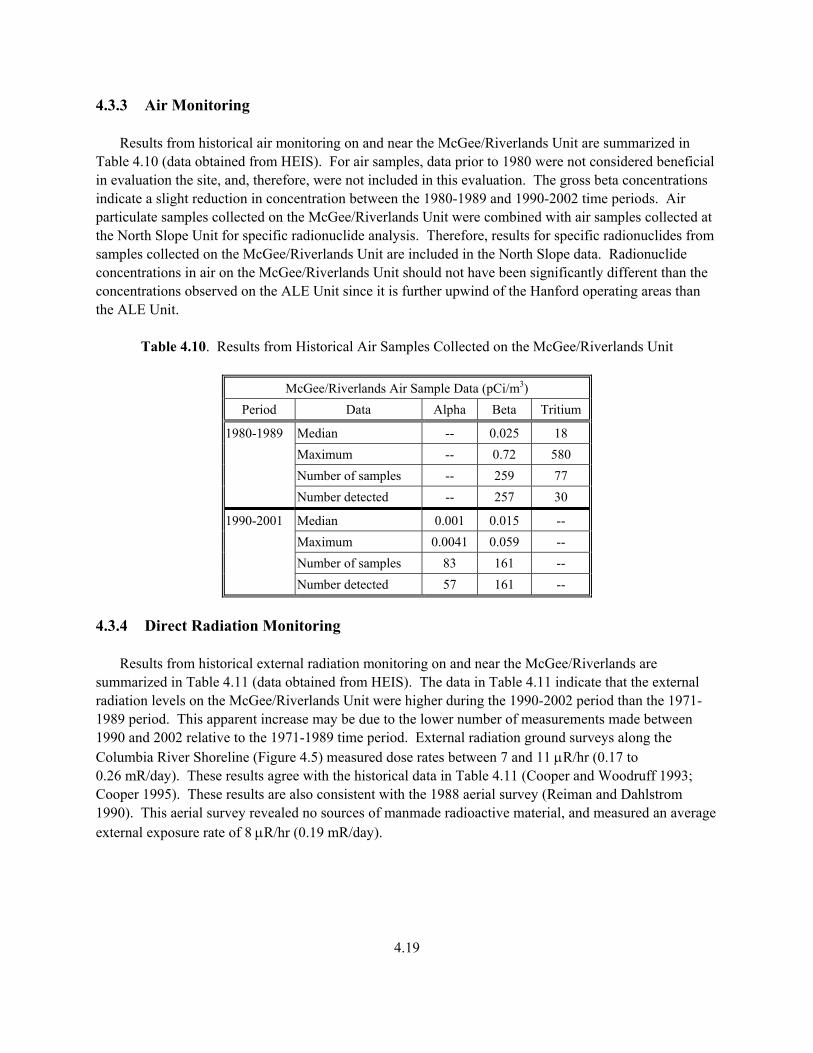
4.19
4.3.3 Air Monitoring Results from historical air monitoring on and near the McGee/Riverlands Unit are summarized in Table 4.10 (data obtained from HEIS). For air samples, data prior to 1980 were not considered beneficial in evaluation the site, and, therefore, were not included in this evaluation. The gross beta concentrations indicate a slight reduction in concentration between the 1980-1989 and 1990-2002 time periods. Air particulate samples collected on the McGee/Riverlands Unit were combined with air samples collected at the North Slope Unit for specific radionuclide analysis. Therefore, results for specific radionuclides from samples collected on the McGee/Riverlands Unit are included in the North Slope data. Radionuclide concentrations in air on the McGee/Riverlands Unit should not have been significantly different than the concentrations observed on the ALE Unit since it is further upwind of the Hanford operating areas than the ALE Unit.
Table 4.10. Results from Historical Air Samples Collected on the McGee/Riverlands Unit
McGee/Riverlands Air Sample Data (pCi/m3) Period Data Alpha Beta Tritium
Median -- 0.025 18 Maximum -- 0.72 580 Number of samples -- 259 77
1980-1989
Number detected -- 257 30
Median 0.001 0.015 -- Maximum 0.0041 0.059 -- Number of samples 83 161 --
1990-2001
Number detected 57 161 --
4.3.4 Direct Radiation Monitoring Results from historical external radiation monitoring on and near the McGee/Riverlands are summarized in Table 4.11 (data obtained from HEIS). The data in Table 4.11 indicate that the external radiation levels on the McGee/Riverlands Unit were higher during the 1990-2002 period than the 1971-1989 period. This apparent increase may be due to the lower number of measurements made between 1990 and 2002 relative to the 1971-1989 time period. External radiation ground surveys along the Columbia River Shoreline (Figure 4.5) measured dose rates between 7 and 11 µR/hr (0.17 to 0.26 mR/day). These results agree with the historical data in Table 4.11 (Cooper and Woodruff 1993; Cooper 1995). These results are also consistent with the 1988 aerial survey (Reiman and Dahlstrom 1990). This aerial survey revealed no sources of manmade radioactive material, and measured an average external exposure rate of 8 µR/hr (0.19 mR/day).

4.20
Table 4.11. External Radiation Dose Rates Measured by TLDs on the McGee/Riverlands Unit
McGee/Riverlands External Radiation Data Period Data TLD (mR/d)
Average 0.22 Median 0.21 Maximum 0.33
1971-1989
Number of samples 250
Average 0.24 Median 0.242 Maximum 0.308
1990-2002
Number of samples 18
4.3.5 Water Monitoring The Columbia River is a boundary for the McGee/Riverlands Unit. Therefore, radionuclide concen-trations in the Columbia River need to be considered. Radioactive materials in the river could have been deposited along the shoreline in areas accessible from the McGee/Riverlands Unit. Monitoring of radio-nuclide concentrations in the Columbia River has been preformed at Priest Rapids Dam continuously since 1971. Prior to 1990, there was also monitoring performed at the Vernita Bridge. The McGee/ Riverlands Unit is upstream of the Hanford nuclear reactors, so the likelihood of Hanford liquid effluent reaching the water adjacent to the McGee/Riverlands Unit is low. Radionuclides in Columbia River upstream of Hanford reactors could have come from deposition of Hanford airborne emissions. However, prevailing winds and the minimal surface area of the river make this an unlikely scenario. The radio-nuclides observed in water samples at Priest Rapids Dam and Vernita Bridge are more likely a result of atmospheric fallout across the entire Columbia River drainage. Radionuclide concentration data from Columbia River water collected at Priest Rapids Dam and Vernita Bridge are outlined in Table 4.12 (data obtained from HEIS). Technitium-99 and europium-155 were detected less than 5% of the time during both of the time periods. Cobalt-60 concentrations in water decreased between the 1971-1989 and 1990-2002 time periods. Strontium-90 and cesium-137 concentrations also dropped slightly between the two time periods. The uranium and plutonium isotope concentrations did not change significantly between the two time periods at the Priest Rapids Dam and Vernita Bridge sampling locations (Table 4.12). 4.3.6 Railroad The only rail line on HRNM runs through the McGee/Riverlands Unit. From 1943 until 1950, this was the only rail line into the Hanford Site. The Riverlands Classification Yard was constructed in 1943 and was decommissioned in 1964 (Keating and Harvey 2002). In addition to tracking all incoming and outgoing rail traffic at the Classification Yard, rail cars that had transported contaminated material were washed at the Riverlands complex prior to exiting the Hanford Site. This washing resulted in the

4.21
Table 4.12. Results from Historical Water Sampling Near the McGee/Riverlands Unit
McGee/Riverlands Water Data (pCi/L)
Sample Location Period Data Alpha Beta Tritium Co-60 Sr-90 Tc-99 Cs-137 Eu-155 U-234 U-235 U-238 Pu-238 Pu-
239/240
Median 0.39 1.6 99 0.002 0.14 -0.3 0.004 -- 0.24 0.008 0.20 0.0000014 0.000026
Maximum 1.2 41 330 1.8 0.46 4.1 1.5 -- 0.40 0.031 0.37 0.000021 0.00034
Number of samples
110 110 115 406 113 11 408 -- 51 51 51 48 49
1971-1989
Number detected(a) 62 41 115 81 111 0 205 -- 51 14 51 19 44
Median 0.45 0.91 37 0.00029 0.08 -0.012 0.001 0.00015 0.24 0.007 0.18 0.000002 0.000025
Maximum 5.6 7.7 205 3.1 0.18 1.6 3.5 5.8 0.44 0.039 0.38 0.0002 0.00028
Number of samples
149 149 147 220 148 148 221 207 148 148 148 46 46
Priest Rapids Dam
1990-2002
Number detected(a) 36 37 146 17 143 2 32 1 148 32 148 6 41
Median 0.57 0.001 360 0.30 0.33 -- 0.033 -- -- -- -- -- --
Maximum 1.2 0.00098 4300 12 2.8 -- 1.2 -- -- -- -- -- --
Number of samples
29 1 94 6 27 -- 14 -- -- -- -- -- --
Vernita Bridge 1971-1989
Number detected(a) 29 1 70 6 27 -- 10 -- -- -- -- -- --
(a) Detected samples have concentrations greater than minimum detectable concentration, and concentrations greater than the 2 sigma counting error.

4.22
Table 4.13. Maximum Concentrations of Gamma-Emitting Radionuclides for Soil Samples Collected at Riverland Classification Yard in 1993
Isotope Maximum (pCi/g)
Co-57 0.676 Co-60 0.382 Cd-109 1.33 Cs-137 19.6 Eu-152 1.91 Eu-154 0.131
establishment of radiological control zones for low level ground contamination. A 1993 memo from the Environmental Restoration Safety Support division of the Westinghouse Hanford Company indicates that soil samples were collected from the Riverlands Classification Yard. While there is no information on the number of samples collected, the analytical detection limit, range of results, or sample locations within the yard, Table 4.13 summarizes the maximum concentrations reported for several radionuclides (ERSS 1993). A 1988 aerial survey of the Hanford Site revealed no manmade radiation on the McGee/Riverlands Unit (Reiman and Dahlstrom 1990). The aerial survey indicated a low total exposure rate on the McGee/ Riverlands Unit. This indicates that any contamination around the Riverlands Classification Yard is small in size. Radiological surveys performed in 1977, 1978, and 1993 revealed natural background levels of radiation (DOE 1996). DOE, EPA, and Ecology have determined that the Riverlands Classification Rail Yard, as well as the entire McGee/Riverlands Unit, poses no current or future unacceptable risk to human health or the environment (DOE 1996). The record of decision (DOE 1996) states that the expedited response actions performed between 1992 and 1994 have cleaned up all contaminants of concern to levels below the WAC 173-340 residential standards. Figures 4.6 and 4.7 show what the Classification Yard looked like in the 1940�s, while Figure 4.8 provides a more recent view for comparison. 4.4 Evaluation of Data from the North Slope Unit Data from past monitoring programs on and near the North Slope Unit were evaluated to gain infor-mation that may be useful in determining whether there may be elevated levels of contamination on the North Slope Unit of the HRNM. The following sections describe soil, vegetation, air, radiation, and water monitoring. 4.4.1 Soil Monitoring Results from historical soil monitoring on and near the North Slope Unit are summarized in Table 4.14 (data obtained from HEIS). On the North Slope Unit, cobalt-60, europium-154, and europium-155 (all with half-lives less than 10 years) were virtually undetectable between 1990 and 2002 (see Appendix B, Table B.1). This indicates that those isotopes have decayed away and are no longer

4.23
Figure 4.6. Riverlands Classification Yard in the 1940s as Seen from the Air
Figure 4.7. Close-Up View of the Riverlands Classification Yard, 1940s

4.24
Figure 4.8. Riverlands Classification Yard in the 1990s as Seen from the Air
Table 4.14. Results from Historical Soil Samples Collected on the North Slope Unit
North Slope Soil Sample Data (pCi/g dry wt) Period Data Co-60 Sr-90 Cs-137 Eu-152 Eu-154 Eu-155 U(a)
Median 0.002 0.11 0.40 0.16 0.001 0.052 0.35 Maximum 0.14 1.8 1.78 0.23 0.089 0.11 1.2 Number of samples 82 82 82 6 36 31 54
1971-1989
Number detected(b) 25 80 80 6 5 7 54 Median -0.001 0.069 0.36 -- 0.005 0.038 -- Maximum 0.012 0.2 0.95 -- 0.11 0.099 -- Number of samples 15 15 15 -- 15 15 --
1990-2001
Number detected(b) 0 15 15 -- 0 1 -- Period Data U-234 U-235 U-238 Pu(a) Pu-238 Pu-239/240 Am-241
Median -- 0.031 0.680 0.006 0.0010 0.008 0.052 Maximum -- 0.230 1.79 0.022 0.016 0.033 0.087 Number of samples -- 11 11 20 82 82 3
1971-1989
Number detected(b) -- 2 11 20 45 81 1 Median 0.410 0.020 0.580 -- 0.0005 0.011 -- Maximum 0.890 0.170 0.880 -- 0.0025 0.030 -- Number of samples 10 16 16 -- 15 15 --
1990-2001
Number detected(b) 10 10 14 -- 13 15 -- (a) Indicates total uranium or total plutonium. (b) Detected samples have concentrations greater than minimum detectable concentration, and concentrations
greater than the 2 sigma counting error.

4.25
detectable in soil on the North Slope Unit. Strontium-90 and cesium-137 (half-lives ~30 yrs) concen-trations in soil also appear to be decreasing, but the concentrations are still detectable. Some radionu-clides with long half-lives, such as uranium and plutonium isotopes, had concentrations in soil on the North Slope that decreased over time. This could be a result of increased sensitivity in analytical methods, dilution caused by transport of wind blown soil, or simply a reflection of the variability of environmental data. As part of a 1992 external radiation survey, Cooper and Woodruff (1993) collected soil samples at five locations along the north shore of the Columbia River (Figure 4.9). These samples were collected from near the 100 D Area to Savage Island, near Ringold. The median soil concentrations reported by Cooper and Woodruff (1993) are outlined in Table 4.15. The samples collected along the shoreline were similar to the historical monitoring data, with the exception of uranium isotopes, which were higher near the shore. The data also indicated a general increase in radionuclide concentration at sampling locations downstream of the F Reactor. A 1972 study investigated radiological levels on the North Slope (Bramson and Corley 1972). Soil and vegetation samples, as well as external radiation measurements, were collected at 38 locations on and around the North Slope Unit. Table 4.15 lists the average soil concentrations observed in 1972 on the
Figure 4.9. Monitoring Locations On or Near the North Slope Unit

4.26
Table 4.15. Radionuclide Concentrations in Soil from 1972 and 1992 Research Studies Along the Columbia River Shoreline
North Slope Shoreline Soil (pCi/g) Isotope 1972 Avg. 1992 Median
Co-60 0.14 0.073 Sr-90 0.22 0.02 Cs-137 0.57 0.23 Eu-152 -- 0.23 Eu-154 -- -0.015 Eu-155 -- 0.075 U-234 -- 1.4 U-235 -- 0.043 U-238 -- 1.4 Pu-238 0.001 0.00013 Pu-239/40 0.014 0.0022
North Slope, and compares those to data collected in 1992. The values observed in 1972 agree with the values observed in 1992. Cobalt-60, cesium-137, and strontium-90 concentrations all decreased in the 20 years between studies. The soil data appeared to be highest at Savage Island and, in general, were higher at locations downstream of the F Reactor (Bramson and Corley 1972). A 1994 study of waste sites in the 200 Areas used a sampling location in the North Slope Unit to collect control samples (Mitchell and Weiss 1994). The samples were collected near a wetlands area on the North Slope Unit (Figure 4.9). In this study, two soil samples were collected and analyzed for several radionuclides. The results of the soil samples analyzed in that study are shown in Table 4.16. Generally, the results are similar to the median values reported from historical monitoring in Table 4.12. One exception is total uranium, which was reported by Mitchell and Weiss (1994) at around 3 pCi/g dry weight for both samples. This is higher than the maximum total uranium soil concentration measured in
Table 4.16. Results of Control Location Soil Samples Collected for 1994 Study
Isotope Concentration 2 σ Counting Error Co-60 (-0.011) 0.014 Co-60 (-0.013) 0.017 Sr-90 0.099 0.038 Sr-90 0.059 0.038 Tc-99 (-0.41) 0.51 Tc-99 (-0.45) 0.71 Cs-137 0.082 0.018 Cs-137 0.095 0.021 Total U 2.7 0.60 Total U 3.4 0.73 ( ) Indicates result below detection limit.
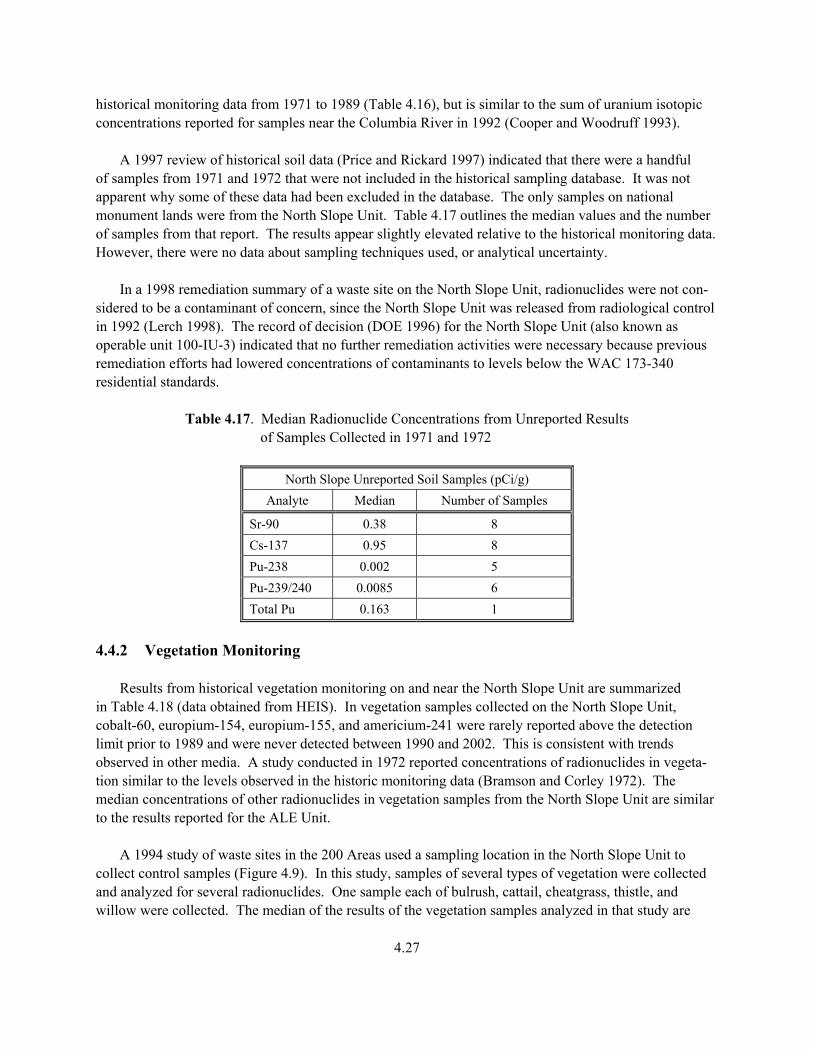
4.27
historical monitoring data from 1971 to 1989 (Table 4.16), but is similar to the sum of uranium isotopic concentrations reported for samples near the Columbia River in 1992 (Cooper and Woodruff 1993). A 1997 review of historical soil data (Price and Rickard 1997) indicated that there were a handful of samples from 1971 and 1972 that were not included in the historical sampling database. It was not apparent why some of these data had been excluded in the database. The only samples on national monument lands were from the North Slope Unit. Table 4.17 outlines the median values and the number of samples from that report. The results appear slightly elevated relative to the historical monitoring data. However, there were no data about sampling techniques used, or analytical uncertainty. In a 1998 remediation summary of a waste site on the North Slope Unit, radionuclides were not con-sidered to be a contaminant of concern, since the North Slope Unit was released from radiological control in 1992 (Lerch 1998). The record of decision (DOE 1996) for the North Slope Unit (also known as operable unit 100-IU-3) indicated that no further remediation activities were necessary because previous remediation efforts had lowered concentrations of contaminants to levels below the WAC 173-340 residential standards.
Table 4.17. Median Radionuclide Concentrations from Unreported Results of Samples Collected in 1971 and 1972
North Slope Unreported Soil Samples (pCi/g) Analyte Median Number of Samples
Sr-90 0.38 8 Cs-137 0.95 8 Pu-238 0.002 5 Pu-239/240 0.0085 6 Total Pu 0.163 1
4.4.2 Vegetation Monitoring Results from historical vegetation monitoring on and near the North Slope Unit are summarized in Table 4.18 (data obtained from HEIS). In vegetation samples collected on the North Slope Unit, cobalt-60, europium-154, europium-155, and americium-241 were rarely reported above the detection limit prior to 1989 and were never detected between 1990 and 2002. This is consistent with trends observed in other media. A study conducted in 1972 reported concentrations of radionuclides in vegeta-tion similar to the levels observed in the historic monitoring data (Bramson and Corley 1972). The median concentrations of other radionuclides in vegetation samples from the North Slope Unit are similar to the results reported for the ALE Unit. A 1994 study of waste sites in the 200 Areas used a sampling location in the North Slope Unit to collect control samples (Figure 4.9). In this study, samples of several types of vegetation were collected and analyzed for several radionuclides. One sample each of bulrush, cattail, cheatgrass, thistle, and willow were collected. The median of the results of the vegetation samples analyzed in that study are
4.28
Table 4.18. Results from Historical Vegetation Samples Collected on the North Slope Unit
North Slope Vegetation Sample Data (pCi/g dry wt) Period Data Co-60 Sr-90 Cs-137 Eu-152 Eu-154 Eu-155 U(a)
Median -0.006 0.05 0.041 13.4 0.009 0.001 0.019 Maximum 0.108 0.651 5.8 13.4 0.185 0.466 0.7 Number of samples 66 68 71 1 29 31 68
1971-1989
Number detected(b) 11 67 44 1 2 3 63 Median 0.003 0.049 0.012 -- 0.008 0.006 0.027 Maximum 0.0234 0.218 0.0333 -- 0.055 0.0331 0.0409 Number of samples 9 9 9 -- 9 9 5
1990-2001
Number detected(b) 0 7 1 -- 0 0 4 Period Data U-234 U-235 U-238 Pu(a) Pu-238 Pu-239/240 Am-241
Median -- -- -- 0.003 1.18E-05 0.0004525 -- Maximum -- -- -- 0.0108 0.00524 0.0293 -- Number of samples -- -- -- 10 68 58 --
1971-1989
Number detected(b) -- -- -- 10 20 36 -- Median 0.017 0.001 0.011 -- 0.000051 0.000144 -- Maximum 0.029 0.00186 0.0294 -- 0.000641 0.00116 -- Number of samples 4 4 4 -- 9 9 --
1990-2001
Number detected(b) 3 0 3 -- 1 4 -- (a) Indicates total uranium or total plutonium. (b) Detected samples have concentrations greater than minimum detectable concentration, and concentrations greater than the
2 sigma counting error.
shown in Table 4.19. Generally, the results are similar to the median values reported from historical monitoring in Table 4.16. Only strontium-90 was reported as being above the minimum detectable concentration, so comparison to historical data is limited in applicability.
Table 4.19. Results of Control Location Vegetation Samples Collected for 1994 Study
Isotope Median Concentration 2 σ Counting Error
Co-60 (-0.00081) 0.014 Sr-90 0.050 0.009 Tc-99 (0.031) 0.35 Cs-137 (0.027) 0.037 total U (-0.88) 0.42 ( ) Indicates result below detection limit.
4.4.3 Air Monitoring Results from historical air monitoring on and near the North Slope Unit are summarized in Table 4.20 (data obtained from HEIS). For air samples, data prior to 1980 was not considered beneficial for evaluating the site and, therefore, was not included in this evaluation. The gross beta concentrations indicate a slight

4.29
Table 4.20. Results from Historical Air Samples Collected on the North Slope Unit
North Slope Air Sample Data (pCi/m3) Period Data Alpha Beta Tritium C-14 Co-60 Sr-90
Median 0.001 0.022 3.9 1.3 -- -- Maximum 0.0049 0.61 1300 1.7 -- -- Number of samples 653 854 701 19 -- --
1980-1989
Number detected(a) 590 849 207 17 -- -- Median 0.001 0.014 1.23 -- -9.6E-06 3.3E-06 Maximum 0.0296 0.0982 527000 -- 1.0E-03 3.9E-04 Number of samples 717 717 354 -- 78 37
1990-2001
Number detected(a) 598 714 118 -- 1 5 Period Data Cs-137 Eu-154 Eu-155 Pu-238 Pu-239/240
Median -- -- -- -- -- Maximum -- -- -- -- -- Number of samples -- -- -- -- --
1980-1989
Number detected(a) -- -- -- -- -- Median 3.5E-05 0 5.8E-05 -1.6E-07 2.6E-07 Maximum 3.8E-04 1.6E-03 1.7E-03 9.4E-07 1.5E-06 Number of samples 78 78 78 37 37
1990-2001
Number detected(a) 2 2 1 0 3
(a) Detected samples have concentrations greater than minimum detectable concentration, and concentrations greater than the 2 sigma counting error.
reduction in concentration between the 1980-1989 and 1990-2002 time periods. Analysis of particulate filters for individual radionuclides was not conducted on air samples from the North Slope Unit until after 1990. Therefore, comparison between the two time periods is only possible for the gross alpha, gross beta, and tritium concentrations. Tritium and strontium-90 were the only radionuclides that were above the detection limit more than 10% of the time between 1990 and 2002. This indicates that atmospheric concentrations of these radionuclides on the North Slope Unit have decreased below detectable levels. 4.4.4 Direct Radiation Monitoring Results from historical external radiation monitoring on and near the North Slope Unit are sum-marized in Table 4.21 (data obtained from HEIS). The data in Table 4.21 indicate that the external radiation levels on the North Slope Unit were higher during the 1990-2002 period than the 1971-1989 period. This apparent increase may be due to the lower number of measurements made between 1990 and 2002 relative to the 1971-1989 time period. The median external radiation dose rate on the North Slope was similar to the dose rate measured on ALE and McGee Ranch/Riverlands Units. Several shoreline surveys (Sula 1980; Cooper and Woodruff 1993; Cooper 1995) have been con-ducted that included the north bank of the Columbia River inside the Hanford boundary. Sula (1980) reported survey data from four locations on the North Slope Unit: Coyote Rapids, Savage Island slough, Savage Island gravel bars, and Ringold Peninsula. The reported exposure rates were 6, 14, 11, and

4.30
Table 4.21. External Radiation Dose Rates Measured by Thermoluminescent Dosimeters on the North Slope Unit
North Slope External Radiation Data Period Data TLD (mR/d)
Average 0.21 Median 0.21 Maximum 0.72
1971-1989
Number of samples 852 Average 0.26 Median 0.25 Maximum 0.37
1990-2002
Number of samples 77 11 µR/hr (0.14, 0.34, 0.26, 0.26 mR/day), respectively. The Savage Island slough exposure rate is the only one that is significantly above the dose rate observed in the historical monitoring data. A 1992 shoreline survey (Cooper and Woodruff 1993) surveyed five locations on the North Slope Unit (Figure 4.9). These locations were located between the 100 D Area to Savage Island, near Ringold. The average of the median exposure rate from each location was 10.7 µR/hr (0.26 mR/day). The survey indicated the exposure rate at the downstream sampling locations on Savage Island to be slightly higher than at the upstream sampling locations. This is consistent with the soil data reported by Cooper and Woodruff (1993). A 1971 study collected radiation dose measurements from 38 locations on the North Slope Unit (Bramson and Corley 1972). The results from this study indicated that the average dose rate on the North Slope Unit in 1971 was 0.33 mR/day. Along the riverbank, the average dose rate was reported to be 0.42 mR/day. And at the Savage Island location, the average dose rate was reported as 0.52 mR/day. This again indicates elevated levels of radioactive isotopes along the river, and particularly around Savage Island. This is consistent with other data observed. A 1978 aerial survey indicated that some areas near the river on the North Slope, and on islands in the Columbia River, had external radiation levels above the surrounding area (Feimster and Hilton 1982). However, the anomalies that appeared to be from manmade radionuclides were only apparent at a few spots on islands. A 1988 aerial survey showed no significant sources of manmade radioactive materials on the North Slope Unit (Reiman and Dahlstrom 1990). However, some areas with gross count rates above the surrounding areas were observed on several Columbia River islands. These spots are assumed to be legacy contamination from the single pass reactors that has been deposited in sediment on the islands. These spots were only slightly above background levels. The rest of the North Slope Unit was reported to have external dose rates of about 8 µR/hour (0.19 mR/day). A 1995 survey of the lower portion of the 100D island conducted by WDOH revealed no significant human health risks (Danielson and Jaquish 1996). This survey measured average dose rates of several areas ranging from 8.8 to 9.5 µR/hr (0.21 to 0.23 mR/day). Several grids were also surveyed to look for

4.31
discrete particles. Three discrete particles were found, with one having a contact dose rate of 2,000 µR/hr (48 mR/day). These particles were collected, analyzed, and determined to be cobalt-60. In 1994, WDOH conducted a shoreline radiation survey near 100 N Reactor (Thatcher 1995). Survey results from the Franklin County shoreline directly opposite of the 100 N Reactor indicated exposure rates similar to other areas of the North Slope Unit. Depending on the instrument, measured exposure rates varied between 5 and 10 µR/hr (0.12 to 0.24 mR/day). The exposure rates observed on the North Slope Unit shoreline across from the 100 N Area were significantly lower than those observed on the Benton County shore immediately downstream of 100 N Reactor. 4.4.5 Water Monitoring The North Slope Unit has the Columbia River as a boundary (Figure 4.1). Therefore, radionuclide concentrations in the Columbia River need to be considered for this unit. Radioactive materials in the river could have been deposited along the shoreline in areas accessible from the North Slope Unit. Monitoring of radionuclide concentrations in the Columbia River has been preformed at Priest Rapids Dam and the Richland Pump house at Leslie Groves Park continuously since 1971. Prior to 1990, there also was monitoring performed at the Vernita Bridge. The North Slope Unit shoreline begins upstream of the Hanford nuclear reactors and ends downstream of the last reactor. To evaluate Columbia River radio-nuclide concentrations in water along the North Slope shoreline it is assumed that radionuclide concen-trations at the Richland Pump house approximately represents the concentrations at the south end of the North Slope Unit. Technitium-99 and europium-155 were detected less than 5% of the time during both time periods (see Appendix B, Table B.5). The only radionuclides that were elevated at the downstream location relative to the upstream locations were tritium, cobalt-60, strontium-90, and cesium-137 (data obtained from HEIS) (Table 4.22). 4.4.6 Buildings and Structures The North Slope Unit was homesteaded by pioneers prior to being incorporated into the Hanford Site in 1943. The North Slope Unit was used as a security buffer and housed various military installations. Seven antiaircraft encampments (Figure 4.9) and three NIKE missile positions were located on the North Slope Unit, along with various military and pioneer structures. These miscellaneous structures include cisterns, drywells, and landfills. Previous reports have identified no radiological contamination at the various pioneer and military structures and installations (Roos 1990; Washington State Department of Ecology 1994; DOE 1994c). This is not surprising since the only evidence of radiological materials being used on the North Slope is rumor about a nuclear warhead being temporarily stored at a military installation (Richard Roos, personal communication, see Appendix A). 4.5 Reference Concentrations Evaluation of the radionuclide concentrations provided in Sections 4.2, 4.3, and 4.4 is difficult with-out reference data to compare to. This section provides reference information obtained from HEIS, screened and sorted in the same manner as the historical data specific to each HRNM Unit. This

4.32
Table 4.22. Results from Historical Water Sampling Near the North Slope Unit
North Slope Water Data (pCi/L)
Sample Location Period Data Alpha Beta Tritium Co-60 Sr-90 Tc-99 Cs-137 Eu-155 U-234 U-235 U-238 Pu-238 Pu-239/240
Median 0.39 1.6 99 0.002 0.14 -0.3 0.004 -- 0.24 0.008 0.20 0.0000014 0.000026
Maximum 1.2 41 330 1.8 0.46 4.1 1.5 -- 0.40 0.031 0.37 0.000021 0.00034
Number of samples 110 110 115 406 113 11 408 -- 51 51 51 48 49
1971-1989
Number detected(a) 62 41 115 81 111 0 205 -- 51 14 51 19 44
Median 0.45 0.91 37 0.00029 0.08 -0.012 0.001 0.00015 0.24 0.007 0.18 0.000002 0.000025
Maximum 5.6 7.7 205 3.1 0.18 1.6 3.5 5.8 0.44 0.039 0.38 0.0002 0.00028
Number of samples 149 149 147 220 148 148 221 207 148 148 148 46 46
Priest Rapids Dam
1990-2002
Number detected(a) 36 37 146 17 143 2 32 1 148 32 148 6 41
Median 0.51 0.005 194 0.16 0.21 0.65 0.041 -- 0.26 0.008 0.21 0.0000029 0.000031
Maximum 1.8 11 2000 47 3.8 4.0 2.8 -- 0.45 0.044 0.36 0.000021 0.00013
Number of samples 266 456 272 417 191 11 444 -- 51 51 51 12 12
1971-1989
Number detected(a) 215 343 239 205 185 0 201 -- 51 18 51 3 11
Median 0.50 0.88 80 0.00044 0.078 0.025 0.001 0.001 0.26 0.009 0.21 0.0000024 0.000014
Maximum 3.4 9.2 210 4.1 0.31 6.5 3.7 3.5 0.50 0.048 0.53 0.000093 0.000070
Number of samples 149 149 147 206 148 148 206 192 148 148 148 44 17
Richland Pumphouse
1990-2002
Number detected(a) 44 32 147 27 143 6 31 5 148 39 148 8 11
Median 0.57 0.001 360 0.30 0.33 -- 0.033 -- -- -- -- -- --
Maximum 1.2 0.00098 4300 12 2.8 -- 1.2 -- -- -- -- -- --
Number of samples 29 1 94 6 27 -- 14 -- -- -- -- -- --
Vernita Bridge 1971-1989
Number detected(a) 29 1 70 6 27 -- 10 -- -- -- -- -- --
(a) Detected samples have concentrations greater than minimum detectable concentration, and concentrations greater than the 2 sigma counting error.

4.33
reference data is similar to background data. However, it has not been subjected to a rigorous evaluation and, therefore, should not be considered as background. It is simply intended to provide a basis by which to compare the environmental data. 4.5.1 Reference Soil and Vegetation Data For soil samples, locations at Sunnyside and Walla Walla were used to calculate reference concen-trations of radionuclides in soil. These two locations were chosen because they are approximately the same distance from the Hanford central plateau, and they had been sampled continuously since 1971. Both locations likely received some atmospheric fallout of radionuclides that originated on the Hanford Site. However, both locations are sufficient distance from the Hanford Site that atmospheric deposition is the only potential pathway for radionuclides of Hanford origin to have reached soil or vegetation at those locations. Sunnyside is considered to be upwind of the Hanford Site, while Walla Walla is downwind. Since there was no appreciable difference in the reported data between these two locations, both were determined to be acceptable to use as reference locations when evaluating the median historical data. Tables 4.23 and 4.24 outline the mean radionuclide concentrations reported from Sunnyside and Walla Walla for soil and vegetation samples. 4.5.2 Reference Air Data The sampling locations used to determine reference air concentrations of radionuclides were Yakima and Sunnyside. Since both of these locations are in the general upwind direction from the Hanford Site, the data from each location were combined and summarized together as a single reference value. The median reported reference concentrations in air are outlined in Table 4.25. 4.5.3 Reference TLD Data Sampling locations at Yakima, Toppenish, and Sunnyside were used as reference points for external radiation dose rate measurements. These three locations were chosen because they vary in distance from the Hanford Site. The median dose rates from each location are outlined in Table 4.26. A more detailed summary of the TLD data is provided in Appendix B, Table B.3. 4.5.4 Reference Water Data Water samples upstream of the Hanford Site were collected at the Vernita Bridge and Priest Rapids Dam. The data for those locations are outlined in Section 4.4.5 (Table 4.22).

4.34
Table 4.23. Results from Historical Soil Sampling at Reference Locations
Sunnyside Soil Sample Data (pCi/g dry wt) Period Data Co-60 Sr-90 Cs-137 Eu-152 Eu-154 Eu-155 U(a)
Median 0.003 0.22 0.60 -- -0.01 0.039 0.29 Maximum 0.032 1.6 1.5 -- 0.094 0.10 0.47 Number of samples 14 14 14 -- 9 9 11
1971-1989
Number detected(b) 2 14 14 -- 0 2 11
Median -0.004 0.084 0.40 -- -0.009 0.026 -- Maximum 0.01 0.35 1.2 -- 0.028 0.049 -- Number of samples 6 6 6 -- 6 6 --
1990-2001
Number detected(b) 0 6 6 -- 0 0 -- Period Data U-234 U-235 U-238 Pu(a) Pu-238 Pu-239/240 Am-241
Median -- 0.077 0.71 -- 0.00027 0.013 0.01 Maximum -- 0.11 1.0 -- 0.0022 0.026 0.034 Number of samples -- 4 4 -- 14 14 9
1971-1989
Number detected(b) -- 0 4 -- 6 14 1 Median 0.35 0.014 0.6 -- 0.00028 0.011 0.004 Maximum 0.63 0.03 0.84 -- 0.0062 0.029 0.0066 Number of samples 4 6 6 -- 6 6 6
1990-2001
Number detected(b) 4 4 6 -- 3 6 4 Walla Walla Soil Sample Data (pCi/g dry wt)
Period Data Co-60 Sr-90 Cs-137 Eu-152 Eu-154 Eu-155 U(a) Median 0.002 0.031 0.15 0.069 -0.03 0.067 0.43 Maximum 0.014 0.31 0.29 0.069 0.05 0.12 0.72 Number of samples 6 6 6 1 6 6 4
1971-1989
Number detected(b) 0 6 6 1 0 3 4 Median 0.004 0.029 0.19 -- 0.026 0.03 -- Maximum 0.011 0.046 0.33 -- 0.040 0.096 -- Number of samples 2 2 2 -- 2 2 --
1990-2001
Number detected(b) 0 1 2 -- 0 0 -- Period Data U-234 U-235 U-238 Pu(a) Pu-238 Pu-239/240 Am-241
Median -- 0.051 1.2 -- 0.00011 0.002 -- Maximum -- 0.073 1.7 -- 0.00081 0.011 -- Number of samples -- 4 4 -- 6 6 --
1971-1989
Number detected(b) -- 0 4 -- 2 5 -- Median 0.46 0.024 0.47 -- 0.001 0.002 -- Maximum 0.70 0.036 0.70 -- 0.0024 0.0031 -- Number of samples 2 2 2 -- 2 2 --
1990-2001
Number detected(b) 2 2 2 -- 2 2 -- (a) Indicates total uranium or total plutonium. (b) Detected samples have concentrations greater than minimum detectable concentration, and concentrations
greater than the 2 sigma counting error.

4.35
Table 4.24. Results from Historical Vegetation Sampling at Reference Locations
Sunnyside Vegetation Sample Data (pCi/g dry wt) Period Data Co-60 Sr-90 Cs-137 Eu-154 Eu-155 U(a)
Median -0.0013 0.061 0.035 -0.0068 0.0014 0.011 Maximum 0.18 0.19 0.34 0.054 0.053 0.018 Number of samples 13 13 13 8 8 13
1971-1989
Number detected(b) 0 13 9 0 0 11 Median 0.0053 0.045 0.014 -0.014 -0.014 0.018 Maximum 0.014 0.087 0.032 0.030 -0.0071 0.038 Number of samples 5 5 5 5 5 2
1990-2001
Number detected(b) 0 4 2 0 0 1 Period Data U-234 U-235 U-238 Pu-238 Pu-239/240 Am-241
Median -- -- -- 4.4E-05 0.00057 0.01 Maximum -- -- -- 0.0076 0.0033 0.01 Number of samples -- -- -- 13 13 1
1971-1989
Number detected(b) -- -- -- 1 8 0 Median 0.0017 -0.0003 0.0014 2.4E-05 0.0001 -- Maximum 0.0042 0.0012 0.0079 6.6E-05 0.0013 -- Number of samples 3 3 3 5 5 --
1990-2001
Number detected(b) 0 0 0 0 2 -- Walla Walla Vegetation Sample Data (pCi/g dry wt)
Period Data Co-60 Sr-90 Cs-137 Eu-154 Eu-155 U(a) Median 0.0056 0.031 0.0099 0.033 0.0048 0.016 Maximum 0.016 0.039 0.029 0.112 0.0192 0.016 Number of samples 4 3 4 4 4 3
1971-1989
Number detected(b) 1 3 1 1 0 3 Median -0.0096 0.066 -0.0016 -0.042 0.027 0.089 Maximum -0.0096 0.066 -0.0016 -0.042 0.027 0.089 Number of samples 1 1 1 1 1 1
1990-2001
Number detected(b) 0 1 0 0 0 1 Period Data U-234 U-235 U-238 Pu-238 Pu-239/240 Am-241
Median -- -- -- 8.2E-05 0.00012 -- Maximum -- -- -- 8.4E-05 0.0003 -- Number of samples -- -- -- 3 3 --
1971-1989
Number detected(b) -- -- -- 0 1 -- Median -- -- -- 0.00012 0.00033 -- Maximum -- -- -- 0.00012 0.00033 -- Number of samples -- -- -- 1 1 --
1990-2001
Number detected(b) -- -- -- 1 1 -- (a) Indicates total uranium. (b) Detected samples have concentrations greater than minimum detectable concentration, and concentrations
greater than the 2 sigma counting error.

4.36
Table 4.25. Results from Historical Air Sampling at Reference Locations
Reference Air Sample Data (pCi/m3) from Yakima and Sunnyside Period Data Alpha Beta Tritium C-14 Co-60 Sr-90 Cs-137 Eu-154
Median 0.001 0.02 3.11 1.4 2.3E-04 5.2E-05 2.3E-04 -- Maximum 0.0042 0.60 818 1.6 2.9E-02 9.9E-04 1.2E-01 -- Number of samples 288 347 294 71 164 55 164 --
1980-1989
Number detected(b) 221 345 75 71 18 23 29 -- Median 0.00047 0.013 0.946 1.5 8.5E-05 -3.5E-06 4.1E-05 9.2E-05Maximum 0.026 0.12 10500 1.6 1.1E-03 6.8E-05 1.3E-03 6.1E-03Number of samples 501 501 240 8 91 37 91 83
1990-2001
Number detected(b) 370 500 65 8 9 1 5 7 Period Data Eu-155 U(a) U-234 U-235 U-238 Pu-238 Pu-239/240
Median 4.0E-03 7.1E-05 1.9E-05 1.2E-06 2.1E-05 1.5E-07 4.4E-07 Maximum 4.4E-03 2.8E-04 6.6E-05 2.0E-05 4.7E-05 4.8E-05 1.4E-04 Number of samples 1 12 32 32 32 53 53
1980-1989
Number detected(b) 1 10 28 9 31 6 10 Median 9.6E-05 -- 1.8E-05 4.3E-07 1.8E-05 0.0E+00 9.4E-08 Maximum 1.6E-03 -- 6.1E-05 1.1E-05 7.3E-05 5.3E-06 3.9E-06 Number of samples 83 -- 37 37 37 37 37
1990-2001
Number detected(b) 1 -- 36 5 35 4 4
(a) Indicates total uranium. (b) Detected samples have concentrations greater than minimum detectable concentration, and concentrations
greater than the 2 sigma counting error.
Table 4.26. External Radiation Dose Rates Measured by TLDs at Reference Locations
Reference External Radiation Data (mR/day) Period Data Sunnyside Toppenish Yakima
Average 0.18 0.19 0.18 Median 0.18 0.19 0.18 Maximum 0.29 0.22 0.28
1971-1989
Number of samples 244 27 57
Average 0.25 -- 0.21 Median 0.20 -- 0.21 Maximum 0.31 -- 0.29
1990-2002
Number of samples 22 -- 49
5.1
5.0 Conclusions Data that were collected through past environmental monitoring programs for air, biota, soil, vegetation, water samples, and external radiation from the HRNM units were reviewed. It was determined that relatively few environmental samples had been collected directly from HRNM for the purpose of characterizing the radionuclide levels present in these environs. Environmental programs were not designed or operated to support radiological release or characterization of contaminant levels on the lands of interest. However, the programs have generated significant quantities of environmental data that are useful for these purposes. Therefore, conclusions about the level of contamination potentially present on these sites may be interpreted and extrapolated to some extent from samples collected on and around the HRNM. In general, the data available indicate that the HRNM units of interest have very low concentrations of radionuclides. Radionuclide concentrations are very near the analytical detection levels for most media and locations, making comparisons of values from different locations more difficult. Further, the data do not indicate a strong likelihood of transport of significant amounts of long-lived radioactive material from Hanford operating areas to national monument lands by any of the pathways described in the conceptual model. The median radionuclide concentrations in each media were generally similar at each unit. In addition, the majority of the observed concentrations on the ALE, McGee/Riverlands and North Slope Units were similar to the concentrations observed at reference locations. This implies that atmospheric fallout from above ground weapons testing contributed significantly to the low levels of manmade radionuclides that were measured in the HRNM environs. The historical data and airborne surveys indicated the radionuclide concentrations likely to be present on the national monument lands were very low and the likelihood any of the HRNM units discussed would exceed typical threshold concentrations or dose rates was small. Specific conclusions about each HRNM unit are provided below. 5.1 ALE Unit In general, comparison of environmental measurements on or near the ALE Unit to the locations least likely to be affected by Hanford operations (reference locations) revealed that radionuclide concentrations from both areas were similar. The radionuclide concentrations observed on the ALE Unit were generally in the range observed at distant locations. Strontium-90 concentrations observed in air on or near the ALE Unit, while extremely low, appeared to be slightly elevated when compared to strontium-90 concen-trations observed at distant locations. However, the difference was not statistically significant (two-sample t-test, 95% confidence). Although the radionuclide levels at the lysimeter plots on ALE were determined to be at or below background levels (Bechtel 1996), these areas have some potential for residual radioactive material to be present. There was also evidence that the southern portion of the ALE Unit could have received increased atmospheric fallout of radioactive materials (plutonium-239/240) from early operations in the 200 Areas, although the levels observed were low (Price and Dirkes 1981). Several buildings (6652-G, 6652-H, 6652-I, 6652-J, and 6652-M) on the ALE Unit housed activities that may have involved the use of radiological material and therefore have some potential for residual contamination.

5.2
5.2 McGee Ranch/Riverlands Unit The McGee Ranch/Riverlands Unit is upstream and predominantly upwind from the Hanford oper-ating areas and, thus, had a low potential for contamination through the air or water pathway. In general, comparison of environmental measurements on or near the McGee/Riverlands Unit to the locations least likely to be affected by Hanford operations (reference locations) confirmed that radionuclide concen-trations from both areas were similar. The radionuclide concentrations observed on the McGee Ranch/ Riverlands Unit were generally in the range observed at distant locations. The most likely source of potential residual radiological contamination remaining on the McGee Ranch/Riverlands Unit is the Riverlands Classification Yard. The washing of rail cars in the early years of Hanford resulted in radiological contamination dispersed within the yard. This site was cleaned up and released. The record of decision (DOE 1996) states that the McGee/Riverlands Unit was cleaned to levels below the WAC 173-340 MTCA residential standards, and poses no current or future unacceptable risk to human health or the environment. 5.3 North Slope Unit Much of the North Slope Unit is downstream and downwind of past Hanford operating areas and present clean-up activities. In general, comparison of environmental measurements on or near the North Slope Unit to the locations least likely to be affected by Hanford operations (reference locations) deter-mined that radionuclide concentrations from both areas were similar. The radionuclide concentrations observed on the North Slope Unit were generally in the range observed at distant locations. The southeast corner of the North Slope Unit is the area within this unit that has the highest potential for radiological contamination. There were indications of slight increases in radionuclide concentrations and external radiation levels on and around Savage Island and Ringold. This could have resulted from atmospheric deposition of Hanford effluent, or more likely, from the deposition of waterborne radioactive particles in the sloughs around Savage Island. In 1996, DOE issued a record of decision (DOE 1996) concerning the North Slope Unit. It was determined that the unit posed no current or future unacceptable risks to human health or the environ-ment. The area was cleaned to levels below the WAC 173-340 MTCA residential standards.

6.1
6.0 References 40 CFR 61. U.S. Environmental Protection Agency. �National Emission Standards for Hazardous Air Pollutants.� Code of Federal Regulations. 40 CFR 122. U.S. Environmental Protection Agency. �EPA Administered Permit Programs: The National Pollutant Discharge Elimination System.� Code of Federal Regulations. 65 FR 114. June 13, 2000. Presidential Proclamation 7319, �Establishment of the Hanford Reach National Monument.� Federal Register. Antonio, E. J., K. Rhoads, and L. H. Staven. 2002. A Study of Past, Present, and Future Radiation Dose Pathways from Hanford Site Effluents. PNNL-13812, Pacific Northwest National Laboratory, Richland, Washington. Bechtel. 1996. Close-Out Report Fitzner-Eberhardt Arid Lands Ecology Reserve Remedial Action, Hanford, Washington. DOE/RL-94-140, Bechtel Hanford, Richland, Washington. Bramson, P. E. and J. P. Corley. 1972. Radiation Survey of Wahluke Slope. BNWL-B-237, Pacific Northwest Laboratory, Richland, Washington. Brauer, F. P. 1974. Environmental I-129 Measurements. BNWL-SA-4983, Pacific Northwest Laboratory, Richland, Washington. Cadwell, L. L. and R. E. Fitzner. 1984. �Nuclear Fuel-Cycle Radionuclides in Raptor Castings: Implications for Environmental Monitoring.� Health Phys. 47(5):723-728. Caldwell, L. L. and W. H. Rickard. 1979. An Evaluation of Rockwell Hanford Operations Proposed Pond Management Alternatives. PNL-3123, Pacific Northwest Laboratory, Richland, Washington. Clean Air Act. 1986. Public Law 88-206, as amended, 42 USC 7401 et seq. Cline, J. F. and L. L. Cadwell. 1984. �Movement of Radiostrontium in the Soil Profile in an Arid Climate.� Health Physics 46:1136-1138. Cline, J. F. and W. H. Rickard. 1972. �Radioactive Strontium and Cesium in Cultivated and Abandoned Field Plots.� Health Physics 33:317-324. Cooper, A. T. and R. K. Woodruff. 1993. Investigation of Exposure Rates and Radionuclide and Trace Metal Distributions Along the Hanford Reach of the Columbia River. PNL-8789, Pacific Northwest Laboratory, Richland, Washington.

6.2
Cooper, A. T. 1995. Measurement of Environmental Radiation Exposure Rates from Vernita, Hanford Reach, and Richland Area Shores. PNL-8789, Addendum 1, Pacific Northwest Laboratory, Richland, Washington. Crabtree, R. L. 1989. �Sociodemography of an unexploited coyote population.� Ph.D. dissertation, University of Idaho, Moscow, Idaho. Danielson, A. and R. Jaquish. 1996. 100-D Radiological Survey. WDOH/ERS-96-1101, Washington State Department of Health, Olympia, Washington. DeFord, D. H. 2002. �Waste Management (Section 6).� In: History of the Plutonium Production Facilities at the Hanford Site Historic District, 1943-1990. DOE/RL-97-1047, U.S. Department of Energy, Richland, Washington. Dirkes, R. L., R. W. Hanf, B. G. Fritz, and T. M. Poston. 2002. Historical Site Assessment of the WNP-1 and WNP-4 Sites. PNNL-13979, Pacific Northwest National Laboratory, Richland, Washington. Diediker, L. P. 1999. Environmental Releases for Calendar Year 1998. HNF-EP-0527-8, Fluor Daniel Hanford, Richland, Washington. DOE. 1994a. Preliminary Assessment Screening (PAS) Report for the Arid Lands Ecology (ALE) Reserve, Hanford. DOE/RL-94-06 Draft A, U.S. Department of Energy, Richland, Washington. DOE. 1994b. A Compendium of Field Reports for the Fitzner-Eberhardt Arid Lands Ecology Reserve Remedial Action, Hanford, Washington. DOE/RL-94-141, U.S. Department of Energy, Richland, Washington. DOE. 1994c. A Compendium of Field Reports for the North Slope (Wahluke Slope) Expedited Response Action, Hanford, Washington. DOE/RL-94-139, U.S. Department of Energy, Richland, Washington. DOE. 1996. Declaration of the Record of Decision. 028346, U.S. Department of Energy, Richland, Washington. DOE. 1999. Final Hanford Comprehensive Land-Use Plan Environmental Impact Statement. DOE/EIS 0222, U.S. Department of Energy, Richland, Washington. DOE. 2001. Hanford 2012: Accelerating Cleanup and Shrinking the Site. DOE/RL-2000-62, Rev. 2, U.S. Department of Energy, Richland, Washington. Online report: http://www.hanford.gov/docs/rl-2000-62/index.html DOE Order 5400.5. �Radiation Protection of the Public and the Environment.� DOE Order 5484.1. �Environmental Protection, Safety and Health Protection Information Reporting Requirements.�

6.3
Eberhardt, L. E., E. E. Hanson, and L. L. Cadwell. 1982. Analysis of Radionuclide Concentrations and Movement Patterns of Hanford Site Mule Deer. PNL-4420, Pacific Northwest Laboratory, Richland, Washington. Eberhardt, L. E., L. L. Cadwell, K. R. Price, and D. W. Carlile. 1989. Trends in Radionuclide Concentrations for Selected Wildlife and Food Products Near the Hanford Site from 1971 Through 1988. PNL-6992, Pacific Northwest Laboratory, Richland, Washington. ERSS - Environmental Restoration Safety Support. 1993. Internal Memo: Riverland Expedited Response Action Safety Assessment. Westinghouse Hanford Company, Richland, Washington. Farris, W. T., B. A. Napier, P. W. Eslinger, T. A. Ikenberry, D. B. Shipler, and J. C. Simpson. 1994. Atmospheric Pathway Dosimetry Report, 1944-1992. PNWD-2228 HEDR, Battelle, Pacific Northwest Laboratories, Richland, Washington. Feimster, E. L. and L. K. Hilton. 1982. An Aerial Radiological Survey of the U.S. Department of Energy�s Hanford Site. EGG-1183-1828, EG&G, Las Vegas, Nevada. Fitzner, R. E., W. H. Rickard, L. L. Cadwell, and L. E. Rogers. 1981. Raptors of the Hanford Site and Nearby Areas of Southcentral Washington. PNL-3212, Pacific Northwest Laboratory, Richland, Washington. Fritz, B. G. and G. W. Patton. 2002. Radionuclide Concentrations in Air on the Hanford Site. PNNL-13909, Pacific Northwest National Laboratory, Richland, Washington. Hanf, R. W. and M. E. Thiede. 1994. Environmental Radiological Monitoring of Air, Rain, and Snow on and Near the Hanford Site, 1945-1957. PNWD-2239 HEDR, Battelle, Pacific Northwest Laboratories, Richland, Washington. Harvey, D. W. 2002. �Military Operations (Section 9).� In: History of the Plutonium Production Facilities at the Hanford Site Historic District, 1943-1990. DOE/RL-97-1047, U.S. Department of Energy, Richland Operations, Richland, Washington. Heeb, C. M. 1994. Radionuclide Releases to the Atmosphere from Hanford Operations, 1944-1972. PNWD-2222 HEDR, Battelle, Pacific Northwest Laboratories, Richland, Washington. Heeb, C. M. and D. J. Bates. 1994. Radionuclide Releases to the Columbia River from Hanford Operations, 1994-1971. PNWD-2223 HEDR, Battelle, Pacific Northwest Laboratories, Richland, Washington. Hoitink, D. J., K. W. Burk, J. V. Ramsdell Jr., and W. J. Shaw. 2002. Hanford Site Climatological Data Summary 2001 with Historical Data. PNNL-13859, Pacific Northwest National Laboratory, Richland, Washington.

6.4
Johnson, A. J., B. M. Markes, J. W. Schmidt, A. N. Shah, S. G. Weiss, and K. J. Wilson. 1994. Historical Records of Radioactive Contamination in Biota at the 200 Areas of the Hanford Site. WHC-MR-0418, Westinghouse Hanford Company, Richland, Washington. Keating, J. K. and D. W. Harvey. 2002. �Transportation Communication Site Support (Section 11).� In: History of the Plutonium Production Facilities at the Hanford Site Historic District, 1943-1990. DOE/RL-97-1047, U.S. Department of Energy, Richland Operations, Richland, Washington. Lerch, J. A. 1998. 100-IU-3 Waste Site 600-104 Remediation Summary. BHI-01116, Rev. 1, Bechtel Hanford, Inc., Richland, Washington. McGuire, J. J. 1997. Rattlesnake Springs Radiological Flyover Field Investigation. 051988, S & M/ Transition Projects. Bechtel Hanford, Richland, Washington. Miller, M. L., J. J. Fix, and P. E. Bramson. 1977. Radiochemical Analysis of Soil and Vegetation Samples Taken from the Hanford Environs, 1971-1976. BNWL-2249, Pacific Northwest Laboratory, Richland, Washington. Mitchell, R. M. and S. G. Weiss. 1994. Ecological Sampling at Four Waste Sites in the 200 Areas. BHI-00032, Bechtel Hanford, Inc., Richland, Washington. O�Farrell, T. P., R. E. Fitzner, and R. O. Gilbert. 1973. Distribution of Radioactive Jackrabbit Pellets in the Vicinity of the B-C Cribs, 200 East Area, U.S. A.E.C. Hanford Reservation. BNWL-1794, Pacific Northwest Laboratory, Richland, Washington. Patton, G. W. and A. T. Cooper. 1993. Air Pathway Effects of Nuclear Materials Production at the Hanford Sites, 1983 to 1992. PNL-8830, Pacific Northwest Laboratory, Richland, Washington. Poston, T. M. and A. T. Cooper. 1994. A Qualitative Evaluation of Radionuclide Concentrations in Hanford Site Wildlife, 1983 Through 1992. PNL-10174, Pacific Northwest Laboratory, Richland, Washington. Poston, T. M. 1995. Concentrations of Radionuclides in Terrestrial Vegetation on the Hanford Site of Potential Interest to Native Americans. PNL-10397, Pacific Northwest Laboratory, Richland, Washington. Poston, T. M., E. J. Antonio, and A. T. Cooper. 1995. Radionuclide Concentrations in Terrestrial Vegetation and Soil on and Around the Hanford Site, 1983 Through 1993. PNL-10728, Pacific Northwest Laboratory, Richland, Washington. Poston, T. M., R. W. Hanf, R. L. Dirkes, and L. F. Morasch (eds.). 2001. Hanford Site Environmental Report for Calendar Year 2000. PNNL-13487, Pacific Northwest National Laboratory, Richland, Washington.

6.5
Price, K. R., L. L. Cadwell, R. G. Schreckhise, and F. P. Brauer. 1981. Iodine-129 in Forage and Deer on the Hanford Site and Other Pacific Northwest Locations. PNL-3357, Pacific Northwest Laboratory, Richland, Washington. Price, K. R. and R. L. Dirkes. 1981. Plutonium in Surface Soil Near the Southwestern Boundary of the Hanford Project. PNL-3647, Pacific Northwest Laboratory, Richland, Washington. Price, K. R. 1991. �The Depth Distribution of 90Sr, 137Cs, and 239/40Pu in Soil Profile Samples.� Radiochemical Acta. 54:145-147. Price, K. R. and R. H. Rickard. 1997. Historical Review of Long-Term Soil Plutonium in Surface Soil Near the Southwestern Boundary of the Hanford Project. PNNL-3647, Pacific Northwest National Laboratory, Richland, Washington. Reiman, R. T. and T. S. Dahlstrom. 1990. An Aerial Radiological Survey of the Hanford Site and Surrounding Area, Richland Washington. EGG-10617-1062, EG&G, Las Vegas, Nevada. Rokkan, D. J., L. P. Diediker, D. L. Dyekman, N. A. Homan, K. Rhoads, and L. H. Steven. 2002. Radionuclide Air Emission Report for the Hanford Site, Calendar Year 2001. DOE/RL-2002-20, U.S. Department of Energy, Richland, Washington. Roos, R. C. 1990. North Slope Investigation Report. WHC-EP-0359, Westinghouse Hanford Company, Richland, Washington. Schreckhise, R. G. and J. F. Cline. 1980a. �Comparative Uptake and Distribution of Plutonium, Americium, Curium, and Neptunium in Four Plant Species.� Health Physics 38:817-824. Schreckhise, R. G. and J. F. Cline. 1980b. �Uptake and Distribution of 232U in Peas and Barley. Health Physics 38:341-343. Soldat, J. K. 1976. �Radiation Doses from Iodine-129 in the Environment.� Health Physics 30(1):61-70. Sula, M. J. 1980. Radiological Survey of Exposed Shoreline and Islands of the Columbia River Between Vernita and the Snake River Confluence. PNL-3127, Pacific Northwest Laboratory, Richland, Washington. Thatcher, A. H. 1995. 100 N Area Shoreline Radiation Survey and Dose Evaluation. WDOH/ERS-95-501, Washington State Department of Health, Olympia, Washington. Thiede, M. E., D. J. Bates, E. I. Mart, and R. W. Hanf. 1994. A Guide to Environmental Monitoring Data, 1945-1972. PNWD-2226 HEDR, Battelle, Pacific Northwest Laboratories, Richland, Washington. Tiller, B. L. and T. M. Poston. 2000. �Mule Deer Antlers as Biomonitors of Strontium-90 on the Hanford Site.� J. Environmental Radioactivity 47:29-44.

6.6
Tipton, W. J. 1975. An Aerial Radiological Survey of the U.S. Energy Research and Development Administration's Hanford Reservation (Survey Period: 1973 - 1974). EGG-1183-1661, EG&G, Las Vegas, Nevada UNI - United Nuclear Industries. 1981. 100 Area Site Development Plan. UNI-M-9, Rev. 1 (Summary). United Nuclear Industries, Richland, Washington. USDA Forest Service. 2002. �Biological Data and Habitat Requirements Wildlife Species: Canis latrans.� Available URL: http://www.fs.fed.us/database/feis/animals/mammal/cala/biological_data_and_habitat_requirements.html WAC 173-340. �Model Toxics Control Act � Cleanup.� Washington Administrative Code, Olympia, Washington. WAC 246-247. �Radiation Protection � Air Emissions.� Washington Administrative Code, Olympia, Washington. Washington State Department of Ecology. 1994. Action Memorandum: North Slope (Wahluke Slope) Expedited Response Action Cleanup Plan, U.S. Department of Energy Hanford Site, Richland, Washington. 0038537, Washington State Department of Ecology, Kennewick, Washington. WDOH. 1989. Washington State Environmental Radiation Protection Program 29th Annual Report January 1989 � December 1989. Washington State Department of Health, Olympia, Washington. WDOH. 1999. Environmental Radiation Protection Program 1992-1994 Annual Report. WDOH/320-021, Washington State Department of Health, Olympia, Washington. WDOH. 1990. Washington State Environmental Radiation Protection Program 29th Annual Report January 1990 � December 1990. Washington State Department of Health, Olympia, Washington.

Appendix A
Personal Communications Summaries

A.1
Appendix A
Personal Communications Summaries The following paragraphs provide a synopsis of people that were interviewed by the authors. These interviews took place between June and August 2002. • Richard Parkhurst � Current Pacific Northwest National Laboratory (PNNL) employee. Discussed
release of Arid Lands Ecology Reserve (ALE) buildings - he provided files from the 1990s dealing with building transfer from the Environmental Technology Division to Facilities and Operations.
-- Some buried oil tanks on ALE. -- The last material in the radiation zone was depleted uranium that belonged to John Glissmeyer.
All material is out, but hoods still considered contaminated. -- Janelle Downs and Brett Tiller may still be storing items in the 6652E building. -- One building had, at one time, stored old tritium-based airway lights that had been used in
Alaska. -- Ken Gano stored an irradiator in one of the buildings that he used to irradiate carpenter ants. • Bert Cushing - Retired PNNL employee; (970) 577-1584, Estes Park, Colorado. Called at 9:15 a.m.;
inquired about radiological work at Rattlesnake Springs. -- In the 1960s, he and Lee Eberhardt conducted a timed release study of rubidium-86 into the
stream. He knew of no other releases into the stream. Rubidium-86 has an 18.7 day half life. -- Lynn Meize conducted stable isotope measurements at ALE for his Ph.D. dissertation (1990s). -- Dale McCullugh conducted studies with carbon-14 and chromium-51 in the laboratory in the late
1960s or 1970s. No material was released. • Gene Schreckhise - Former PNNL employee. Discussed lysimeters at ALE and releases at 100 N
Area. -- There were two plots where lysimeters were set up. One plot was south of ALE headquarters.
Some of the lysimeters had stoppers placed in the plexiglass bottoms that came out when they were installed. Some of these units leaked, but the areas were cleaned up. There was another
A.2
plot (approximately 12 feet x 20 feet) located in the field at lower Snively Springs. This was the first plot and was not used extensively. Gene recalled that it may have been burned in the Hanford fire of 1984. Other contacts on this subject include Larry Cadwell and Jack Cline.
-- He did recall some issues with ruthenium releases for either PUREX or REDOX plants that
involved the release of some white ash like material (nitric acid-salt complexes) that was shaken loose from the stack walls. Some flakes were found at Spokane. He suggested that Joe Soldat be contacted on this topic.
• William (Bill) Rickard � Former PNNL employee. Met briefly with Bill to discuss the lysimeter
work and other activities on ALE. Indicated that lysimeters were initially placed at lower Snively. However, the researchers were asked to move to ALE building complex. Bill recalled two radionuclides being studied. Enclosures still present, but likely charred. Land was surveyed after the lysimeters were removed.
-- Bustad grazed sheep on the ALE Unit for fallout studies in the 1960s. -- Bob Crabtree did tracer work with coyote scat. -- Joe Soldat probably looked at iodine-131 moving across the river in the early years. -- Elk studies done involving tritium at the ALE headquarters elk pen. • Larry Cadwell � Former PNNL employee. Inquired about Crabtree�s thesis and other related work.
Also inquired about raptor castings. -- Provided a copy of Crabtree�s thesis and a rooting study (thesis) by Moss that was done on ALE. -- Obtained a folder of numerous radiological references of related interest to land transfer
including a report on raptor castings. • Keith Price - Former PNNL employee. Discussed activities (operational or research oriented) that
would have resulted in radioactive materials being found on ALE, Riverlands/McGee, and the North Slope Units.
-- For research activities, all studies that he was aware of used tracers with short half lives
including iodine-131, selenium-75, and rubidium-86. These studies were either done onsite (100 B, 100 F Areas) or on ALE. No studies were done on Riverlands/McGee or North Slope because they were not well developed (poor roads and no power) or were too isolated. In contrast, ALE had good roads (some of which were graveled), power, and were closer than the other areas. He also mentioned that several researchers used neutron probes to measure soil density and moisture.

A.3
-- Keith Price mentioned two other individuals who conducted research with tracers on ALE � Dwight Billings used iodine-131 at ALE.
-- Indicated that on McGee Ranch, the Army had two encampments: one in the early 1960s, and
the other around 1968. The Army left debris around and their waste disposal practices were �sloppy,� but there was no release of radioactive materials that can be associated with Army use of the McGee area. Besides this, in the late 1970s or early 1980s, there was a private enterprise of raising tropical fish with the thermal artesian springs located on the McGee property.
-- Indicated there were aerial flyovers, and that the one conducted in 1971-1972 had identified a
thorium deposit located on the North Slope. Said the deposit was located to the west and north of the air monitoring station operated by the Surface Environmental Surveillance Project at the Berg Ranch (located on Highway 24 due north of the 100 Areas).
-- Surveys of coyote and rabbit scat in the late 1960s and early 1970s onsite; he would carry around
a GM and search for radioactive scats. This was done around the 200 Areas and across High-way 240. He never found any hot fecal material on ALE.
-- Mentioned the interest by Dick Fitzner in contaminant transport by raptors. Most of Dick�s
efforts were focused along Army Loop Road and the southeast corner of the 200 East Area. -- Occasionally they would find �hot� dummy slugs (steel spacers used in the reactor cores) that
likely contained activations products (zirconium-65, iron-isotopes). He mentioned there was a lot of �debris� on the surface in waste disposal areas at 100 B and 100 F Areas.
-- Release of iodine-131 on Easter weekend at 100 B Area. Iodine-131 was released through the
stack to test the reactor scram alarm. -- Suggested taking core samples of the rail transfer area at Richland down to 6 feet to assure that
they had been adequately remediated. • Jaime Zeisloft � Current DOE employee. Asked if he had any knowledge of radiological contam-
ination on the HRNM Units. Was aware of non-radiological investigations only. Had no specific knowledge of radioactive materials or contamination on the HRNM lands.
• Richard Roos - Current Fluor employee. Discussed knowledge of potential sources of radiological
contamination on the HRNM lands. -- He felt quite certain that for at least several months there had been a nuclear warhead stored at an
Army storage igloo on the North Slope Unit. Everything else he mentioned had been covered already.

A.4
• Boyd Hathaway - Current DOE employee. Received the following e-mail message from Boyd Hathaway about buildings on the ALE Unit.
-----Original Message----- From: Hathaway, H B (Boyd) Sent: Tuesday, July 16, 2002 5:45 PM To: Glines, Wayne M; Ward, Dana C Cc: Yancey, Edward F (Ed); Millsap, William J (Joel); Poston, Ted M; Ward, Dana C; Ottley, David B (Dave); Hathaway, H B (Boyd) Subject: FW: Buildings Wayne, The U.S. Department of Energy, Richland Operations Office (RL) is in the process of defining costs to facilitate the transfer of ALE to the U.S. Department of Interior (DOI) by the end of fiscal year 2004. It is anticipated that unused facilities on ALE will need to be demolished prior to the transfer. The remediation of buildings to be used by USFWS and those needing to be demolished are anticipated to be completed by September 30, 2003. The status of the ALE buildings are as follows. 1) DOE/PNNL will continue to use 6652L (nike bunker/emergency control center), 6652E (garden shed), and Dome 1 (large observatory dome. 2) USFWS wants to keep the 6652O (storage building), 6652K (pump house), and 6652PH (fire protection pump house. DOE will Remediate hazards in these facilities for release to U.S. Fish and Wildlife Service. 3) Demolish the following facilities: 6652C (science space lab), 6652C shed, 6652D (pump house), 6652 Dome 2 (small astronomy facility), 6652G (Ale Field Storage Building), 6652H (ALE Laboratory 1), 6652I (ALE Headquarters), 6652J (ALE Laboratory 11), 6652LP (low pump house at summit), 6652M (Fallout Laboratory), 6652U (upper pump house at summit), 6652R (Acid Storage Shed), and 646 (Research Lab). This includes Radioactively decontaminating the ALE 6652H facility that supported radioactive activities. A weatherproof replacement facility (with appropriate electrical service) will need to be designed and installed to house the seismic unit and antennas installed in 6652C. The attachment provides other requirements associated with the removal of 6652C. Demolition will include the disposition of septic tank and drainfields, and removal asphalt and concrete slabs, and walkways. After demolition is complete the sites will be contoured to blend in with the surrounding area. All disturbed soil areas will be seeded with native vegetation. 4) The above is the primary objective, however there is a non-profit group, Alliance for the Advancement of Science Through Astronomy (AASTA), that wants to use several of the ALE facilities located at the summit. DOE has not received a formal request from them, but there has been several conversation over the past few years. Therefore, the following facilities may be remediated for hazards, rather than demolished, to accommodate AASTA: 6652C, 6652C Shed, 6652D, 6652 Dome 2, 6652LP, and 6652UP. DOE will pursue this and make a final determination. Please call if you need further clarification. H. Boyd Hathaway DOE/RL CLO 509-376-7340

Appendix B
Summary of Historical Environmental Data

B.1
Table B.1. Soil Data (pCi/g dry weight)
Area Period Data Co-60 Sr-90 Cs-137 Eu-152 Eu-154 Eu-155 U(a) U-234 U-235 U-238 Pu(a) Pu-238 Pu-239/240 Am-241 Median 0.003 0.13 0.54 0.15 0.003 0.025 0.288 -- 0.027 0.684 0.006 0.0010 0.011 0.017 Maximum 0.123 1.63 1.56 0.19 0.250 0.089 0.798 -- 0.278 1.450 0.018 0.0106 0.039 0.041 Number of samples 68 67 68 4 31 29 48 -- 11 11 12 68 68 7
1971-1989
Number detected(b) 19 65 67 4 2 4 47 -- 2 11 12 40 67 2 Median -0.005 0.10 0.27 -- -0.017 0.012 -- 0.110 0.010 0.507 -- 0.0003 0.007 -- Maximum 0.003 0.14 0.42 -- 0.034 0.040 -- 0.747 0.193 1.010 -- 0.0005 0.014 -- Number of samples 9 9 9 -- 9 9 -- 5 9 9 -- 9 9 --
ALE
1990-2001
Number detected(b) 0 8 9 -- 0 0 -- 5 3 9 -- 7 9 -- Median 0.002 0.11 0.40 0.16 0.001 0.052 0.347 -- 0.031 0.676 0.006 0.0010 0.008 0.052 Maximum 0.143 1.75 1.78 0.23 0.089 0.105 1.200 -- 0.232 1.790 0.022 0.0160 0.033 0.087 Number of samples 82 82 82 6 36 31 54 -- 11 11 20 82 82 3
1971-1989
Number detected(b) 25 80 80 6 5 7 54 2 11 20 45 81 1 Median -0.001 0.07 0.36 -- 0.005 0.038 -- 0.409 0.020 0.579 -- 0.0005 0.011 -- Maximum 0.012 0.20 0.95 -- 0.107 0.099 -- 0.893 0.168 0.878 -- 0.0025 0.030 -- Number of samples 15 15 15 -- 15 15 -- 10 16 16 -- 15 15 --
N slope
1990-2001
Number detected(b) 0 15 15 -- 0 1 -- 10 10 14 -- 13 15 -- Median 0.003 0.22 0.60 -- -0.010 0.039 0.286 -- 0.077 0.710 -- 0.0003 0.013 0.010 Maximum 0.032 1.61 1.52 -- 0.094 0.104 0.471 -- 0.108 1.040 -- 0.0022 0.026 0.034 Number of samples 14 14 14 -- 9 9 11 -- 4 4 -- 14 14 9
1971-1989
Number detected(b) 2 14 14 -- 0 2 11 -- 0 4 -- 6 14 1 Median -0.004 0.08 0.40 -- -0.009 0.026 -- 0.345 0.014 0.603 -- 0.0003 0.011 0.004 Maximum 0.010 0.35 1.22 -- 0.028 0.049 -- 0.632 0.030 0.838 -- 0.0062 0.029 0.007 Number of samples 6 6 6 -- 6 6 -- 4 6 6 -- 6 6 6
Sunnyside
1990-2001
Number detected(b) 0 6 6 -- 0 0 -- 4 4 6 -- 3 6 4 Median 0.002 0.03 0.15 0.07 -0.030 0.067 0.432 -- 0.051 1.220 -- 0.0001 0.002 -- Maximum 0.014 0.31 0.29 0.07 0.050 0.116 0.722 -- 0.073 1.730 -- 0.0008 0.011 -- Number of samples 6 6 6 1 6 6 4 -- 4 4 -- 6 6 --
1971-1989
Number detected(b) 0 6 6 1 0 3 4 -- 0 4 -- 2 5 -- Median 0.004 0.03 0.19 -- 0.026 0.030 -- 0.463 0.024 0.469 -- 0.0010 0.002 -- Maximum 0.011 0.05 0.33 -- 0.040 0.096 -- 0.700 0.036 0.695 -- 0.0024 0.003 -- Number of samples 2 2 2 -- 2 2 -- 2 2 2 -- 2 2 --
Walla Walla
1990-2001
Number detected(b) 0 1 2 -- 0 0 -- 2 2 2 -- 2 2 -- (a) Indicates total uranium or total plutonium. (b) Detected samples have concentrations greater than minimum detectable concentration, and concentrations greater than the 2 sigma counting error.

B.2
Table B.2. Vegetation Data (pCi/g dry weight)
Area Period Data Co-60 Sr-90 Cs-137 Eu-152 Eu-154 Eu-155 U(a) U-234 U-235 U-238 Pu(a) Pu-238 Pu-239/240 Am-241
Median 0.001 0.06 0.047 -- -0.002 -0.002 0.011 -- -- -- 0.005 0.000064 0.001 -0.002 Maximum 0.093 1.65 1.93 -- 0.15 0.048 0.14 -- -- -- 0.011 0.036 0.148 -0.002 Number of samples 56 61 61 -- 28 28 61 -- -- -- 6 61 55 1
1971-1989
Number detected(b) 7 59 43 -- 1 1 51 -- -- -- 6 19 38 0
Median -0.078 0.013 -0.026 -- 0.004 -0.029 -- 0.001 -0.001 0.002 -- -0.00008 0.00022 -- Maximum -0.078 0.013 -0.026 -- 0.004 -0.029 -- 0.001 -0.001 0.002 -- -0.00008 0.00022 -- Number of samples 1 1 1 -- 1 1 -- 1 1 1 -- 1 1 --
ALE
1990-2001
Number detected(b) 0 1 0 -- 0 0 -- 0 0 0 -- 0 1 --
Median -0.006 0.05 0.041 13.4 0.009 0.001 0.019 -- -- -- 0.003 0.00001 0.00045 -- Maximum 0.11 0.65 5.8 13.4 0.19 0.47 0.7 -- -- -- 0.01 0.01 0.03 -- Number of samples 66 68 71 1 29 31 68 -- -- -- 10 68 58 --
1971-1989
Number detected(b) 11 67 44 1 2 3 63 -- -- -- 10 20 36 --
Median 0.003 0.049 0.012 -- 0.008 0.006 0.027 0.017 0.001 0.011 -- 0.00005 0.00014 -- Maximum 0.023 0.22 0.033 -- 0.055 0.033 0.041 0.029 0.002 0.029 -- 0.00064 0.00116 -- Number of samples 9 9 9 -- 9 9 5 4 4 4 -- 9 9 --
N slope
1990-2001
Number detected(b) 0 7 1 -- 0 0 4 3 0 3 -- 1 4 --
Median -0.001 0.061 0.035 -- -0.007 0.001 0.011 -- -- -- -- 0.00004 0.00057 0.0102 Maximum 0.18 0.19 0.34 -- 0.054 0.053 0.018 -- -- -- -- 0.0076 0.00328 0.0102 Number of samples 13 13 13 -- 8 8 13 -- -- -- -- 13 13 1
1971-1989
Number detected(b) 0 13 9 -- 0 0 11 -- -- -- -- 1 8 0
Median 0.005 0.045 0.014 -- -0.014 -0.014 0.018 0.0017 -0.0003 0.0014 -- 0.00002 0.00010 -- Maximum 0.014 0.087 0.032 -- 0.030 -0.007 0.038 0.0042 0.0012 0.0079 -- 0.00007 0.00134 -- Number of samples 5 5 5 -- 5 5 2 3 3 3 -- 5 5 --
Sunnyside
1990-2001
Number detected(b) 0 4 2 -- 0 0 1 0 0 0 -- 0 2 --
Median 0.006 0.031 0.010 -- 0.033 0.005 0.016 -- -- -- -- 0.00008 0.00012 -- Maximum 0.016 0.039 0.029 -- 0.112 0.019 0.016 -- -- -- -- 0.00008 0.00030 -- Number of samples 4 3 4 -- 4 4 3 -- -- -- -- 3 3 --
1971-1989
Number detected(b) 1 3 1 -- 1 0 3 -- -- -- -- 0 1 --
Median -0.0096 0.066 -0.002 -- -0.042 0.027 0.089 -- -- -- -- 0.00012 0.00033 -- Maximum -0.0096 0.066 -0.002 -- -0.042 0.027 0.089 -- -- -- -- 0.00012 0.00033 -- Number of samples 1 1 1 -- 1 1 1 -- -- -- -- 1 1 --
Walla Walla
1990-2001
Number detected(b) 0 1 0 -- 0 0 1 -- -- -- -- 1 1 -- (a) Indicates total uranium or total plutonium. (b) Detected samples have concentrations greater than minimum detectable concentration, and concentrations greater than the 2 sigma counting error.
B.3
Table B.3. Air Data (pCi/m3)
Area Period Data Alpha Beta Tritium C-14 Co-60 Sr-90 Cs-137 Eu-154 Eu-155 U(a) U-234 U-235 U-238 Pu-238 Pu-239/240Median 0.001 0.024 3.83 1.35 0.0003 0.00007 0.00018 -- -- 0.00007 -- -- -- 0 0.00000059Maximum 0.004 0.483 1220 1.59 0.0066 0.0015 0.098 -- -- 0.00027 -- -- -- 0.000028 0.000046 Number of samples 424 758 357 19 84 28 84 -- -- 13 -- -- -- 29 28
1980-1989
Number detected(b) 373 752 114 18 14 14 16 -- -- 11 -- -- -- 0 3 Median 0.001 0.014 0.951 -- 0.00003 0.00001 0.00002 0.00025 0.00004 -- 0.000016 0.0000005 0.000016 -0.0000001 0.0000004Maximum 0.0277 0.147 328 -- 0.0015 0.0022 0.00073 0.0039 0.0015 -- 0.000028 0.0000027 0.000034 0.0000031 0.0000052Number of samples 542 595 171 -- 94 42 94 89 89 -- 20 20 20 42 42
ALE
1990-2001
Number detected(b) 416 595 57 -- 5 12 4 4 0 -- 20 3 20 1 12 Median 0.001 0.022 3.92 1.28 -- -- -- -- -- -- -- -- -- -- -- Maximum 0.0049 0.614 1290 1.65 -- -- -- -- -- -- -- -- -- -- -- Number of samples 653 854 701 19 -- -- -- -- -- -- -- -- -- -- --
1980-1989
Number detected(b) 590 849 207 17 -- -- -- -- -- -- -- -- -- -- -- Median 0.001 0.014 1.23 -- -0.0000096 0.0000033 0.00003 0 0.00006 -- -- -- -- -0.0000002 0.0000003Maximum 0.030 0.098 527000 -- 0.0010 0.00039 0.00038 0.0016 0.0017 -- -- -- -- 0.0000009 0.0000015Number of samples 717 717 354 -- 78 37 78 78 78 -- -- -- -- 37 37
N slope
1990-2001
Number detected(b) 598 714 118 -- 1 5 2 2 1 -- -- -- -- 0 3 Median -- 0.025 18.47 -- -- -- -- -- -- -- -- -- -- -- -- Maximum -- 0.722 584 -- -- -- -- -- -- -- -- -- -- -- -- Number of samples -- 259 77 -- -- -- -- -- -- -- -- -- -- -- --
1980-1989
Number detected(b) -- 257 30 -- -- -- -- -- -- -- -- -- -- -- -- Median 0.001 0.015 -- -- -- -- -- -- -- -- -- -- -- -- -- Maximum 0.004 0.059 -- -- -- -- -- -- -- -- -- -- -- -- -- Number of samples 83 161 -- -- -- -- -- -- -- -- -- -- -- -- --
McGee
1990-2001
Number detected(b) 57 161 -- -- -- -- -- -- -- -- -- -- -- -- -- Median 0.0010 0.02 3.11 1.36 0.0002 0.00005 0.00023 -- 0.004 0.00007 0.000019 0.000001 0.000021 0.0000001 0.0000004Maximum 0.0042 0.60 818 1.62 0.029 0.00099 0.12 -- 0.004 0.00028 0.000066 0.000020 0.000047 0.000048 0.00014 Number of samples 288 347 294 71 164 55 164 -- 1 12 32 32 32 53 53
1980-1989
Number detected(b) 221 345 75 71 18 23 29 -- 1 10 28 9 31 6 10 Median 0.00047 0.013 0.946 1.45 0.00009 -0.000003 0.00004 0.00009 0.00010 -- 0.000018 0.0000004 0.000018 0 0.00000009Maximum 0.026 0.124 10500 1.58 0.0011 0.000068 0.0013 0.0061 0.0016 -- 0.000061 0.000011 0.000073 0.000005 0.0000039Number of samples 501 501 240 8 91 37 91 83 83 -- 37 37 37 37 37
Upwind
1990-2001
Number detected(b) 370 500 65 8 9 1 5 7 1 -- 36 5 35 4 4 (a) Indicates total uranium or total plutonium. (b) Detected samples have concentrations greater than minimum detectable concentration, and concentrations greater than the 2 sigma counting error.

B.4
Table B.4. External Radiation Data
Area Period Data TLD (mR/d) Average 0.21 Median 0.21 Maximum 0.46
1971-1989
Number of samples 907 Average 0.25 Median 0.25 Maximum 0.28
ALE
1990-2002
Number of samples 63 Average 0.21 Median 0.21 Maximum 0.72
1971-1989
Number of samples 852 Average 0.26 Median 0.25 Maximum 0.37
North slope
1990-2002
Number of samples 77 Average 0.22 Median 0.21 Maximum 0.33
1971-1989
Number of samples 250 Average 0.24 Median 0.24 Maximum 0.31
McGee
1990-2002
Number of samples 18 Average 0.18 Median 0.18 Maximum 0.29
1971-1989
Number of samples 244 Average 0.25 Median 0.20 Maximum 0.31
Sunnyside
1990-2002
Number of samples 22 Average 0.19 Median 0.19 Maximum 0.22
Toppenish 1990-2002
Number of samples 27 Average 0.18 Median 0.18 Maximum 0.28
1971-1989
Number of samples 57 Average 0.21 Median 0.21 Maximum 0.29
Yakima
1990-2002
Number of samples 49

B.5
Table B.5. Water Data (pCi/L)
Sample Location Period Data Alpha Beta Tritium Co-60 Sr-90 Tc-99 I-129 Cs-137 Eu-155 U-234 U-235 U-238 Pu-238 Pu-239/240
Median 0.39 1.63 99 0.002 0.14 -0.30 -- 0.004 -- 0.24 0.008 0.20 0.0000014 0.000026 Maximum 1.21 41 325 1.82 0.46 4.1 -- 1.53 -- 0.40 0.031 0.37 0.000021 0.000339 Number of samples 110 110 115 406 113 11 -- 408 -- 51 51 51 48 49
1971-1989
Number detected(a) 62 41 115 81 111 0 -- 205 -- 51 14 51 19 44
Median 0.45 0.91 37 0.00029 0.08 -0.01 -- 0.001 0.00015 0.24 0.007 0.18 0.0000020 0.000025 Maximum 5.56 7.7 205 3.05 0.18 1.6 -- 3.48 5.78 0.44 0.039 0.38 0.000196 0.000282 Number of samples 149 149 147 220 148 148 -- 221 207 148 148 148 46 46
Priest Rapids Dam
1990-2002
Number detected(a) 36 37 146 17 143 2 -- 32 1 148 32 148 6 41
Median 0.51 0.005 194 0.16 0.21 0.65 -- 0.041 -- 0.26 0.008 0.21 0.0000029 0.000031 Maximum 1.82 11 2010 47 3.78 4.0 -- 27.8 -- 0.45 0.044 0.36 0.000021 0.000127 Number of samples 266 456 272 417 191 11 -- 444 -- 51 51 51 12 12
1971-1989
Number detected(a) 215 343 239 205 185 0 -- 201 -- 51 18 51 3 11
Median 0.50 0.88 80 0.00044 0.08 0.03 -- 0.001 0.001 0.26 0.009 0.21 0.0000024 0.000014 Maximum 3.38 9.2 211 4.11 0.31 6.5 -- 3.66 3.57 0.50 0.048 0.53 0.000093 0.000070 Number of samples 149 149 147 206 148 148 -- 206 192 148 148 148 44 17
Richland Pumphouse
1990-2002
Number detected(a) 44 32 147 27 143 6 -- 31 5 148 39 148 8 11
Median 0.57 0.001 361 0.30 0.33 -- -- 0.033 -- -- -- -- -- -- Maximum 1.21 0.001 4300 12 2.77 -- -- 1.2 -- -- -- -- -- -- Number of samples 29 1 94 6 27 -- -- 14 -- -- -- -- -- --
Vernita Bridge 1971-1989
Number detected(a) 29 1 70 6 27 -- -- 10 -- -- -- -- -- -- (a) Detected samples have concentrations greater than minimum detectable concentration, and concentrations greater than the 2 sigma counting error.
Appendix C
ALE Building Summary

C.1
Appendix C
ALE Building Summary This appendix contains information about the U. S. Department of Energy�s (DOE�s) plans for buildings on the Arid Lands Ecology Reserve (ALE) Unit. Table C.1 provides a description and future plans for buildings on the ALE Unit. This information was made available by Boyd Hathaway of DOE and represents DOE�s current position (2002), but is subject to change. This section also contains a description of potentially contaminated buildings on the ALE Unit.
Table C.1. Buildings on the ALE Unit
Building # Building Description Future Use
6652-L Nike bunker/emergency control center Continued use Dome 1 Large observatory dome Continued use 623A Plant radio relay building Continued use T52C Navy Mars radio station Continued use 6652-E Garden shed Remediate and release to U.S. F&W 6652-O Storage building Remediate and release to U.S. F&W 6652-K Pump house Remediate and release to U.S. F&W 6652-PH Fire protection pump house Remediate and release to U.S. F&W 6652-C Space science laboratory Demolish 6652-C Shed Demolish 6652-D Pump house Demolish Dome 2 Small astronomy facility Demolish 6652-G ALE field storage building Demolish 6652-H ALE Laboratory I Demolish 6652-I ALE headquarters Demolish 6652-J ALE Laboratory II Demolish 6652-LP Low pump house at summit Demolish 6652-M Fallout laboratory Demolish 6652-UP Upper pump house at summit Demolish 6652-R Acid storage shed Demolish 646 Research laboratory Demolish

C.2
C.1 Description of Potentially Contaminated Buildings on ALE Building 6652-H, ALE Laboratory I. The laboratory is an industrial facility with some potential radiological issues. The U. S. Army Corps of Engineers constructed the 6652-H building in 1956. It served as a mess hall for military personnel stationed in the launch area of the H-52 Nike missile installation. After the closure of Camp Hanford, Battelle used the building. Building 6652-H provided
primary support to the terrestrial field programs operating on the ALE reserve and offsite within Pacific Northwest National Laboratory�s (PNNL�s) Environmental Sciences Department. It is a one-story concrete block building erected on concrete footings and an on-grade concrete floor slab. The roof is a flat, gable type covered with tar and gravel. A hallway connects to the 6652-I building. The building contains four offices and five laboratories of various sizes, there are no restrooms in this build-ing but they were available in the adjoining
6652-I building. Radiologically contaminated HEPA filters and ductwork have been removed, but the plenum ductwork downstream of HEPA filters is still in place. The heating, ventilation and air condi-tioning (HVAC) system consisted of electric heat and air conditioning, which has been shutdown. A wet-pipe sprinkler system and fire alarms protected the building but are now out of service. Power was made available to the building from adjacent pole transformers fed by a Bonneville Power Authority line to the site. Specific hazards identified during the walkthrough were: broken/damaged asbestos floor tiles, sprinkler heads (lead), bird and animal intrusion, potential PCB ballasts, lead paint, manometer (red oil) gauge in equipment room, mercury thermostats, 2 large air conditioning units, 12 small room units (freon), large propane tank on south side of building, and numerous roof leaks. Building 6652-I, ALE Headquarters. The headquarters is an industrial facility with some potential radiological issues. Building 6652-I was built in 1955 and originally served as an administration, recreation, and storage facility for the Nike site. After the closure of Camp Hanford, this building was used by PNNL to provide office and laboratory space and primary support to the terrestrial field programs operating on ALE and offsite within the Environmental Science Department. The hallway connecting to building 6652-H was constructed after 1958. The building is a one-story concrete block structure erected on concrete footings and a slab-on-grade floor. The roof is a flat, gable type covered with tar and gravel. It contains eight offices, three laboratories, a lunchroom, restrooms, and a furnace room. Utilities included sanitary water and sewer and normal building power. The building was heated and cooled by individual room units containing electric strip heaters and cooling compressors. A wet-pipe sprinkler system and fire alarms protected the building. Specific hazards identified during the walkthrough were: sprinkler heads (lead), bird and animal intrusion, potential PCB ballasts, lead paint, mercury thermostats, air conditioning units (freon), and numerous roof leaks.

C.3
Building 6652-G, ALE Barracks/Field Storage Building. The Barracks/Field Storage Building is an industrial facility. This building is a one-story L-shaped concrete block structure with a wooden joist roof. It has a separate section on the north end and a small equipment room on the east side. The equipment room contains a furnace, boiler, and water tank. The total building area is 6,783 square feet. From 1955-1960, the Army used this building as a barracks. In 1967, Battelle took over the facility and used it for storage of equipment and samples primarily for use by the Radiological Sciences Department. The building was cleaned out and shut down in 1995. It is in very poor condition and contains significant amounts of asbestos floor tile and transite panels. There are two latrine/shower rooms in the building but Battelle never used these. The Army Corps of Engineers removed an underground storage tank in 1994; at that time the septic system was also analyzed and found to contain no hazardous materials. In January 1999, the septic system was closed and filled with sand slurry. Specific hazards noted during the walk-downs were: broken/damaged asbestos floor tiles, lead paint (peeling), roof leaks, fire alarm pull boxes (potential mercury), transite paneling on walls throughout, animal/bird intrusion, possible transite sewer piping in facility, and mercury thermostats. Building 6652-J, ALE Laboratory II. This laboratory is an industrial facility. This building is a 7,618 square foot concrete block structure. It was originally used as barracks to house military personnel at the Nike missile launch site from 1955 to about 1960. The building was modified in 1967 by PNNL�s Environmental Sciences Department to contain laboratories, growth chambers, offices, and storage space. At the southern end is a bathroom. The building has not been used for several years and was shut down in 1995. There are still some electrical services in the equipment room for weather instruments and alarms but the majority of the building has been isolated. Specific hazards identified during the walkthrough were: bird/mouse intrusion, lead paint and flashing around roof vents, poten-tial PCB ballasts, damaged asbestos floor tiles, transite paneling in bath-room area, laboratory hoods/sinks � potential chemical contamination, fire alarm pull boxes (potential mercury), potential PCB transformer, and two air conditioning units (freon). Building 6652-M, Fallout Laboratory. The Fallout Laboratory is an industrial facility. The 6652-M building is a one story concrete block building on concrete footings and an on-grade slab with a built up tar and gravel roof. The total building area is 694 square feet and was originally used as a latrine, shower and change room facility for the Nike missile launch site. After the Nike program was decommissioned, Battelle obtained the building and used it for field sample preparation of animal tissue and vegetation.

C.4
Studies to determine fallout by chemical analysis of the remains of animals and vegetation were done in the low background �clean� environment. The building was closed in 1995 and has not been used since. Specific hazards identified during building walk-downs were: severe roof leaks, damaged asbestos floor tiles, lead paint, potential PCB ballasts, laboratory sinks, potential chemical contamination, bird and animal intrusion, mercury thermostats, and a ventilation system that was shutdown but not capped and it was unknown whether it had a HEPA filter or not.

Appendix D
Bibliography
D.1
Appendix D
Bibliography
Table D.1. Hanford Site Annual Environmental Reports HW-64371 Junkins, R. L., E. C. Watson,
I. C. Nelson, and R. C. Henle 1959 Evaluation of Radiological
Conditions in the Vicinity of Hanford for 1959
General Electric Company, Hanford Atomic Products Operation, Richland, Washington
HW-68435 Foster, R. F. (manager), and I. C. Nelson (editor)
1961 Evaluation of Radiological Conditions in the Vicinity of Hanford for 1960
General Electric Company, Hanford Atomic Products Operation, Richland, Washington
HW-71999 Foster, R. F. (manager), and I. C. Nelson (editor)
1962 Evaluation of Radiological Conditions in the Vicinity of Hanford for 1961
General Electric Company, Hanford Atomic Products Operation, Richland, Washington
HW-70552 Foster, R. F. (manger), and I. C. Nelson (editor)
1962 Evaluation of Radiological Conditions in the Vicinity of Hanford April-June, 1961
General Electric Company, Hanford Atomic Products Operation, Richland, Washington
HW-76526 Foster, R. F. (manager), and R. H. Wilson (editor)
1963 Evaluation of Radiological Conditions in the Vicinity of Hanford for 1962
General Electric Company, Hanford Atomic Products Operation, Richland, Washington
HW-80991 Foster, R. F. (manager), and R. H. Wilson (editor)
1964 Evaluation of Radiological Conditions in the Vicinity of Hanford for 1963
General Electric Company, Hanford Atomic Products Operation, Richland, Washington
BNWL-983 Corley, J. P., and C. B. Wooldridge
1968 Evaluation of Radiological Conditions in the Vicinity of Hanford for 1967
Pacific Northwest Laboratory, Richland, Washington
BNWL-665 Honstead, J. F., and T. H. Essig
1968 Evaluation of Radiological Conditions in the Vicinity of Hanford January-June, 1967
Pacific Northwest Laboratory, Richland, Washington
BNWL-1341 Fisher, W. L., and C. B. Wilson
1970 Evaluation of Radiological Conditions in the Vicinity of Hanford for 1968
Pacific Northwest Laboratory, Richland, Washington
BNWL-1505 Corley, J. P. 1970 Evaluation of Radiological Conditions in the Vicinity of Hanford for 1969
Pacific Northwest Laboratory, Richland, Washington
BNWL-1669 Corley, J. P. 1973 Environmental Surveillance at Hanford for CY 1970
Pacific Northwest Laboratory, Richland, Washington
BNWL-1683 Bramson, P. E., and J. P. Corley
1972 Environmental Surveillance at Hanford for CY 1971
Pacific Northwest Laboratory, Richland, Washington
BNWL-1727 P. E. Bramson, J. P. Corley 1973 Environmental Surveillance at Hanford for CY 1972
Pacific Northwest Laboratory, Richland, Washington
BNWL-1811 W. L. Nees, J. P. Corley 1974 Environmental Surveillance at Hanford for CY 1973
Pacific Northwest Laboratory, Richland, Washington
BNWL-1910 J. J. Fix 1975 Environmental Surveillance at Hanford for CY 1974
Pacific Northwest Laboratory, Richland, Washington
BNWL-1979 Rev.
D. R. Speer, J. J. Fix, P. J. Blumer
1976 Environmental Surveillance at Hanford for CY 1975
Pacific Northwest Laboratory, Richland, Washington

D.2
Table D.1. (contd)
BNWL-1979
D. R. Speer, J. J. Fix, P. J. Blumer
1976 Environmental Surveillance at Hanford for CY 1975
Pacific Northwest Laboratory, Richland, Washington
BNWL-2246
J. J. Fix, P. J. Blumer, P. E. Bramson
1977 Status of the Hanford Site for CY 1976
Pacific Northwest Laboratory, Richland, Washington
BNWL-2124
J. J. Fix, P. J. Blumer, G. R. Hoenes, P. E. Bramson
1977 Environmental Surveillance at Hanford for CY 1976
Pacific Northwest Laboratory, Richland, Washington
PNL-2677 J. R. Houston, P. J. Blumer 1978 Status of the Hanford Site for CY-1977
Pacific Northwest Laboratory, Richland, Washington
PNL-2614 J. R. Houston, P. J. Blumer 1978 Environmental Surveillance at Hanford for CY 1977
Pacific Northwest Laboratory, Richland, Washington
PNL-2933 J. R. Houston, P. J. Blumer 1979 Status of the Hanford Site for CY-1978
Pacific Northwest Laboratory, Richland, Washington
PNL-2932 J. R. Houston, P. J. Blumer 1979 Environmental Surveillance at Hanford for CY 1978
Pacific Northwest Laboratory, Richland, Washington
PNL-3284 J. R. Houston, P. J. Blumer 1980 Status of the Hanford Site for CY-1979
Pacific Northwest Laboratory, Richland, Washington
PNL-3283 J. R. Houston, P. J. Blumer 1980 Environmental Surveillance at Hanford for CY 1979
Pacific Northwest Laboratory, Richland, Washington
PNL-3729 M. J. Sula, P. J. Blumer, R. L. Dirkes
1981 Status of the Hanford Site for CY 1980
Pacific Northwest Laboratory, Richland, Washington
PNL-3728 M. J. Sula, P. J. Blumer 1981 Environmental Surveillance at Hanford for CY 1980
Pacific Northwest Laboratory, Richland, Washington
PNL-4221 Sula, M. J., W. D. McCormack, R. L. Dirkes, K. R. Price, and P. A. Eddy
1982 Environmental Surveillance at Hanford for CY 1981
Pacific Northwest Laboratory, Richland, Washington
PNL-4657 Sula, M. J., J.M.V. Carlile, K. R. Price, and W. D. McCormack
1983 Environmental Surveillance at the Hanford Site for CY 1982
Pacific Northwest Laboratory, Richland, Washington
PNL-5038 Price, K. R., J.M.V. Carlile, R. L. Dirkes, and M. S. Trevathan
1984 Environmental Surveillance at Hanford for 1983
Pacific Northwest Laboratory, Richland, Washington
PNL-5039 Price, K. R., P. J. Blumer, J.M.V. Carlile, R. L. Dirkes, and M. S. Trevathan
1984 Environmental Status of the Hanford Site for CY 1983
Pacific Northwest Laboratory, Richland, Washington
PNL-5407 Price, K. R., J.M.V. Carlile, R. L. Dirkes, R. E. Jaquish, M. S. Trevathan, and R. K. Woodruff
1985 Environmental Monitoring at Hanford for 1984
Pacific Northwest Laboratory, Richland, Washington
PNL-5407 Suppl.
Price, K. R., J.M.V. Carlile, R. L. Dirkes, R. E. Jaquish, M. S. Trevathan, and R. K. Woodruff
1986 Environmental Monitoring at Hanford for 1984 Supplement
Pacific Northwest Laboratory, Richland, Washington
PNL-5817 Price, K. R 1986 Environmental Monitoring at Hanford for 1985
Pacific Northwest Laboratory, Richland, Washington
PNL-6120 PNL 1987 1987 Environmental Monitoring at Hanford for 1986
Pacific Northwest Laboratory, Richland, Washington
PNL-6464 Jaquish, R. E., and P. J. Mitchell
1988 Environmental Monitoring at Hanford 1987
Pacific Northwest Laboratory, Richland, Washington
PNL-6825 Jaquish, R. E., and R. W. Bryce
1989 Hanford Site Environmental Report for Calendar Year 1988
Pacific Northwest Laboratory, Richland, Washington
D.3
Table D.1. (contd)
PNL-7346 Jaquish, R. E., and R. W. Bryce
1990 Hanford Site Environmental Report for Calendar Year 1989
Pacific Northwest Laboratory, Richland, Washington
PNL-7930 Woodruff, R. K., R. W. Hanf, M. G. Hefty, and R. E. Lundgren
1991 Hanford Site Environmental Report for Calendar Year 1990
Pacific Northwest Laboratory, Richland, Washington
PNL-8148 Woodruff, R. K., R. W. Hanf, and R. E. Lundgren
1992 Hanford Site Environmental Report for Calendar Year 1991
Pacific Northwest Laboratory, Richland, Washington
PNL-8682 Woodruff, R. K., R. W. Hanf, and R. E. Lundgren
1993 Hanford Site Environmental Report for Calendar Year 1992
Pacific Northwest Laboratory, Richland, Washington
PNL-9823 Dirkes, R. L., R. W. Hanf, R. K. Woodruff, and R. E. Lundgren
1994 Hanford Site Environmental Report for Calendar Year 1993
Pacific Northwest Laboratory, Richland, Washington
PNL-10574 Dirkes, R. L., and R. W. Hanf
1995 Hanford Site Environmental Report for Calendar Year 1994
Pacific Northwest Laboratory, Richland, Washington
PNL-11139 Dirkes, R. L., and R. W. Hanf
1996 Hanford Site Environmental Report for Calendar Year 1995
Pacific Northwest Laboratory, Richland, Washington
PNL-11472 Dirkes, R. L., and R. W. Hanf
1997 Hanford Site Environmental Report for Calendar Year 1996
Pacific Northwest Laboratory, Richland, Washington
PNL-11795 Dirkes, R. L., and R. W. Hanf
1998 Hanford Site Environmental Report for Calendar Year 1997
Pacific Northwest Laboratory, Richland, Washington
PNNL-12088 Dirkes, R. L., R. W. Hanf, and T. M. Poston
1999 Hanford Site Environmental Report for Calendar Year 1998
Pacific Northwest National Laboratory, Richland, Washington
PNNL-13230 Poston, T. M., R. W. Hanf, and R. L. Dirkes
2000 Hanford Site Environmental Report for Calendar Year 1999
Pacific Northwest National Laboratory, Richland, Washington

Appendix E
Hanford Sitewide Surface Environmental Surveillance Sampling Locations
E.1
Appendix E
Hanford Sitewide Surface Environmental Surveillance Sampling Locations
Figure E.1. PNNL Air Sampling Locations (2002)

E.2
Figure E.2. PNNL Water Sampling Locations (2002)
E.3
Figure E.3. PNNL Agricultural Product Sample Locations (2002)

E.4
Figure E.4. PNNL Onsite, Perimeter, Offsite, and River Shoreline TLD Locations (2002)

E.5
Figure E.5. PNNL Soil and Vegetation Sampling Locations (2002)

E.6
Figure E.6. PNNL Fish and Wildlife Sampling Locations (2002)

E.7
Figure E.7. PNNL Sediment Sampling Locations (2002)
PNNL-13989
Distr.1
Distribution No. of Copies OFFSITE N. Ceto U.S. Environmental Protection Agency Region 10 Office of Environmental Cleanup Director � Hanford Project Office 1200 6th Avenue Seattle, WA 98101 A. Fredin Confederated Tribes of the Colville Reservation P.O. Box 150 Nespelem, WA 99155 R. Gay Confederated Tribes of the Umatilla Indian Reservation P.O. Box 638 Pendleton, OR 97801 L. Goldstein Hanford Natural Resources Trustee Council Washington State Department of Ecology P.O. Box 47600 Olympia, WA 98504 G. Hughes U.S. Fish and Wildlife Service 3250 Port of Benton Boulevard Richland, WA 99352-1670
No. of Copies R. Jim, Manager Environmental Restoration and Waste Management Program The Confederated Tribes and Bands of the Yakama Nation P.O. Box 151 Toppenish, WA 98948 R. Keck Energy Northwest P.O. Box 968 Richland, WA 99352 D. McBaugh Division of Radiation Protection Washington State Department of Health P.O. Box 47890 Olympia, WA 98504-7890 L. Oakes Energy Northwest P.O. Box 968 Richland, WA 99352 O. Patt, Jr., Council Chairman Confederated Tribes of the Warm Springs Reservation P.O. Box 1299 Warm Springs, OR 97761 M. Ritter U.S. Fish and Wildlife Service 3250 Port of Benton Boulevard Richland, WA 99352

PNNL-13989
Distr.2
No. of Copies G. Schreckhise, Associate Dean Washington State University Tri-Cities 2710 University Drive Richland, WA 99352 L. Seelatsee Wanapum People P.O. Box 878 Ephrata, WA 98823 P. Sobotta, Director ERWM Nez Perce Tribe P.O. Box 365 Lapwai, ID 83540 E. Stensgar, Chairman Coeur d�Alene Tribal Council P.O. Box 408 Plummer, ID 83851-9704 J. Watts Federal Advisory Committee c/o U.S. Fish and Wildlife Service 3250 Port of Benton Boulevard Richland, WA 99352 ONSITE 18 DOE Richland Operations Office B. Bilson A3-04 K. V. Clarke A7-75 P. F. Dunigan, Jr. A5-58 M. J. Elsen A2-45 W. M. Glines A2-15 J. B. Hall A2-15
No. of Copies H. B. Hathaway A2-15 K. A. Klein A7-50 A. Larsen A2-15 M. K. Marvin A7-75 L. L. Piper A6-37 D. C. Ward A2-15 S. H. Wisness A2-15 J. H. Zeisloft A2-15 DOE Public Reading Room (2) H2-53 Administrative Record (2) H6-08 9 Fluor Hanford, Inc. B. A. Austin H8-67 R. J. Ford T2-13 T. W. Hogg H5-26 R. L. Ingram S4-21 M. T. Jansky N1-25 W. J. Millsap H5-26 D. B. Ottley H5-26 G. D. Perkins H8-67 E. F. Yancey H7-21 23 Pacific Northwest National Laboratory E. J. Antonio K3-54 A. L. Bunn K6-85 R. L. Dirkes (5) K6-75 B. G. Fritz (5) K6-75 R. H. Hanf K6-75 L. F. Morasch K6-86 B. A. Napier K3-54 G. W. Patton K6-75 T. M. Poston K6-75 M. H. Smith K3-55 S. F. Snyder K3-54 Hanford Technical Library (2) P8-55 Historical File � R. L. Dirkes K6-75 LMSI Central Files A3-88