hippocampal atrophy patterns in mild cognitive impairment and alzheimer's disease
TRANSCRIPT
r Human Brain Mapping 31:1339–1347 (2010) r
Hippocampal Atrophy Patterns in Mild CognitiveImpairment and Alzheimer’s Disease
Susanne G. Mueller,1 Norbert Schuff,1 Kristine Yaffe,2 Catherine Madison,3
Bruce Miller,4 and Michael W. Weiner1*
1Center for Imaging of Neurodegenerative Diseases, Department of Veterans Affairs Medical Center,San Francisco, California
2Memory Disorders Clinic, Department of Veterans Affairs Medical Center, San Francisco, California3Memory Clinic, California Pacific Medical Center, San Francisco, California
4Memory and Aging Center, UCSF, San Francisco, California
r r
Abstract: Background: Histopathological studies and animal models suggest that hippocampal subfieldsmay be differently affected by aging, Alzheimer’s disease (AD), and other diseases. High-resolutionimages at 4 Tesla depict details of the internal structure of the hippocampus allowing for in vivo volu-metry of different subfields. The aims of this study were as follows: (1) to determine patterns of vol-ume loss in hippocampal subfields in normal aging, AD, and amnestic mild cognitive impairment(MCI). (2) To determine if measurements of hippocampal subfields provide advantages over total hip-pocampal volume for differentiation between groups. Methods: Ninety-one subjects (53 controls (meanage: 69.3 � 7.3), 20 MCI (mean age: 73.6 � 7.1), and 18 AD (mean age: 69.1 � 9.5) were studied with ahigh-resolution T2 weighted imaging sequence aimed at the hippocampus. Entorhinal cortex (ERC),subiculum, CA1, CA1-CA2 transition zone (CA1-2), CA3 & dentate gyrus (CA3&DG) were manuallymarked in the anterior third of the hippocampal body. Hippocampal volume was obtained from theFreesurfer and manually edited. Results: Compared to controls, AD had smaller volumes of ERC, sub-iculum, CA1, CA1-2, and total hippocampal volumes. MCI had smaller CA1-2 volumes. Discriminantanalysis and power analysis showed that CA1-2 was superior to total hippocampal volume for distinc-tion between controls and MCI. Conclusion: The patterns of subfield atrophy in AD and MCI were con-sistent with patterns of neuronal cell loss/reduced synaptic density described by histopathology. Thesepreliminary findings suggest that hippocampal subfield volumetry might be a better measure for diag-nosis of early AD and for detection of other disease effects than measurement of total hippocampus.Hum Brain Mapp 31:1339–1347, 2010. VC 2010 Wiley-Liss, Inc.
Keywords: hippocampal subfields; Alzheimer’s disease; manual parcellation; MRI
r r
Additional Supporting Information may be found in the onlineversion of this article.
Contract grant sponsor: National Institutes of Health; Contractgrant numbers: RO1 AG010897, P01 AG12435.
*Correspondence to: Michael W. Weiner, Center for Imaging ofNeurodegenerative Diseases, Department of Veterans Affairs(DVA) Medical Center, Clement Street 4150, San Francisco, CA94121. E-mail: [email protected]
Received for publication 28 November 2008; Revised 19 August2009; Accepted 9 October 2009
DOI: 10.1002/hbm.20934Published online 27 April 2010 in Wiley Online Library(wileyonlinelibrary.com).
VC 2010 Wiley-Liss, Inc.

INTRODUCTION
Memory impairment is a characteristic early sign of Alz-heimer’s Disease (AD) and atrophy of the memory relatedmedial temporal structures, particularly the hippocampalformation, is one of its earliest macroscopical hallmarksand has been consistently reported in autopsy and neuroi-maging studies. However, the hippocampus is not a ho-mogeneous structure but consists of several subfields withdistinct histological characteristics: the subiculum, thethree cornu ammonis sectors (CA1-3), and the dentategyrus. Although these subfields are functionally tightlyinterconnected [Duvernoy, 2005], there is evidence for afunctional specialization, i.e. different hippocampal sub-fields are responsible for the processing of differentaspects of the memory content, e.g. CA3 for spatial infor-mation and CA1 for temporal information [Kesner andHopkins, 2006; Rolls and Kesner, 2006]. There is also evi-dence from animal models and histopathological studiesthat different disease processes affect subfields differently,e.g. stress affects predominantly the dentate gyrus whileAD typically shows the most prominent neuron loss inCA1 [Lucassen et al., 2006; West et al., 1994, 2004]. There-fore, measurements of subfield volumes might yield a bet-ter distinction between different disease processesaffecting the hippocampus than measurements of the totalhippocampal volume.
However, measuring hippocampal subfields in vivowith MRI requires that details of the internal structure ofthe hippocampal formation as additional anatomical land-marks for subfield assignment can be depicted. On a clini-cal 1.5-T magnet the sensitivity of the MR signal is usuallytoo low to obtain sufficient resolution to identify individ-ual subfields without the application of sophisticated,often lengthy imaging protocols. Nonetheless, there havebeen several attempts to either directly visualize age andAD-related structural and perfusion changes in hippocam-pal subfields at 1.5 T using specially designed acquisitionschemes [Adachi et al., 2003; Small et al., 2004] or to usesophisticated imaging processing techniques like unfold-ing, surface mapping, or shape deformation to make indi-rect inferences about localized volume loss of thehippocampal formation in AD and other disease processes[Apostolova et al., 2006a,b; Csernansky et al., 2005; Wanget al., 2006]. Recent advancements with high field MRI (3–4 T) resulting in improved gray/white matter contrast dueto the increased signal sensitivity at high fields, additionalmagnetization transfer effects and T1 weighting, allow toacquire excellent anatomical images at sub-millimeter reso-lution within a few minutes [Mueller et al., 2007; Zeinehet al., 2000].
Using such a high-resolution protocol on a 4-T MR mag-net, we developed a manual marking scheme based on theinternal features and other hippocampal landmarks tostudy the effects of healthy aging on different subfields.We found that age-related volume losses of the hippocam-pus were due to volume loss in the CA1 sector [Mueller
et al., 2007]. In this study, the same protocol is used toidentify regions of hippocampal volume loss in subjectsdiagnosed with amnestic mild cognitive impairment (MCI)who have a heightened risk to develop AD and subjectsdiagnosed with AD. The specific aims of this study werethe following: (1) To determine if patterns of volume lossin hippocampal subfields in patients suffering from ADand MCI are different from normal aging. Based on thefindings reported in histopathological studies we expectedto find the most prominent AD related volume losses inCA1 [West et al., 1994]. (2) To test if the measurement ofhippocampal subfields allows for a better discriminationbetween controls and patients suffering from MCI or ADthan measurements of total hippocampal volume loss.
METHODS
Study Population
A total of 96 subjects were evaluated for the study. Fivehad to be excluded (cf. postprocessing) so that a total of 91participated in this study (mean age 70.2 � 7.8, range: 51–86 years, female/male (f/m) 33/58). Fifty-three werehealthy control subjects (mean age: 69.5 � 7.3, f/m: 21/31,mean MMSE: 29.3 � 1.1, range: 25–30) recruited from thecommunity with flyers and advertisements in local news-papers. Eleven subjects of this group were part of a studyabout normal aging reported in a previous publication[Mueller et al., 2007]. Exclusion criteria included anypoorly controlled medical illness and/or use of medicationor recreational drugs affecting brain function or history ofother neurological disease. Normal cognitive functioningwas assessed by a battery of neuropsychological tests(mini mental state examination, California Verbal LearningTest (short form), Rey-Osterrieth complex figure, VerbalFluency, Wechsler Adult Intelligence Score (digit symbol,digit span); emotional state with Geriatric Depression Scaleand functioning in daily living with Functional ActivitiesQuestionnaire). Eighteen subjects (mean age: 69.1 � 9.6,f/m: 6/12, mean MMSE: 21.6 � 5.1, range: 11–29) whohad been diagnosed with AD according to the criteria ofthe National Institute of Neurological and CommunicationDisorders and Stroke/Alzheimer’s Disease and RelatedDisorders Association (NINDS-ADRDA), and 20 subjects(mean age: 73.5 � 7.1, f/m: 6/14, mean MMSE: 28.0 � 2.1,range: 25–30) meeting the criteria for amnestic MCIaccording to Petersen et al. [1999] were referred from col-laborating Memory Clinics (UCSF, VA Medical Center,CPMC San Francisco). The three groups differed regardingMMSE score (Kruskal–Wallis, P < 0.001), with the ADgroup having lower scores than the MCI group and con-trols (Mann–Whitney, P < 0.05) and the MCI group havinglower scores than controls (Mann–Whithey, P < 0.05).Their age was not significantly different (ANOVA,F(2,88) ¼ 2.4, P ¼ 0.09). The study was approved by thecommittees of human research at the University of Califor-nia, San Francisco (UCSF) and VA Medical Center San
r Mueller et al. r
r 1340 r

Francisco. Written informed consent was obtained from allsubjects or their legal representatives according to the Dec-laration of Helsinki.
MRI Acquisition
The following sequences were acquired on a BrukerMedSpec 4T system equipped with a USA instrumentseight-channel array coil: (1) For subfield measurement, ahigh-resolution T2 weighted fast spin echo sequence (TR/TE: 3,500/19 ms, 0.4 mm � 0.4 mm in plane resolution,2 mm slice thickness, 24 interleaved slices without gap, ac-quisition time 5:30 min [Thomas et al., 2004; De Vita et al.,2003], angulated perpendicular to the long axis of the hip-pocampal formation. (2) For measurement of total hippo-campal volume a volumetric T1-weighted gradient echoMRI (MPRAGE) TR/TE/TI ¼ 2,300/3/950 ms, 1.0 mm �1.0 mm � 1.0 mm resolution. (3) For determination of theintracranial volume (ICV), a T2-weighted turbospin echo
sequence, TR/TE: 8,390/70 ms, 0.9 mm � 0.9 mm � 3 mmresolution, 54 slices.
Postprocessing
The method used for subfield marking has beendescribed in detail previously [Mueller et al., 2007]. Tosummarize the procedure briefly: The high-resolutionimages were resampled to obtain a left and a right hippo-campal image to ensure that the hippocampal cross-sectionused for marking was perpendicular to the long axis ofthe hippocampus on each side. The marking schemedepends on anatomical landmarks, particularly on a hypo-intense line which probably represents myelinated fibersin the strata moleculare and lacunosum [Eriksson et al.,2008] (cf. Figs. 1 and 2). Five subjects (3 AD, 1 MCI, and 1control) fulfilling the inclusion criteria and thus selectedfor the project could not be marked because the internalstructure could not be sufficiently visualized and had to
Figure 1.
(a) Parcellation scheme used for manual marking of subfields. As
it is not possible to identify individual hippocampal layers at 4
Tesla, the scheme was based on reliably recognizable anatomical
landmarks even though this resulted in a part of the prosubicu-
lum and subiculum proper being counted towards the CA1
sector. ERC, entorhinal cortex; CA1-2, CA1-CA2 transition
zone (cf methods in text); CA3&DG, CA3 and dentate gyrus.
(b) Histological preparation of hippocampal subfields, arrow,
dentate gyrus. (c) Typical example of hippocampal subfield mark-
ings. No 1 is the most anterior slice, No. 5 the most posterior
slice. No. 3 is referred to in the text as ‘‘starting’’ slice. Red,
ERC; yellow subiculum; beige; CA1 blue; CA1-2 transition; ma-
roon, CA3&DG. [Color figure can be viewed in the online issue,
which is available at wileyonlinelibrary.com.]
r Hippocampal Atrophy Patterns in MCI and AD r
r 1341 r
be excluded. The distance between this hypointense lineand the outer surface of the hippocampus provides a directmeasure of the subfield thickness at this point. Althoughthe sequence used in this study provides superior resolu-tion, it does not allow distinguishing details on the resolu-tion of a histological preparation. Therefore, a set ofarbitrarily defined hippocampal landmarks was used toassign different regions to different subfields. We do notclaim that this subfield assignment actually corresponds tothe histological subfields but merely that it provides a goodand reproducible approximation. The marking started onthe first slice on which the head of the hippocampus wasno longer visible. On this slice, the hippocampal subfields,subiculum, and ERC were marked manually. In addition,the ERC was marked on the two slices anterior to this start-ing slice and the subiculum and the hippocampal subfieldswere marked on the two slices posterior to it. Altogether,the hippocampus is marked on about 1 cm in the anteriorthird of its body, i.e., disease effects in the head or tailregion will be missed. The most medial point of the tempo-ral cortex was chosen as medial border of the ERC, and the
end of the collateral sulcus was chosen as lateral border.The CA1/subiculum border was determined by drawing aline perpendicular to the edge of the subiculum touchingthe medial border of the hippocampus. CA2 is the smallesthippocampal subfield and its visualization requires specialstains even in histological specimens. Furthermore, thereare no macroscopic hippocampal landmarks for CA2 whichhelp to identify it in the high-resolution image. Therefore,the CA1/CA2 border was determined by dividing the linealong the longest diameter of the hippocampus by two anddrawing a line perpendicular to this line. A region sup-posed to represent mainly CA2 was marked in a square-like manner, i.e., its height at the CA1/CA2 boundary alsodetermined its length while its overall shape was deter-mined by the course of the outer boundary of the hippo-campus and the hypointense line. Pathological processesaffecting CA2 will result in a thinning of the subfield in alldirections and marking CA2 in a square-like mannershould capture this phenomenon. However, the volume ofthis label is relatively small thus rendering it sensitive tosmall marking inaccuracies (cf. Table I). Although the
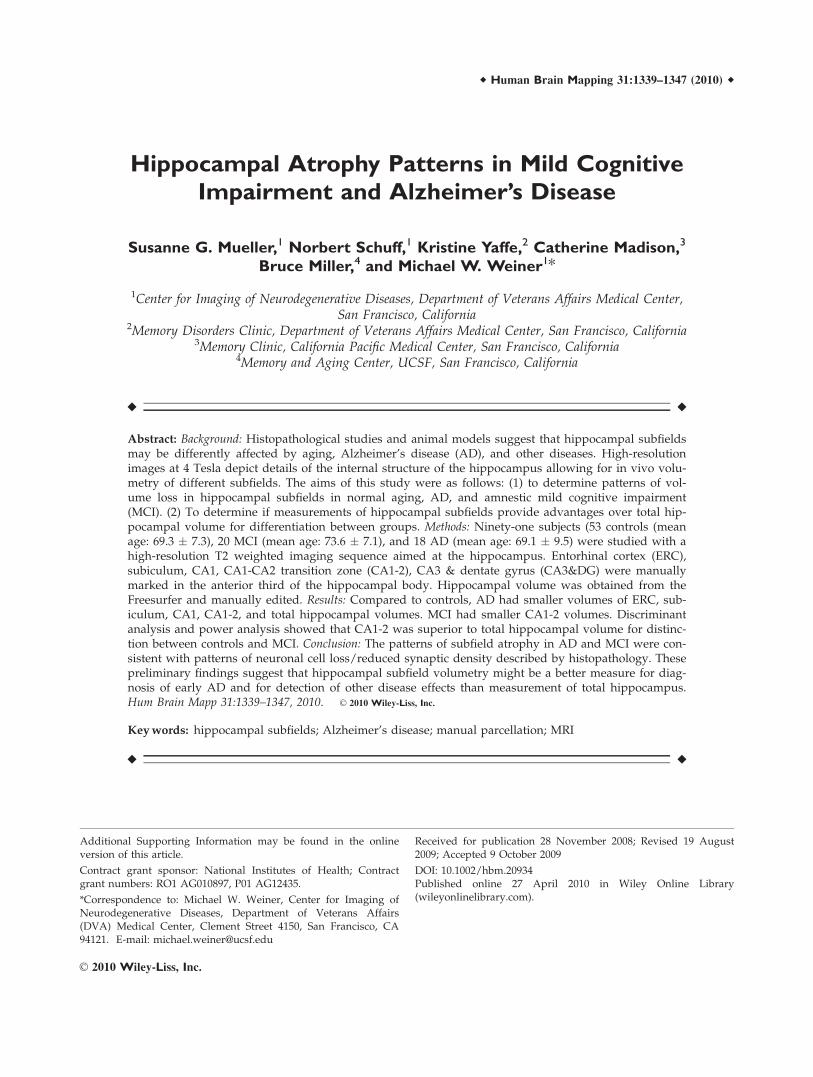
Figure 2.
(a) Hippocampal formation of a 78-year-old cognitively nonim-
paired man, MMSE 30. The thickness of the dorsal aspect of
CA1/CA2 is similar to the thickness of the ventral aspect of
CA1. (b) Hippocampal formation of a 56 years old female
patient with AD, MMSE 12. The hypointense line in AD subjects
is less intense than in the control subject but still clearly dis-
cernible. (c) Hippocampal formation of a 58-year-old male
patient with AD, MMSE 24. (d) Hippocampal formation of a 71-
year-old female MCI patient, MMSE 30. The thickness of the
dorsal aspect of CA1/CA2 is reduced compared to the thick-
ness of the ventral aspect of CA1.
r Mueller et al. r
r 1342 r
position of CA2 showed good correspondence with thelocalization of CA2 in histological preparations, its positionrelatively to the fimbriae, which can be used as a macro-scopic landmark of CA3 in this section of the hippocampus(cf Fig. 1b), varies slightly depending on the shape of thehippocampus. Furthermore, the volume of this subfield isinfluenced by the width of the dorsal CA1 and it is likely tohave some overlap with the dorsomedial part of CA1.Because of this, we expect that volume changes in this sec-tor can result from changes in both subfields. To reflect this‘‘contamination’’ by CA1, the region was named CA1-2transition zone (CA1-2 transition) rather than CA2. The re-mainder of the hippocampal formation consisting of CA3and dentate gyrus was marked as one region (CA3&DG)because there were no reliable landmarks to distinguishbetween these structures. All subfield markings were doneby a single rater blinded to the diagnosis using rview(http://www.colin-studholme.net/software/software.html)which allows the display of all three orientations simultane-ously and thus increases the marking accuracy (as evi-denced by a higher ICC compared to Mueller et al., 2007 forwhich EditBrain was used for subfield marking). Five MCIand five AD and 10 control subjects were randomly selectedfrom the study population and marked twice to establishtest–retest reliability in subjects with diseased hippocampi.Intraclass correlation coefficients were �0.9 for all subfields,cf. Table I. The volume of the total hippocampus was deter-mined from the T1 image using the hippocampal masksprovided by the FreeSurfer subcortical parcellation routine[Fischl et al., 2002]. All maps were visually checked for ac-curacy by different, specially trained raters who wereblinded to the diagnosis and manually corrected by overlay-ing the label generated in FreeSurfer onto the T1 image inrview. This procedure generated a map of comparable accu-racy as obtained by a manual marking scheme (ICC formanual correction of the Freesurfer labels: 0.9). The ICV wasdetermined using the BET program (FMRIB Image AnalysisGroup, Oxford University, www.fmrib.ox.ac.uk/fsl). Theresulting skull stripped imaged was checked by overlayingit onto the image with skull to ensure that all extracranialand skull structures were removed and all intracranialstructures fully preserved.
Statistical Analysis
For statistical analysis, left and right volumes of eachsubject were combined. Multiple linear regression analyseswith subfield, respectively hippocampal volume as de-pendent and age, gender, group (control, MCI, AD), andICV as independent variables were used to identify vol-umes with significant disease group effects. Significantgroup effects were then further explored using ANOVAtests and Tukey post-hoc analyses (P < 0.05). Z-scoreswere calculated to provide a measure of the severity ofvolume loss in each subfield. To identify those subfieldvolumes which distinguished best between disease groups,a stepwise linear discriminant analysis (forward, probabil-ity to enter P < 0.05) with disease group as dependentand subfield and hippocampal volume as independentvariables was performed; age and ICV were forced to bein the model. The discriminant analysis was done for eachcomparison separately, i.e. controls vs. MCI, controls vs.AD, and AD vs. MCI. This analysis was restricted to sub-fields which had shown a significant group effect in themultiple regression analysis. Finally, using the error esti-mates from the ANOVA tests, the statistical power todetect a difference at a significance level alpha ¼ 0.05between controls and AD and controls and MCI for eachsubfield and total hippocampal volume were calculated.All statistical analyses were done in JMP7 (SAS Institute).
RESULTS
Pattern of Subfield Volume Loss
Multiple regression analysis showed significant effectsfor disease group for ERC (P ¼ 0.004), subiculum (P ¼0.003), CA1 (P ¼ 0.0001), CA1-2 transition (P < 0.0001),and hippocampal volume (P ¼ 0.0005) but not forCA3&DG. There was a significant negative effect of age onCA1 (P ¼ 0.0067) consistent with the findings of our previ-ous study in normal aging [Mueller et al., 2007]. The ageeffect on CA1 persisted when subjects who were part bothstudies were excluded from the analysis. Post-hoc analyses(cf Tables II and III) showed that compared to controls AD
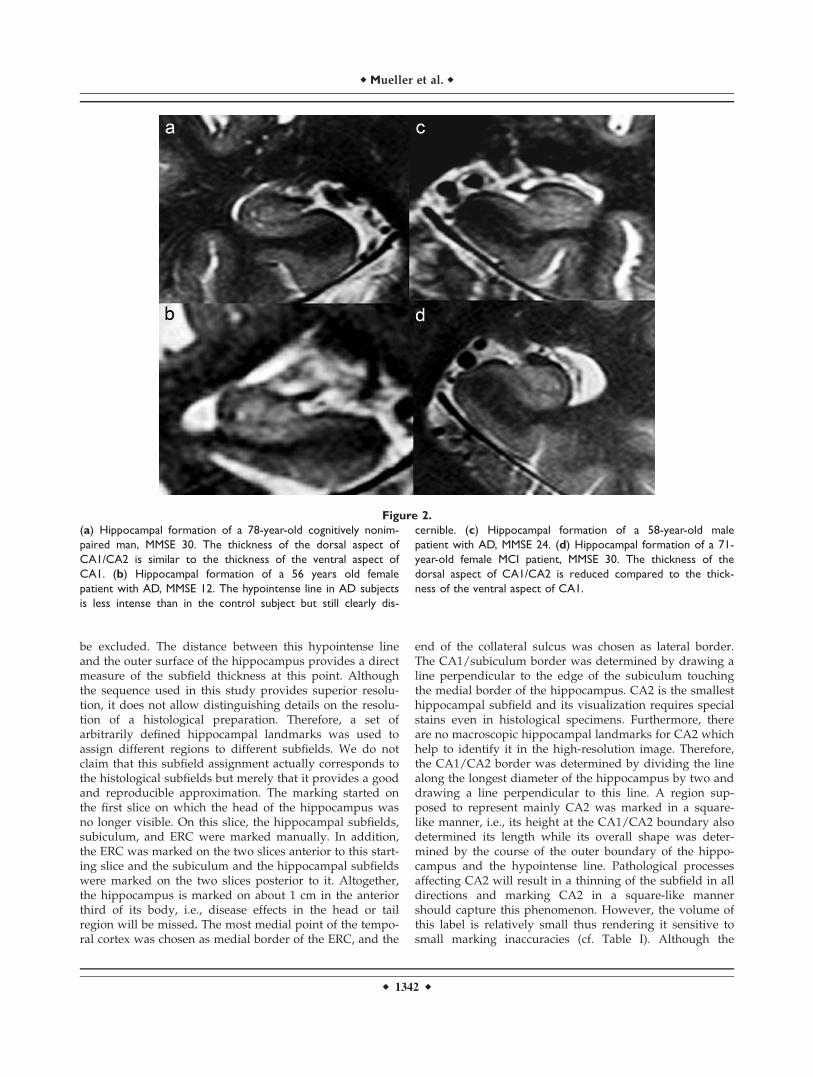
TABLE I. Subfield measurement reliability in elderly controls
and impaired subjects (AD and MCI)
Subfield
Controls (N ¼ 10)AD and MCI
(N ¼ 10; 5 AD, 5 MCI)
ICC% Mean volume
difference and (range) ICC% Mean volume
difference and (range)
ERC 0.95 5.0 (1.0–10.43) 0.98 4.3 (0–8.3)Subiculum 0.95 5.0 (0–14.3) 0.97 1.8 (0–6.0)CA1 0.96 3.5 (1–8.8) 0.97 2.2 (0–4.0)CA1-2 Transition 0.90 4.8 (0–14.7) 0.90 1.3 (0–12.5)CA3 & DG 0.96 4.5 (0–7.6) 0.97 2.5 (0–9.2)
r Hippocampal Atrophy Patterns in MCI and AD r
r 1343 r
had significantly reduced ERC, subiculum, CA1, CA1-2transition, and hippocampal volumes, whereas CA3&DGvolumes were not different. CA1 had the smallest z-scoreindicating that this was the subfield with the most pro-nounced volume loss. In contrast, the atrophy was morerestricted in MCI who compared to controls showed sig-nificant volume losses in CA1-2 transition but not in ERC,CA1, subiculum, CA3&DG, or total hippocampal volume.There were no significant differences between AD andMCI and the volumes of the MCI group tended to be in-between the volumes of controls and AD with the excep-tion of the CA1-2 transition volume which was close to thevolume measured in AD.
Discriminant and Power Analyses
Stepwise linear discriminant analysis showed that CA1and CA1-2 transition distinguished best between AD andcontrols (Wilks’ Lambda 0.72, P ¼ 0.0002, % misclassified:22.5%, area under the curve (AUC): 0.84, sensitivity/speci-ficity: 0.83/0.75). The volumes of ERC, subiculum, andtotal hippocampal volume did not fulfill the criteria to
enter the stepwise discriminant analysis despite being sig-nificantly smaller in the direct comparison AD vs. controls.CA1-2 transition alone discriminated best between MCIand controls (Wilks’ Lambda 0.75, P ¼ 0.0001, cf. Table IV)and subiculum best between AD and MCI (Wilks’ Lambda0.76, P ¼ 0.0225, % misclassified: 26.3%, AUC: 0.78; sensi-tivity/specificity: 0.67/0.8). The results of the discriminantanalysis for the other subfields and total hippocampalvolume and the results of the power analysis are listed inTable IV.
DISCUSSION
There were two main findings of this study: (1) Hippo-campal volume loss in AD is not diffuse but affects somesubfields more than others. In MCI the volume loss ismost prominent in CA1-2 transition, in AD CA1, ERC,subiculum, and total hippocampal volume are affected aswell while CA3&DG is spared. (2) CA1-2 transition wasthe region which distinguished best between MCI andcontrols and had the highest statistical power to detect dif-ferences between these two groups. CA1-2 transition andCA1 discriminated best between AD and controls but theirpower to distinguish between the two was not differentfrom the power of total hippocampal volume. These
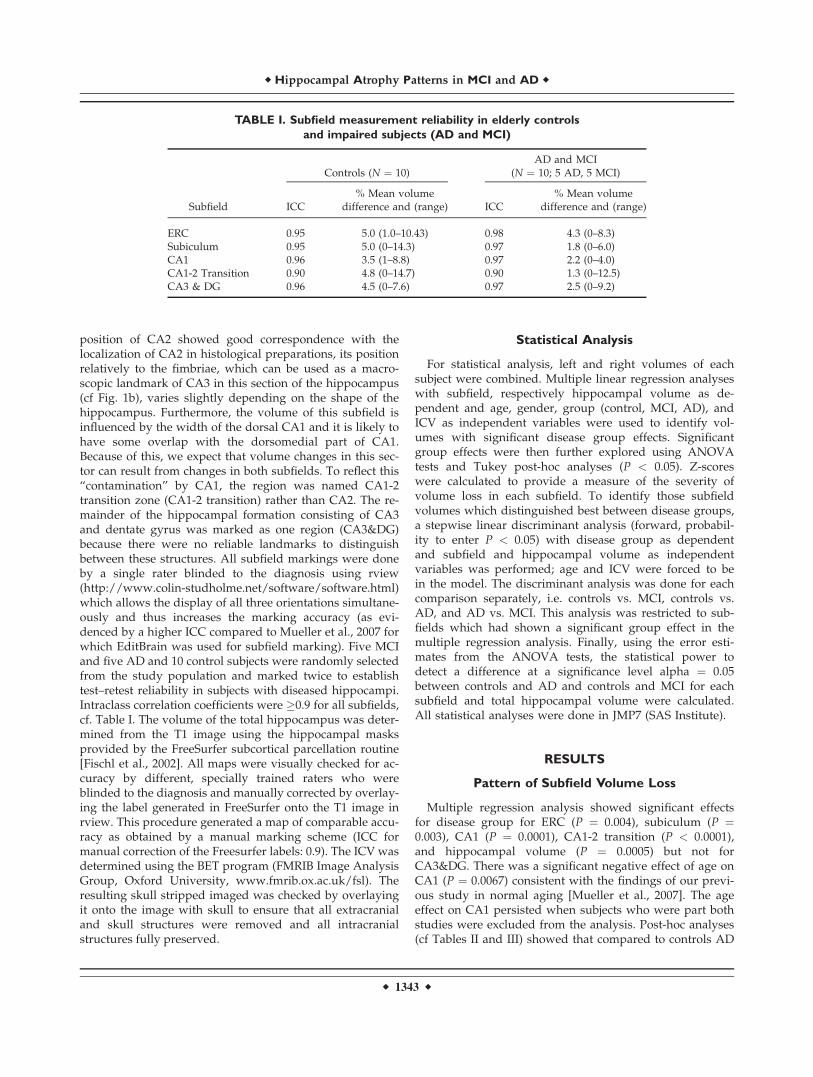
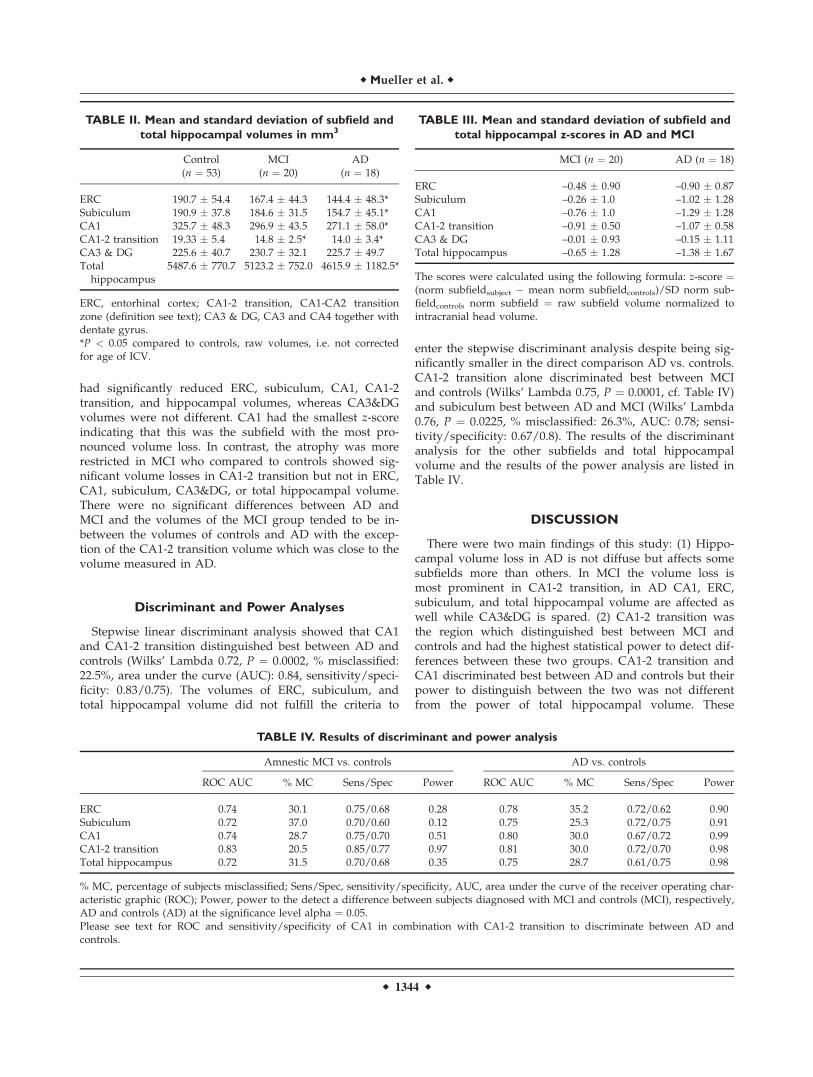
TABLE II. Mean and standard deviation of subfield and
total hippocampal volumes in mm3
Control(n ¼ 53)
MCI(n ¼ 20)
AD(n ¼ 18)
ERC 190.7 � 54.4 167.4 � 44.3 144.4 � 48.3*Subiculum 190.9 � 37.8 184.6 � 31.5 154.7 � 45.1*CA1 325.7 � 48.3 296.9 � 43.5 271.1 � 58.0*CA1-2 transition 19.33 � 5.4 14.8 � 2.5* 14.0 � 3.4*CA3 & DG 225.6 � 40.7 230.7 � 32.1 225.7 � 49.7Total
hippocampus5487.6 � 770.7 5123.2 � 752.0 4615.9 � 1182.5*
ERC, entorhinal cortex; CA1-2 transition, CA1-CA2 transitionzone (definition see text); CA3 & DG, CA3 and CA4 together withdentate gyrus.*P < 0.05 compared to controls, raw volumes, i.e. not correctedfor age of ICV.
TABLE III. Mean and standard deviation of subfield and
total hippocampal z-scores in AD and MCI
MCI (n ¼ 20) AD (n ¼ 18)
ERC –0.48 � 0.90 –0.90 � 0.87Subiculum –0.26 � 1.0 –1.02 � 1.28CA1 –0.76 � 1.0 –1.29 � 1.28CA1-2 transition –0.91 � 0.50 –1.07 � 0.58CA3 & DG –0.01 � 0.93 –0.15 � 1.11Total hippocampus –0.65 � 1.28 –1.38 � 1.67
The scores were calculated using the following formula: z-score ¼(norm subfieldsubject � mean norm subfieldcontrols)/SD norm sub-fieldcontrols norm subfield ¼ raw subfield volume normalized tointracranial head volume.
TABLE IV. Results of discriminant and power analysis
Amnestic MCI vs. controls AD vs. controls
ROC AUC % MC Sens/Spec Power ROC AUC % MC Sens/Spec Power
ERC 0.74 30.1 0.75/0.68 0.28 0.78 35.2 0.72/0.62 0.90Subiculum 0.72 37.0 0.70/0.60 0.12 0.75 25.3 0.72/0.75 0.91CA1 0.74 28.7 0.75/0.70 0.51 0.80 30.0 0.67/0.72 0.99CA1-2 transition 0.83 20.5 0.85/0.77 0.97 0.81 30.0 0.72/0.70 0.98Total hippocampus 0.72 31.5 0.70/0.68 0.35 0.75 28.7 0.61/0.75 0.98
% MC, percentage of subjects misclassified; Sens/Spec, sensitivity/specificity, AUC, area under the curve of the receiver operating char-acteristic graphic (ROC); Power, power to the detect a difference between subjects diagnosed with MCI and controls (MCI), respectively,AD and controls (AD) at the significance level alpha ¼ 0.05.Please see text for ROC and sensitivity/specificity of CA1 in combination with CA1-2 transition to discriminate between AD andcontrols.
r Mueller et al. r
r 1344 r

findings indicate that subfield measurements might be amore sensitive way to detect MCI than whole hippocam-pus measurements but do not provide an advantage overtotal hippocampal volume for the detection of AD.
The first finding of this study was that hippocampal vol-ume loss in the AD disease process is regionally selective.In AD, the most prominent volume losses were found inCA1-2 transition, CA1, subiculum, and ERC, while in MCIonly CA1-2 transition was significantly affected. Althoughthere is general agreement that CA1 is severely affected inAD, there is some controversy if CA2 is affected as well[West et al., 1994; Zarow et al., 2005; Bobinski et al., 1998;Fukutani et al., 1995, 2000]. Because of this and consider-ing the limitations of the CA1-2 transition label (cf. meth-ods section), we assume that the volume loss in thisregion is driven by volume loss in the dorsal aspect ofCA1 rather than in CA2 itself. This suggests that the dor-sal CA1 sector is relatively early affected by the AD dis-ease process when the volume loss in ventral part is stillrelatively mild. In the AD stage, the atrophic changes inCA1 become more pronounced and the disease alsospreads to the subiculum that results in a significant lossof total hippocampal volume. This distribution of hippo-campal volume loss in the AD disease process is differentfrom the distribution found in normal aging which was re-stricted to CA1 and did not affect CA1-2 transition andsubiculum [Mueller et al., 2007]. The pattern of hippocam-pal volume loss is also in good agreement with findings ofneuroimaging studies at 1.5 T using surface mapping andshape analysis to make inferences about pattern of hippo-campal subfield volume loss in AD [Apostolova et al.,2006a,b; Csernansky et al., 2005; Wang et al., 2006].
More importantly though, the atrophy pattern is in goodagreement with histopathological studies that consistentlyshow the most prominent neuronal loss or loss of synapticdensity in CA1, subiculum and ERC in subjects diagnosedwith AD and milder neuron loss mostly restricted to CA1in subjects suffering from MCI. For example, Fukutaniet al. [1995] analyzed the relationship between neurofibril-lary tangles (NFT) and unaffected neurons in CA1-4, sub-iculum, and ERC in six controls and six AD and foundsignificantly increased numbers of NFT in all subfieldsand decreased numbers of unaffected neurons in CA1,subiculum, and ERC in AD compared to controls. Rossleret al. [2002] studied the relationship between Braak stageand neuron loss in hippocampal subfields in 28 subjects.Compared to stage I, neuron count in CA1 was reducedby 33% in stage IV and by 51% in stage V. The subiculumonly became affected in stage V (22% neuron loss). Westet al. [1994] assessed neuron counts in the dentate gyrus,CA2/3 and CA1 in seven AD and 19 healthy controls andfound the most distinctive cell loss in CA1 (�68%) andless severe losses in subiculum (�47%) and hilus (�25%).The fact that the patterns of regional volume loss found inthis neuroimaging study closely resemble the patterns ofneuron loss and reduction of synaptic density described inthose neuropathological studies, suggests that these volu-
metric measurements reflect those histopathologicalchanges.
In contrast to CA1, CA1-2 transition, and subiculum,CA3&DG volumes were preserved in MCI and AD. Histo-pathological studies describe a mild to moderate neuronloss in the dentate gyrus in AD [Simic et al., 1997; Scheffet al., 2006; West et al., 1994]. The dentate gyrus (DG) ispart of the polysynaptic intrahippocampal pathway andreceives direct excitatory input from the ERC [Duvernoy,2005]. The ERC is usually early affected in the AD processand showed also in this study a significant volume loss inAD subjects. Therefore, mild atrophic changes in the DGdue to deafferentation would have been expected at leastin AD. There are two possible explanations why suchchanges were not found in this study. The most importantreason is probably that the DG had to be marked togetherwith CA3. Since CA3 is relatively well preserved in AD, itis possible that it overshadowed subtle effects in DG. Fur-thermore, although fulfilling the criteria for AD, most ofthe AD subjects in this study suffered from mild AD(mean MMSE 21.6) while subjects in autopsy studies tendto suffer from more advanced AD with more pronouncedatrophy,
The second finding was that CA1-2 transition volumeloss was shown to be a very good measure to distinguishbetween MCI and controls and together with CA1 betweenAD and controls. In contrast, total hippocampal volume,which is commonly considered to be the most robuststructural imaging marker for AD and MCI, had a compa-ratively low sensitivity in this study (cf. Table IV) com-pared to the sensitivity values for the hippocampusreported in the literature which are between 0.7 and 0.85[Coliot et al., 2008; Kantarci et al. 2002]. This was particu-larly obvious in AD in whom the sensitivity of the totalhippocampal volume was lower than in MCI. There areseveral possible explanations for this finding. One is therelatively small sample size of AD subjects in this studycompared to other studies. Furthermore, the range ofMMSE scores in the AD group is relatively large (11–29)indicating that the AD group is heterogeneous regardingdisease severity. Finally, the total hippocampal volumehas a larger standard deviation in AD than in the twoother groups which reduces its ability to correctly classifyAD subjects. Seen in the context of the larger range ofMMSE scores in AD, the larger standard deviation of thetotal hippocampal volume is in good agreement with ADgroup being heterogeneous and containing very mild andmore advanced cases. CA1 and CA1-2 transition volumesare less affected by this heterogeneity because both areatrophied in the early and late stages of the disease whilethe total hippocampal volume contains additional sub-fields which are not (CA3&DG) or only mildly (Sub)affected in the early stages but develop marked atrophy inthe later stages [Rossler et al., 2002].
Those MCI who were misidentified by CA1-2 transitionvolume loss tended to be younger and less impairedthan their correctly identified counterparts (misclassified
r Hippocampal Atrophy Patterns in MCI and AD r
r 1345 r
MCI vs. correctly classified MCI: mean age 68.3 vs. 74.7years, mean MMSE 29.0 vs. 27.8). This could suggest thatthey were in an earlier stage of AD than the correctlyidentified MCI. AD who where misclassified by CA1 andCA1-2 transition volumes were also younger but similarlyimpaired compared to the correctly identified AD (misclas-sified AD vs. correctly classified AD: mean age: 66.7 vs.69.6 years, mean MMSE 21.5 vs. 22.0). This could suggestan earlier onset and thus eventually an atypical presenta-tion of AD or even a different form of dementia and fur-ther supports the observation that the AD group wasmore heterogeneous. However, CA1-2 transition volumeloss also incorrectly classified 23% of the controls as MCIand CA1 and CA1-2 transition classified 25% of the con-trols as AD. Longitudinal studies correlating imaging find-ings with cognitive changes over time will be necessary todetermine if such controls are at an increased risk to de-velop MCI or if they represent true false positive cases.
Although AD had significantly smaller total hippocam-pal volumes than controls, total hippocampal volume didnot reach significance in the stepwise discriminant analysisafter CA1 and CA1-2 transition were included. The samewas true for the ERC in MCI and controls although ERCand hippocampus have been shown to be a good measureto discriminate between these groups by other studies[Devanand et al., 2007; Pennanen et al., 2004; Xu et al.,2000]. One reason for the discrepancy regarding ERCmight be that we employed a different marking strategy,i.e. ERC in our study was marked on a fixed number ofslices while those previous studies determined the numberof slices for ERC marking on anatomical landmarks.Therefore, in our marking strategy ERC volume loss ismostly determined by ERC gray matter thinning, whileprevious studies measured ERC volume loss as a combina-tion of ERC gray matter thinning and overall volume lossof medial temporal structures (lower number of slices onwhich ERC is marked). Another reason, which alsoexplains the discrepancy regarding the hippocampus,might be that the sample sizes of AD and MCI patients inthese studies were larger than in our study and thus thepower to detect differences between groups using thesemeasures was greater. In our sample the power to detect asignificant difference between controls and AD was 0.98for total hippocampal volume compared to 0.99 for CA1and CA1-2 transition, i.e. was practically the same for allthree measures but provided CA1 and CA1-2 transition asmall advantage over the hippocampus to enter in thestepwise discriminant analysis. This was different for sub-jects suffering from MCI and controls. The power to detecta difference between those two groups was 0.35 for totalhippocampus and 0.28 for ERC but 0.97 for CA1-2 transi-tion. These findings suggest that subfield measurementsmight be superior to total hippocampal volumetry for thedetection of preclinical AD/MCI but provide no advantageover total hippocampal volume in AD.
This study has limitations: (1) The sample size was smallalthough significant findings were obtained. It is necessary
to validate the findings in a larger, separate study. On thebasis of the current findings, it seems likely that in a largersample a combination of subfields, e.g. CA1-2 transitionand CA1 or CA1-2 transition and ERC will be more power-ful to distinguish MCI from controls than CA1-2 transitionalone. (2) The study was cross-sectional and we cannotexclude that some of the misclassified controls were in theearly stages of AD or some MCI might remain stable or notprogress to AD but other dementia types. Follow-up stud-ies are planned. (3) The patients were referred from differ-ent memory clinics which although adhering to the samegeneral concept for the diagnosis of MCI and AD (clinicaland neuropsychologic evaluation, consensus conferencewithin clinic) use slightly different evaluation procedures.This might have added to the diversity of the MCI and ADgroups. (4) Hippocampal subfields were only marked in arelatively small region of the anterior hippocampus. There-fore, we cannot exclude that we missed effects with a re-gional preference. (5) Although the subfields markingstrategy used in this article shows a good correspondencewith hippocampal subfields in histopathological samples, itwill be necessary to validate the subfield marking strategyin a direct histopathology, imaging correlation study. (6)This technique for subfield volumetry requires a high reso-lution image which reliably depicts details of the internalstructure of the hippocampus, i.e. an image of good quality.This might limit the applicability of this method to severelycognitively impaired and hence noncompliant subjects orsubjects suffering from diseases which destroy the internalstructure of the hippocampus.
In conclusion, these initial findings suggest that normalaging and AD even in its earliest stages are associatedwith a distinct pattern of atrophy in the hippocampus, i.e.aging with volume loss in CA1 and MCI with volume lossin CA1-2 transition. Volume loss in CA1-2 transition wassuperior to total hippocampal volume for discriminationbetween subjects diagnosed with MCI and controls. There-fore, we conclude that subfield measurements might be amore sensitive way to detect MCI and early AD thanmeasurements of the whole hippocampus.
REFERENCES
Adachi M, Kawakatsu S, Hosoya T, Otani K, Honma T, Shibata A,Sugai Y (2003): Morphology of the inner structure of the hip-pocampal formation in Alzheimer’s Disease. Am J Neuroradiol24:1575–1581.
Apostolova LG, Dutton RA, Dinov ID, Hayashi KM, Toga AW,Cummings JL, Thompson PM (2006): Conversion of mild cog-nitive impairment to Alzheimer Disease predicted by hippo-campal atrophy maps. Arch Neurol 64:693–699.
Apostolova LG, Dinov ID, Dutton RA, Hayashi KM, Toga AW,Cummings JL, Thompson PM (2006): 3D comparison of hippo-campal atrophy in amnestic mild cognitive impairment andAlzheimer’s disease. Brain 129:2867–2873.
Bobinski M, de Leon MJ, Tarnawski M, Wegiel J, Bobinski M,Reisberg B, Miller DC, Wisniewski HM (1998): Neuronal andvolume loss in CA1 of the hippocampal formation uniquely
r Mueller et al. r
r 1346 r

predicst duration and severity of Alzheimer’s disease. BrainRes 805:267–269.
Csernansky JG, Wang L, Sank J, Miller JP, Gado M, McKeel D,Miller MI, Morris JC (2005): Preclinical detection of Alzhei-mer’s disease: Hippocampal shape and volume predict demen-tia onset in the elderly. Neuroimage 25:783–792.
Devanand DP, Pradhaban G, Liu X, Khandji A, De Santi S, SequalS, Rusinek H, Pelton GH, Honig LS, Mayeux R, Stern Y, TabertMH, de Leon MJ (2007): Hippocampal and entorhinal atrophyin mild cognitive impairment: Prediction of Alzheimer disease.Neurology 68:828–836.
De Vita E, Thomas DL, Roberts S, Parkes HG, Turner R, KincheshP, Shmueli K, Yousry TA, Ordidge RJ (2003): High resolutionMRI of the brain at 4.7 Tesla using fast spin echo imaging. Br JRadiol 76:631–637.
Duvernoy HM (2005): Functional Anatomy, Vascularization andSerial Sections with MRI, 3rd ed. Berlin: Springer Verlag.
Coliot O, Chetelat G, Chupin M, Desgranges B, Magnin B, BenaliH, Dubois B, Garnero L, Eustache F, Lehericy S (2008): Dis-crimination between Alzheimer’s disease, mild cognitiveimpairment, and normal aging by using automated segmenta-tion of the hippocampus. Radiology 248:194–201.
Eriksson SH, Thom M, Batlett PA, Symms MR, McEvoy AW, Siso-diya SM, Duncan JS (2008): Propeller MRI visualizes detailedpathology of hippocampal sclerosis. Epilepsia 49:33–39.
Fischl B, Salat DH, Busa E, Albert M, Dieterich M, Halsegrove C,van der Kouwe A, Killiany R, Kennedy D, Klavenes S, Mon-tillo A, Makris N, Rosen B, Dale AM (2002): Whole brain seg-mentation: automated labeling of neuroanatomical structuresin the human brain. Neuron 33:341–355.
Fukutani Y, Kobayashi K, Nakamura I, Watanabe K, Isaki K, CairnsNJ (1995): Neurons, intracellular and extracellular neurofibril-lary tangles in subdivisions of the hippocampal cortex in normalageing and Alzheimer’s disease. Neurosci Lett 200:57–60.
Fukutani Y, Cairns NJ, Shiozawa M, Sasaki K, Sudo S, Isaki K,Lantos PL (2000): Neuronal loss and neurofirbrillary degenera-tion in the hippocampal cortex in late-onset sporadic Alzhei-mer’s disease. Psych Clin Neurosci 54:523–529.
Kantarci K, Xu Y, Shiung MM, O’Brien PC, Cha RH, Smith GE,Ivnik RJ, Boeve BF, Edland SD, Kokmen E, Tangalos EG,Petersen RC, Jack CR (2002): Comparative diagnostic utility ofdifferent MR modalities in mild cognitive impairment and Alz-heimer’s disease. Dement Geriatr Cogn Disord 14:198–207.
Kesner RP, Hopkins RO (2006): Mnemonic functions of the hippo-campus: A comparison between animals and humans. BiolPsychol 73:3–18.
Lucassen PJ, Heine VM, Muller MB, van der Beek EM, WiegantVM, De Kloet ER, Joels M, Fuchs E, Swaab DF, Czeh B (2006):Stress, depression and hippocampal apoptosis. CNS NeurolDisord Drug Targets 5:531–546.
Mueller SG, Stables L, Du AT, Schuff N, Truran D, Cashdollar N,Weiner MW (2007): Measurements of hippocampal subfields
and age related changes with high resolution MRI at 4T. Neu-robiol Aging 28:719–726.
Pennanen C, Kivipelto M, Tuomainen S, Hartikainen P, Haenni-nen T, Laakso MP, Hallikainen M, Vanhanen M, Nissinen A,Helkala EL, Vainio P, Vanninen R, Partanen K, Soininen H(2004): Hippocampus and entorhinal cortex in mild cognitiveimpairment and early AD. Neurobiol Aging 25:303–310.
Petersen RC, Smith GE, Waring SC, Ivnik RJ, Tangalos EG, Kok-men E (1999): Mild cognitive impairment, clinical characteriza-tion and outcome. Arch Neurol 56:303–308.
Rolls ET, Kesner RP (2006): A computational theory of hippocam-pal function and empirical tests of the theory. Prog Neurobiol79:1–48.
Rossler M, Zarski M, Bohl J, Ohm TG (2002): Stage dependentand sector specific neuronal loss in hippocampus during Alz-heimer’s disease. Acta Neuropathol 103:363–369.
Simic G, Kostovic I, Winblad B, Bogdanovic N (1997): Volumeand number of neurons of the human hippocampal formationin normal aging and Alzheimer’s disease. J Comp Neurol379:482–494.
Small SA, Chawla MK, Buoncore M, Rapp PR, Barnes CA (2004):Imaging correlates of brain function in monkeys and rats iso-lates a hippocampal subregion differentially vulnerable toaging. Proc Natl Acad Sci USA 101:7181–7186.
Scheff SW, Price DA, Schmitt FA, Musfson EJ (2006): Hippocam-pal synaptic loss in early Alzheimer’s disease and mild cogni-tive impairment. Neurobiol Aging 27:1372–1384.
Thomas DL, De Vita E, Roberts S, Turner R, Yousry TA, OrdidgeRJ (2004): High resolution fast spin echo imaging of the humanbrain at 4.7T: Implementation and sequence characteristics.Magn Reson Med 51:1254–1264.
Wang L, Miller JP, Gado MH, McKeel DW, Rothermich M, MillerMI, Morris JC, Csernansky JG (2006): Abnromalities of hippo-campal surface structure in very mild dementia of the Alzhei-mer type. Neuroimage 30:52–60.
West MJ, Coleman PD, Flood DG, Troncoso JC (1994): Differencesin the pattern of hippocampal neuronal loss in normal ageingand Alzheimer’s disease. Lancet 344:769–772.
West MJ, Kawas CH, Stewart WF, Rudiw GL, Troncoso JC (2004):Hippocampal neurons in pre-clinical Alzheimer’s disease.Neurobiol Aging 25:1205–1212.
Xu Y, Jack CR, O’Brien PC, Kokmen E, Smith GE, Ivnik RJ, BoeveBF, Tangalos RG, Petersen RC (2000): Usefulness of MRI meas-ures of entorhinal cortex versus hippocampus in AD. Neurol-ogy 54:1760–1767.
Zarow C, Vinters HV, Ellis WG, Weiner MW, Mungas D, WhiteL, Chui HC (2005): Correlates of hippocampal neuron numberin Alzheimer’s disease and ischemic vascular dementia. AnnNeurol 57:896–903.
Zeineh MM, Engel SA, Bookheimer SY (2000): Application of cort-ical unfolding techniques to functional MRI of the human hip-pocampal region. Neuroimage 11:668–683.
r Hippocampal Atrophy Patterns in MCI and AD r
r 1347 r