highways & transportation...
TRANSCRIPT
The Islamic University of Gaza
Faculty of Engineering
Civil Engineering Dept.
Highways & Transportation I
(ECIV 4333)
Instructors: Dr. Y. R. Sarraj
CHAPTER 3
CHARACTERISTICS OF:
THE DRIVER,
THE PEDESTRIAN,
THE VEHICLE, AND
THE ROAD
Highways & Transportation I
ECIV 4333
TEXT BOOK
CHAPTER THREE
PAGE 57
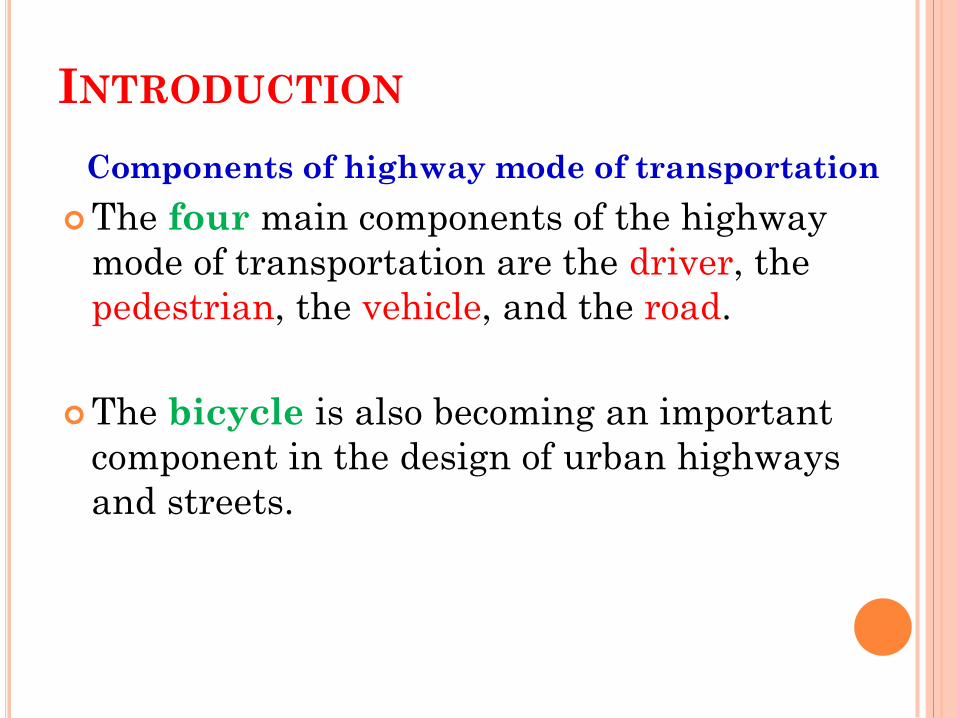
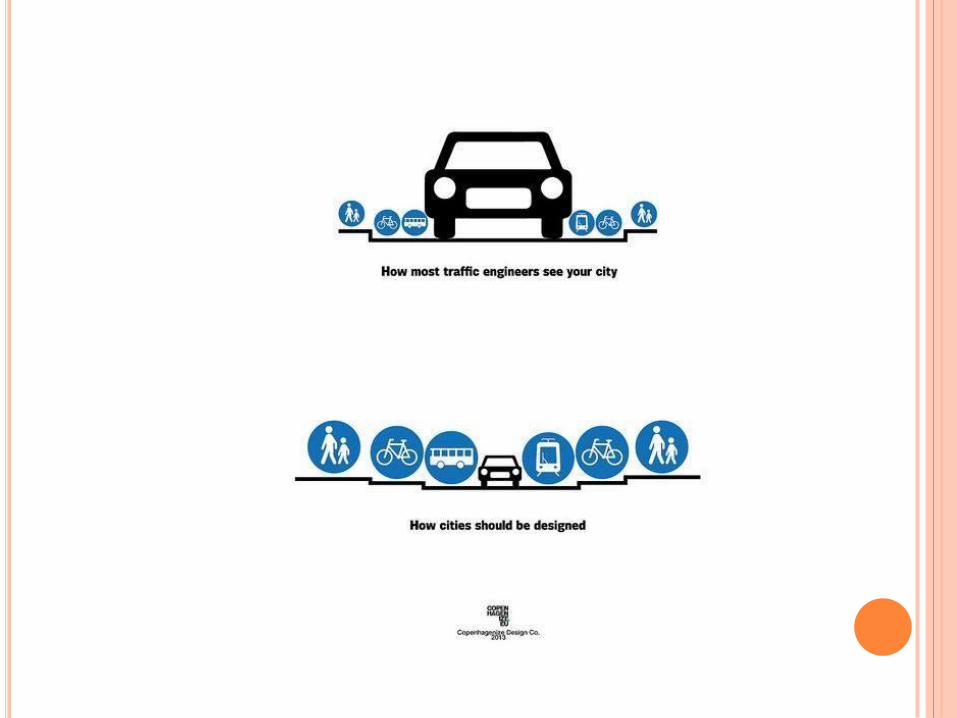
INTRODUCTION
Components of highway mode of transportation
The four main components of the highway
mode of transportation are the driver, the
pedestrian, the vehicle, and the road.
The bicycle is also becoming an important
component in the design of urban highways
and streets.
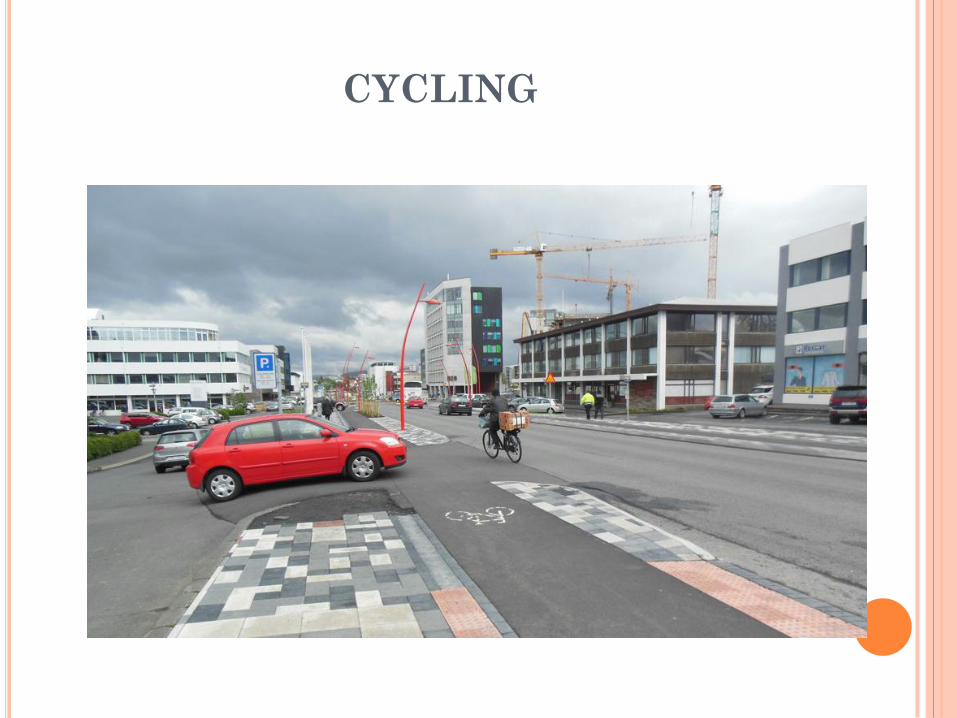
CYCLING
INTRODUCTION
Importance of knowledge of characteristics
To provide efficient and safe highway transportation,
a knowledge of the characteristics and limitations of
each of these components is essential.
It is also important to be aware of the
interrelationships that exist among these
components in order to determine the effects, if any,
that they have on each other.
Their characteristics are also of primary importance
when traffic engineering measures such as traffic
control devices are to be used in the highway mode.
INTRODUCTION
Importance of knowledge of characteristics
The road therefore must be designed to:
accommodate a wide range of vehicle characteristics
allow use by drivers and pedestrians with a wide range of physical and psychological characteristics.
This chapter discusses the relevant characteristics of the main components of the highway mode and demonstrates their importance and their use in the design and operation of highway facilities.
3.1 DRIVER CHARACTERISTICS
SOURCE: GARBER, PAGE 58
3.1 DRIVER CHARACTERISTICS
Introduction
One problem that faces traffic and transportation engineers is:
the varying skills and perceptual abilities of drivers on the highway,
demonstrated by a wide range of abilities to
hear, see, evaluate, and react to in formation.
Studies have shown that these abilities may also vary in an individual under different conditions, such as:
the influence of alcohol, fatigue, and the time of day.
3.1 DRIVER CHARACTERISTICS
Introduction
Therefore, it is important that criteria used for design purposes be compatible with the capabilities and limitations of most drivers on the highway.
The use of an average value, such as mean reaction time, may not be adequate for a large number of drivers.
Both the 85th percentile and the 95th percentile have been used to select design criteria; in general, the higher the chosen percentile, the wider the range covered.
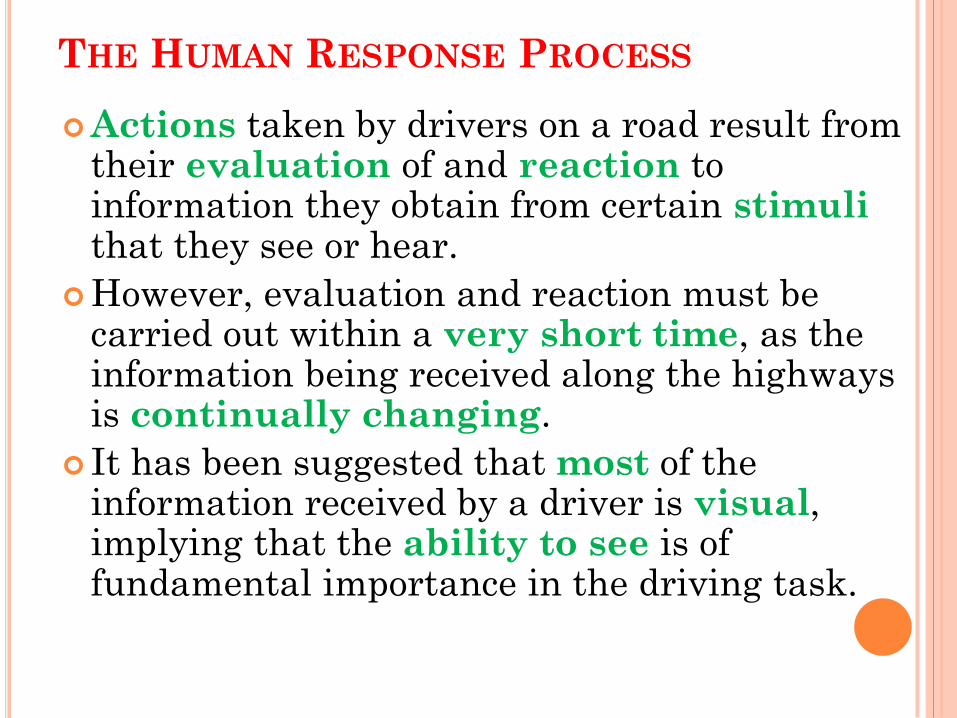
THE HUMAN RESPONSE PROCESS
Actions taken by drivers on a road result from their evaluation of and reaction to information they obtain from certain stimuli that they see or hear.
However, evaluation and reaction must be carried out within a very short time, as the information being received along the highways is continually changing.
It has been suggested that most of the information received by a driver is visual, implying that the ability to see is of fundamental importance in the driving task.
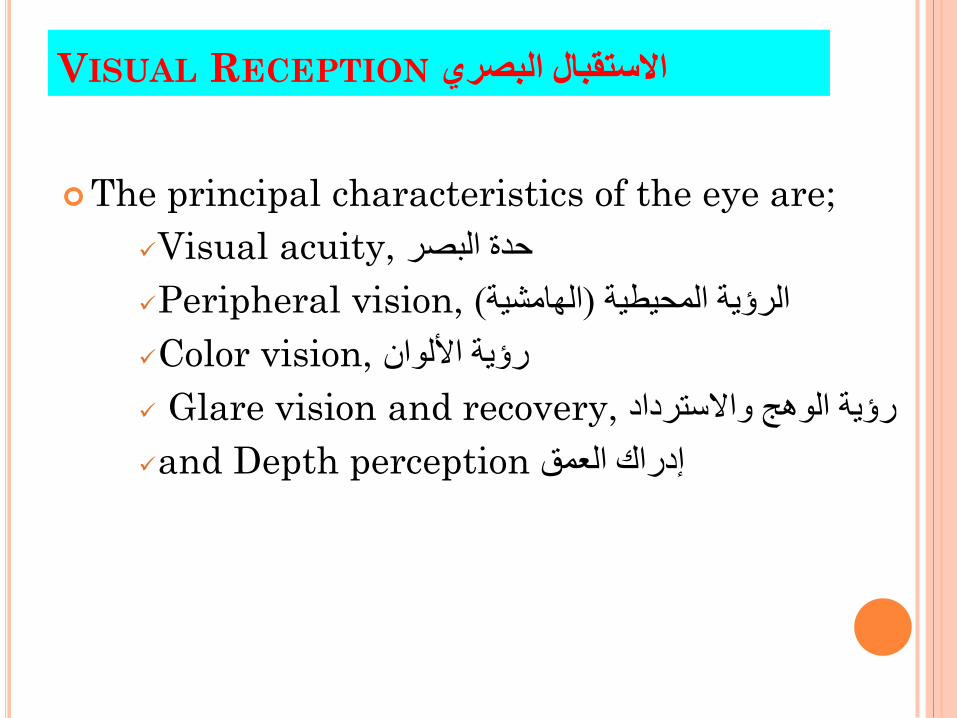
VISUAL RECEPTION االستقبال البصري
The principal characteristics of the eye are;
Visual acuity, حدة البصر
Peripheral vision, (الهامشية) الرؤية المحيطية
Color vision, رؤية األلوان
Glare vision and recovery, واالسترداد الوهج رؤية
and Depth perception إدراك العمق
VISUAL RECEPTION- VISUAL ACUITY
Two types of visual acuity are of importance in
traffic and highway emergencies:
Static and
Dynamic visual acuity.
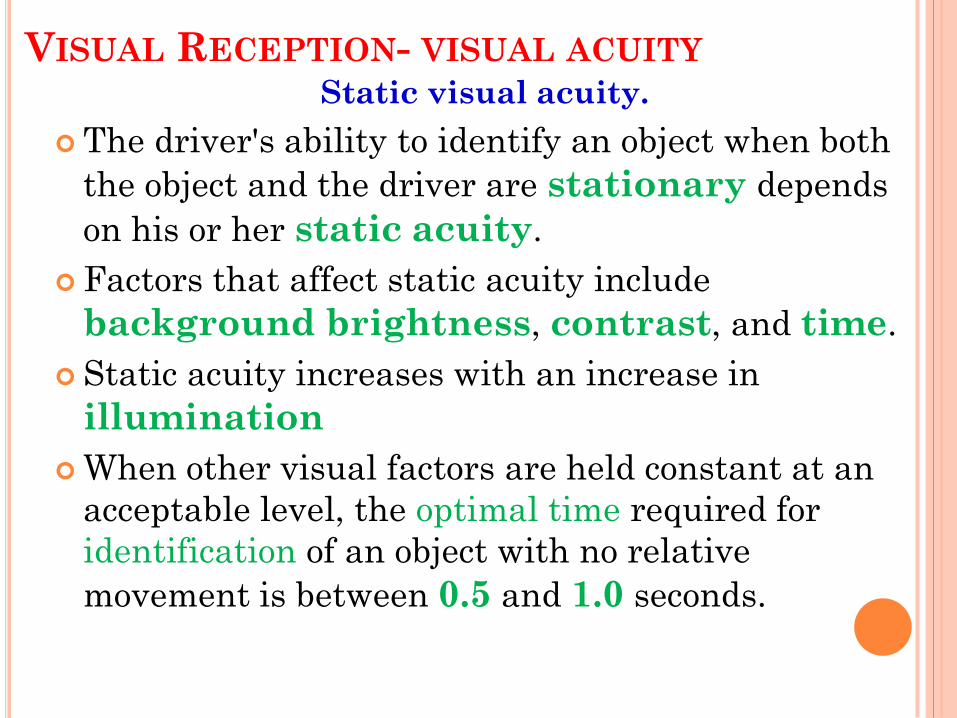
VISUAL RECEPTION- VISUAL ACUITY Static visual acuity.
The driver's ability to identify an object when both
the object and the driver are stationary depends
on his or her static acuity.
Factors that affect static acuity include
background brightness, contrast, and time.
Static acuity increases with an increase in
illumination
When other visual factors are held constant at an
acceptable level, the optimal time required for
identification of an object with no relative
movement is between 0.5 and 1.0 seconds.
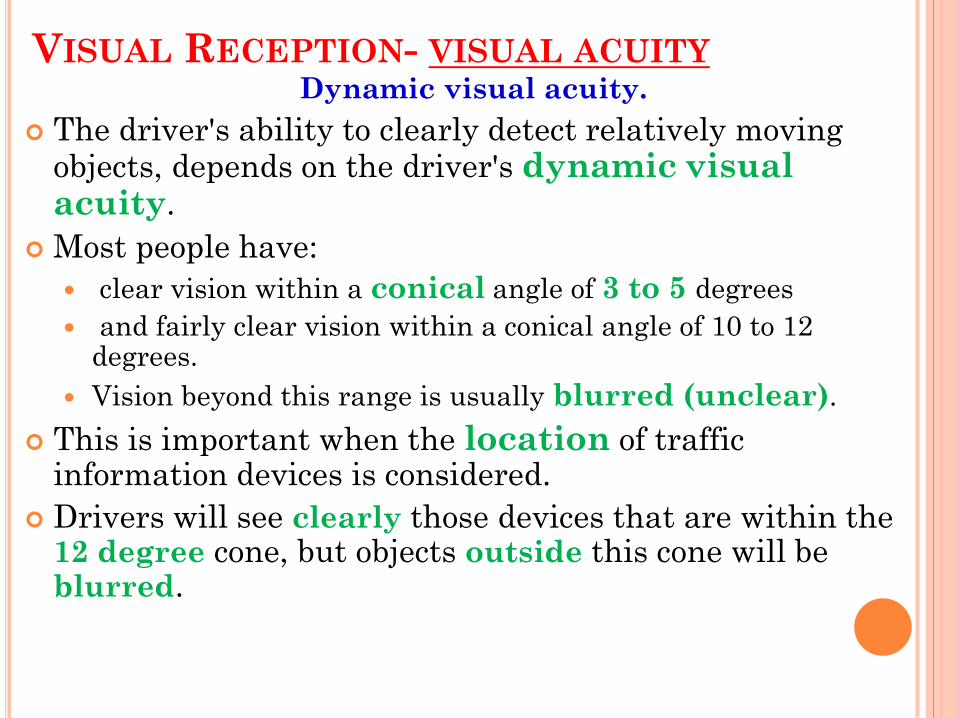
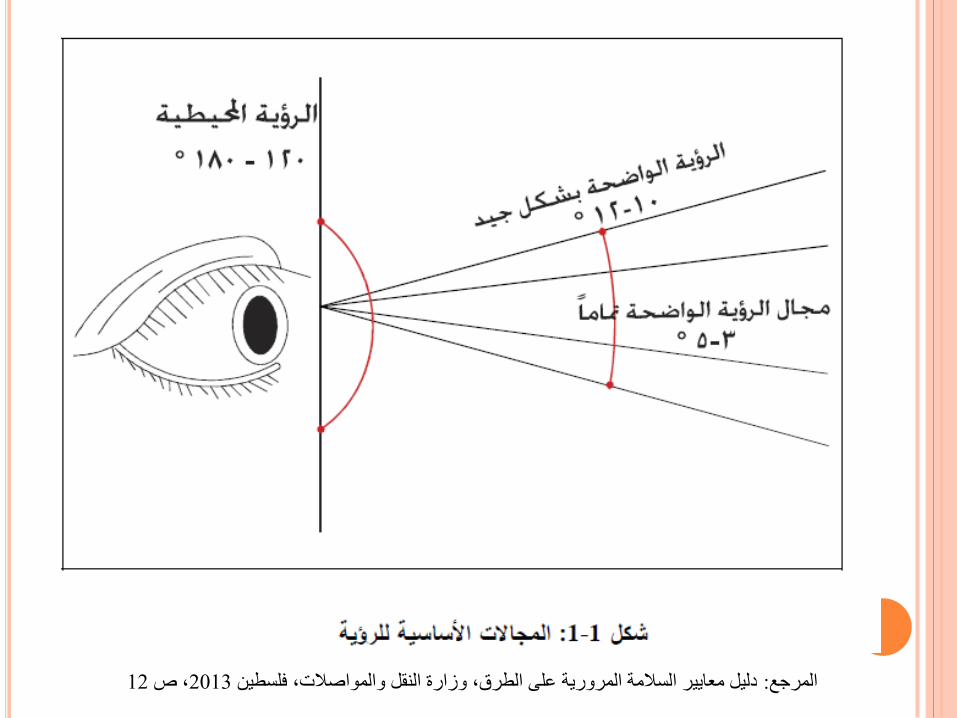
VISUAL RECEPTION- VISUAL ACUITY Dynamic visual acuity.
The driver's ability to clearly detect relatively moving objects, depends on the driver's dynamic visual acuity.
Most people have:
clear vision within a conical angle of 3 to 5 degrees
and fairly clear vision within a conical angle of 10 to 12 degrees.
Vision beyond this range is usually blurred (unclear).
This is important when the location of traffic information devices is considered.
Drivers will see clearly those devices that are within the 12 degree cone, but objects outside this cone will be blurred.
12، ص 2013فلسطين دليل معايير السالمة المرورية على الطرق، وزارة النقل والمواصالت، : المرجع
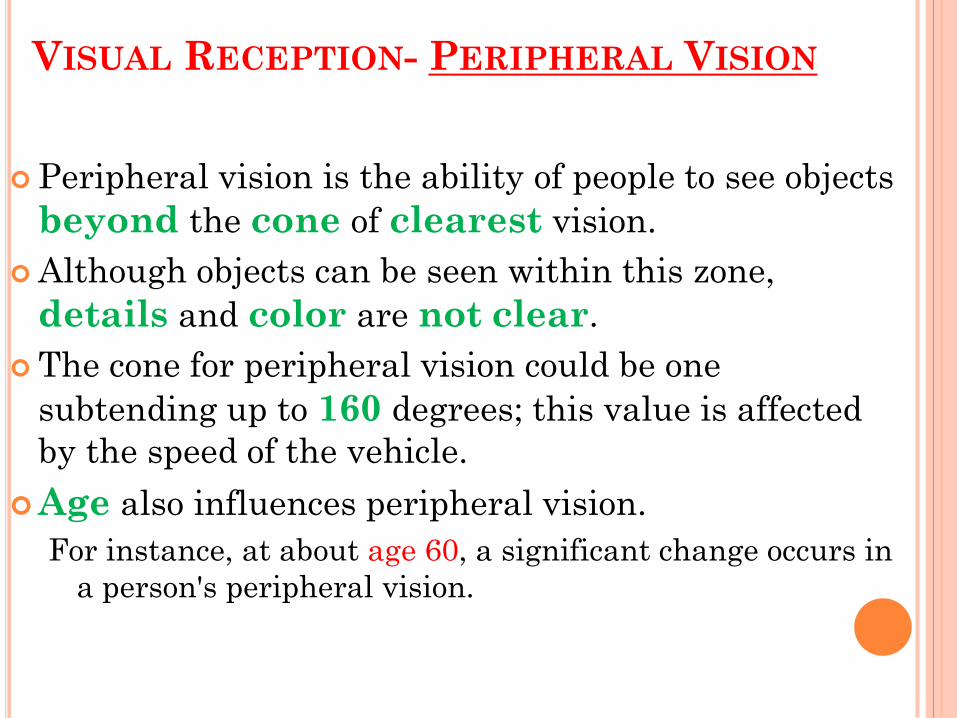
VISUAL RECEPTION- PERIPHERAL VISION
Peripheral vision is the ability of people to see objects
beyond the cone of clearest vision.
Although objects can be seen within this zone,
details and color are not clear.
The cone for peripheral vision could be one
subtending up to 160 degrees; this value is affected
by the speed of the vehicle.
Age also influences peripheral vision.
For instance, at about age 60, a significant change occurs in
a person's peripheral vision.
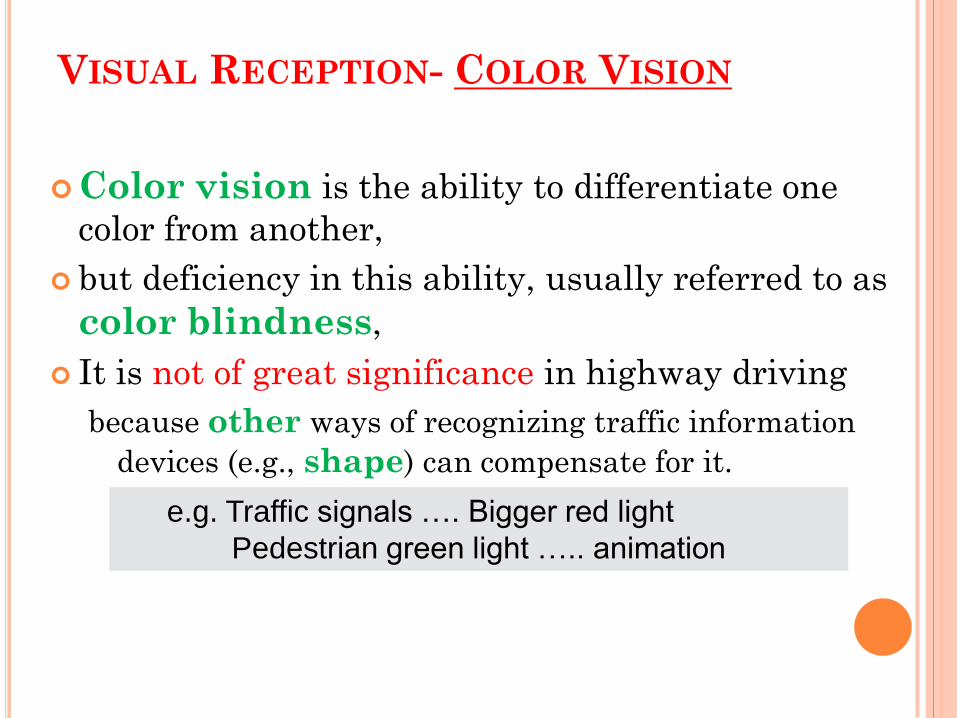
VISUAL RECEPTION- COLOR VISION
Color vision is the ability to differentiate one
color from another,
but deficiency in this ability, usually referred to as
color blindness,
It is not of great significance in highway driving
because other ways of recognizing traffic information
devices (e.g., shape) can compensate for it.
e.g. Traffic signals …. Bigger red light
Pedestrian green light ….. animation
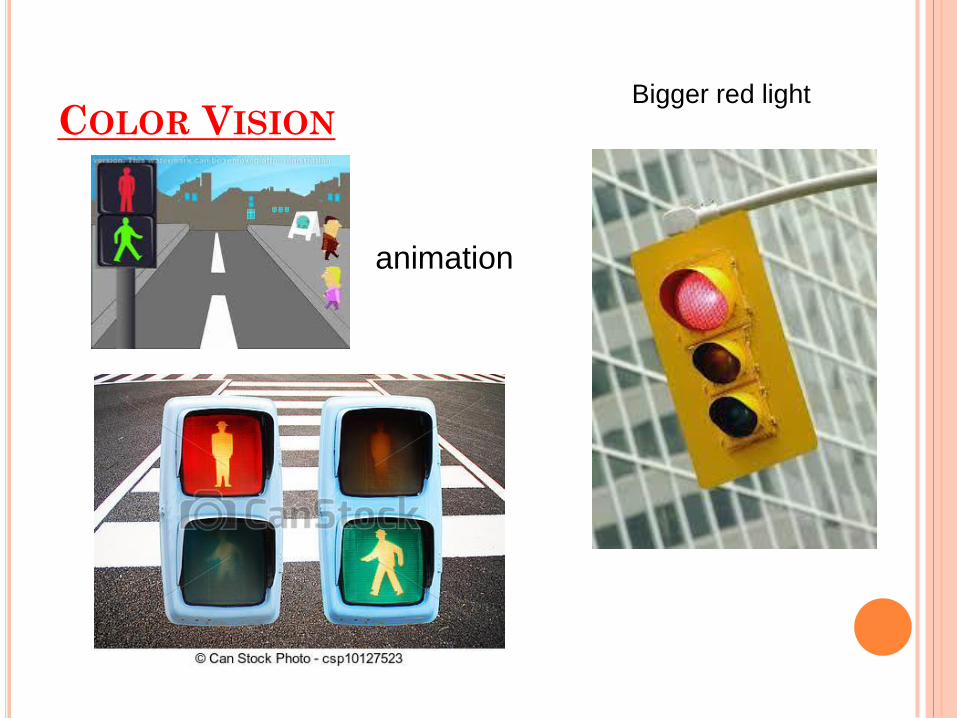
COLOR VISION Bigger red light
animation

VISUAL RECEPTION- COLOR VISION
Combinations of:
black and white and black and yellow
have been shown to be those to which
the eye is most sensitive.
black and yellow
black and white
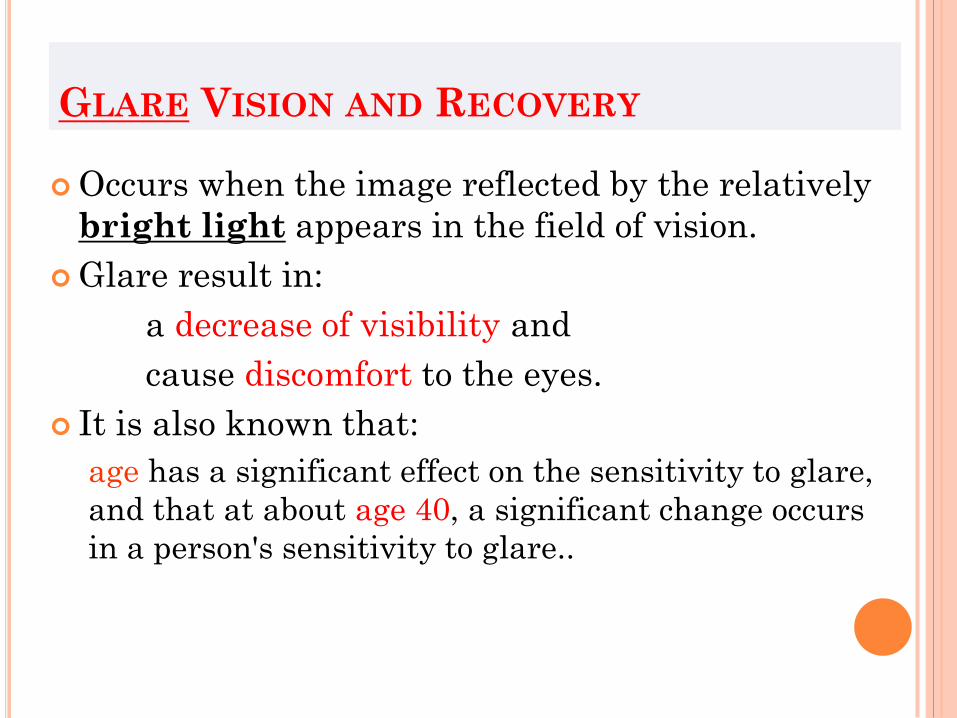
GLARE VISION AND RECOVERY
Occurs when the image reflected by the relatively
bright light appears in the field of vision.
Glare result in:
a decrease of visibility and
cause discomfort to the eyes.
It is also known that:
age has a significant effect on the sensitivity to glare,
and that at about age 40, a significant change occurs
in a person's sensitivity to glare..
Glare Recovery is the time required by a person to
recover from the effects of glare after passing the
light source.
Studies have shown that this time is about:
3 seconds when moving from dark to light and
can be 6 seconds or more when moving from light to
dark.
GLARE VISION AND RECOVERY
Glare vision is of great importance during
night driving;
older people see much more poorly at night.
This phenomenon should be taken into account in
the design and location of street lighting so that
glare effects are reduced to a minimum.
GLARE VISION AND RECOVERY
Glare effects can be minimized by reducing
luminaire brightness and by increasing the
background brightness in a driver's field of view.
Specific actions taken to achieve this in lighting
design include:
using higher mounting lights,
positioning lighting supports farther away from the
highway, and
restricting the light from the luminaire to obtain
minimum interference with the visibility of the
driver.
GLARE VISION AND RECOVERY
VISUAL RECEPTION - DEPTH PERCEPTION
Depth perception affects the ability of a person to
estimate speed and distance.
It is particularly important on two-lane highways
during passing maneuvers, when head-on crashes
may result from a lack of proper judgment of speed
and distance.
The human eye is not very good at estimating
absolute values of speed, distance, size, and
acceleration.
This is why traffic control devices are standard in
size, shape, and color.
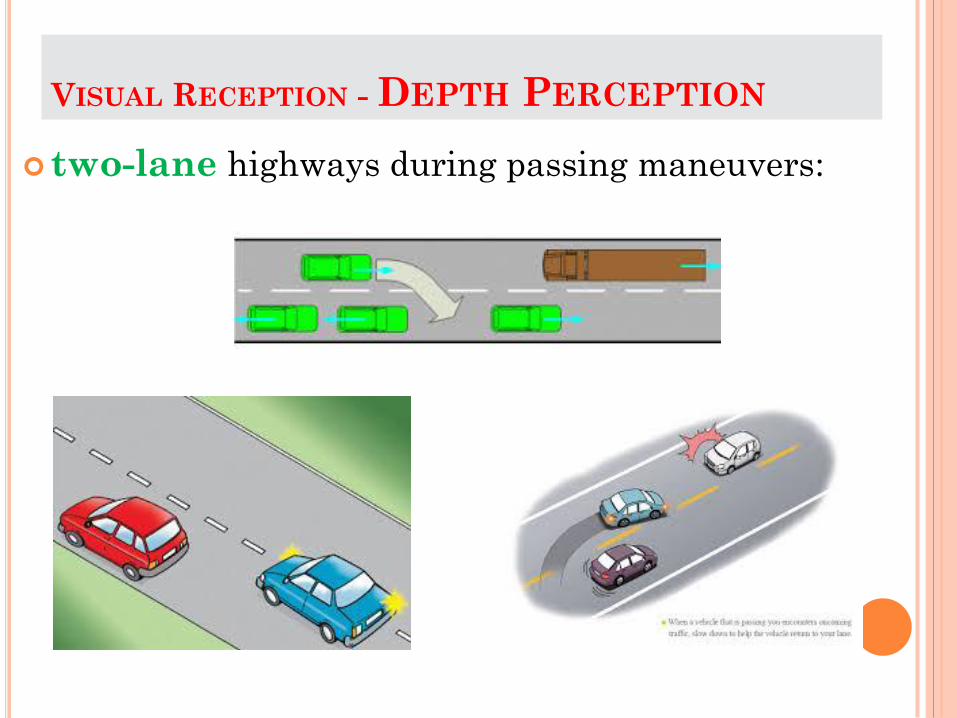
VISUAL RECEPTION - DEPTH PERCEPTION
two-lane highways during passing maneuvers:
HEARING PERCEPTION
The ear receives sound stimuli, which is
important to drivers only when warning
sounds, usually given out by emergency
vehicles, are to be detected.
Loss of some hearing ability is not a serious
problem, since it normally can be corrected by a
hearing aid.
3.2 PERCEPTION-REACTION PROCESS
The process through which a driver, cyclist, or
pedestrian evaluates and reacts to a stimulus can
be divided into four sub processes:
1. Perception: the driver sees a control device,
warning sign, or object on the road
2. Identification: the driver identifies the object
or control device and thus understands the
stimulus
3.2 PERCEPTION-REACTION PROCESS
3. Emotion: the driver decides what action to
take in response to the stimulus;
for example, to step on the brake pedal,
to pass, or to change lanes
4. Reaction: the driver actually executes the
action decided on during the emotion sub-
process
3.2 PERCEPTION-REACTION PROCESS
The time that elapses from the start of
perception to the end of reaction is the total
time required for perception, identification,
emotion, and reaction, referred to as
perception-reaction time.
Perception-reaction time is an important
factor in the determination of braking
distances, which in turn dictates the
minimum sight distance required on a
highway and the length of the yellow phase
at a signalized intersection.
3.2 PERCEPTION-REACTION PROCESS
Perception-reaction time varies among
individuals and may, in fact, vary for the
same person as the occasion changes.
These changes in perception-reaction time
depend on:
how complicated the situation is,
the existing environmental conditions,
age,
whether the person is tired or under the
influence of drugs and /or alcohol, and
whether the stimulus is expected or
unexpected.
3.2 PERCEPTION-REACTION PROCESS
The researchers noted that the 85th-percentile time to brake, obtained from several situations, varied from 1.26 to over 3 seconds.
The reaction time selected for design purposes should, however, be large enough to include reaction times for most drivers using the highways.
Recommendations made by the American Association of State Highway and Transportation Officials (AASHTO) stipulate 2.5 seconds for stopping-sight distances.
This encompasses the decision times for about 90 percent of drivers under most highway conditions.
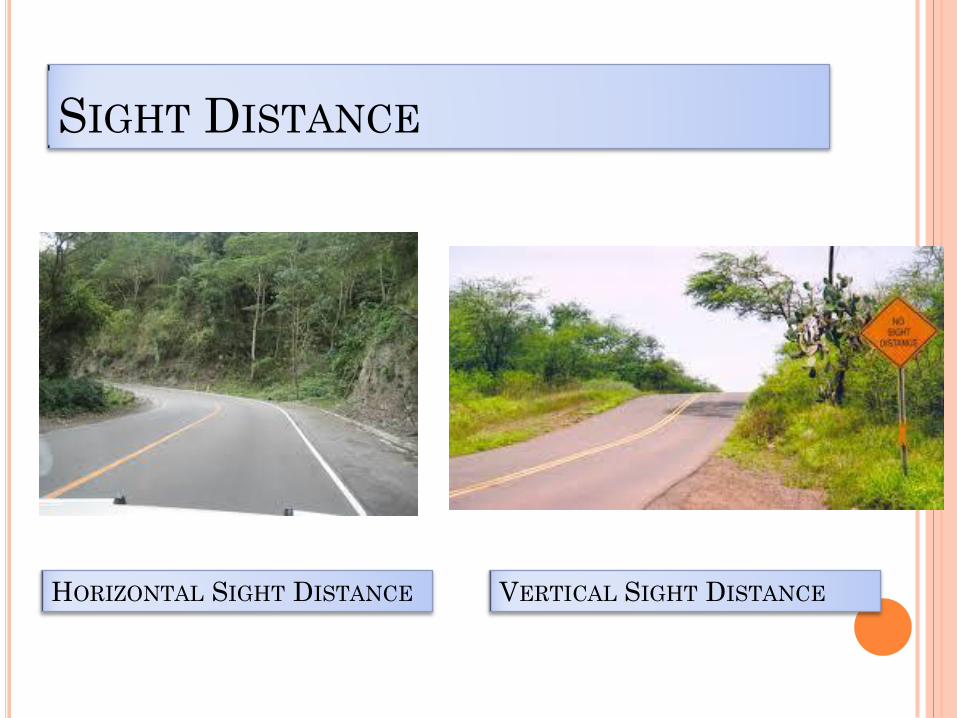
SIGHT DISTANCE
HORIZONTAL SIGHT DISTANCE VERTICAL SIGHT DISTANCE
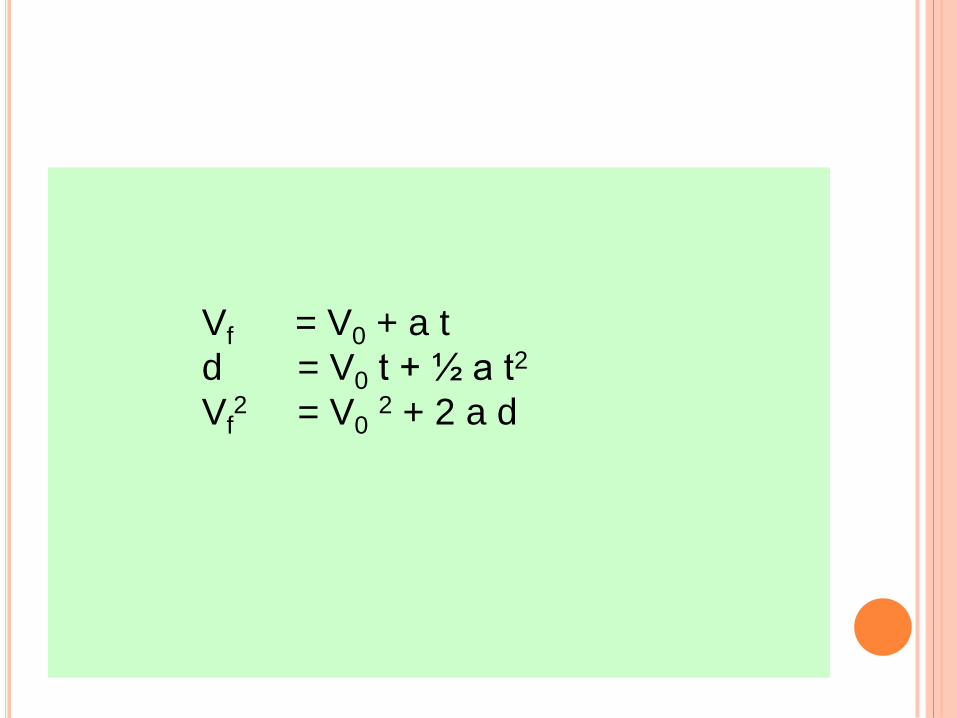
Vf = V0 + a t
d = V0 t + ½ a t2
Vf2 = V0
2 + 2 a d
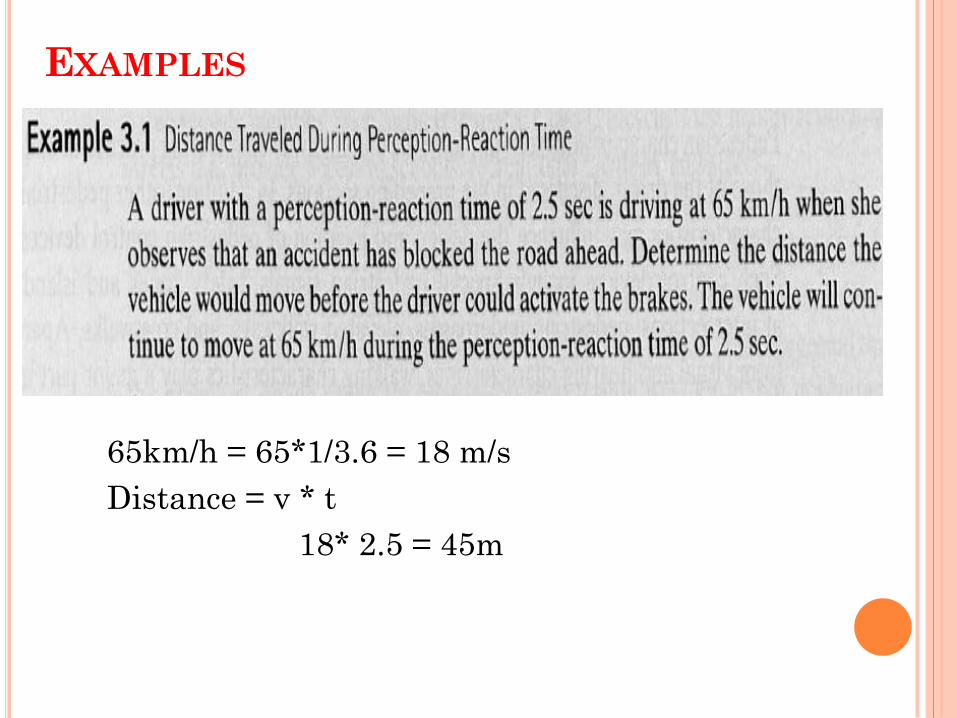
EXAMPLES
65km/h = 65*1/3.6 = 18 m/s
Distance = v * t
18* 2.5 = 45m
A
150 m
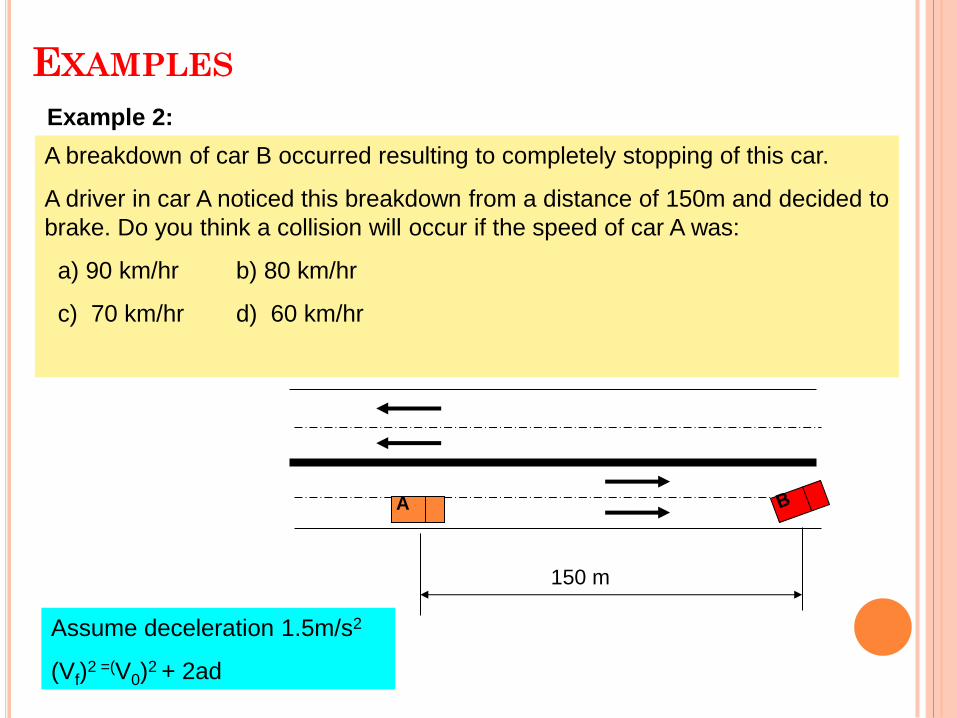
Example 2:
A breakdown of car B occurred resulting to completely stopping of this car.
A driver in car A noticed this breakdown from a distance of 150m and decided to
brake. Do you think a collision will occur if the speed of car A was:
a) 90 km/hr b) 80 km/hr
c) 70 km/hr d) 60 km/hr
EXAMPLES
Assume deceleration 1.5m/s2
(Vf)2 =(V0)
2 + 2ad
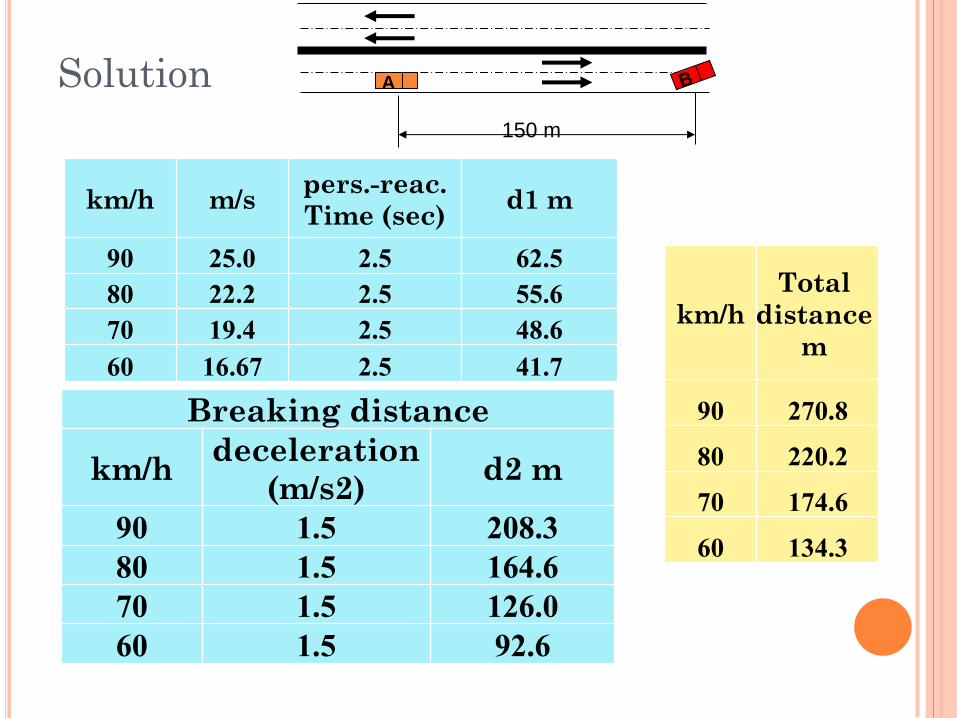
Solution
A
150 m
d1 m pers.-reac.
Time (sec) m/s km/h
62.5 2.5 25.0 90
55.6 2.5 22.2 80
48.6 2.5 19.4 70
41.7 2.5 16.67 60
Breaking distance
d2 m deceleration
(m/s2) km/h
208.3 1.5 90
164.6 1.5 80
126.0 1.5 70
92.6 1.5 60
Total
distance
m
km/h
270.8 90
220.2 80
174.6 70
134.3 60
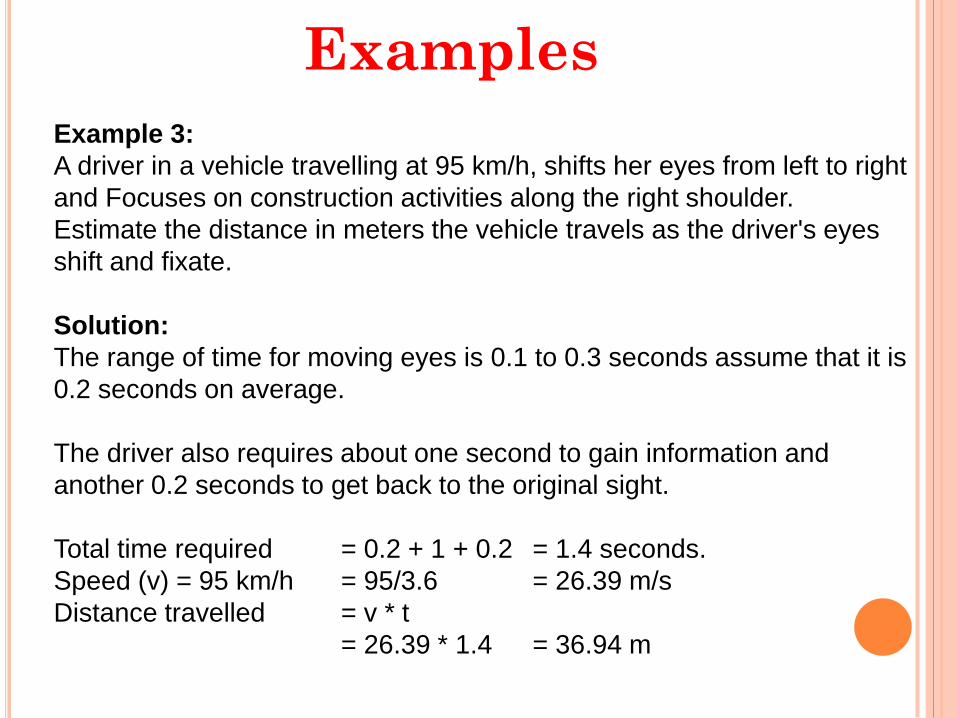
Example 3:
A driver in a vehicle travelling at 95 km/h, shifts her eyes from left to right
and Focuses on construction activities along the right shoulder.
Estimate the distance in meters the vehicle travels as the driver's eyes
shift and fixate.
Solution:
The range of time for moving eyes is 0.1 to 0.3 seconds assume that it is
0.2 seconds on average.
The driver also requires about one second to gain information and
another 0.2 seconds to get back to the original sight.
Total time required = 0.2 + 1 + 0.2 = 1.4 seconds.
Speed (v) = 95 km/h = 95/3.6 = 26.39 m/s
Distance travelled = v * t
= 26.39 * 1.4 = 36.94 m
Examples
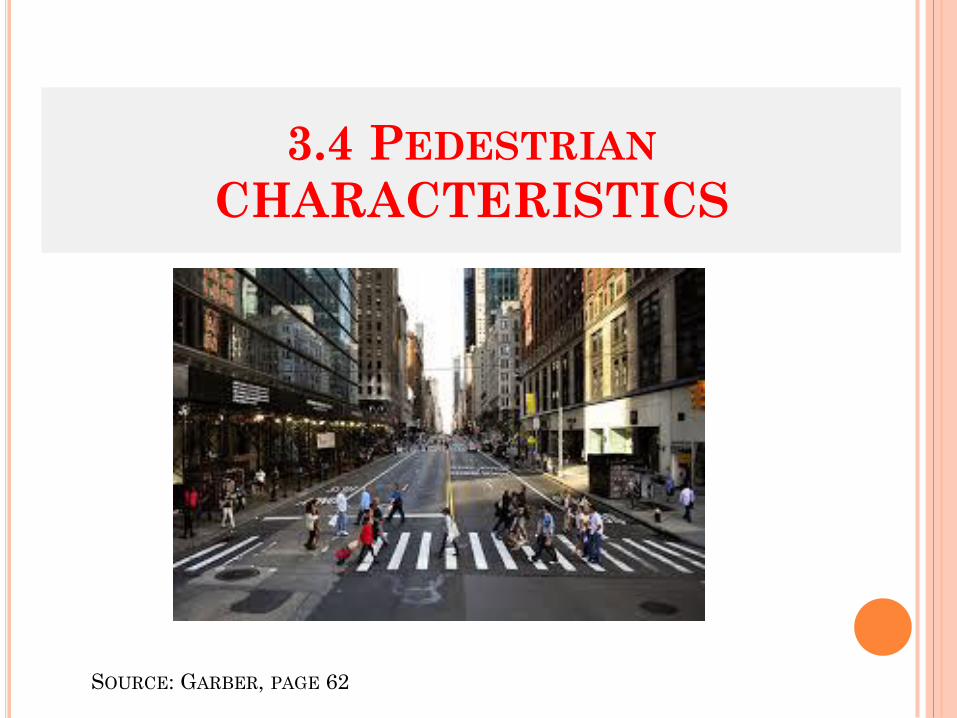
3.4 PEDESTRIAN
CHARACTERISTICS
SOURCE: GARBER, PAGE 62
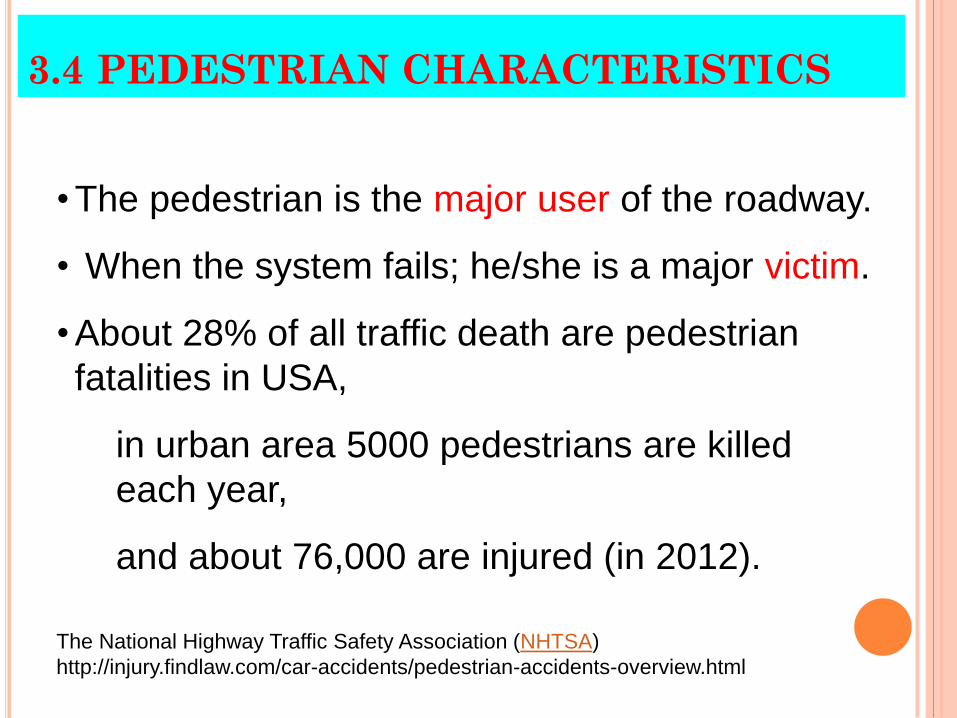
• The pedestrian is the major user of the roadway.
• When the system fails; he/she is a major victim.
• About 28% of all traffic death are pedestrian
fatalities in USA,
in urban area 5000 pedestrians are killed
each year,
and about 76,000 are injured (in 2012).
3.4 PEDESTRIAN CHARACTERISTICS
The National Highway Traffic Safety Association (NHTSA)
http://injury.findlaw.com/car-accidents/pedestrian-accidents-overview.html
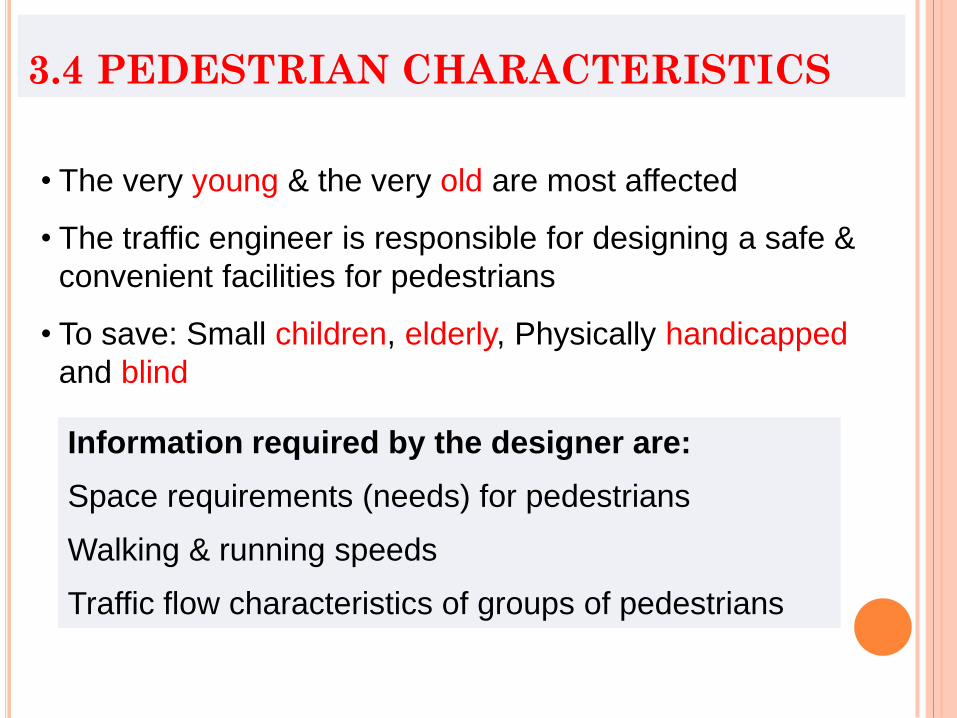
• The very young & the very old are most affected
• The traffic engineer is responsible for designing a safe &
convenient facilities for pedestrians
• To save: Small children, elderly, Physically handicapped
and blind
Information required by the designer are:
Space requirements (needs) for pedestrians
Walking & running speeds
Traffic flow characteristics of groups of pedestrians
3.4 PEDESTRIAN CHARACTERISTICS
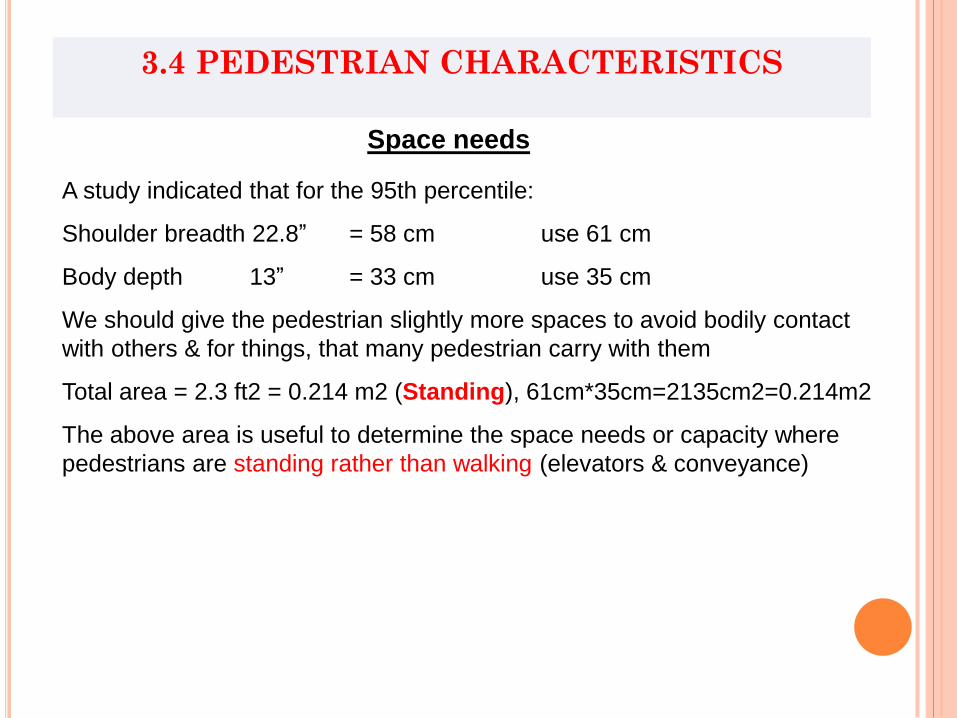
Space needs
A study indicated that for the 95th percentile:
Shoulder breadth 22.8” = 58 cm use 61 cm
Body depth 13” = 33 cm use 35 cm
We should give the pedestrian slightly more spaces to avoid bodily contact
with others & for things, that many pedestrian carry with them
Total area = 2.3 ft2 = 0.214 m2 (Standing), 61cm*35cm=2135cm2=0.214m2
The above area is useful to determine the space needs or capacity where
pedestrians are standing rather than walking (elevators & conveyance)
3.4 PEDESTRIAN CHARACTERISTICS
Space needs
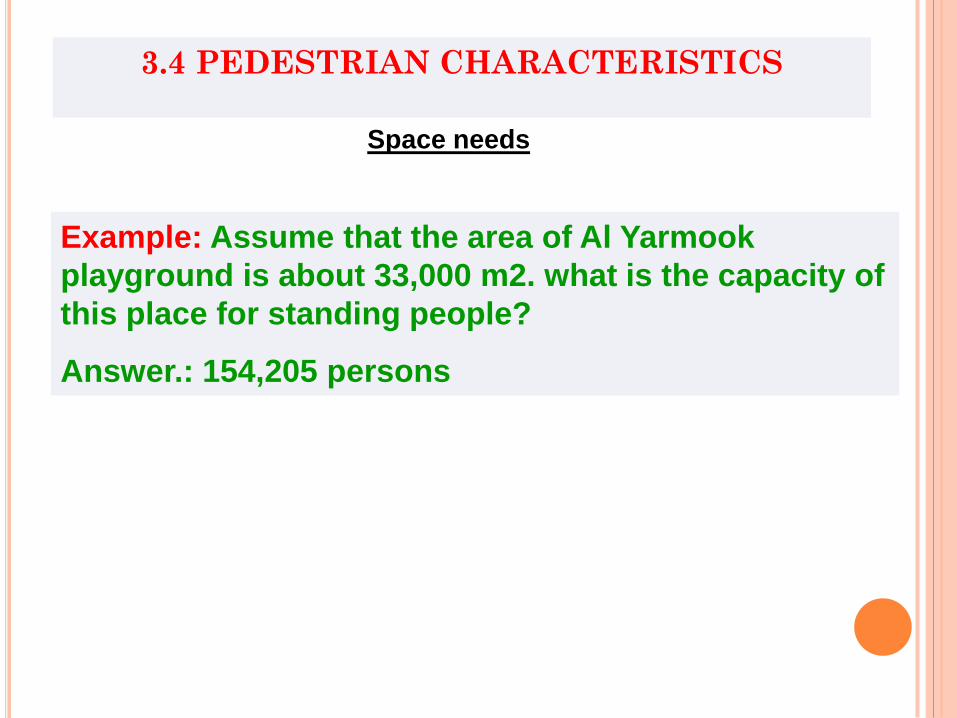
Example: Assume that the area of Al Yarmook
playground is about 33,000 m2. what is the capacity of
this place for standing people?
Answer.: 154,205 persons
3.4 PEDESTRIAN CHARACTERISTICS
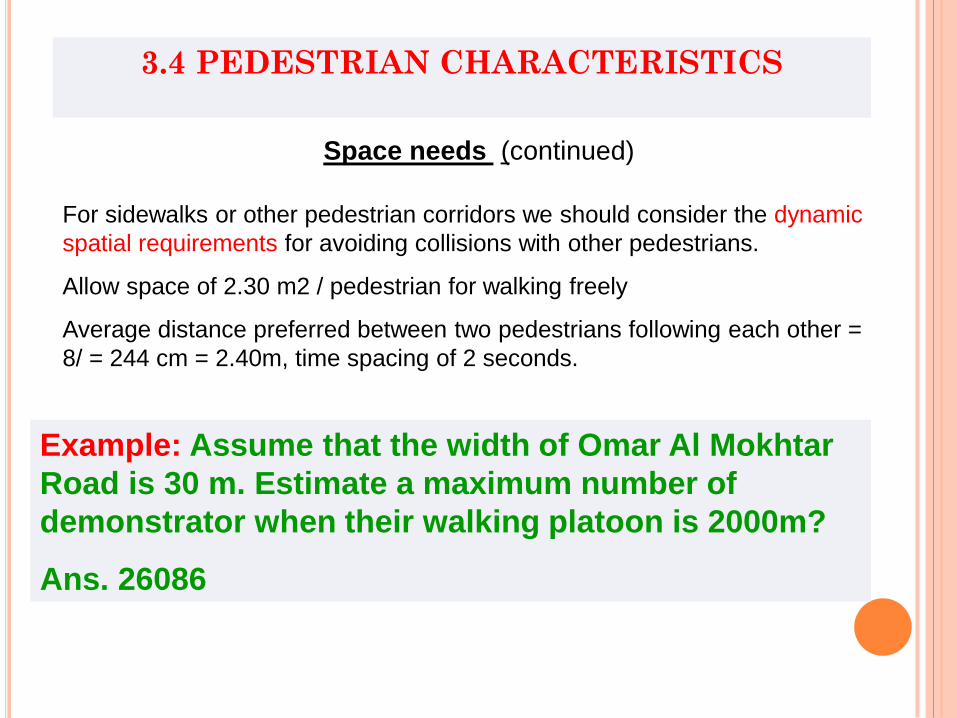
continued)( Space needs
For sidewalks or other pedestrian corridors we should consider the dynamic
spatial requirements for avoiding collisions with other pedestrians.
Allow space of 2.30 m2 / pedestrian for walking freely
Average distance preferred between two pedestrians following each other =
8/ = 244 cm = 2.40m, time spacing of 2 seconds.
Example: Assume that the width of Omar Al Mokhtar
Road is 30 m. Estimate a maximum number of
demonstrator when their walking platoon is 2000m?
Ans. 26086
3.4 PEDESTRIAN CHARACTERISTICS
Walking & running speeds
Under free flow conditions
Pedestrian speed are normally distributed
Range: 2 to 6 ft/sec, or 0.6m/s to 1.82 m/s
2.16 km/h to 6.55 km/h
Mean walking speed: 4.0 to 4.5 ft/s
1.22 m/s to 1.37 m/s
4.4 km/h to 5 km/h
In design use 4 ft/s (1.22 m/s)
If number of elderly is high use (0.9 m/s)
Lower if significant number of handicapped is present
3.4 PEDESTRIAN CHARACTERISTICS
Walking speed decreases with the increase in pedestrian
density.
Running speed
470 ft/min or 7.80 ft/s
= 2.38m/s = 8.6km/h
Fastest speed = 33 ft/s
= 10m/s = 36.2km/h
Walking & running speeds
3.4 PEDESTRIAN CHARACTERISTICS
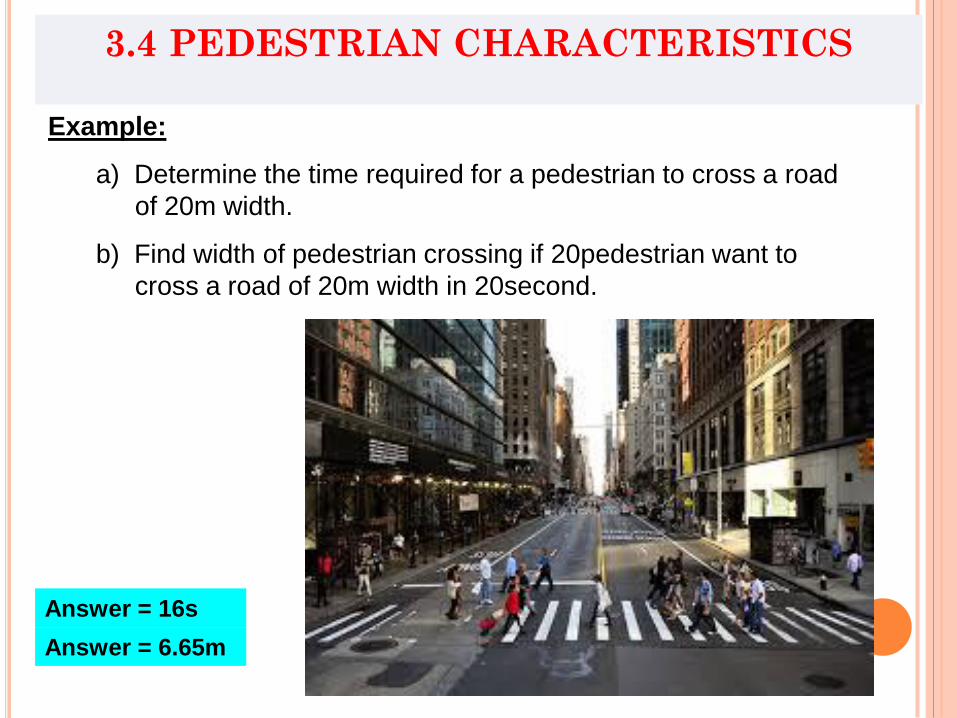
Example:
a) Determine the time required for a pedestrian to cross a road
of 20m width.
b) Find width of pedestrian crossing if 20pedestrian want to
cross a road of 20m width in 20second.
Answer = 6.65m
Answer = 16s
3.4 PEDESTRIAN CHARACTERISTICS
3.5 BICYCLISTS AND BICYCLES
CHARACTERISTICS
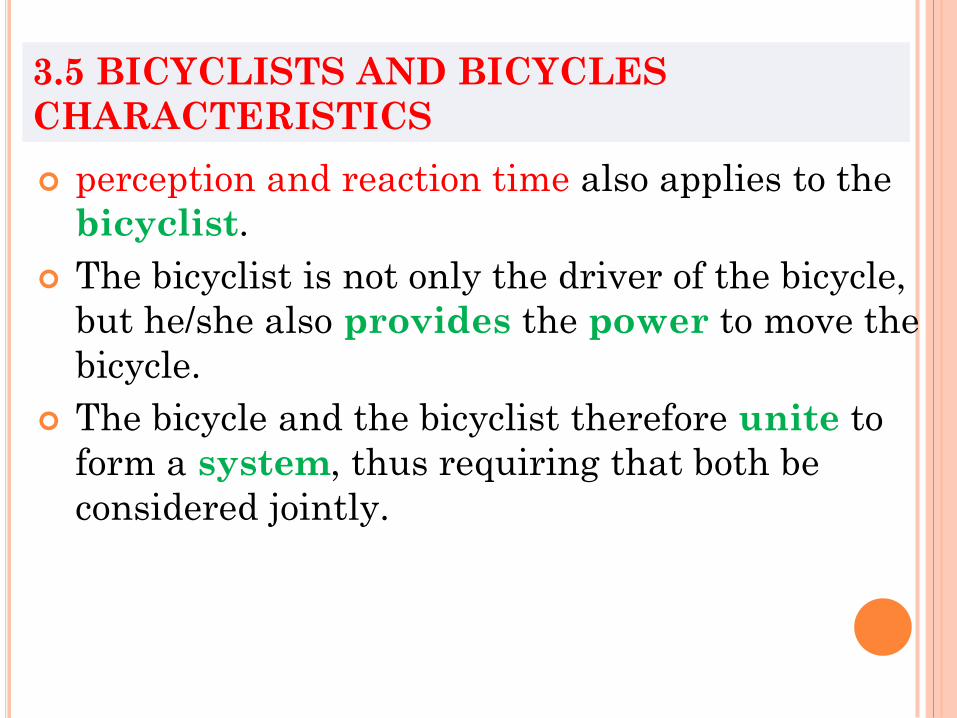
perception and reaction time also applies to the
bicyclist.
The bicyclist is not only the driver of the bicycle,
but he/she also provides the power to move the
bicycle.
The bicycle and the bicyclist therefore unite to
form a system, thus requiring that both be
considered jointly.
3.5 BICYCLISTS AND BICYCLES
CHARACTERISTICS
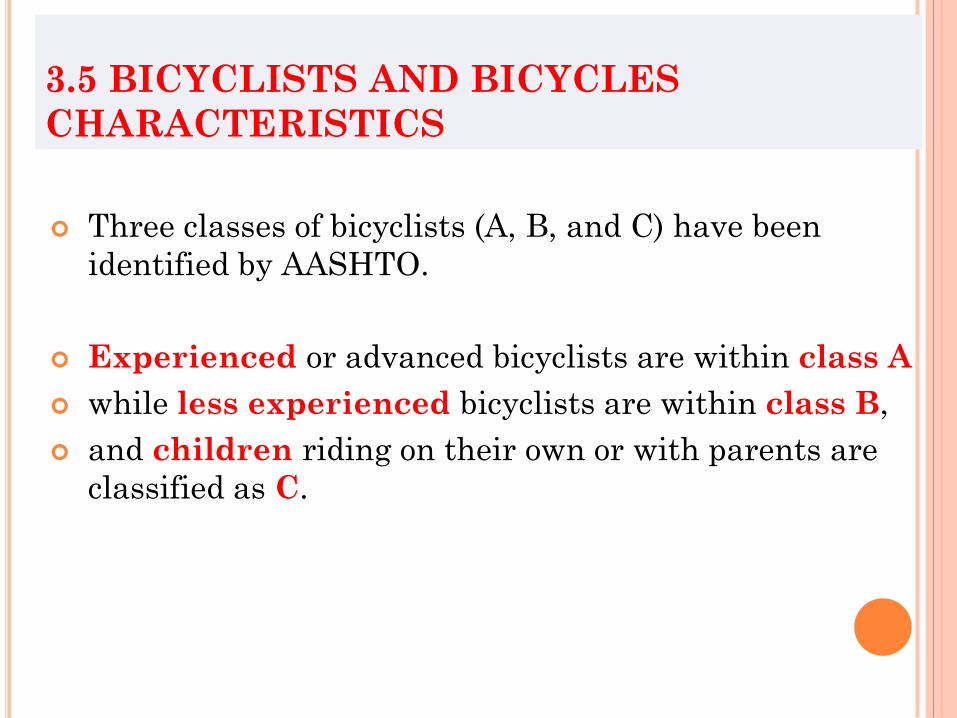
Three classes of bicyclists (A, B, and C) have been
identified by AASHTO.
Experienced or advanced bicyclists are within class A
while less experienced bicyclists are within class B,
and children riding on their own or with parents are
classified as C.
3.5 BICYCLISTS AND BICYCLES CHARACTERISTICS
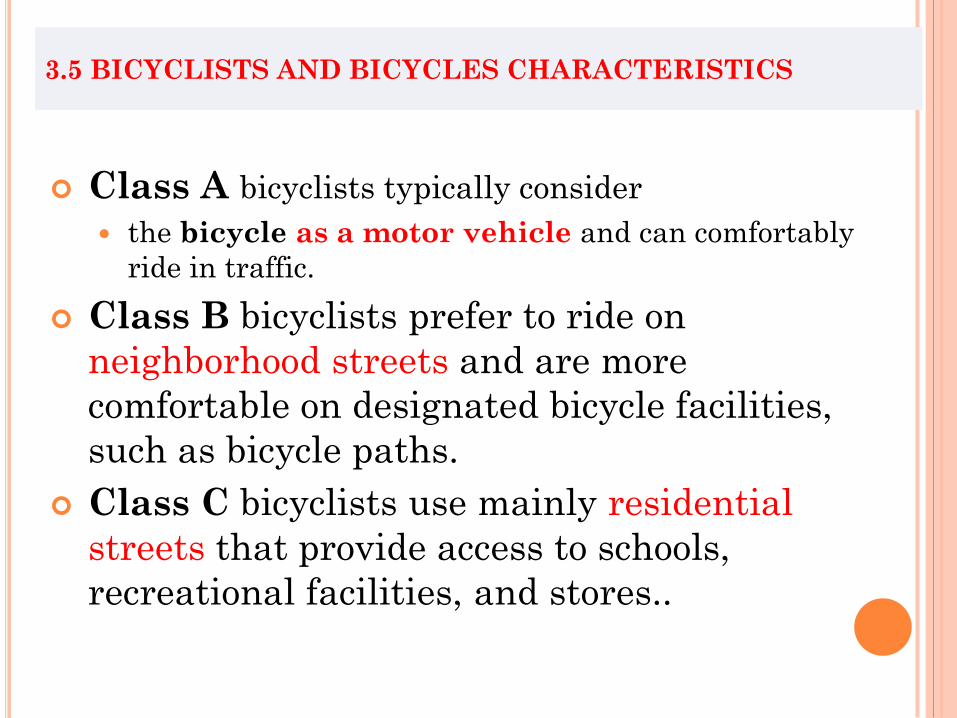
Class A bicyclists typically consider
the bicycle as a motor vehicle and can comfortably
ride in traffic.
Class B bicyclists prefer to ride on
neighborhood streets and are more
comfortable on designated bicycle facilities,
such as bicycle paths.
Class C bicyclists use mainly residential
streets that provide access to schools,
recreational facilities, and stores..
3.5 BICYCLISTS AND BICYCLES CHARACTERISTICS
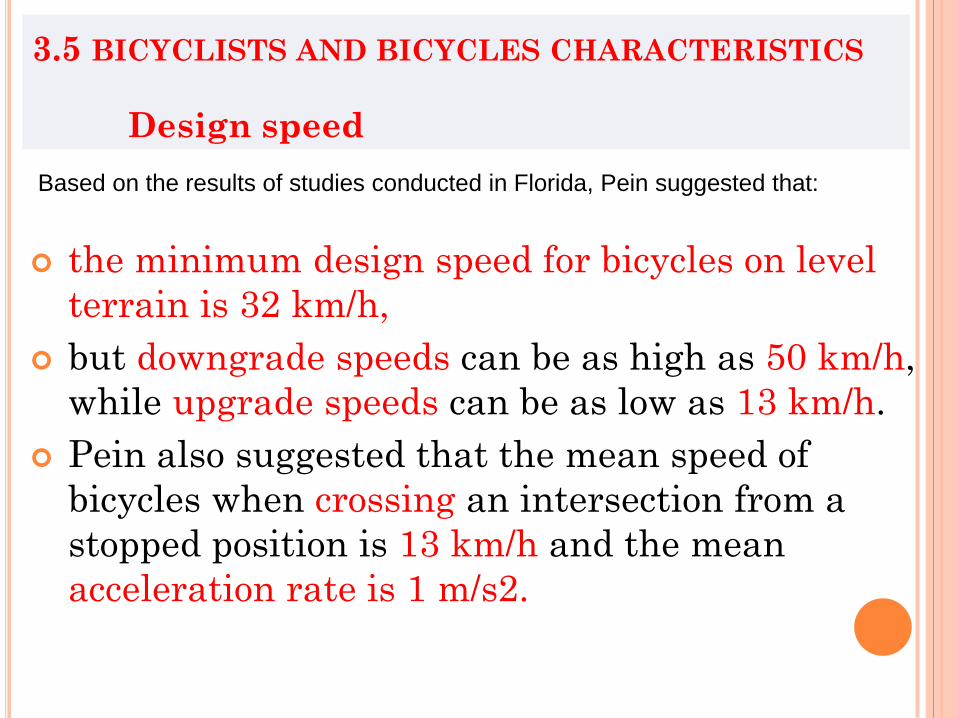
Design speed
the minimum design speed for bicycles on level
terrain is 32 km/h,
but downgrade speeds can be as high as 50 km/h,
while upgrade speeds can be as low as 13 km/h.
Pein also suggested that the mean speed of
bicycles when crossing an intersection from a
stopped position is 13 km/h and the mean
acceleration rate is 1 m/s2.
Based on the results of studies conducted in Florida, Pein suggested that:
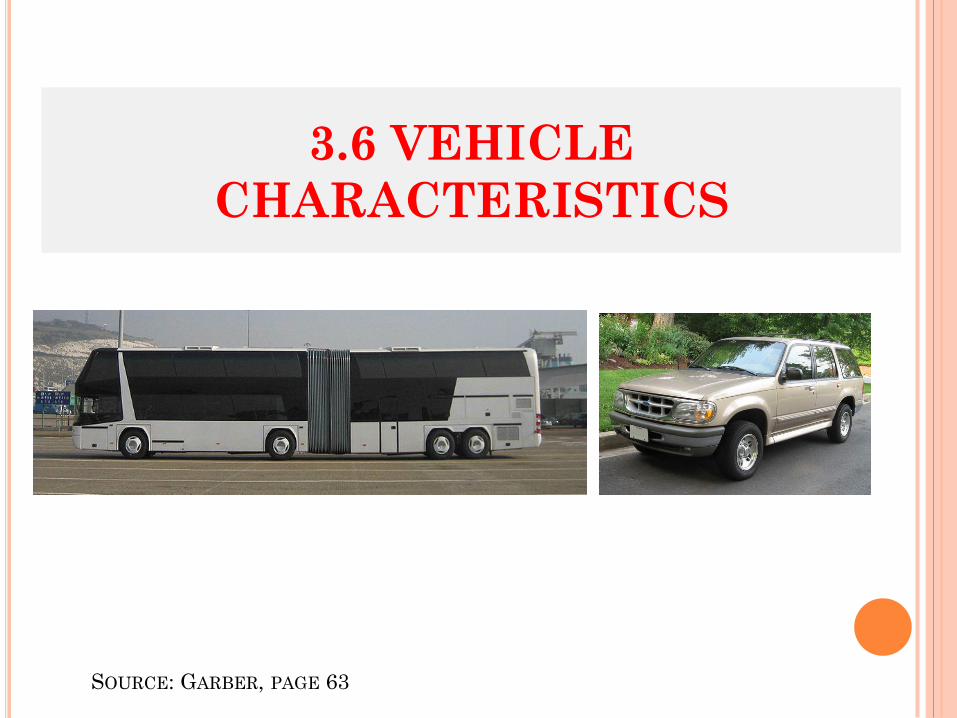
3.6 VEHICLE
CHARACTERISTICS
SOURCE: GARBER, PAGE 63
3.6 VEHICLE CHARACTERISTICS
Criteria for the geometric design of
highways are partly based on:
the static,
kinematic, and
dynamic
characteristics of vehicles.
3.6 VEHICLE CHARACTERISTICS
Static characteristics include the weight and
size of the vehicle,
while kinematic characteristics involve the
motion of the vehicle without considering the
forces that cause the motion.
Dynamic characteristics involve the forces
that cause the motion of the vehicle.
3.6 VEHICLE CHARACTERISTICS
Since nearly all highways carry both passenger-
automobile and truck traffic, it is essential that
design criteria take into account the
characteristics of different types of vehicles.
This will aid the highway and/or traffic engineer
in designing highways and traffic-control
systems;
that allow the safe and smooth operation of a
moving vehicle, particularly during the basic
maneuvers of passing, stopping, and turning.
3.6 VEHICLE CHARACTERISTICS
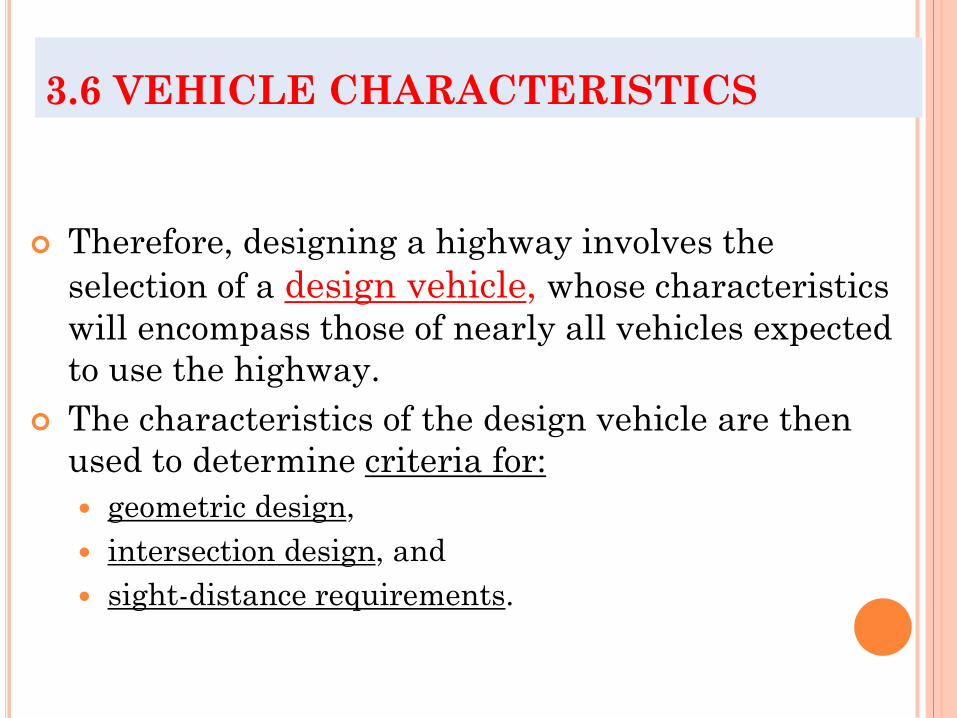
Therefore, designing a highway involves the
selection of a design vehicle, whose characteristics
will encompass those of nearly all vehicles expected
to use the highway.
The characteristics of the design vehicle are then
used to determine criteria for:
geometric design,
intersection design, and
sight-distance requirements.
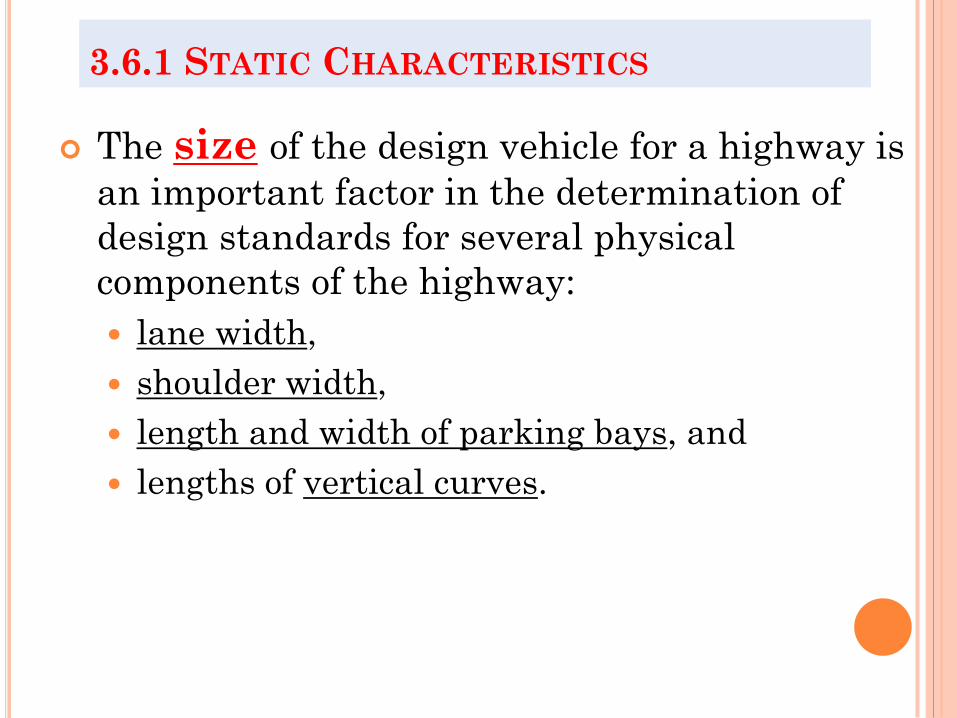
The size of the design vehicle for a highway is
an important factor in the determination of
design standards for several physical
components of the highway:
lane width,
shoulder width,
length and width of parking bays, and
lengths of vertical curves.
3.6.1 STATIC CHARACTERISTICS
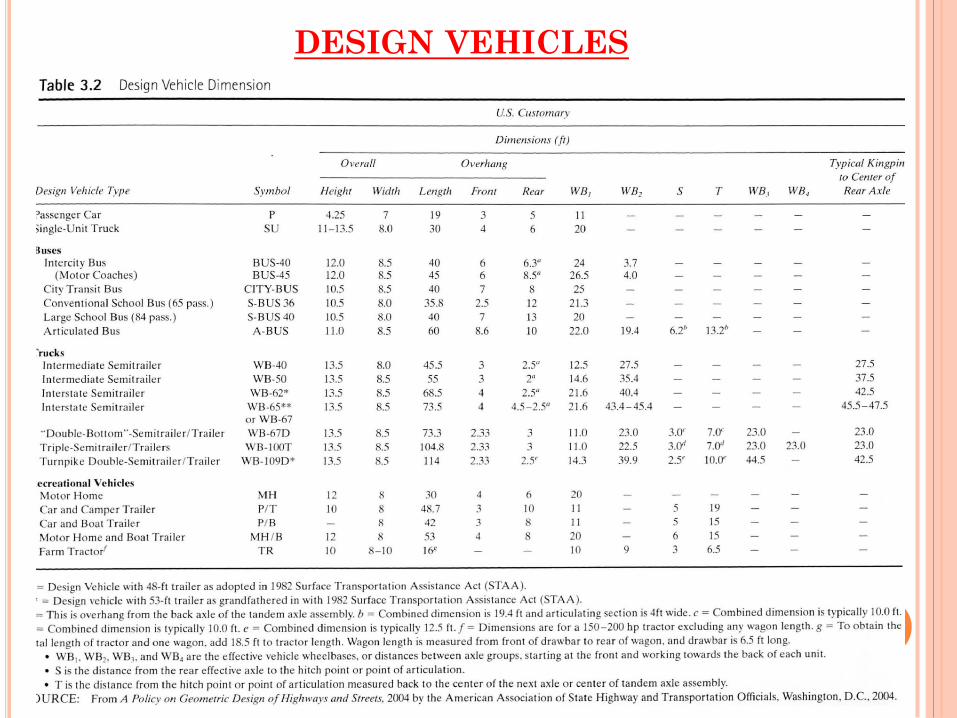
3.6.1 STATIC CHARACTERISTICS
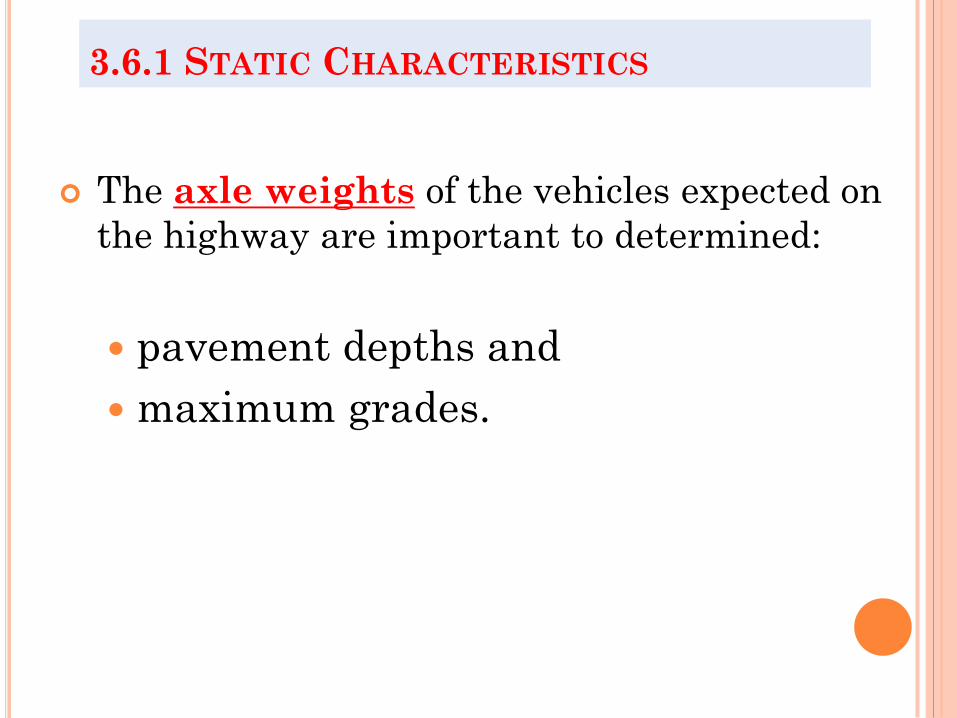
The axle weights of the vehicles expected on
the highway are important to determined:
pavement depths and
maximum grades.
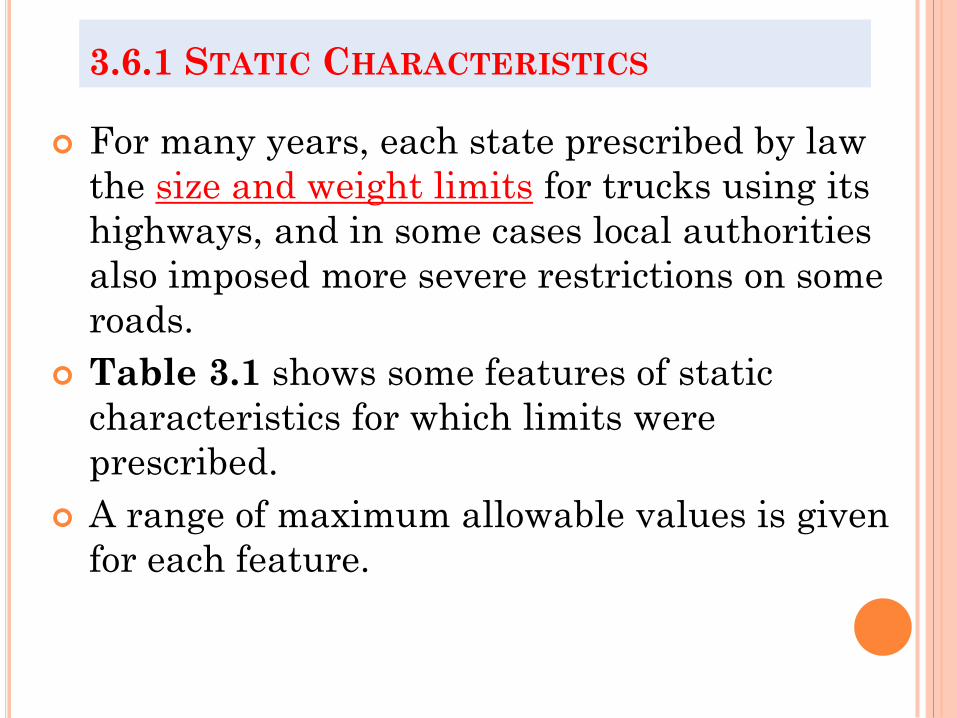
For many years, each state prescribed by law
the size and weight limits for trucks using its
highways, and in some cases local authorities
also imposed more severe restrictions on some
roads.
Table 3.1 shows some features of static
characteristics for which limits were
prescribed.
A range of maximum allowable values is given
for each feature.
3.6.1 STATIC CHARACTERISTICS
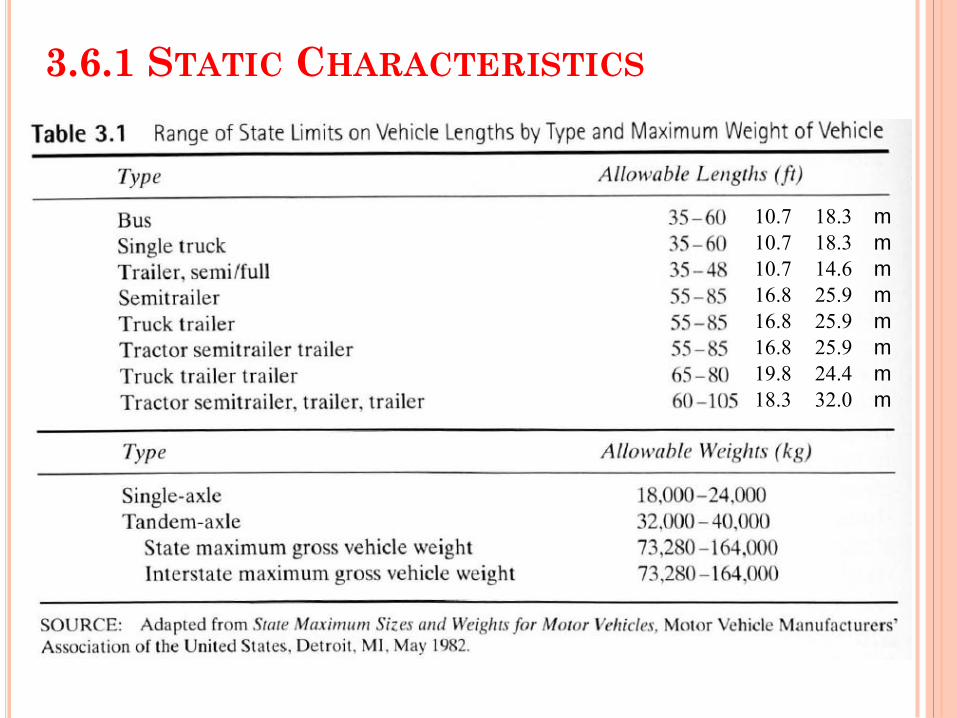
3.6.1 STATIC CHARACTERISTICS
m 18.3 10.7
m 18.3 10.7
m 14.6 10.7
m 25.9 16.8
m 25.9 16.8
m 25.9 16.8
m 24.4 19.8
m 32.0 18.3
3.6.1 STATIC CHARACTERISTICS
The static characteristics of vehicles influence
the selection of design criteria for the highway.
It is therefore necessary that all vehicles be
classified
AASHTO has selected four general classes of
vehicles:
passenger cars,
buses,
trucks, and
recreational vehicles.
3.6.1 STATIC CHARACTERISTICS
CLASSES OF VEHICLES
1. The passenger-car class:
sport/utility vehicles, minivans, vans, and pick-up trucks.
2. The bus class:
intercity motor coaches and city transit, school, and
articulated buses.
3. The class of trucks:
single-unit trucks, truck tractor-semitrailer
combinations, and trucks or truck tractors with
semitrailers in combination with full trailers.
4. The class of recreational vehicles:
motor homes, cars with camper trailers, cars with
boat trailers, and motor homes pulling cars.
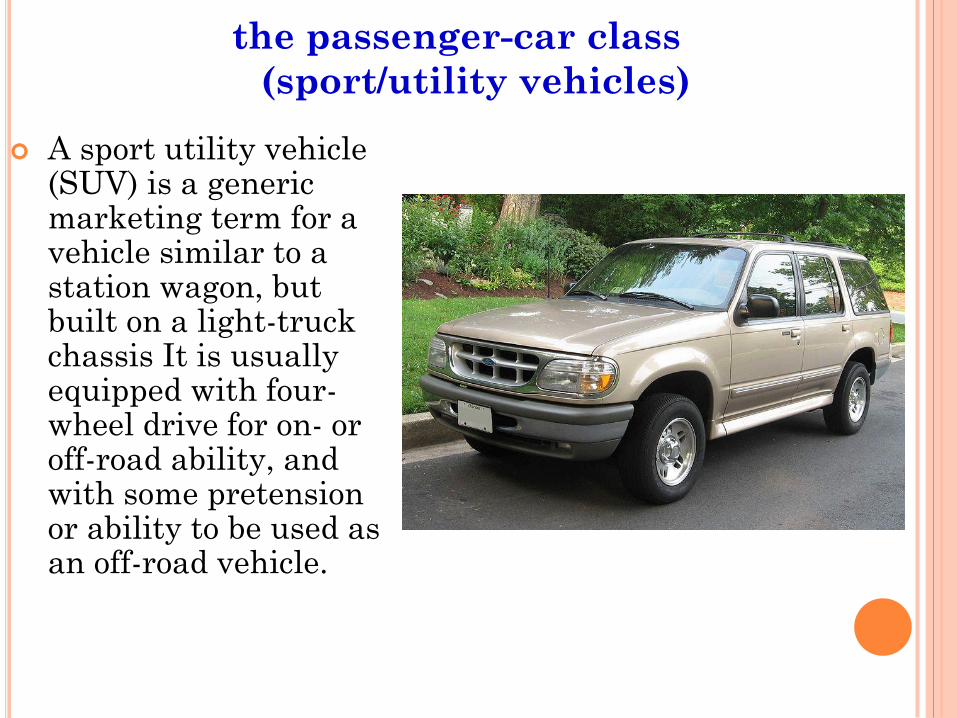
A sport utility vehicle (SUV) is a generic marketing term for a vehicle similar to a station wagon, but built on a light-truck chassis It is usually equipped with four-wheel drive for on- or off-road ability, and with some pretension or ability to be used as an off-road vehicle.
the passenger-car class
(sport/utility vehicles)
A van is a kind of vehicle used for transporting goods or
groups of people.
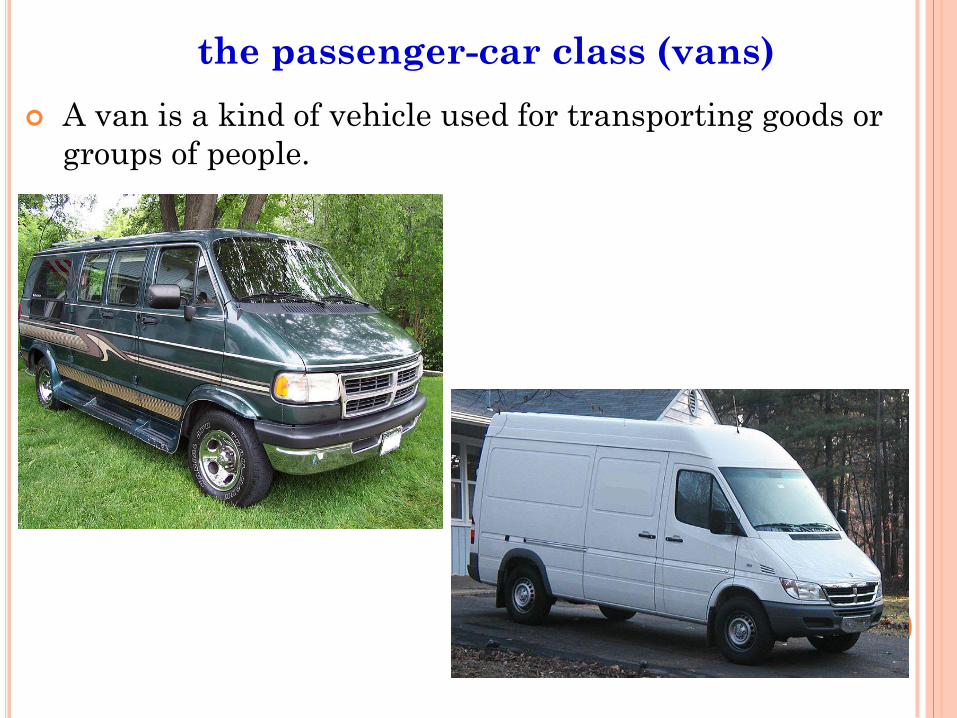
the passenger-car class (vans)
A van is a kind of vehicle used for transporting goods or
groups of people.
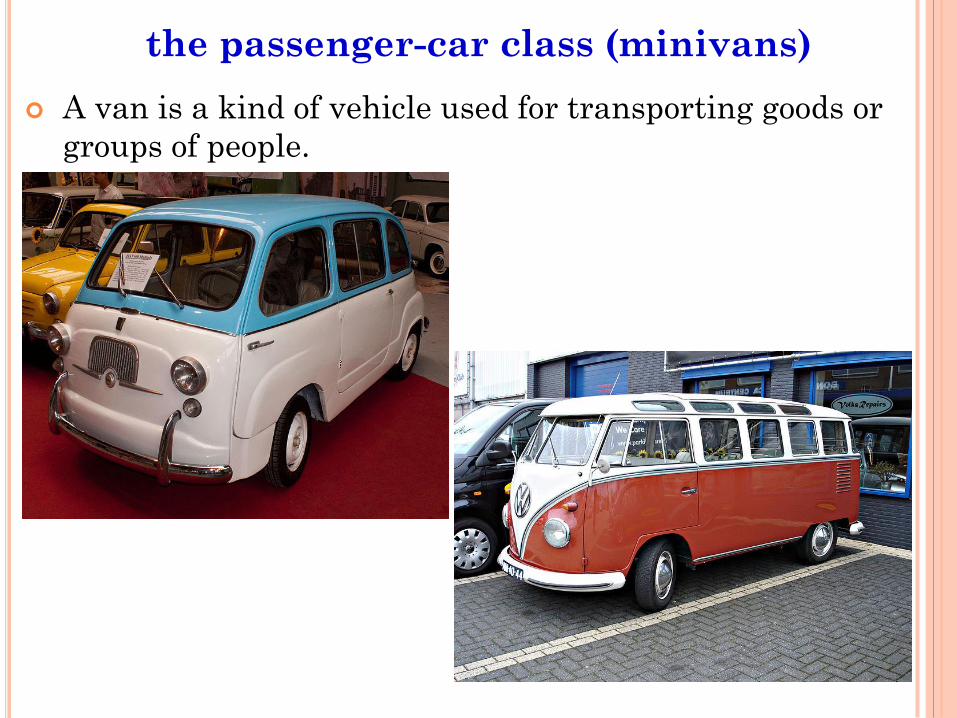
the passenger-car class (minivans)
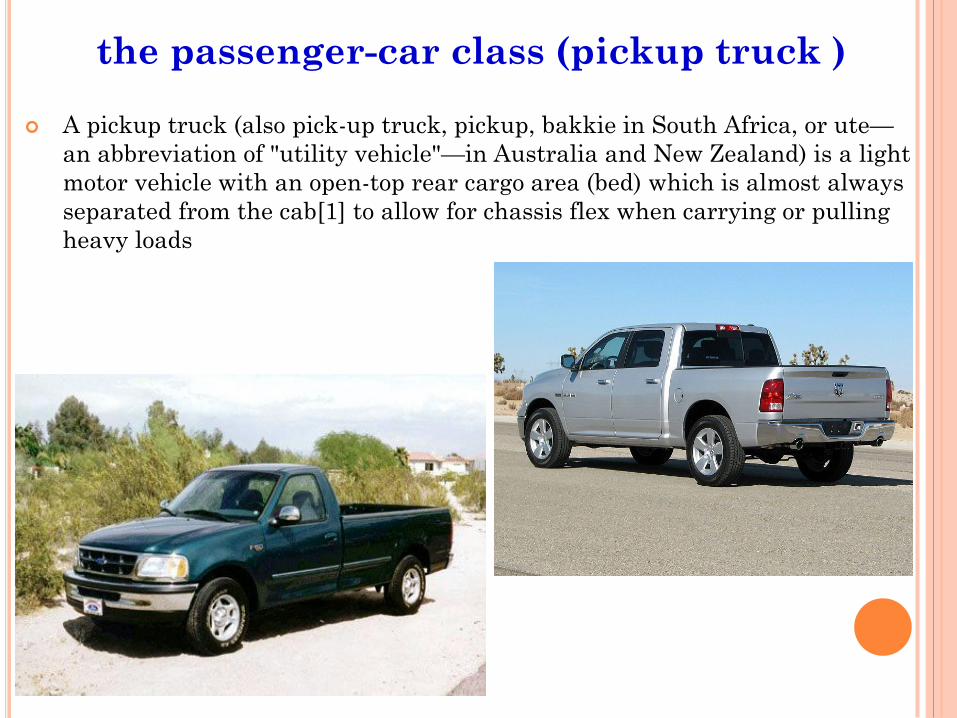
A pickup truck (also pick-up truck, pickup, bakkie in South Africa, or ute—
an abbreviation of "utility vehicle"—in Australia and New Zealand) is a light
motor vehicle with an open-top rear cargo area (bed) which is almost always
separated from the cab[1] to allow for chassis flex when carrying or pulling
heavy loads
the passenger-car class (pickup truck )

A coach (also motor coach) is a large motor vehicle for conveying passengers on excursions and on longer distance express coach scheduled transport between cities - or even between countries.
the Bus class (intercity motor coaches)
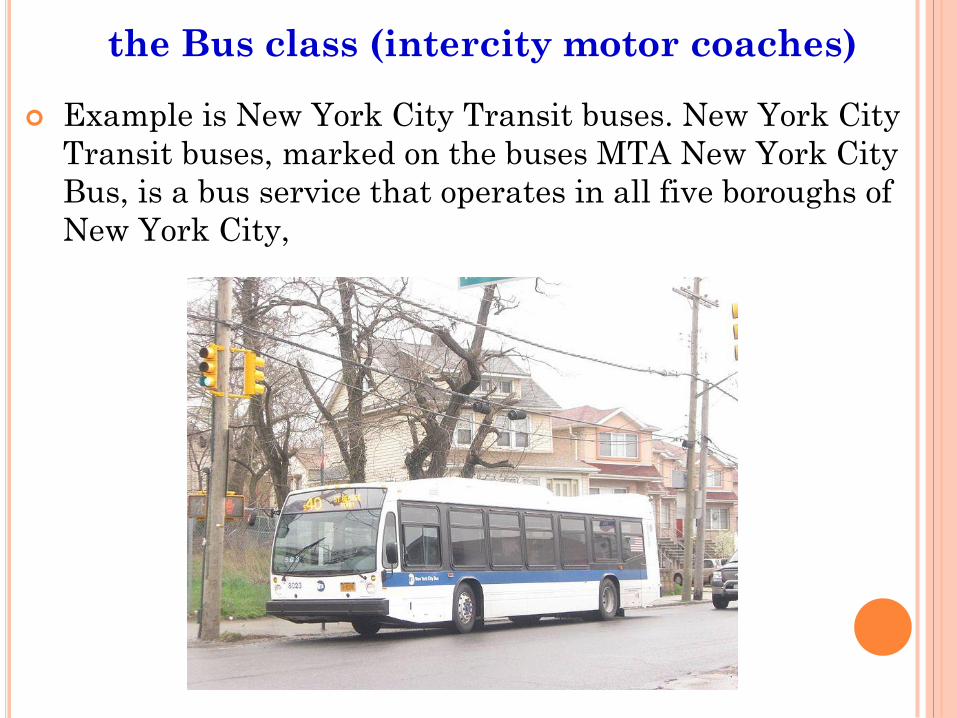
Example is New York City Transit buses. New York City
Transit buses, marked on the buses MTA New York City
Bus, is a bus service that operates in all five boroughs of
New York City,
the Bus class (intercity motor coaches)
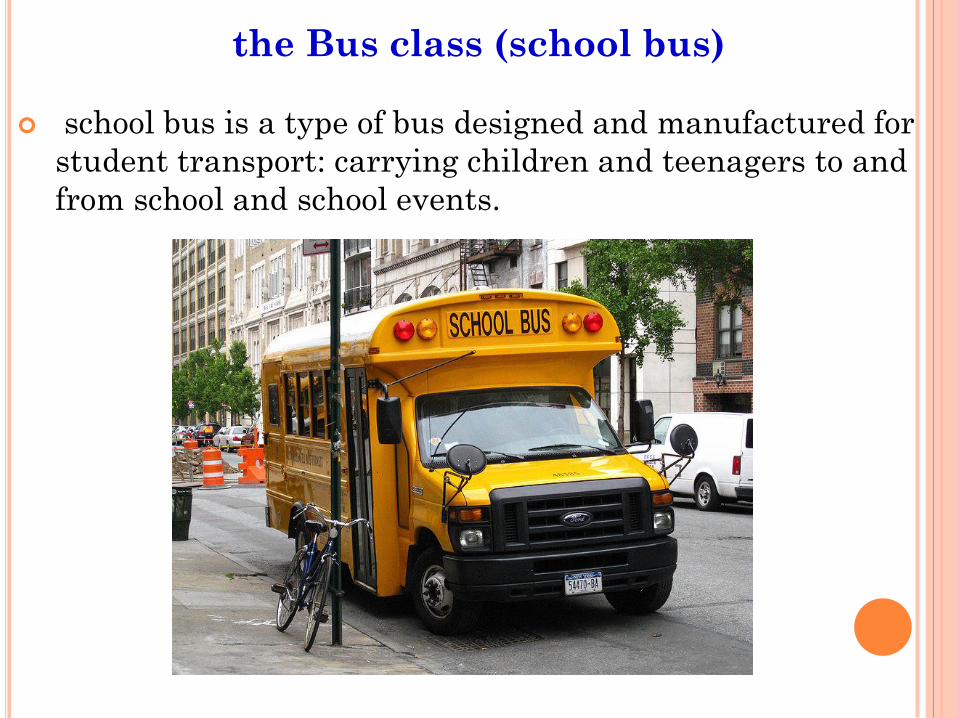
school bus is a type of bus designed and manufactured for
student transport: carrying children and teenagers to and
from school and school events.
the Bus class (school bus)
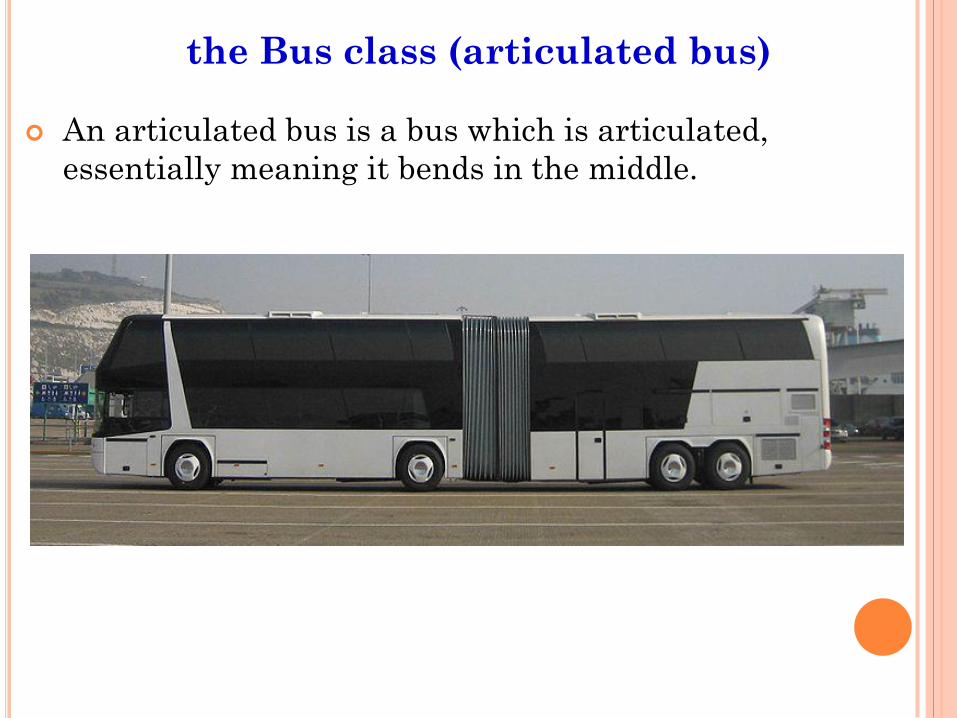
An articulated bus is a bus which is articulated,
essentially meaning it bends in the middle.
the Bus class (articulated bus)
the Truck Class
the Truck Class
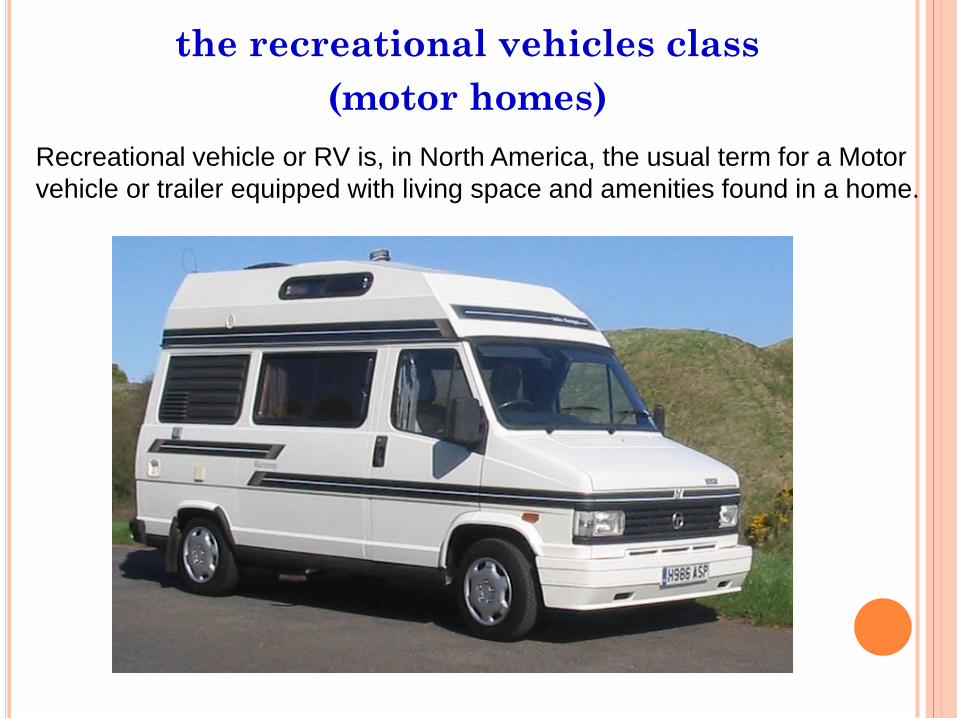
the recreational vehicles class
(motor homes)
Recreational vehicle or RV is, in North America, the usual term for a Motor
vehicle or trailer equipped with living space and amenities found in a home.
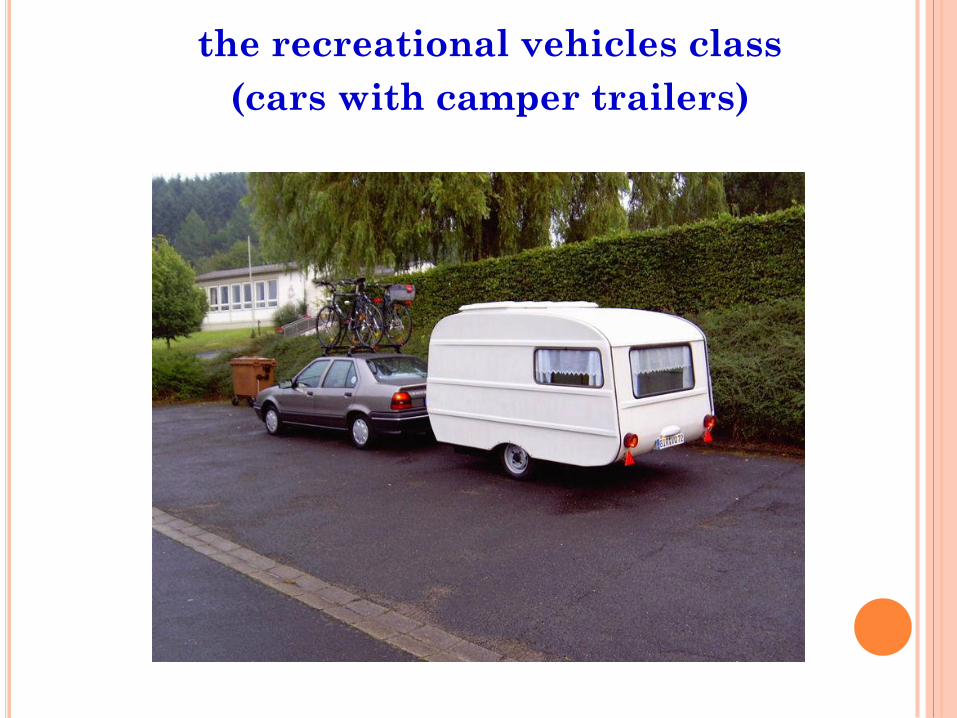
the recreational vehicles class
(cars with camper trailers)
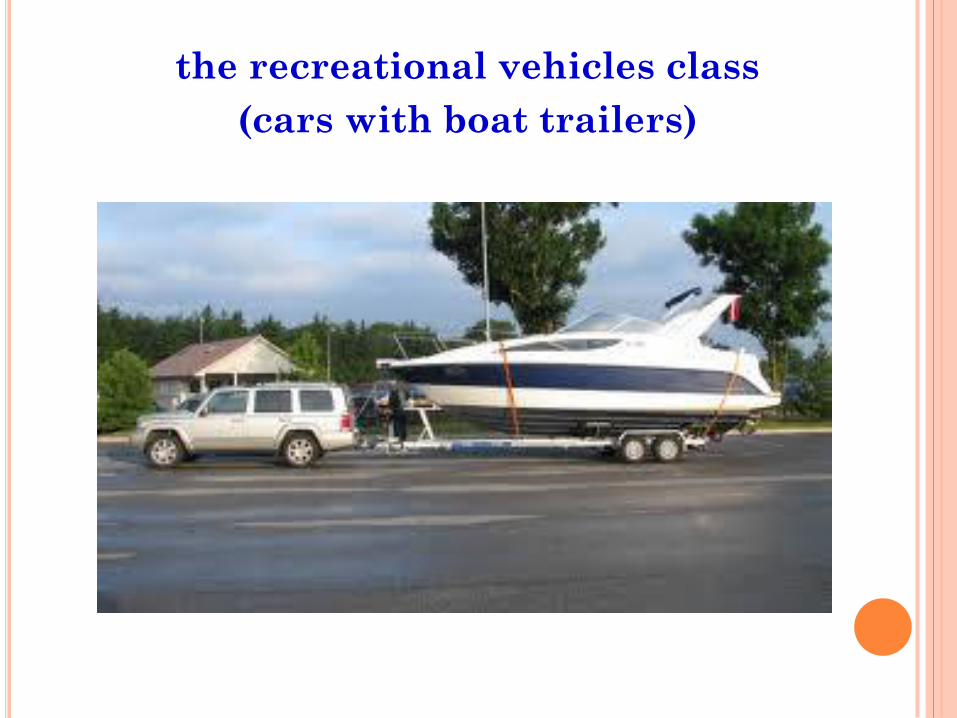
the recreational vehicles class
(cars with boat trailers)
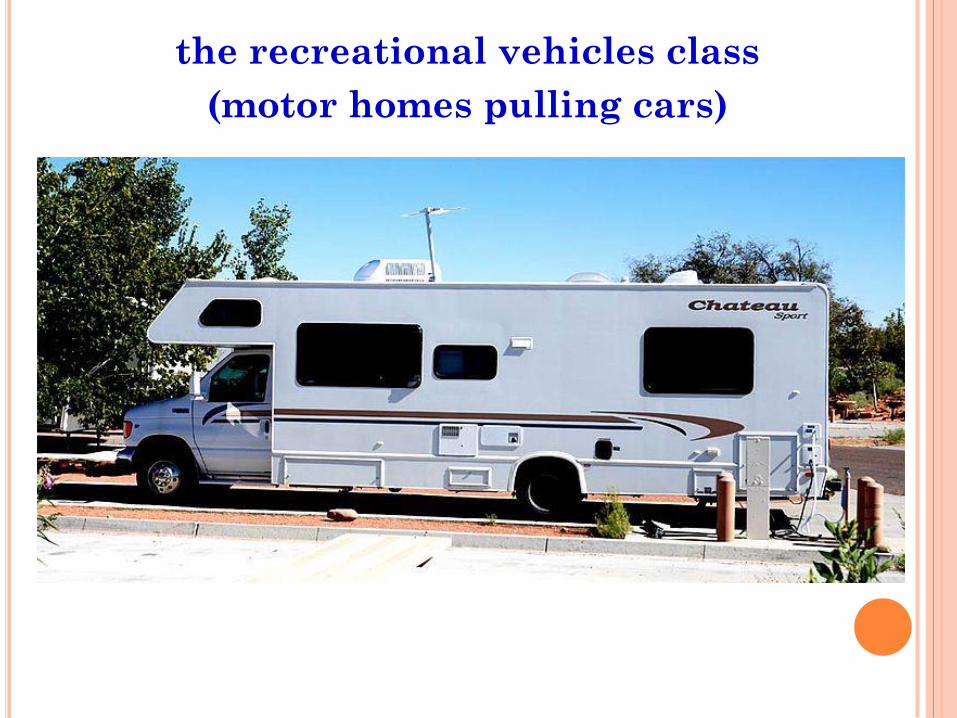
the recreational vehicles class
(motor homes pulling cars)
3.6.1 STATIC CHARACTERISTICS
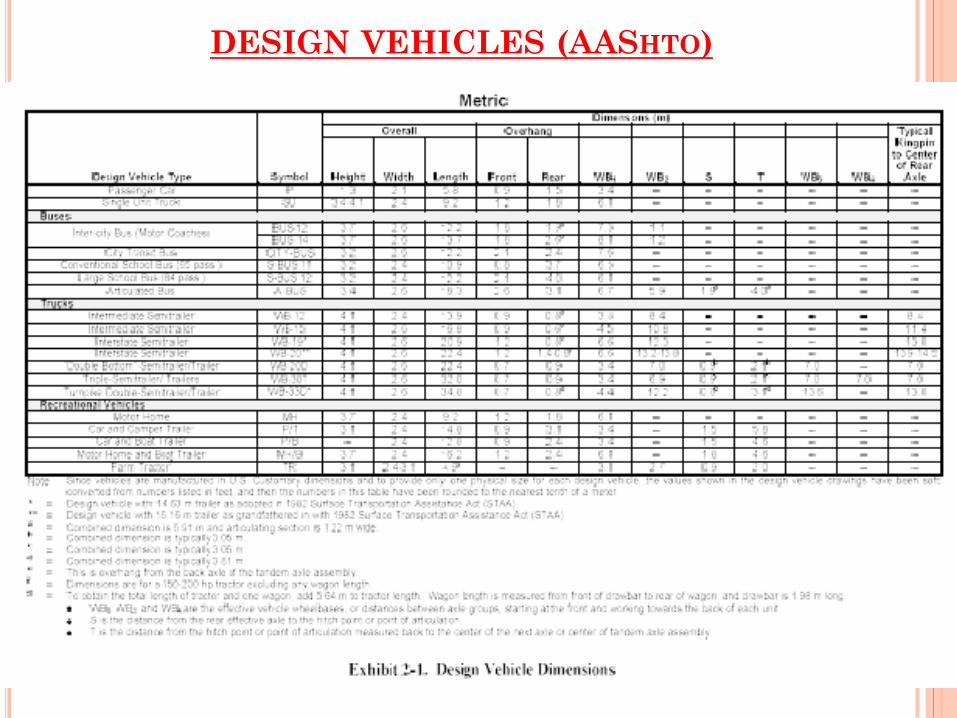
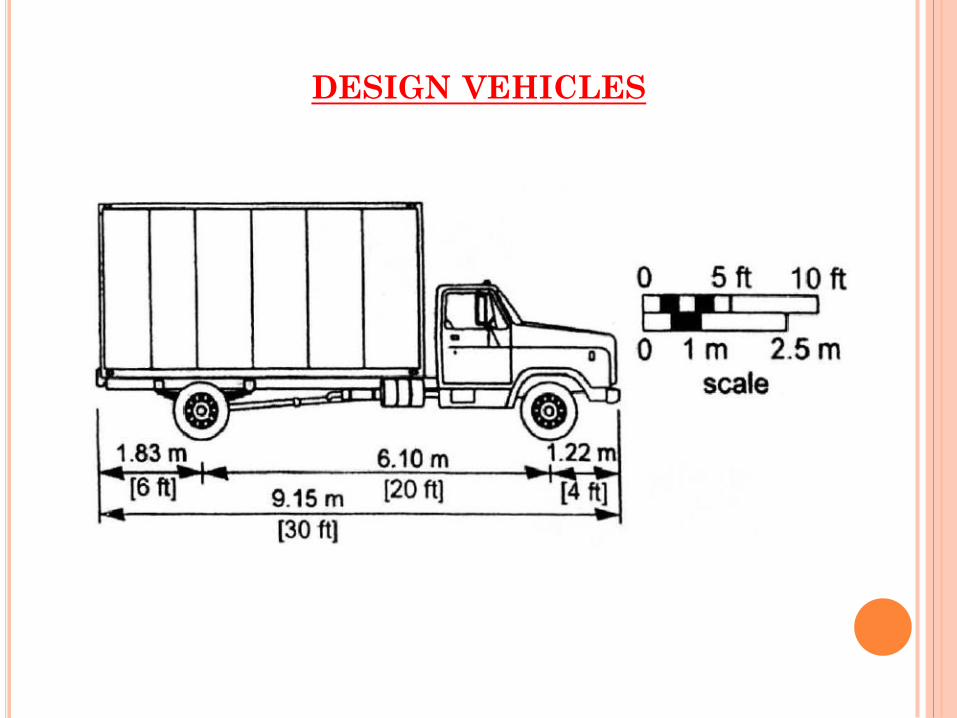
DESIGN VEHICLES
19 different design vehicles have been
selected to represent the different categories
of vehicles within all four classes.
Table 3.2 shows the physical dimensions for
each of these design vehicles, and
Figure 3.1 shows examples of different types
of trucks.
DESIGN VEHICLES

DESIGN VEHICLES
DESIGN VEHICLES (AASHTO)
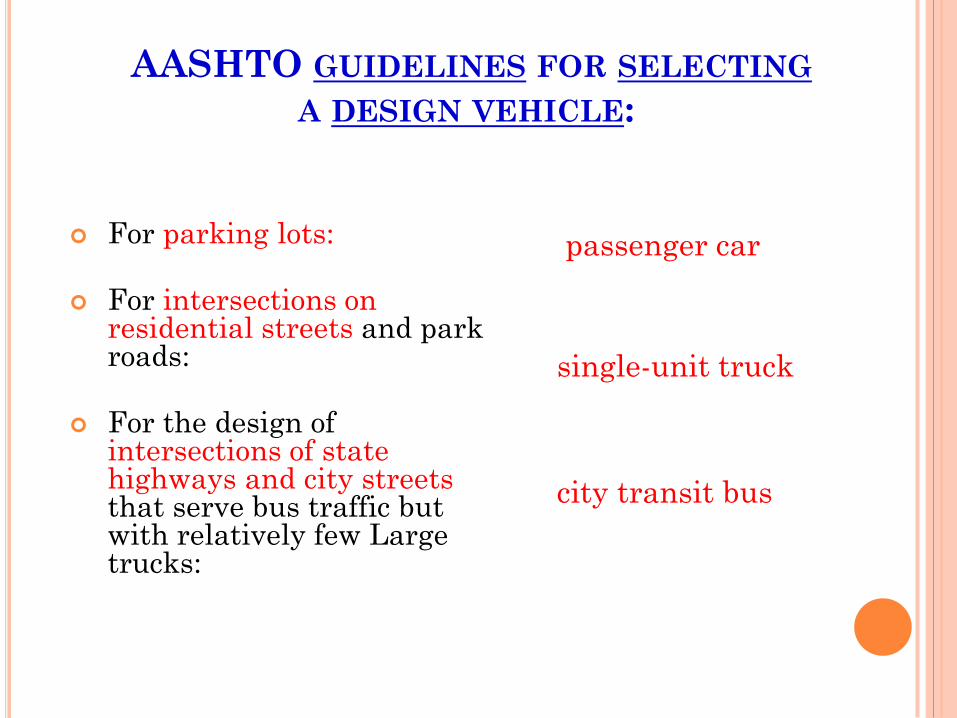
AASHTO GUIDELINES FOR SELECTING
A DESIGN VEHICLE:
For parking lots:
For intersections on residential streets and park roads:
For the design of intersections of state highways and city streets that serve bus traffic but with relatively few Large trucks:
passenger car
single-unit truck
city transit bus
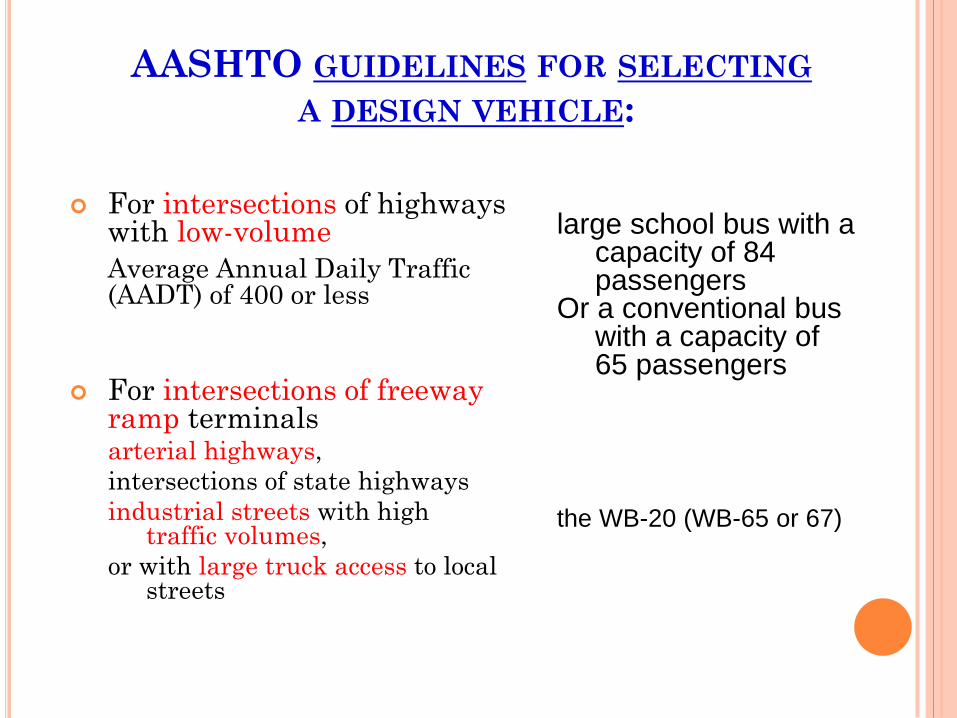
AASHTO GUIDELINES FOR SELECTING
A DESIGN VEHICLE:
For intersections of highways with low-volume
Average Annual Daily Traffic (AADT) of 400 or less
For intersections of freeway ramp terminals arterial highways,
intersections of state highways
industrial streets with high traffic volumes,
or with large truck access to local streets
large school bus with a
capacity of 84 passengers
Or a conventional bus with a capacity of 65 passengers
the WB-20 (WB-65 or 67)
DESIGN VEHICLES
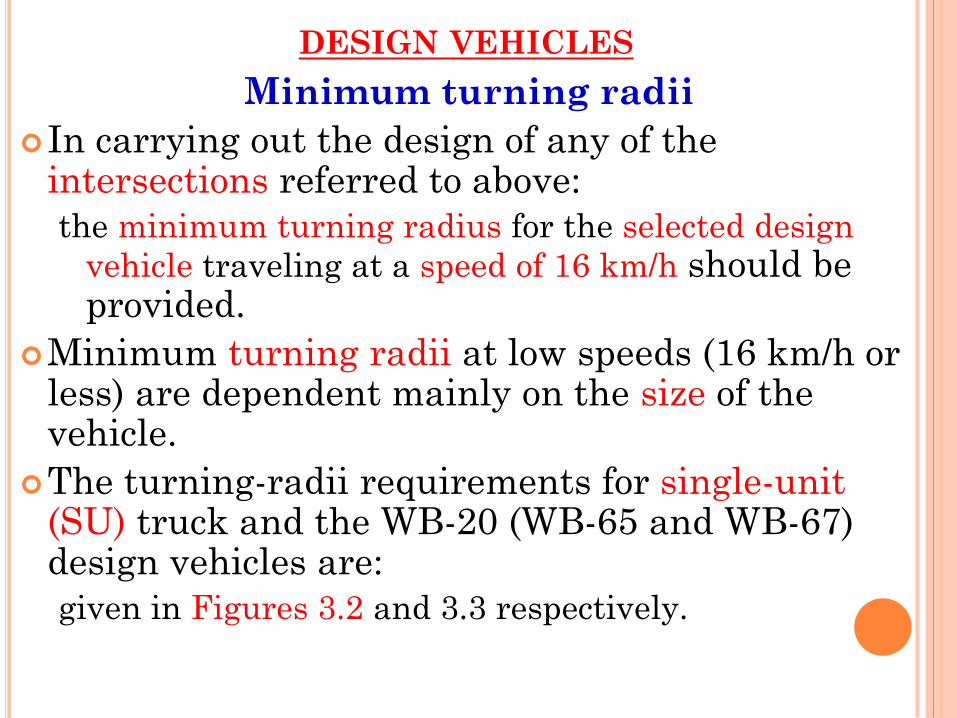
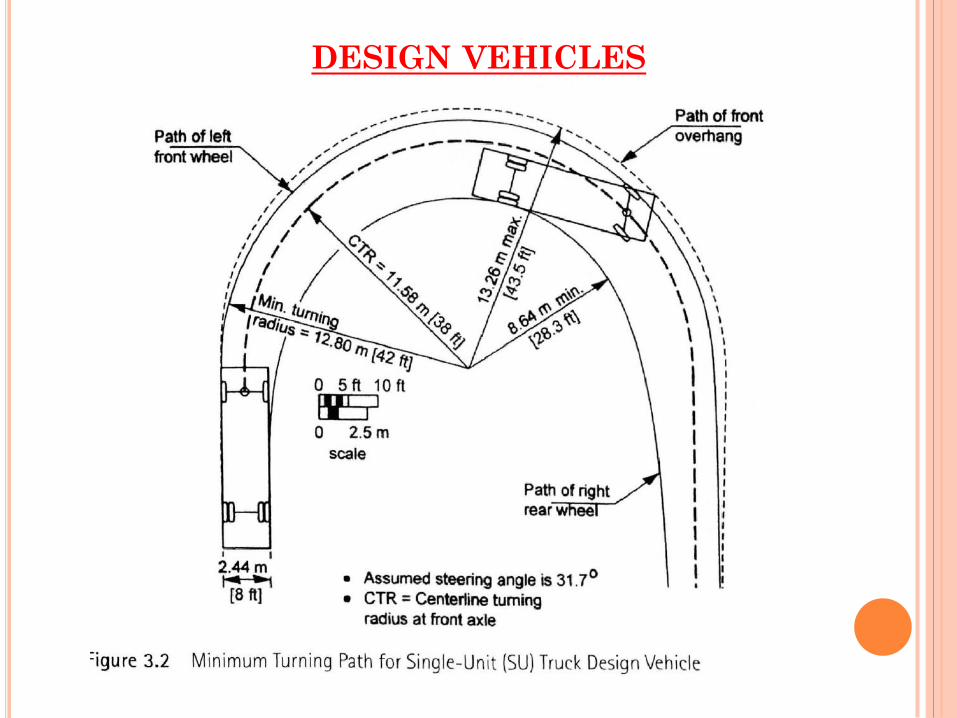
Minimum turning radii
In carrying out the design of any of the intersections referred to above:
the minimum turning radius for the selected design
vehicle traveling at a speed of 16 km/h should be provided.
Minimum turning radii at low speeds (16 km/h or less) are dependent mainly on the size of the vehicle.
The turning-radii requirements for single-unit (SU) truck and the WB-20 (WB-65 and WB-67) design vehicles are:
given in Figures 3.2 and 3.3 respectively.
DESIGN VEHICLES
DESIGN VEHICLES
DESIGN VEHICLES
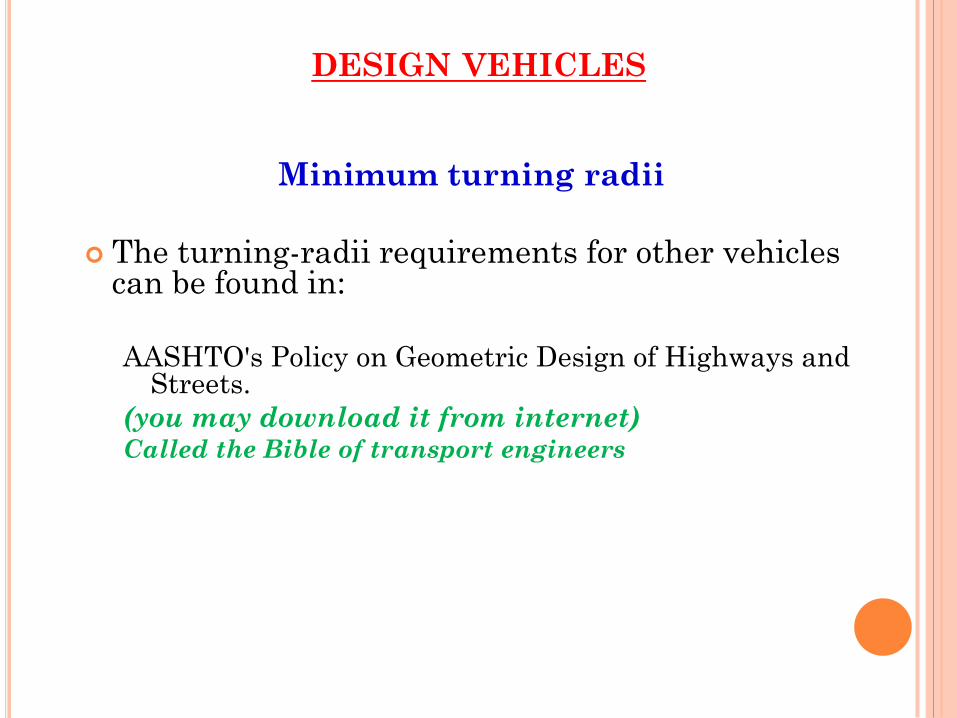
Minimum turning radii
The turning-radii requirements for other vehicles can be found in:
AASHTO's Policy on Geometric Design of Highways and
Streets.
(you may download it from internet) Called the Bible of transport engineers
3.6.2 KINEMATIC CHARACTERISTICS
Definition
kinematic characteristics involve the motion
of the vehicle without considering the forces
that cause the motion.
The primary element among kinematic
characteristics is the acceleration capability
of the vehicle
3.6.2 KINEMATIC CHARACTERISTICS
Importance
Acceleration capability is important in:
several traffic operations such as:
passing maneuvers and gap acceptance.
the dimensioning of highway features such as:
freeway ramps and passing lanes
determining the forces that cause motion.
.
3.6.2 KINEMATIC CHARACTERISTICS
Mathematical relationships
The study of the kinematic characteristics of the
vehicle primarily involves:
a study of how acceleration rates influence the
elements of motion, such as velocity and distance.
Review the mathematical relationships among
acceleration, velocity, distance, and time.
3.6.2 KINEMATIC CHARACTERISTICS
Acceleration Assumed Constant
Two cases are of interest:
1. acceleration is assumed constant;
2. acceleration is a function of velocity.
3.6.2 KINEMATIC CHARACTERISTICS
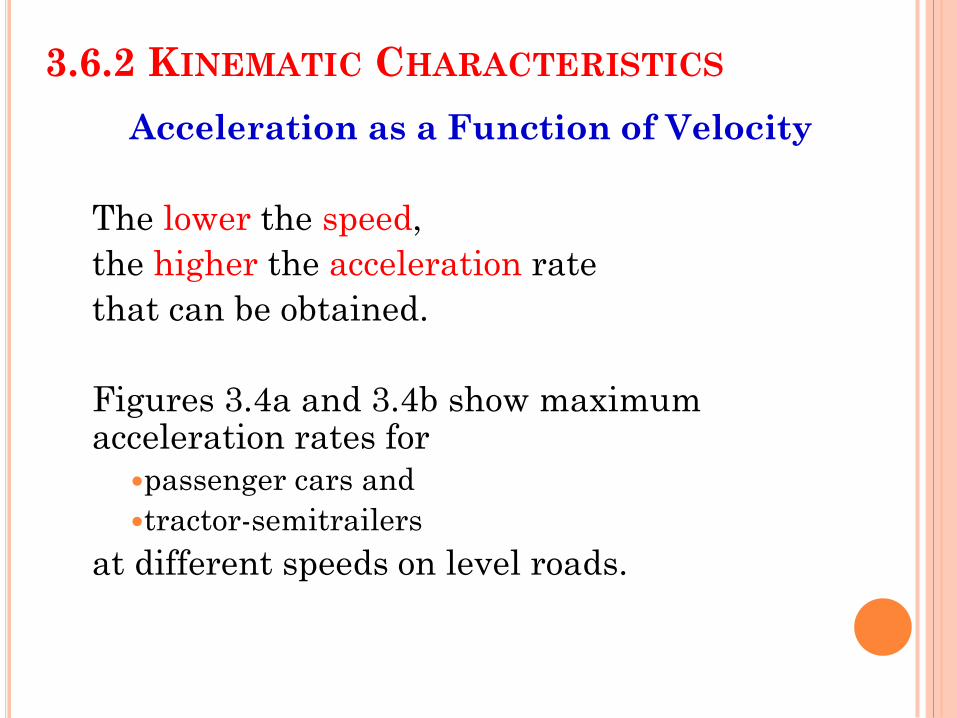
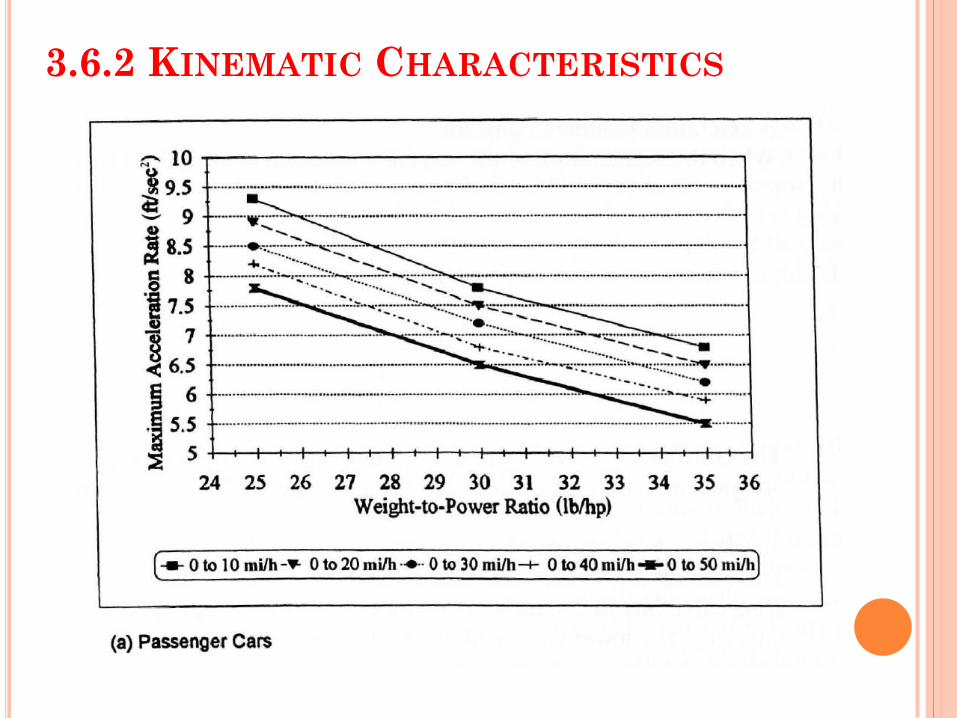
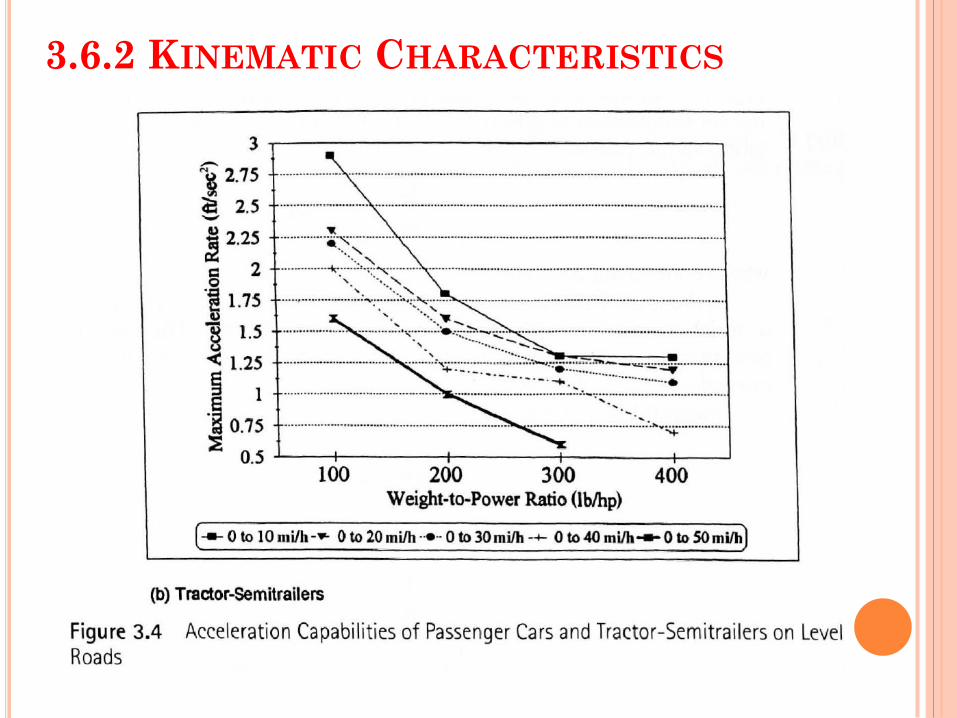
Acceleration as a Function of Velocity
The lower the speed,
the higher the acceleration rate
that can be obtained.
Figures 3.4a and 3.4b show maximum acceleration rates for
passenger cars and
tractor-semitrailers
at different speeds on level roads.
3.6.2 KINEMATIC CHARACTERISTICS
3.6.2 KINEMATIC CHARACTERISTICS
3.6.3 DYNAMIC CHARACTERISTICS
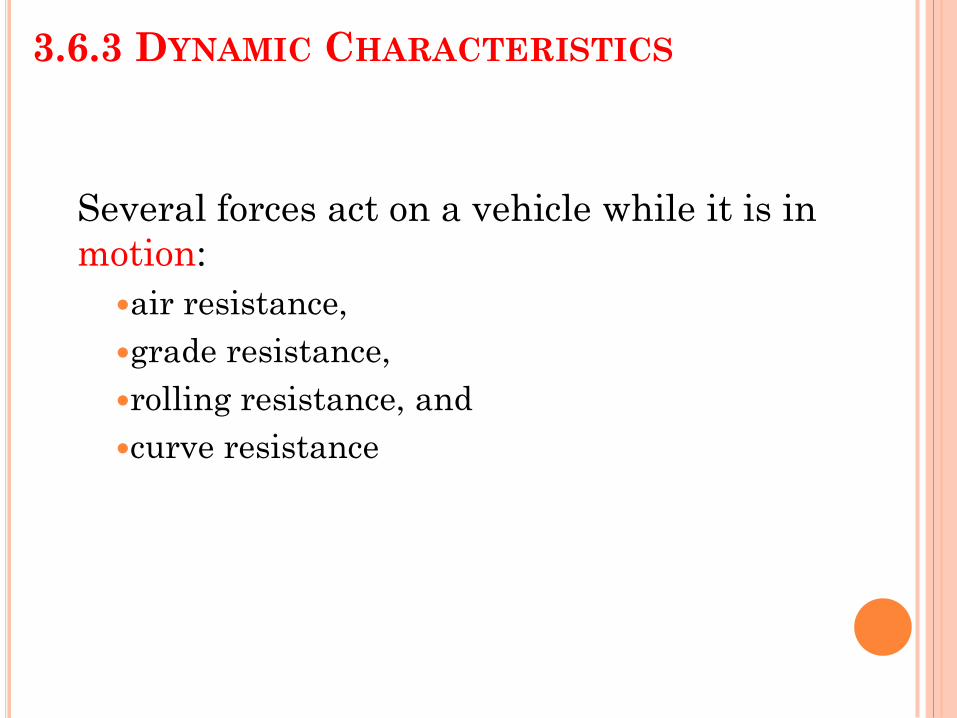
Several forces act on a vehicle while it is in
motion:
air resistance,
grade resistance,
rolling resistance, and
curve resistance
3.6.3 DYNAMIC CHARACTERISTICS
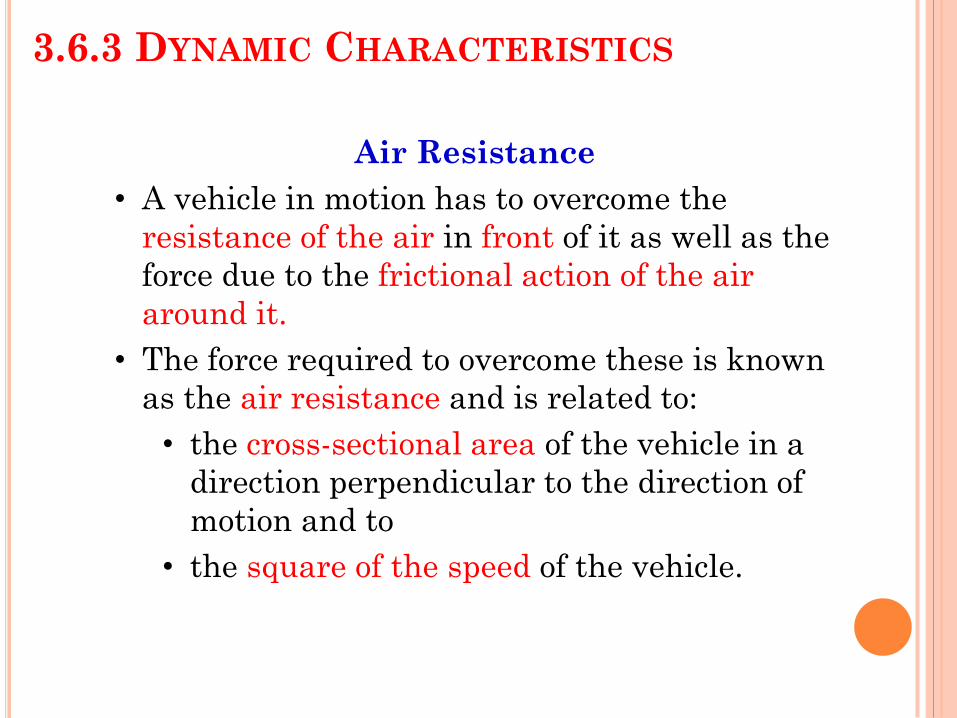
Air Resistance
• A vehicle in motion has to overcome the
resistance of the air in front of it as well as the
force due to the frictional action of the air
around it.
• The force required to overcome these is known
as the air resistance and is related to:
• the cross-sectional area of the vehicle in a
direction perpendicular to the direction of
motion and to
• the square of the speed of the vehicle.
3.6.3 DYNAMIC CHARACTERISTICS
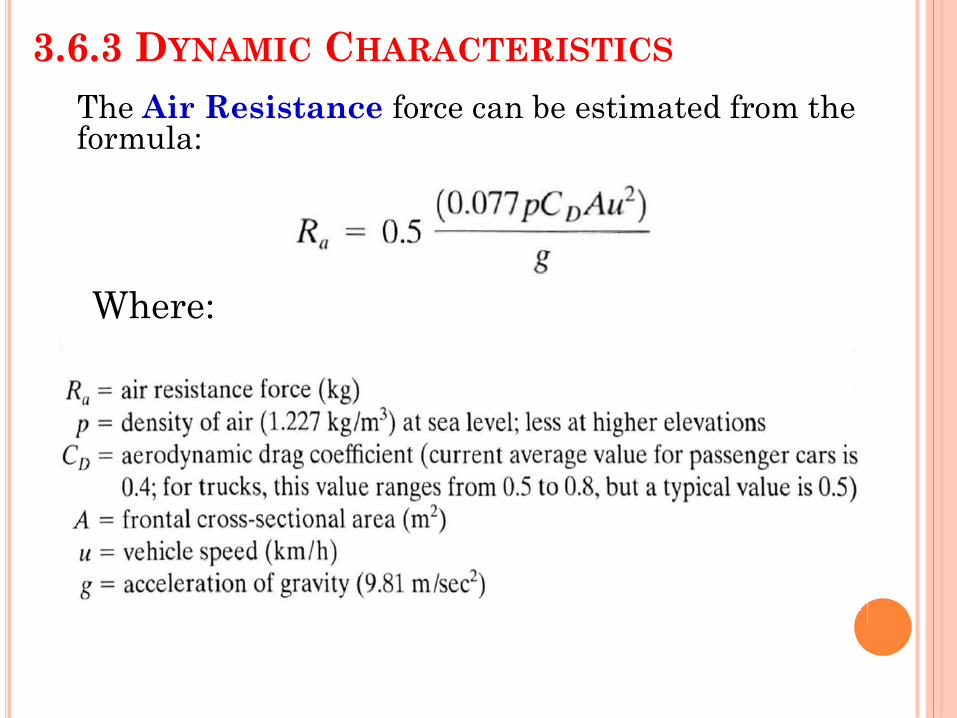
The Air Resistance force can be estimated from the formula:
Where:
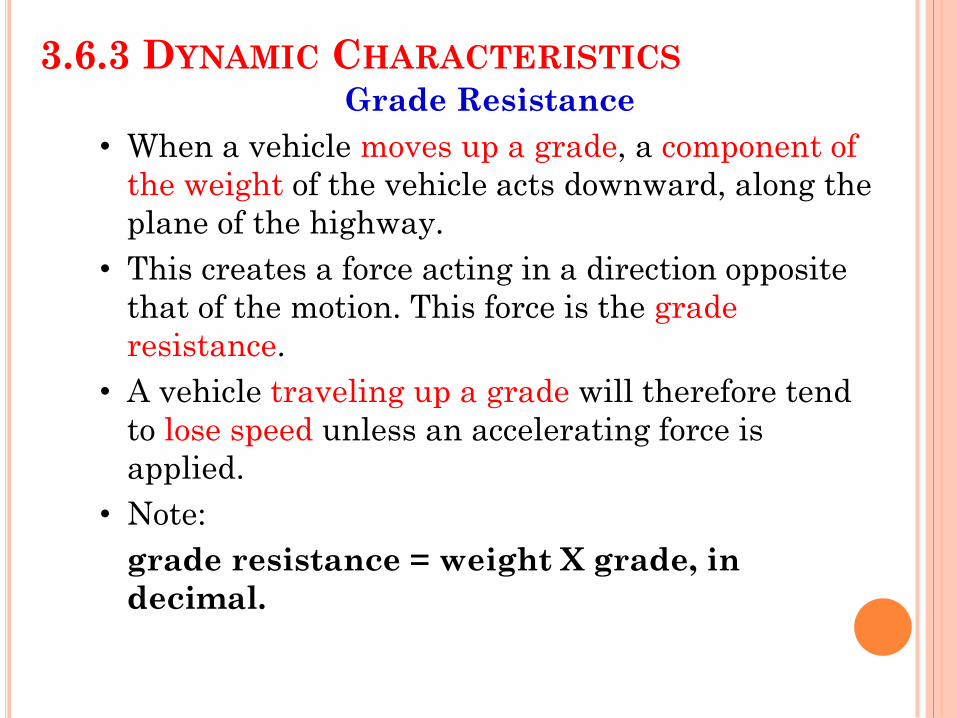
3.6.3 DYNAMIC CHARACTERISTICS Grade Resistance
• When a vehicle moves up a grade, a component of
the weight of the vehicle acts downward, along the
plane of the highway.
• This creates a force acting in a direction opposite
that of the motion. This force is the grade
resistance.
• A vehicle traveling up a grade will therefore tend
to lose speed unless an accelerating force is
applied.
• Note:
grade resistance = weight X grade, in
decimal.
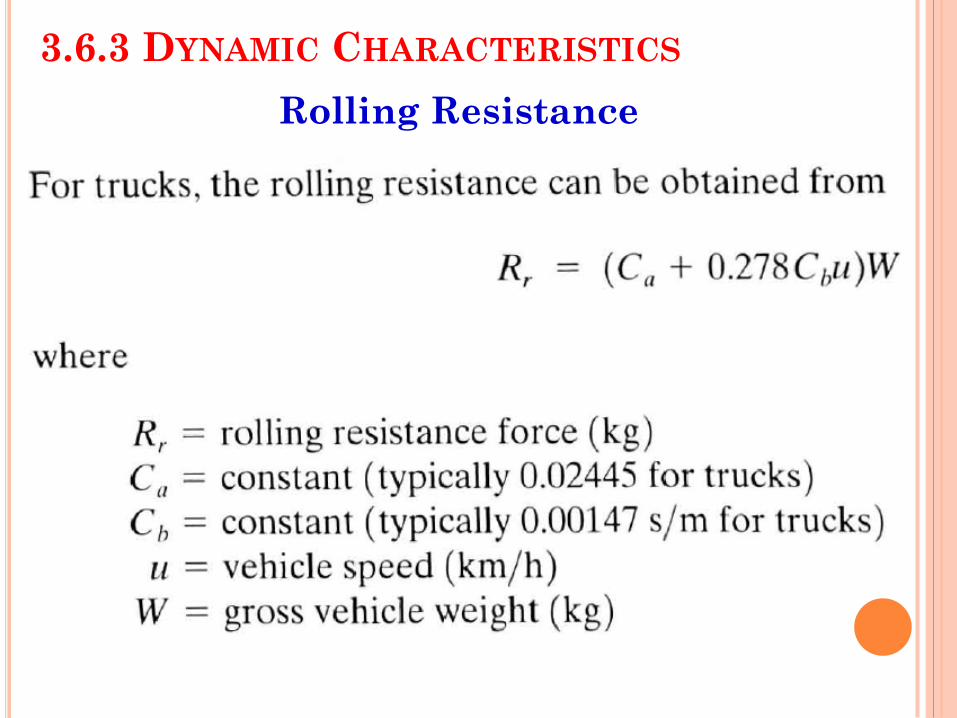
3.6.3 DYNAMIC CHARACTERISTICS Rolling Resistance
• There are forces within the vehicle itself that offer
resistance to motion.
• These forces are due mainly to:
• frictional effect on moving parts of the vehicle,
• frictional slip between the pavement surface and the tires.
• The sum effect of these forces on motion is known as
rolling resistance.
• It depends on:
the speed of the vehicle and the type of pavement.
• Rolling forces are relatively lower on smooth
pavements than on rough pavements.
3.6.3 DYNAMIC CHARACTERISTICS
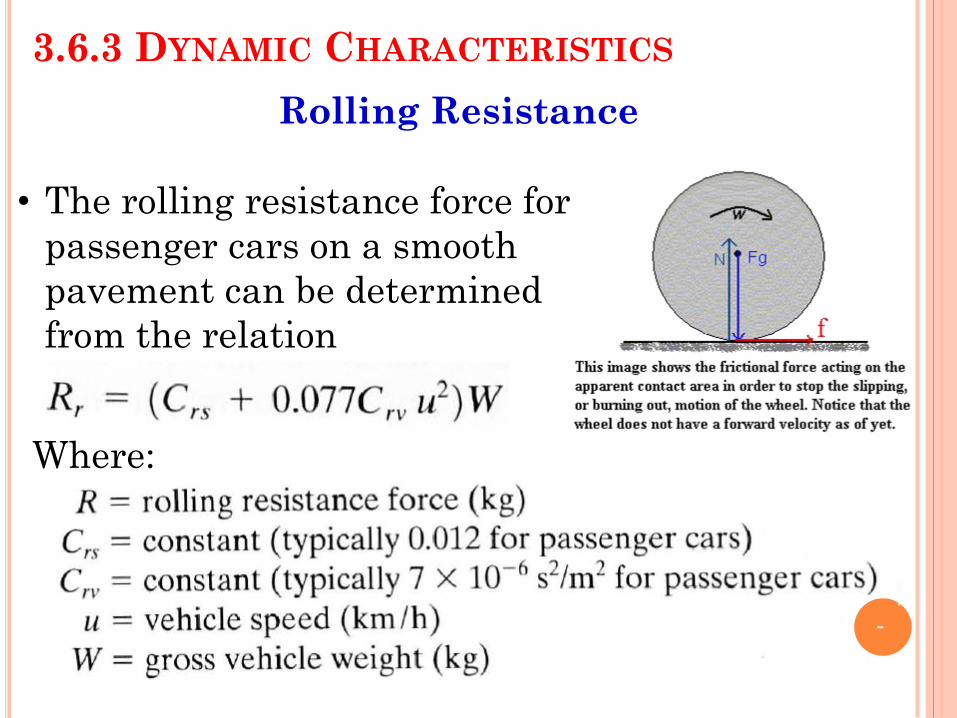
Rolling Resistance
• The rolling resistance force for
passenger cars on a smooth
pavement can be determined
from the relation
Where:
3.6.3 DYNAMIC CHARACTERISTICS
Rolling Resistance
3.6.3 DYNAMIC CHARACTERISTICS
Curve Resistance
• When a passenger car is maneuvered to take a
curve, external forces act on the front wheels of
the vehicle.
• These forces have components that have a
retarding effect on the forward motion of the
vehicle.
• The sum effect of these components constitutes
the curve resistance.
• This resistance depends on the radius of the
curve, the gross weight of the vehicle, and the
velocity at which the vehicle is moving.
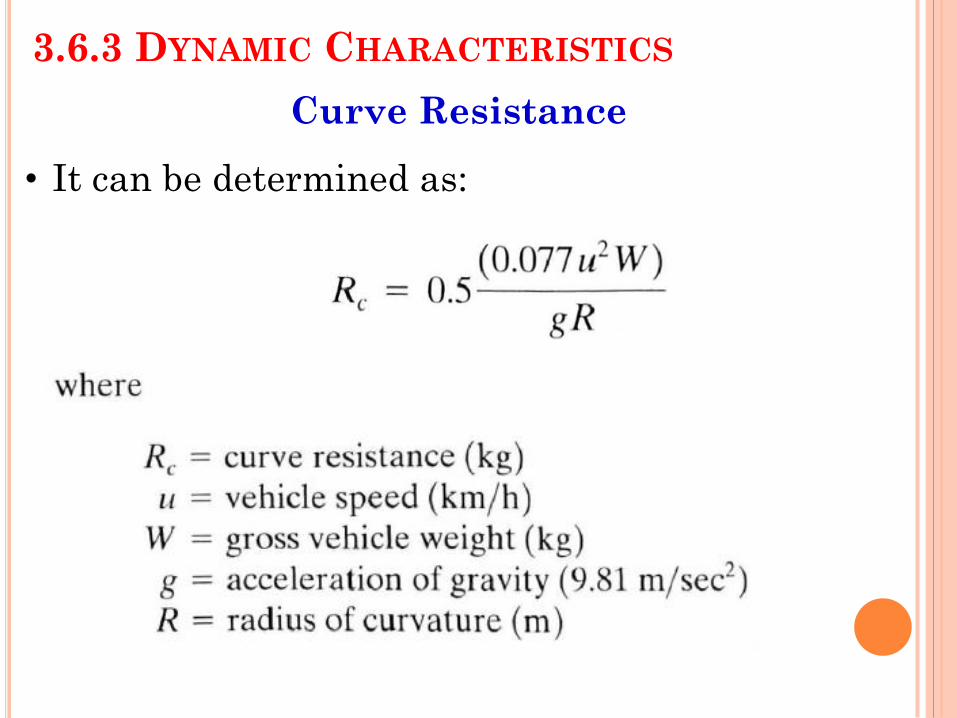
3.6.3 DYNAMIC CHARACTERISTICS
Curve Resistance
• It can be determined as:
3.6.3 DYNAMIC CHARACTERISTICS
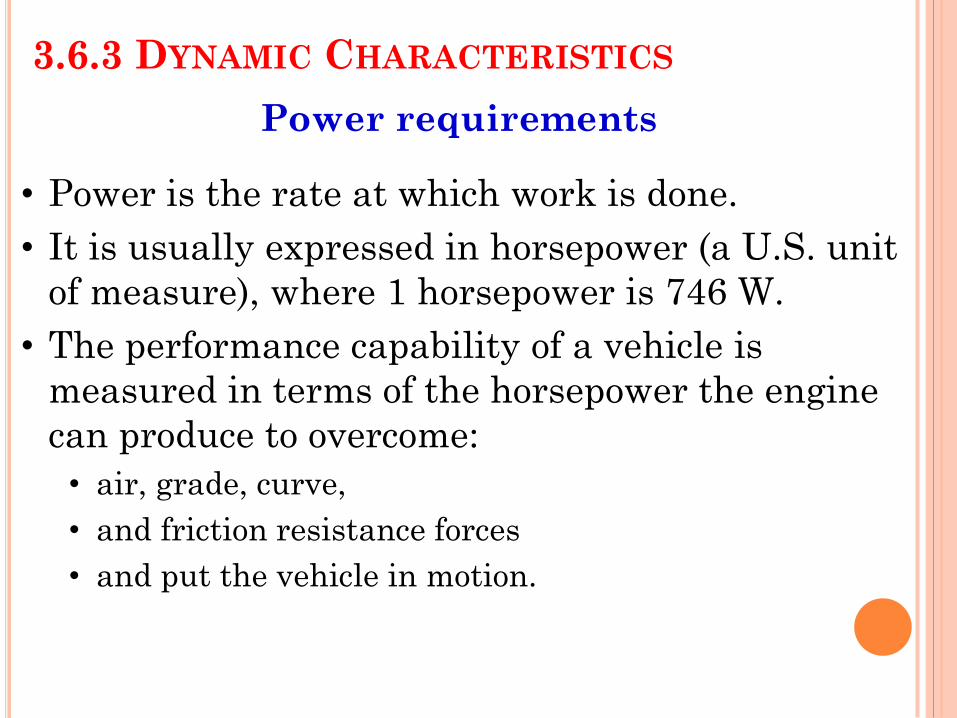
Power requirements
• Power is the rate at which work is done.
• It is usually expressed in horsepower (a U.S. unit
of measure), where 1 horsepower is 746 W.
• The performance capability of a vehicle is
measured in terms of the horsepower the engine
can produce to overcome:
• air, grade, curve,
• and friction resistance forces
• and put the vehicle in motion.
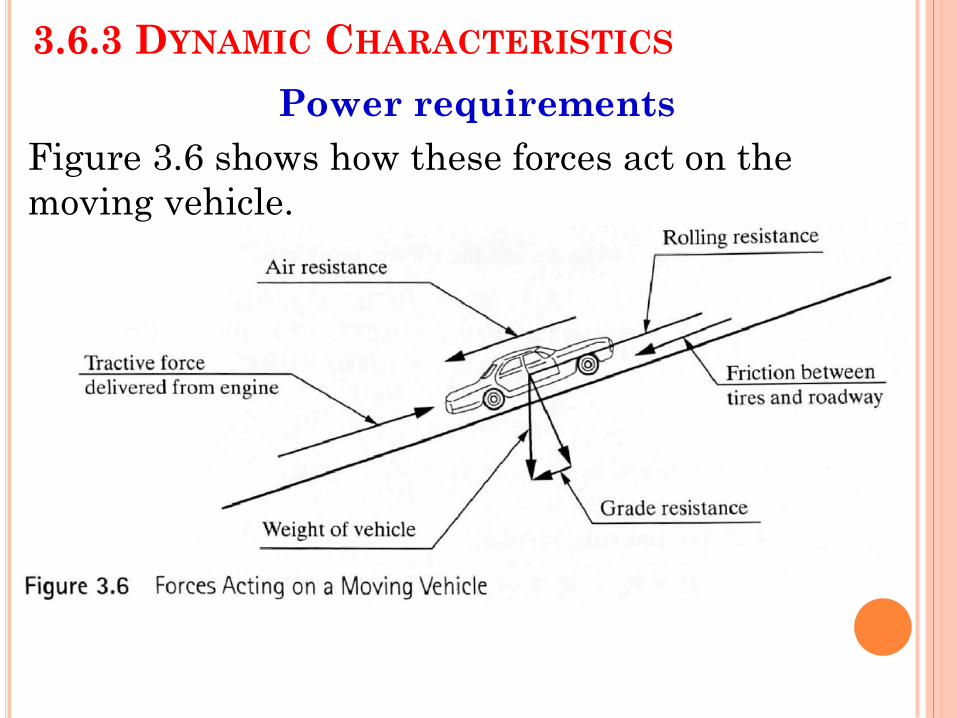
3.6.3 DYNAMIC CHARACTERISTICS
Power requirements
Figure 3.6 shows how these forces act on the
moving vehicle.
3.6.3 DYNAMIC CHARACTERISTICS
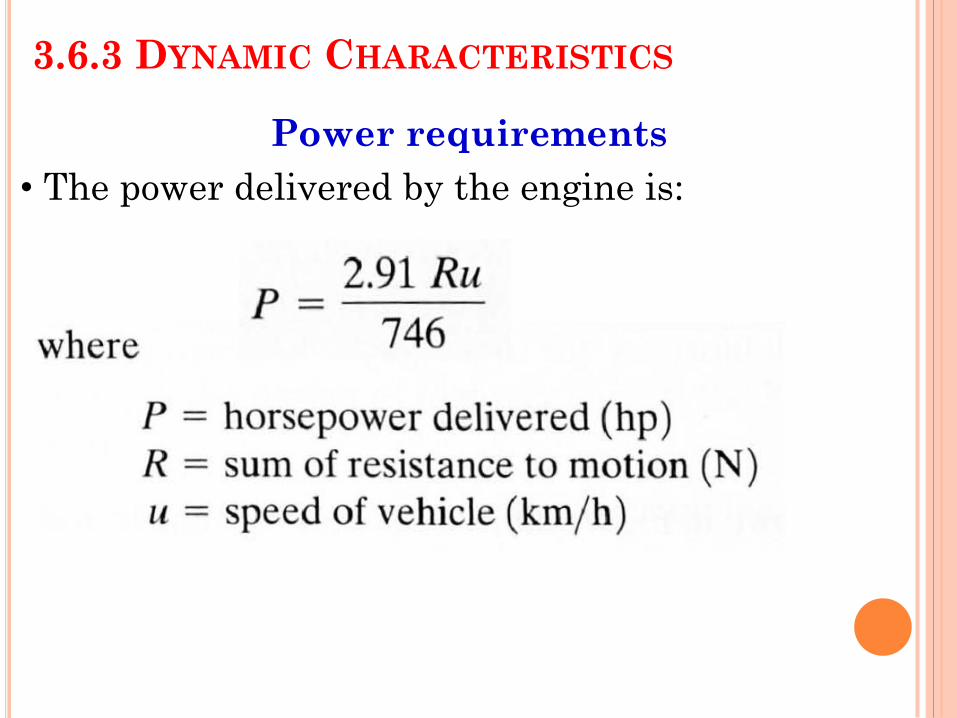
Power requirements
• The power delivered by the engine is:
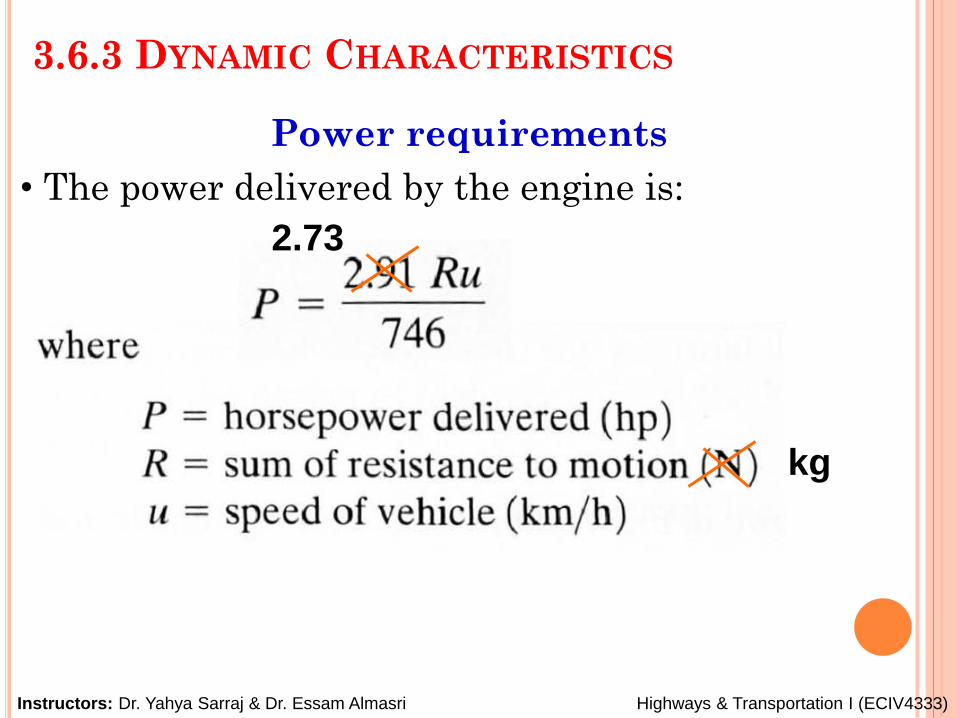
3.6.3 DYNAMIC CHARACTERISTICS
Power requirements
• The power delivered by the engine is:
Instructors: Dr. Yahya Sarraj & Dr. Essam Almasri Highways & Transportation I (ECIV4333)
2.73
kg
3.6.3 DYNAMIC CHARACTERISTICS
Solve the following question?
Example 3.4 Vehicle Horsepower Required to
Overcome Resistance Forces:
Determine the horsepower produced by a
passenger car traveling at a speed of 105 km/h on
a straight road of 5% grade with a smooth
pavement.
Assume the weight of the car is 1800 kg and the
cross-sectional area of the car is 3.8 m2.
EXAMPLE 3.4
SOLUTION
R = air resistance
+ rolling resistances
+ upgrade resistance
+ curve resistance
EXAMPLE 3.4
SOLUTION
3.6.3 DYNAMIC CHARACTERISTICS
Braking distance
• The action of the forces (shown in Figure 3.6) on
the moving vehicle and the effect of perception-
reaction time are used to determine:
• the braking distance of a vehicle and
• the minimum radius of a circular curve for a
vehicle traveling with speed (u) > 16 km/h.
3.6.3 DYNAMIC CHARACTERISTICS
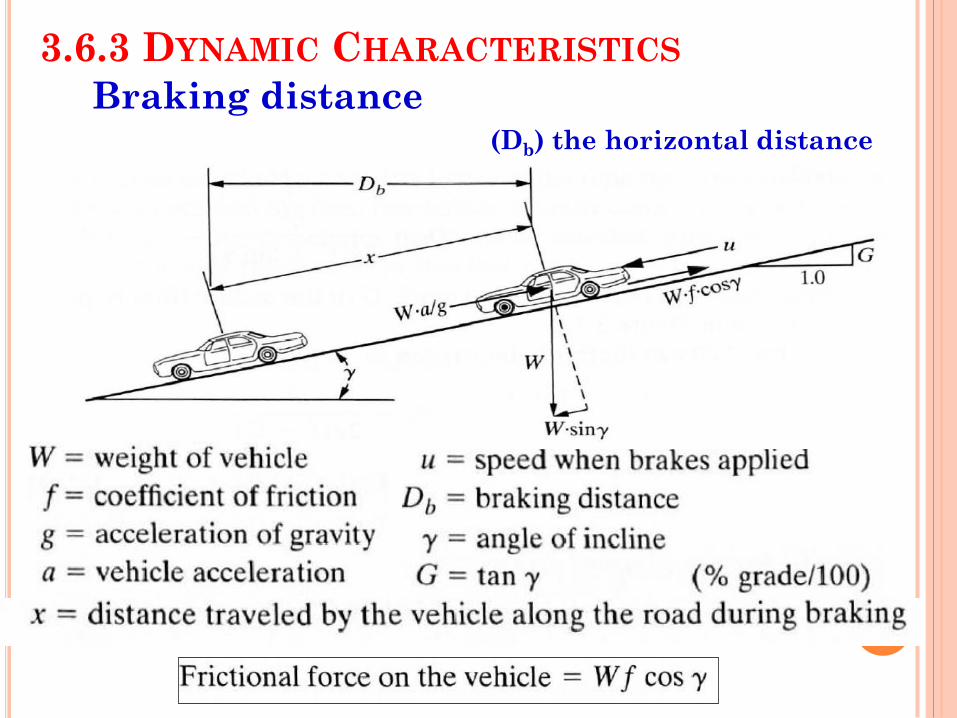
Braking distance (Db) the horizontal distance
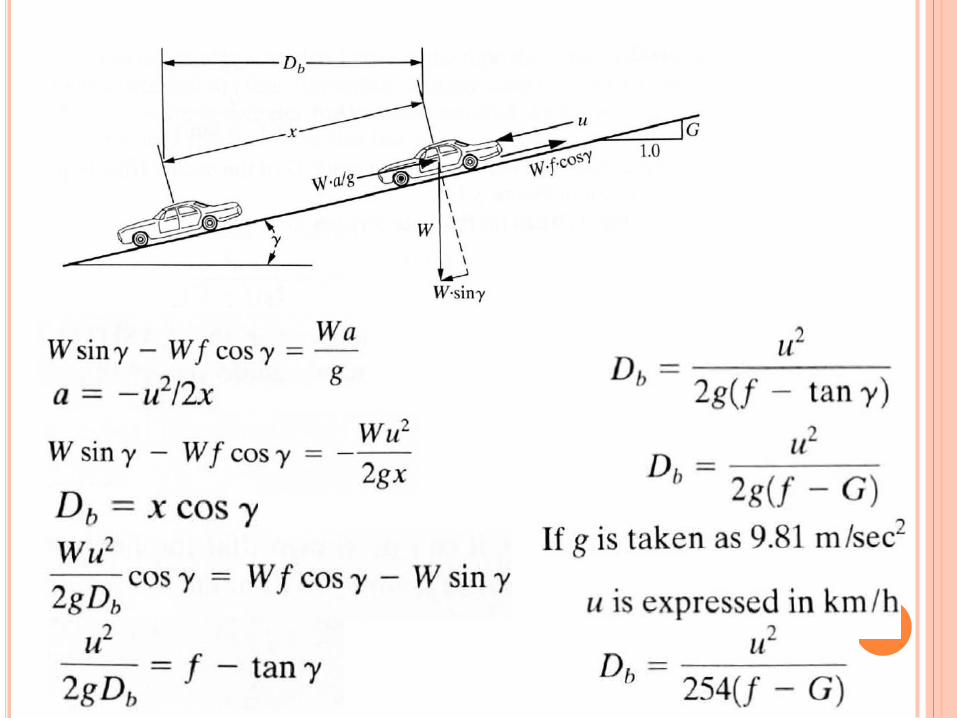
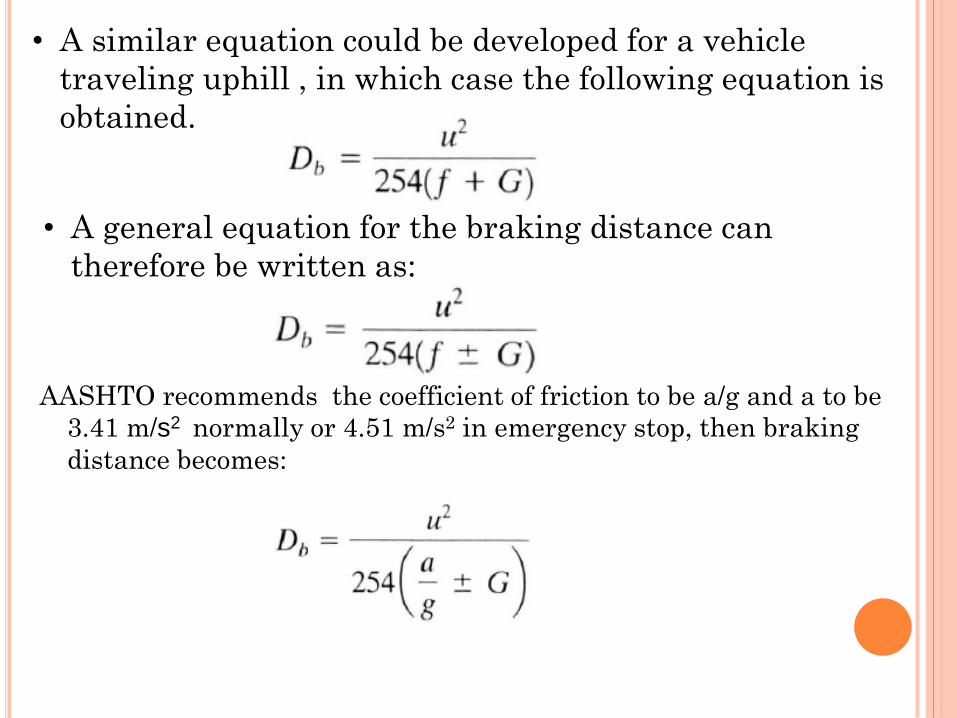
• A similar equation could be developed for a vehicle
traveling uphill , in which case the following equation is
obtained.
• A general equation for the braking distance can
therefore be written as:
AASHTO recommends the coefficient of friction to be a/g and a to be
3.41 m/s2 normally or 4.51 m/s2 in emergency stop, then braking
distance becomes:
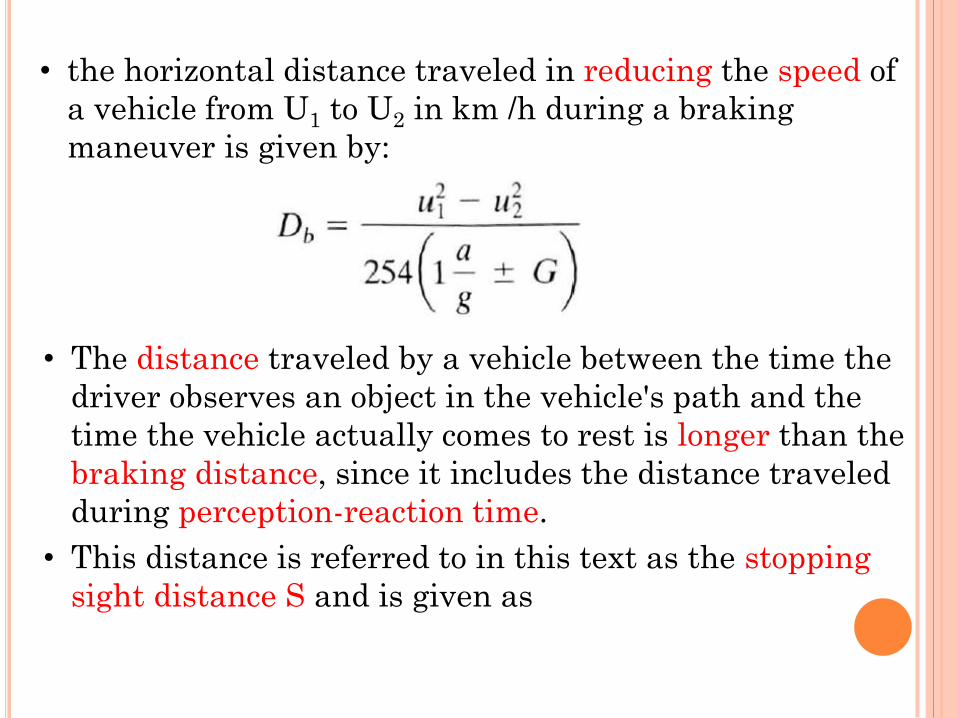
• the horizontal distance traveled in reducing the speed of
a vehicle from U1 to U2 in km /h during a braking
maneuver is given by:
• The distance traveled by a vehicle between the time the
driver observes an object in the vehicle's path and the
time the vehicle actually comes to rest is longer than the
braking distance, since it includes the distance traveled
during perception-reaction time.
• This distance is referred to in this text as the stopping
sight distance S and is given as
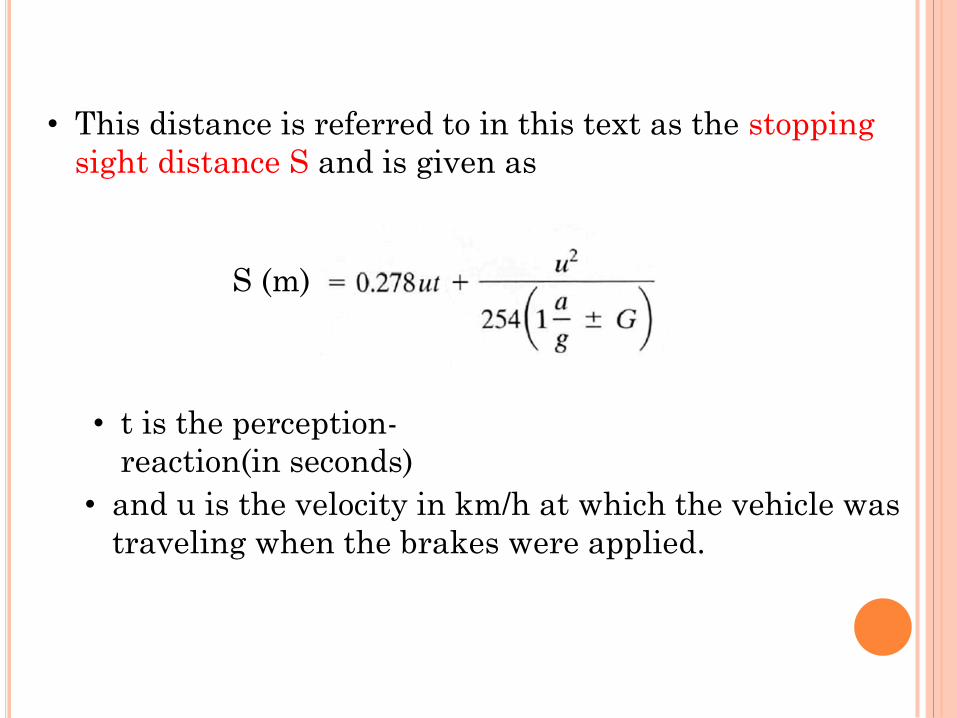
S (m)
• and u is the velocity in km/h at which the vehicle was
traveling when the brakes were applied.
• This distance is referred to in this text as the stopping
sight distance S and is given as
• t is the perception-
reaction(in seconds)
3.6.3 DYNAMIC CHARACTERISTICS
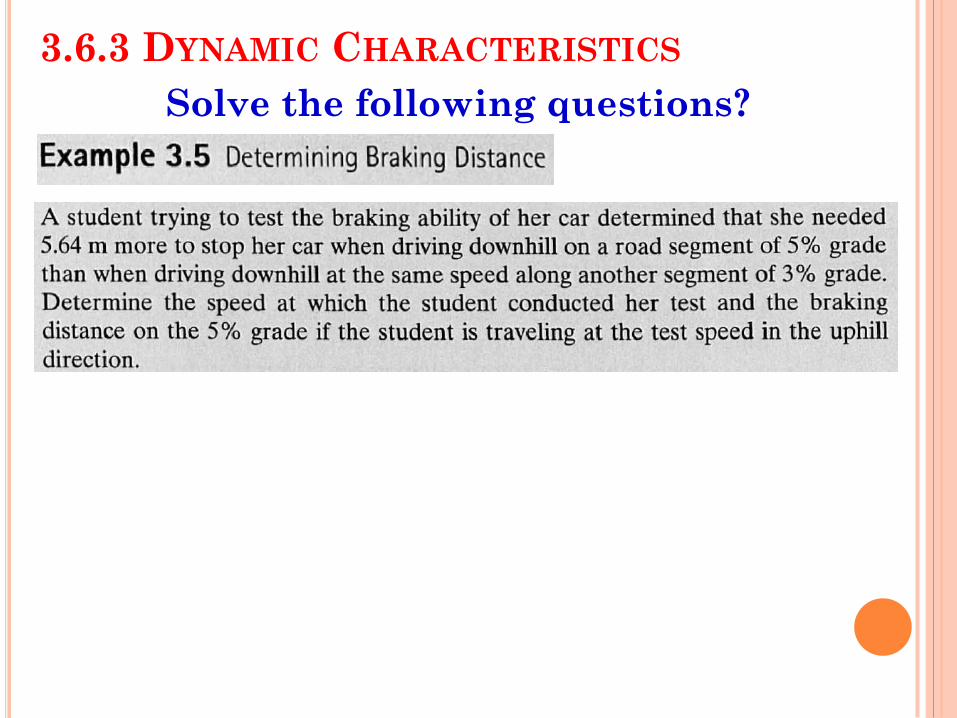
Solve the following questions?
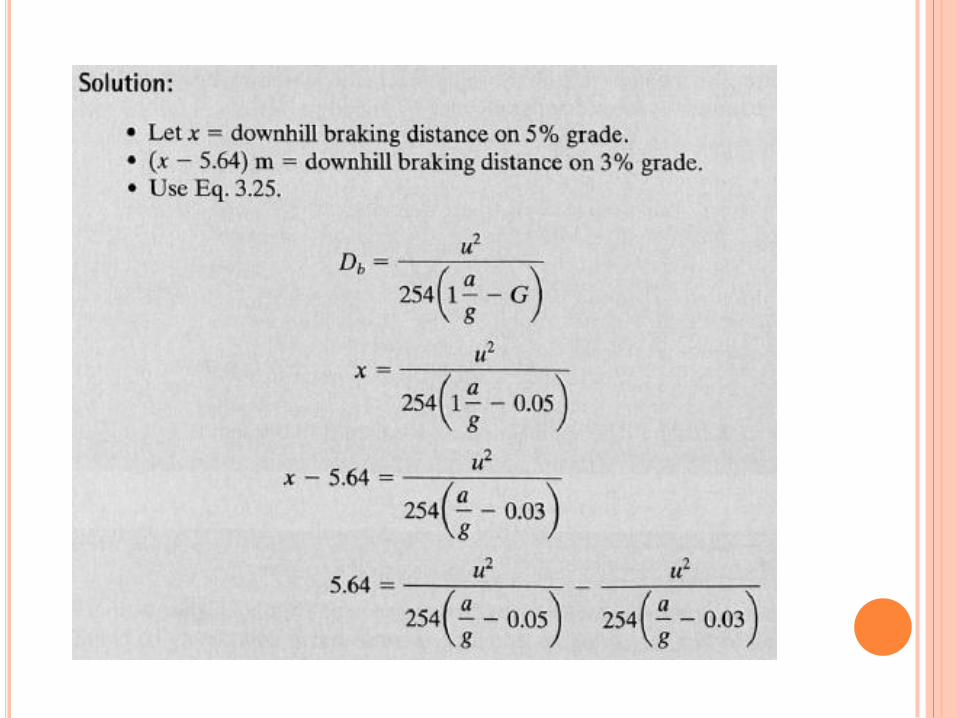
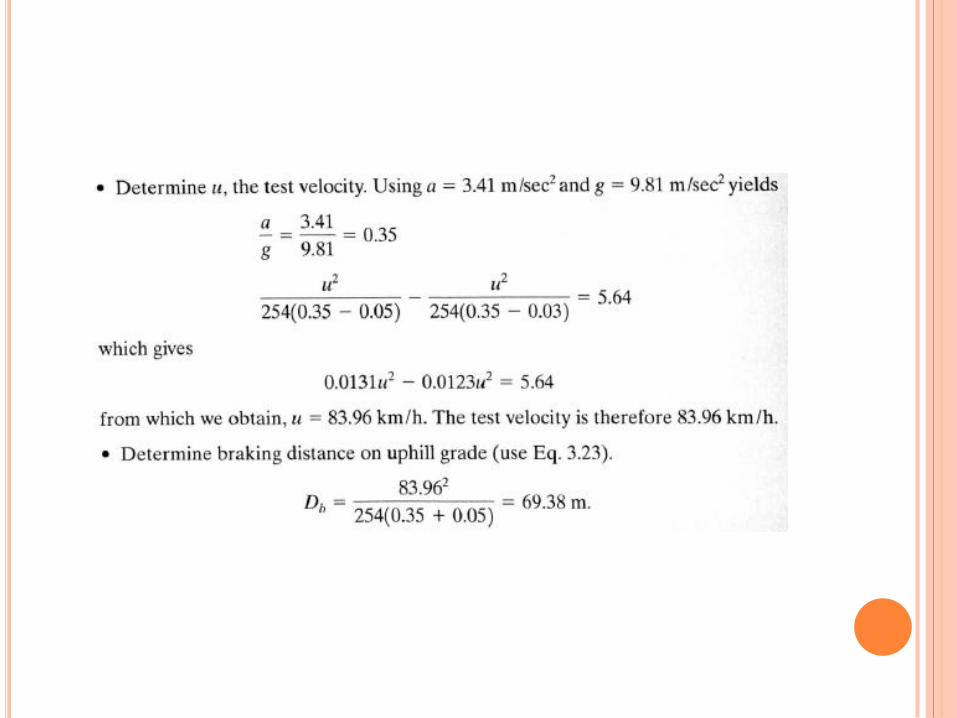
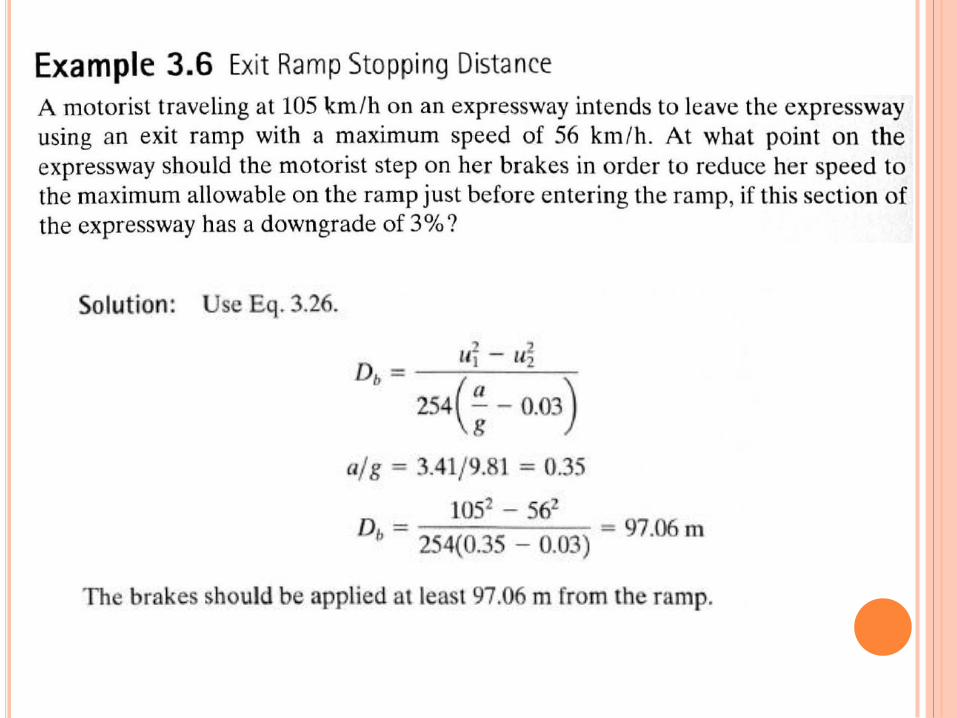
3.6.3 DYNAMIC CHARACTERISTICS
Solve the following questions?
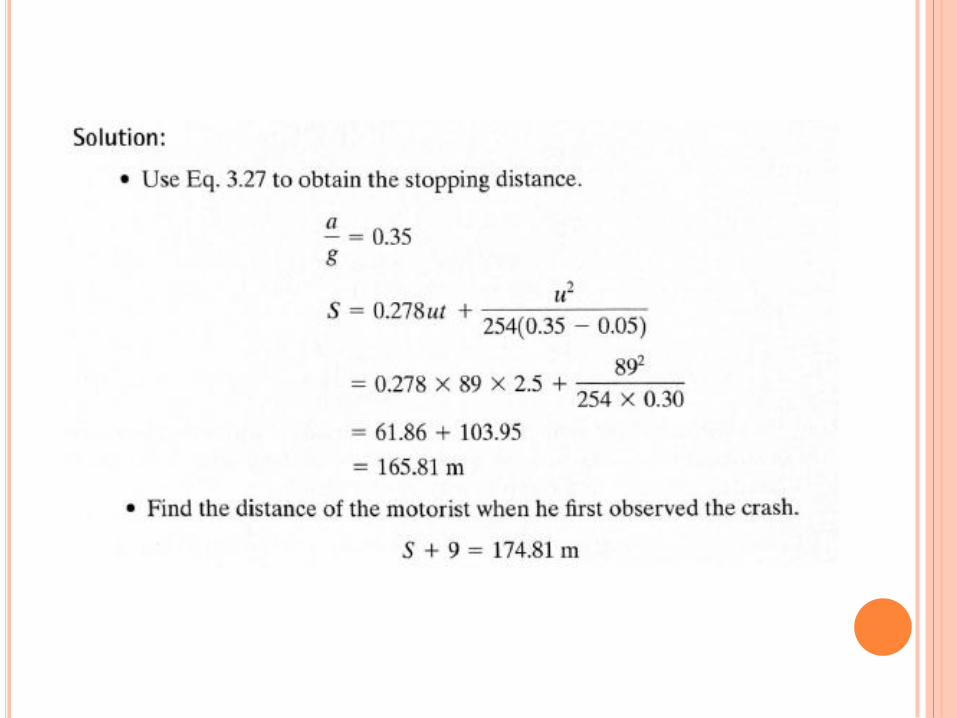
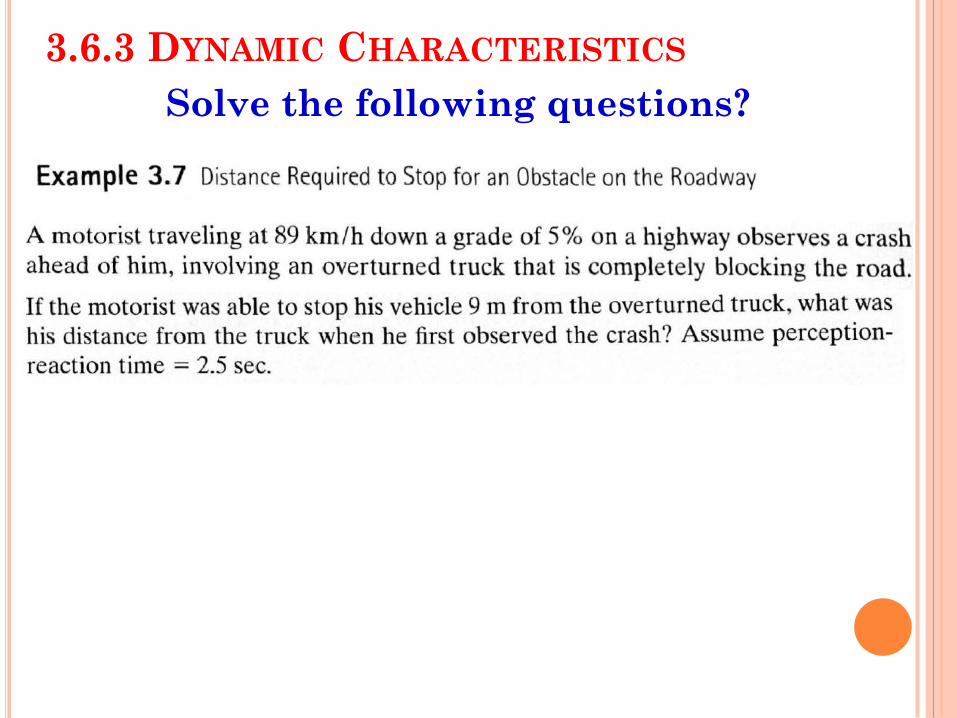
3.6.3 DYNAMIC CHARACTERISTICS
Estimation of Velocities Of vehicles involved in a crash
It is sometimes necessary to estimate:
the speed of a vehicle
just before it is involved in a crash.
using the braking-distance equations
if skid marks can be seen on the
pavement.
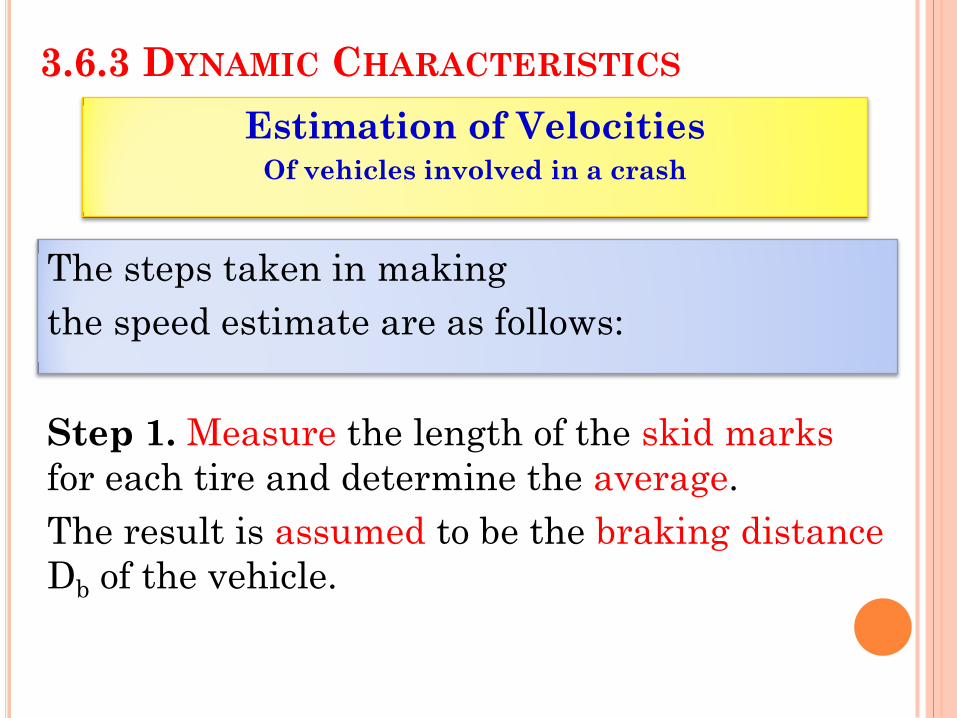
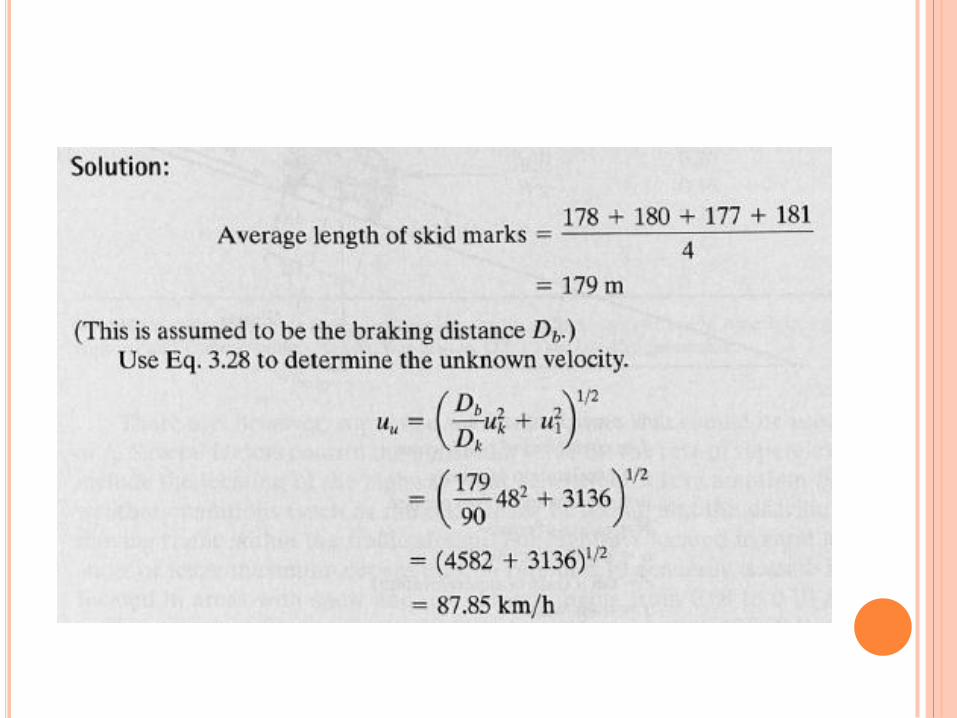
3.6.3 DYNAMIC CHARACTERISTICS
The steps taken in making
the speed estimate are as follows:
Step 1. Measure the length of the skid marks
for each tire and determine the average.
The result is assumed to be the braking distance
Db of the vehicle.
Estimation of Velocities Of vehicles involved in a crash
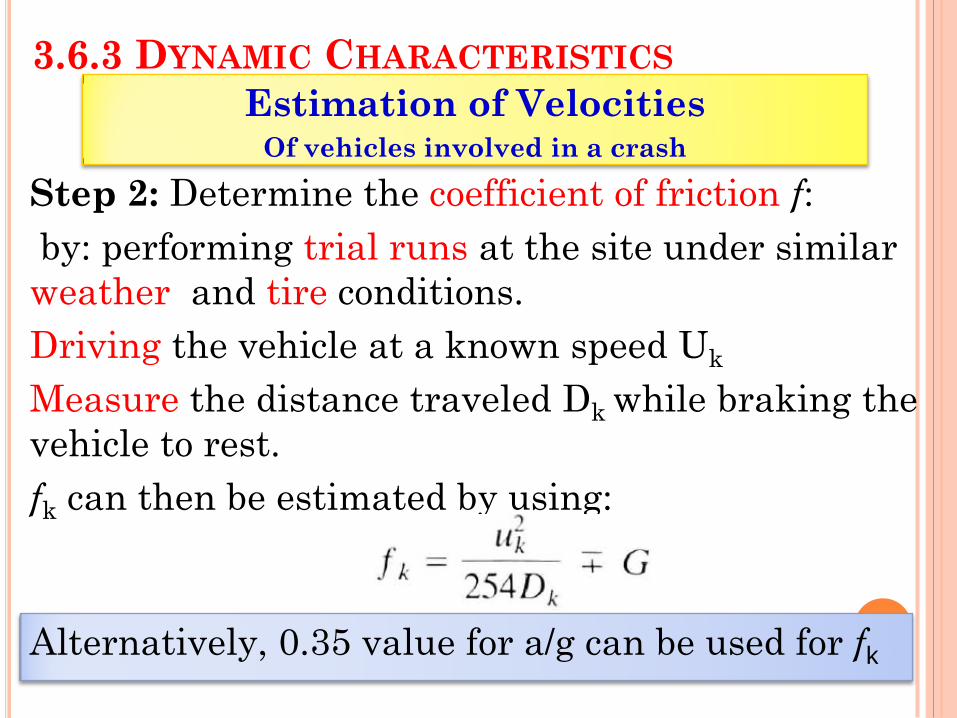
3.6.3 DYNAMIC CHARACTERISTICS
Step 2: Determine the coefficient of friction f:
by: performing trial runs at the site under similar
weather and tire conditions.
Driving the vehicle at a known speed Uk
Measure the distance traveled Dk while braking the
vehicle to rest.
fk can then be estimated by using:
Alternatively, 0.35 value for a/g can be used for fk
Estimation of Velocities Of vehicles involved in a crash
3.6.3 DYNAMIC CHARACTERISTICS
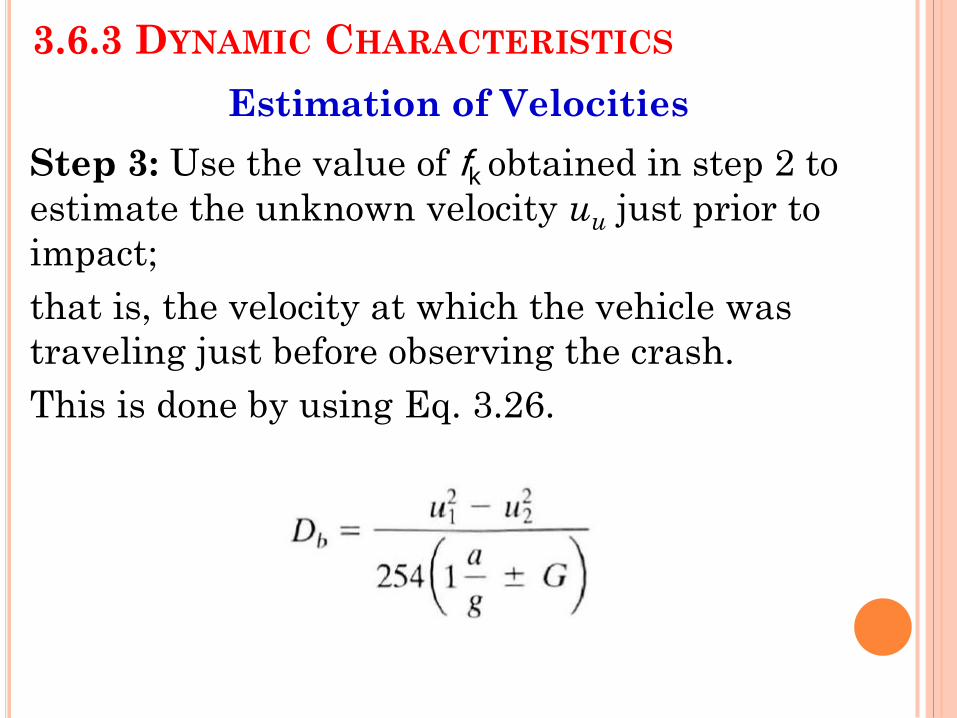
Estimation of Velocities
Step 3: Use the value of fk obtained in step 2 to
estimate the unknown velocity uu just prior to
impact;
that is, the velocity at which the vehicle was
traveling just before observing the crash.
This is done by using Eq. 3.26.
3.6.3 DYNAMIC CHARACTERISTICS
Estimation of Velocities
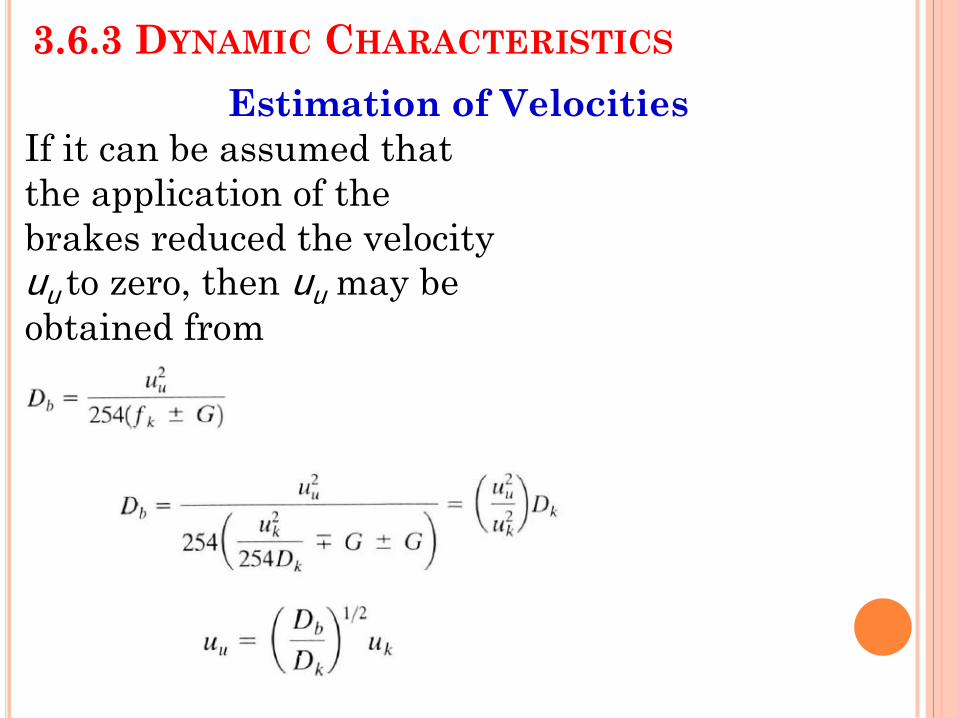
If it can be assumed that
the application of the
brakes reduced the velocity
uu to zero, then uu may be
obtained from
3.6.3 DYNAMIC CHARACTERISTICS
Estimation of Velocities
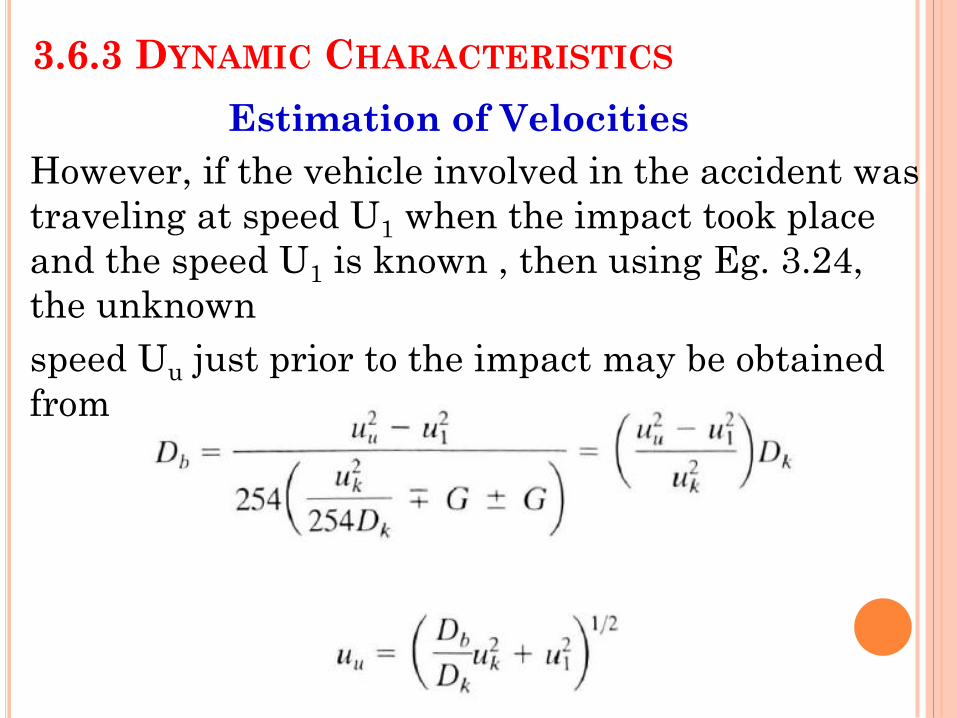
However, if the vehicle involved in the accident was
traveling at speed U1 when the impact took place
and the speed U1 is known , then using Eg. 3.24,
the unknown
speed Uu just prior to the impact may be obtained
from
3.6.3 DYNAMIC CHARACTERISTICS
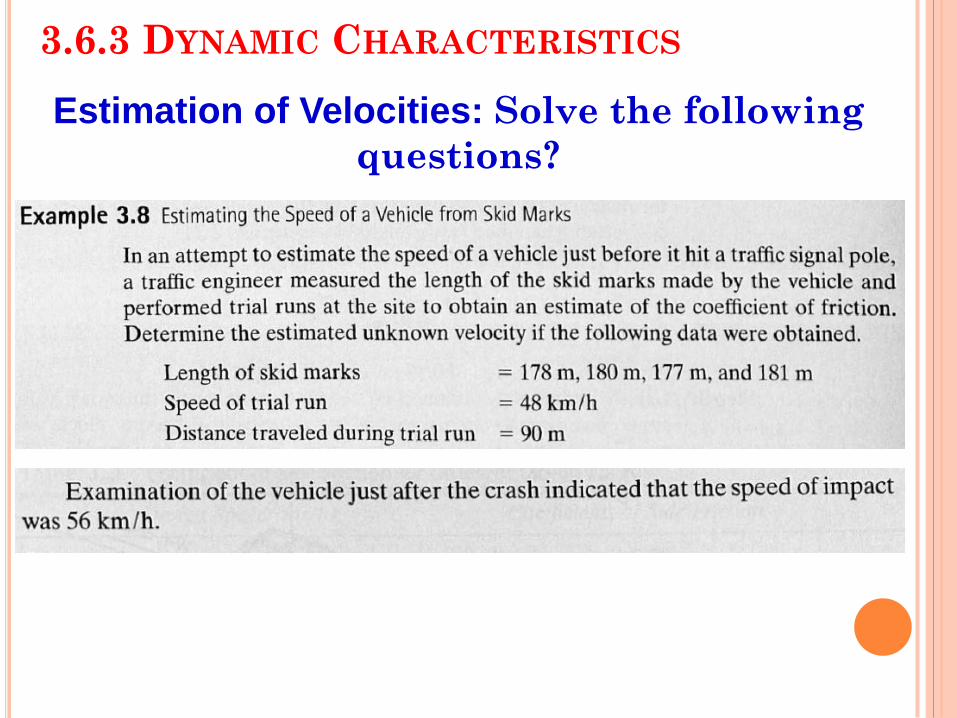
Estimation of Velocities: Solve the following
questions?