highway costs spring 2015. highway transportation costs type of costexamples highway investment...
TRANSCRIPT
Highway Costs
Spring 2015
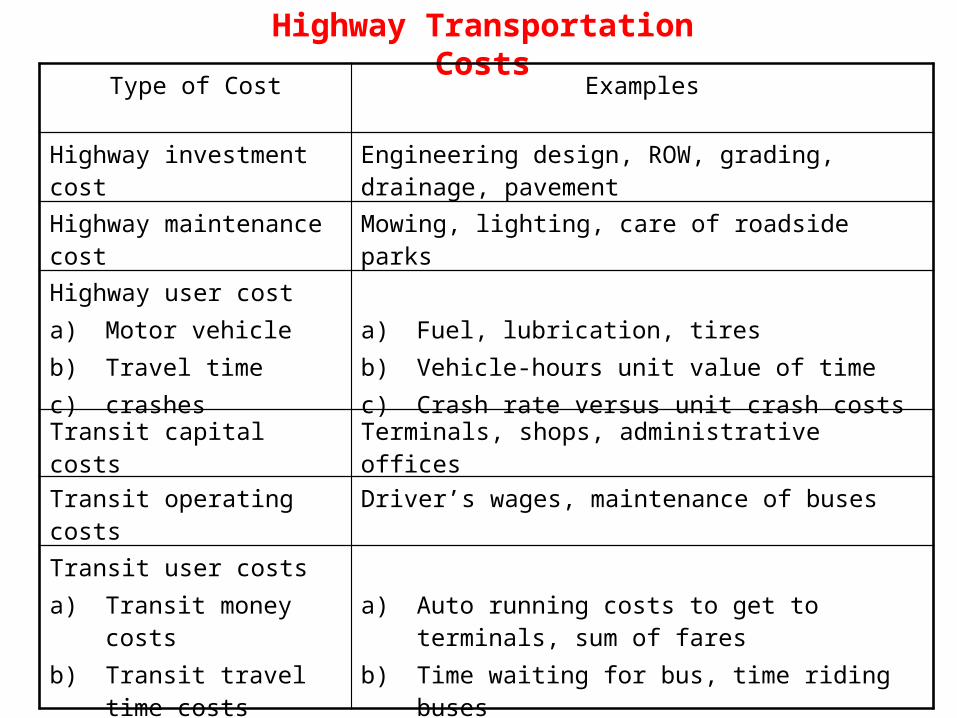
Highway Transportation Costs
Type of Cost Examples
Highway investment cost Engineering design, ROW, grading, drainage, pavement
Highway maintenance cost Mowing, lighting, care of roadside parks
Highway user costa) Motor vehicleb) Travel timec) crashes
a) Fuel, lubrication, tiresb) Vehicle-hours unit value of timec) Crash rate versus unit crash costs
Transit capital costs Terminals, shops, administrative offices
Transit operating costs Driver’s wages, maintenance of buses
Transit user costsa) Transit money costsb) Transit travel time
costs
a) Auto running costs to get to terminals, sum of fares
b) Time waiting for bus, time riding buses
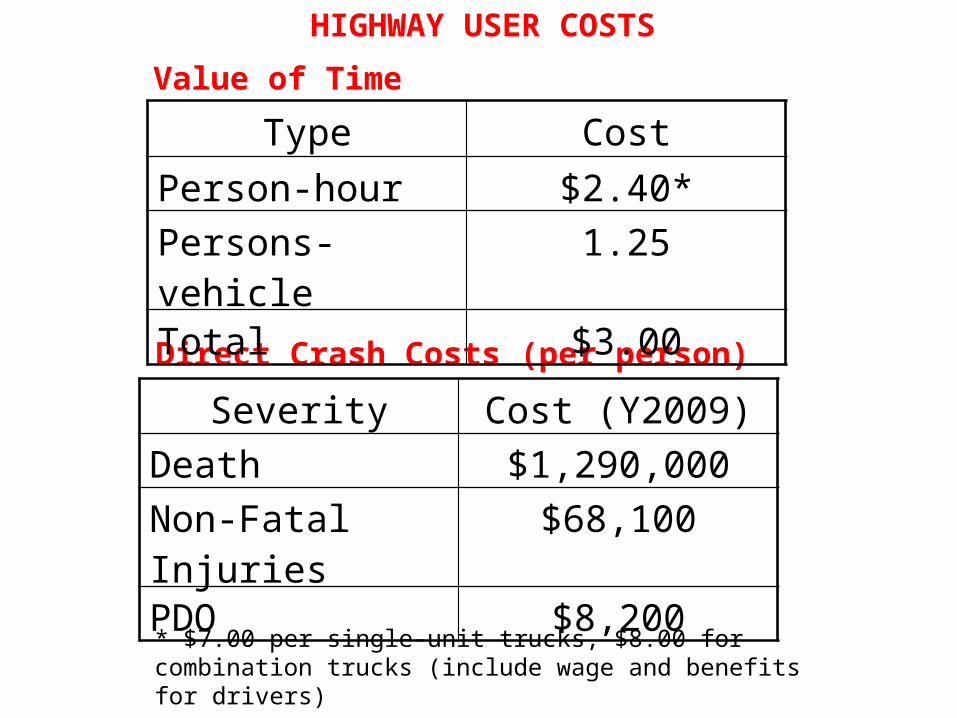
HIGHWAY USER COSTS
Severity Cost (Y2009)
Death $1,290,000
Non-Fatal Injuries
$68,100
PDO $8,200
Direct Crash Costs (per person)
Type Cost
Person-hour $2.40*
Persons-vehicle 1.25
Total $3.00
Value of Time
* $7.00 per single-unit trucks, $8.00 for combination trucks (include wage and benefits for drivers)

Comprehensive Crash Costs (per person)
Type Cost (Y2012)
Death $4,538,000
Injury A $230,000
Injury B $58,000
Injury C $28,000
No injury $2,500
http://www.nsc.org/news_resources/injury_and_death_statistics/Pages/EstimatingtheCostsofUnintentionalInjuries.aspxhttp://www.nsc.org/NSCDocuments_Corporate/Estimating-the-Costs-of-Unintentional-Injuries-2014.pdf
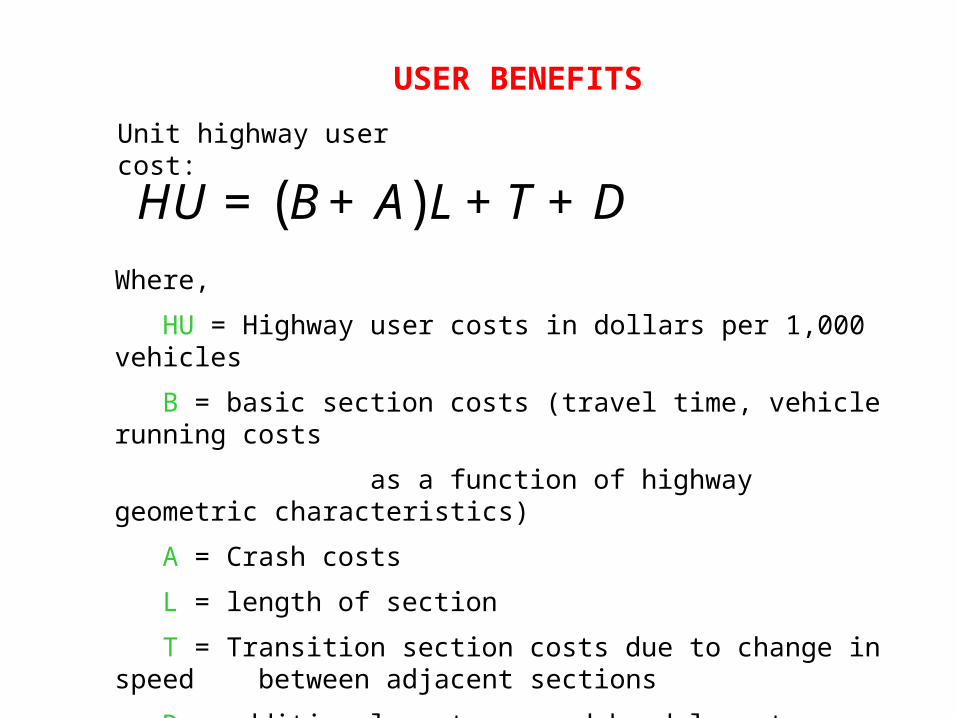
USER BENEFITS
Unit highway user cost:
Where,
HU = Highway user costs in dollars per 1,000 vehicles
B = basic section costs (travel time, vehicle running costs
as a function of highway geometric characteristics)
A = Crash costs
L = length of section
T = Transition section costs due to change in speed between adjacent sections
D = additional costs caused by delay at intersections
( )HU B A L T D= + + +
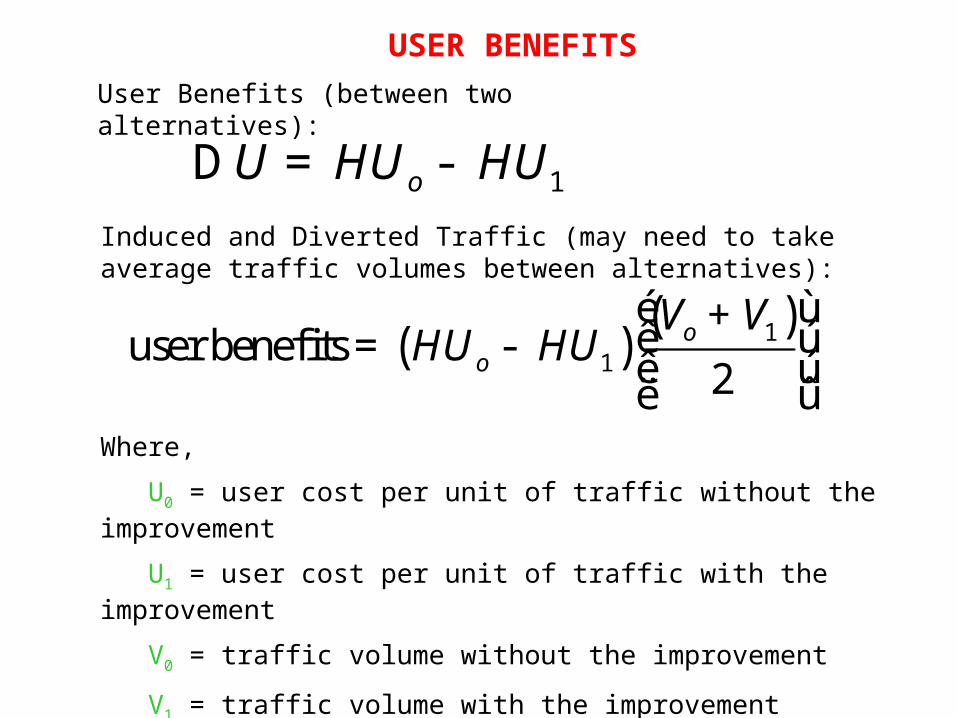
USER BENEFITS
User Benefits (between two alternatives):
Where,
U0 = user cost per unit of traffic without the improvement
U1 = user cost per unit of traffic with the improvement
V0 = traffic volume without the improvement
V1 = traffic volume with the improvement
1oU HU HUD = -Induced and Diverted Traffic (may need to take average traffic volumes between alternatives):
( )( )1
1user benefits2
oo
V VHU HU
é ù+ê ú= - ê úë û
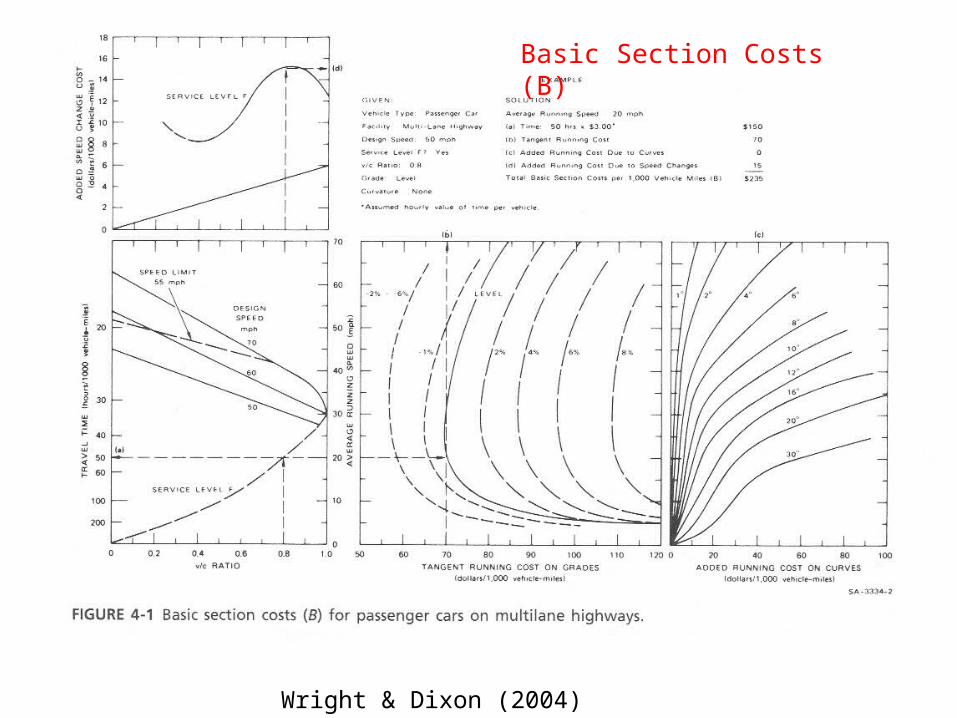
Wright & Dixon (2004) Figure 4-1
Basic Section Costs (B)
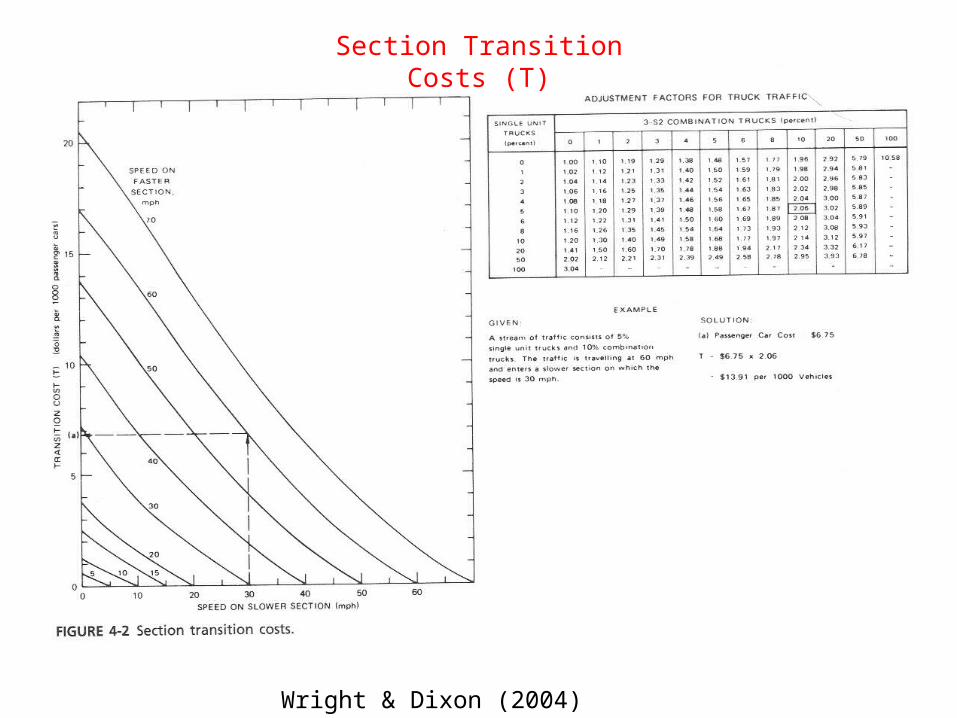
Wright & Dixon (2004) Figure 4-2
Section Transition Costs (T)
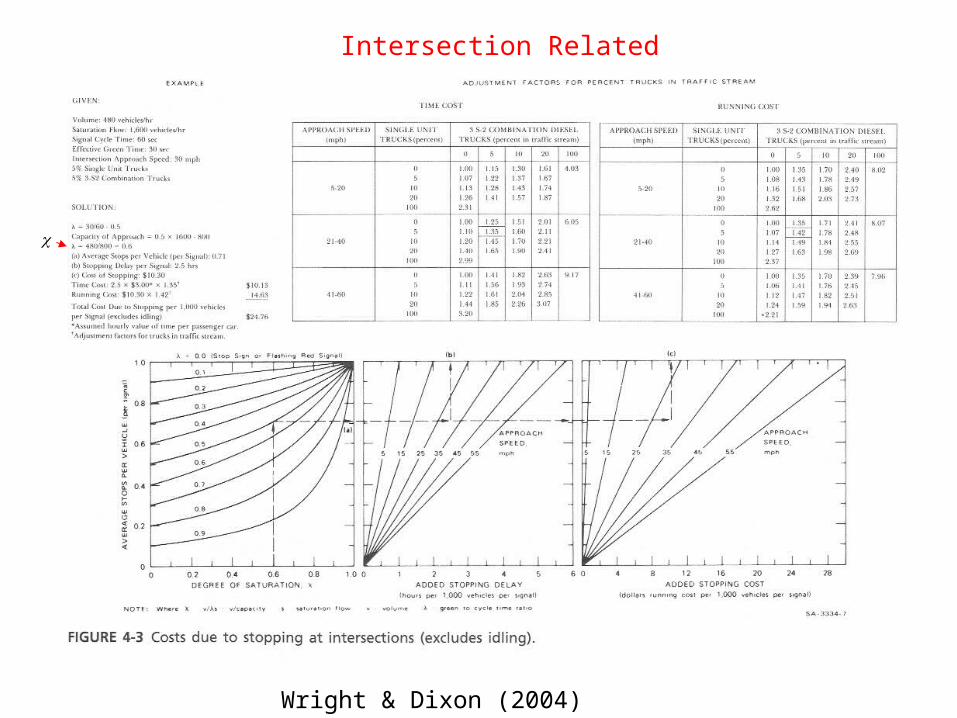
Wright & Dixon (2004) Figure 4-3
Intersection Related Costs (D)
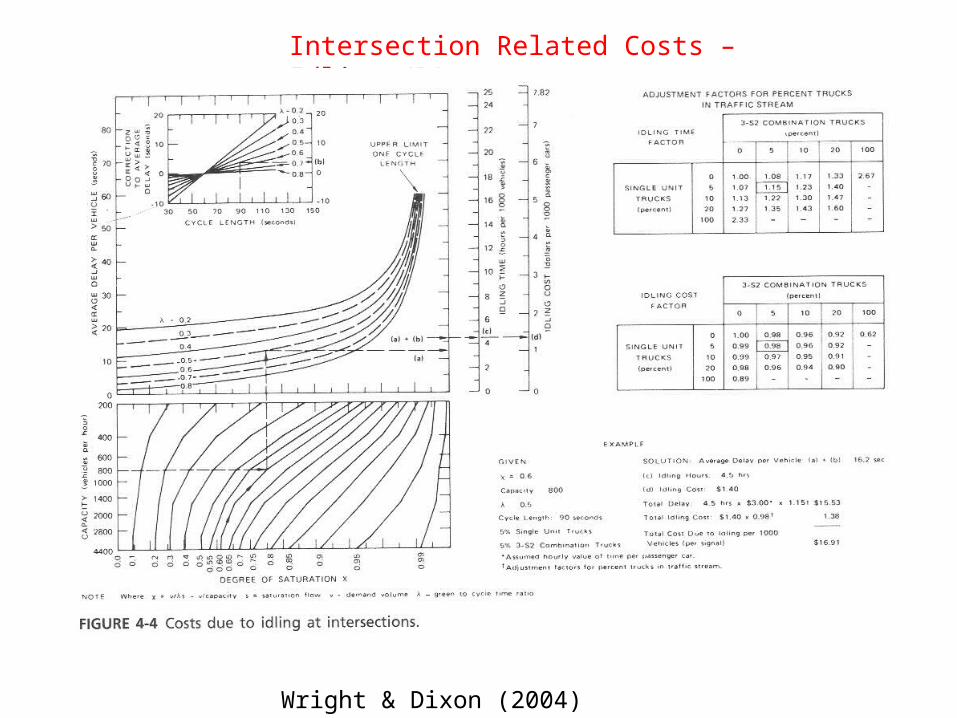
Wright & Dixon (2004) Figure 4-4
Intersection Related Costs – Idling (D)
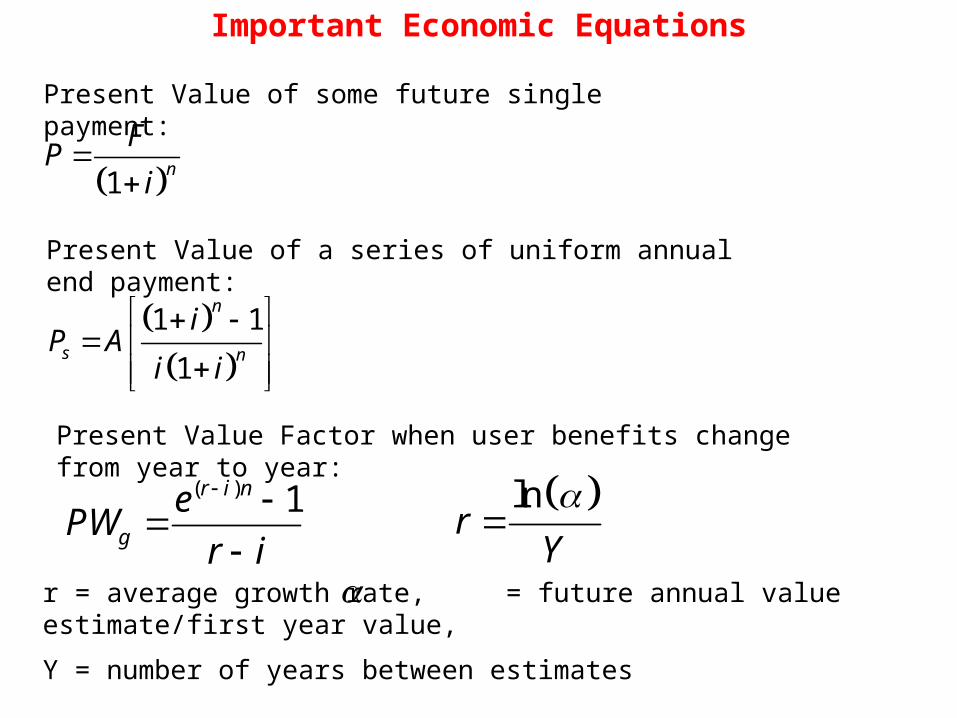
Important Economic Equations
1n
FP
i
Present Value of some future single payment:
1 1
1
n
s n
iP A
i i
Present Value of a series of uniform annual end payment:
Present Value Factor when user benefits change from year to year:
( ) 1r i n
g
ePW
r i
ln
rY
r = average growth rate, = future annual value estimate/first year value,
Y = number of years between estimates
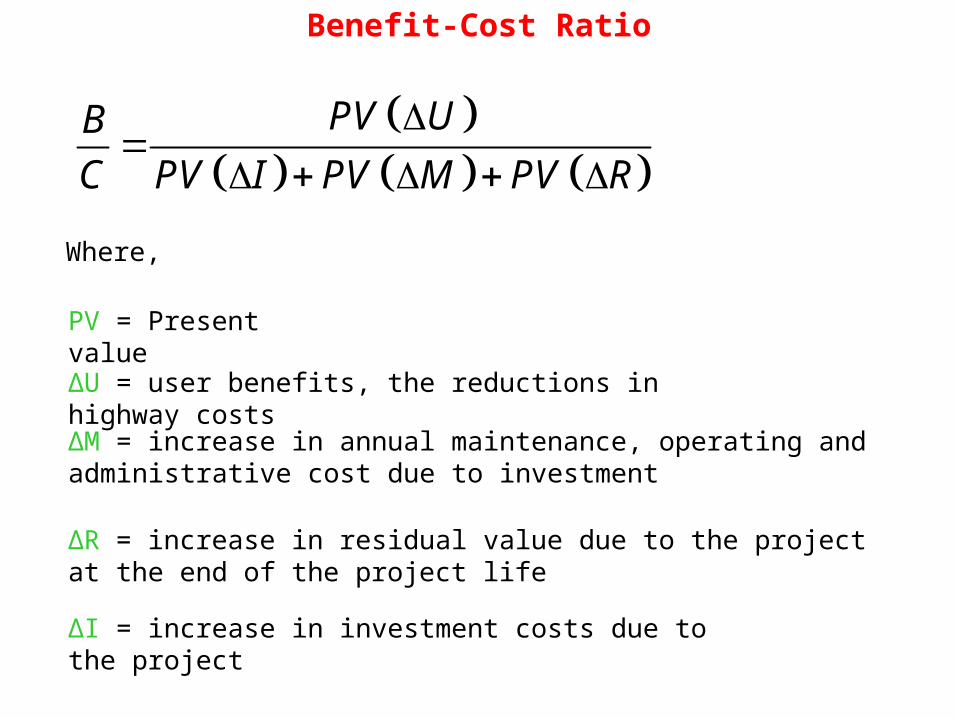
Benefit-Cost Ratio
PV UB
C PV I PV M PV R
Where,
PV = Present value
ΔU = user benefits, the reductions in highway costs
ΔM = increase in annual maintenance, operating and administrative cost due to investment
ΔR = increase in residual value due to the project at the end of the project life
ΔI = increase in investment costs due to the project
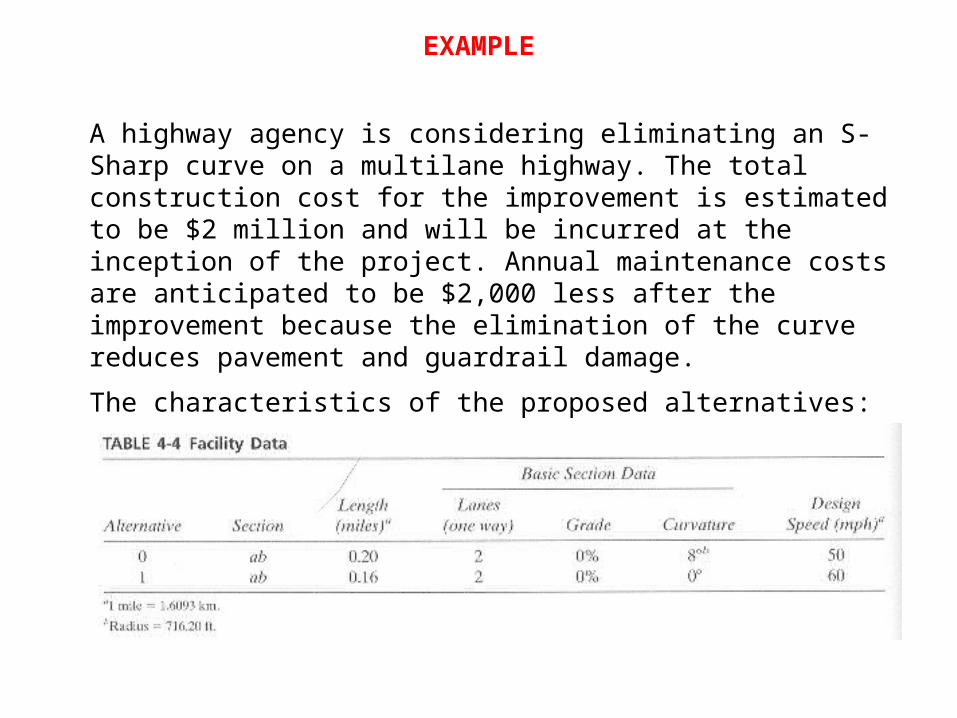
EXAMPLE
A highway agency is considering eliminating an S-Sharp curve on a multilane highway. The total construction cost for the improvement is estimated to be $2 million and will be incurred at the inception of the project. Annual maintenance costs are anticipated to be $2,000 less after the improvement because the elimination of the curve reduces pavement and guardrail damage.
The characteristics of the proposed alternatives:

Key Assumptions• Two curves have same geometry: can be
analyzed together• There is no speed differential for passing one
curve to the other• The design speed increases from 50 mph to 60
mph for the alternative design (#1)• One-way hourly volume is equal to the ADT
divided by 18 (the number of hours used for the analysis)
• The capacity is reduced in year 20 to reflect normal deterioration of the roadway
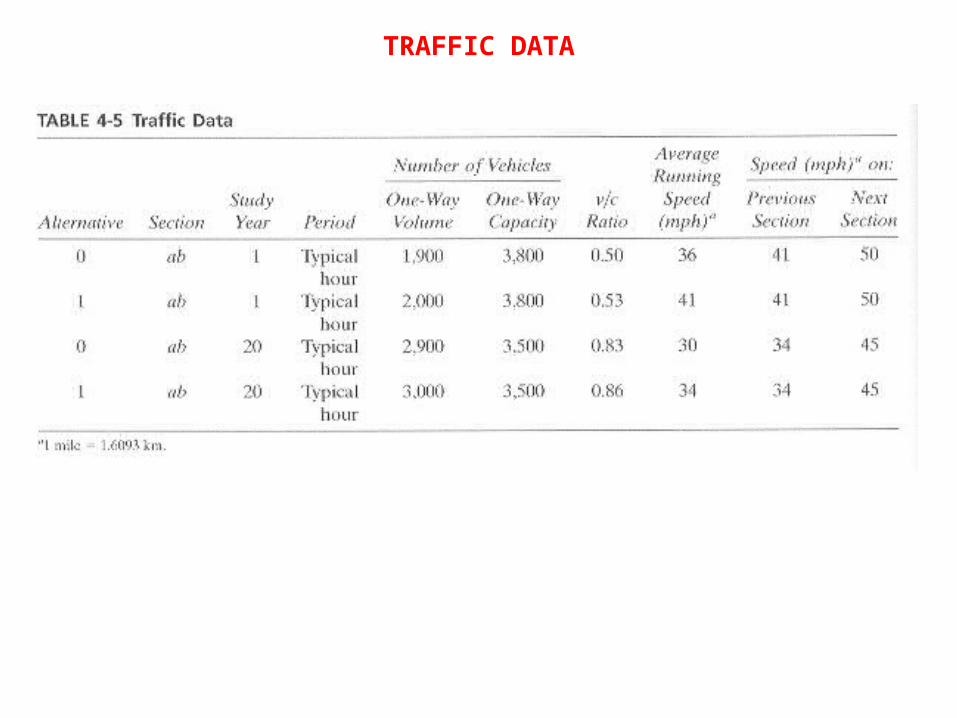
TRAFFIC DATA
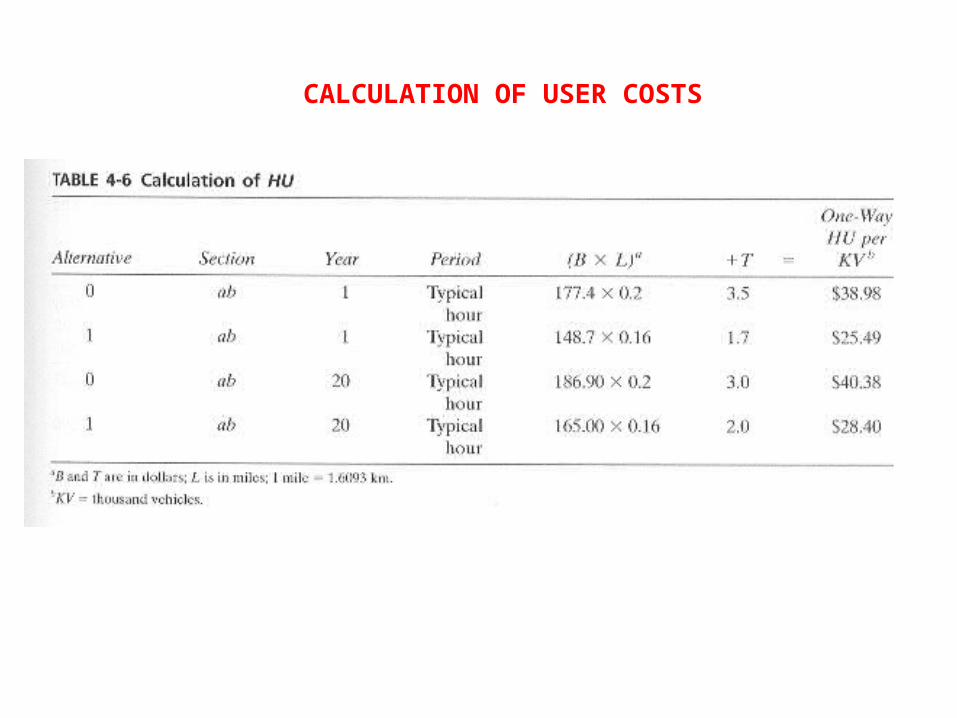
CALCULATION OF USER COSTS
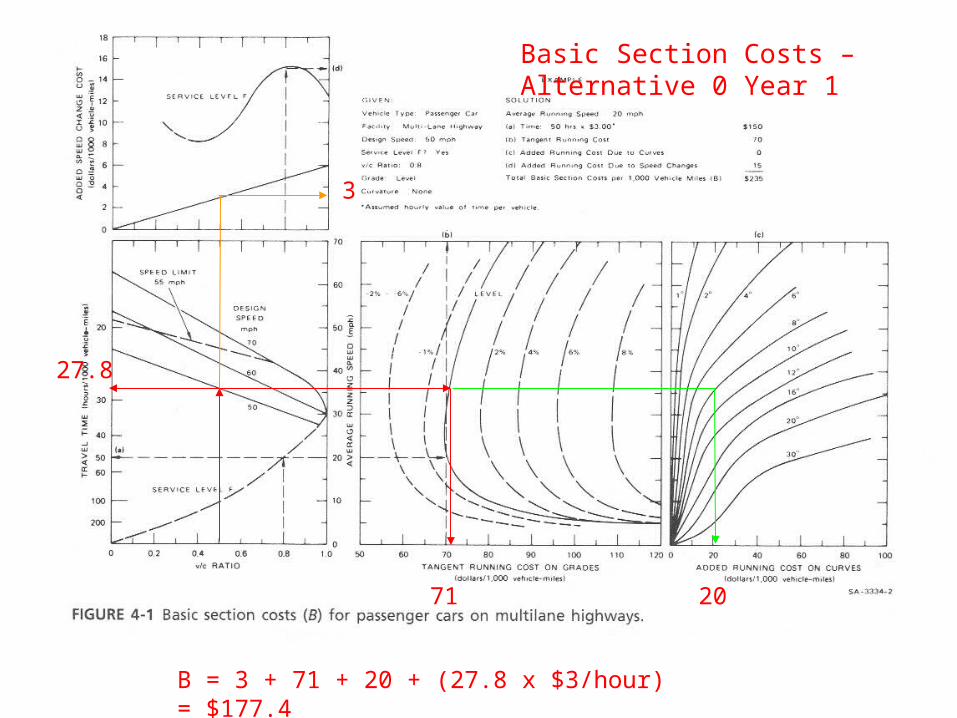
Basic Section Costs – Alternative 0 Year 1
3
71 20
B = 3 + 71 + 20 + (27.8 x $3/hour) = $177.4
27.8
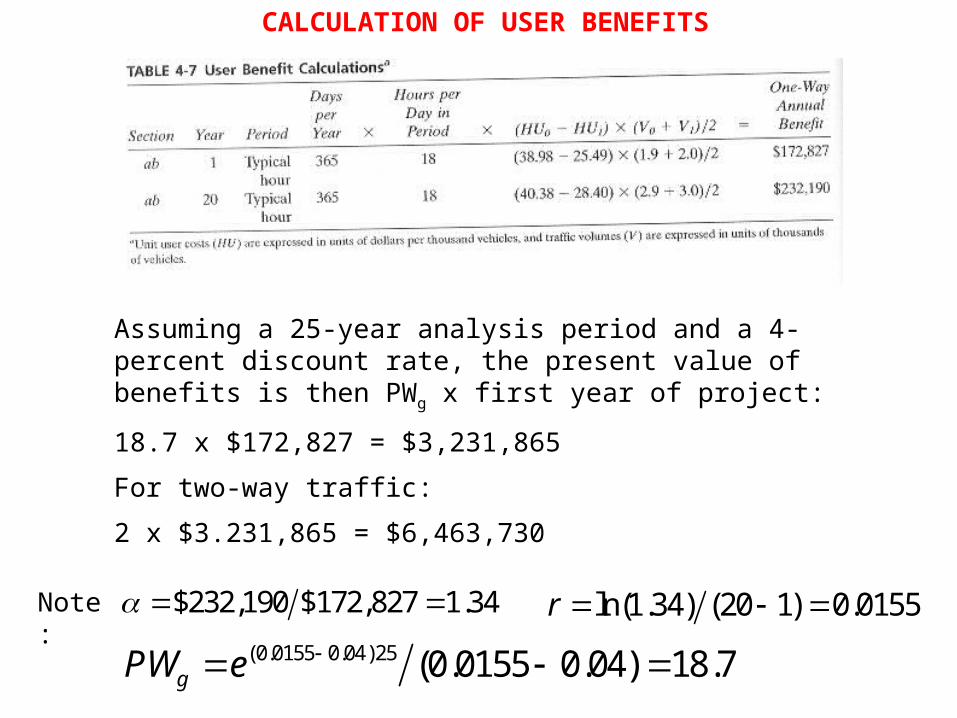
CALCULATION OF USER BENEFITS
Assuming a 25-year analysis period and a 4-percent discount rate, the present value of benefits is then PWg x first year of project:
18.7 x $172,827 = $3,231,865
For two-way traffic:
2 x $3.231,865 = $6,463,730
Note:
$232,190 $172,827 1.34 ln(1.34) (20 1) 0.0155r (0.0155 0.04)25 (0.0155 0.04) 18.7gPW e
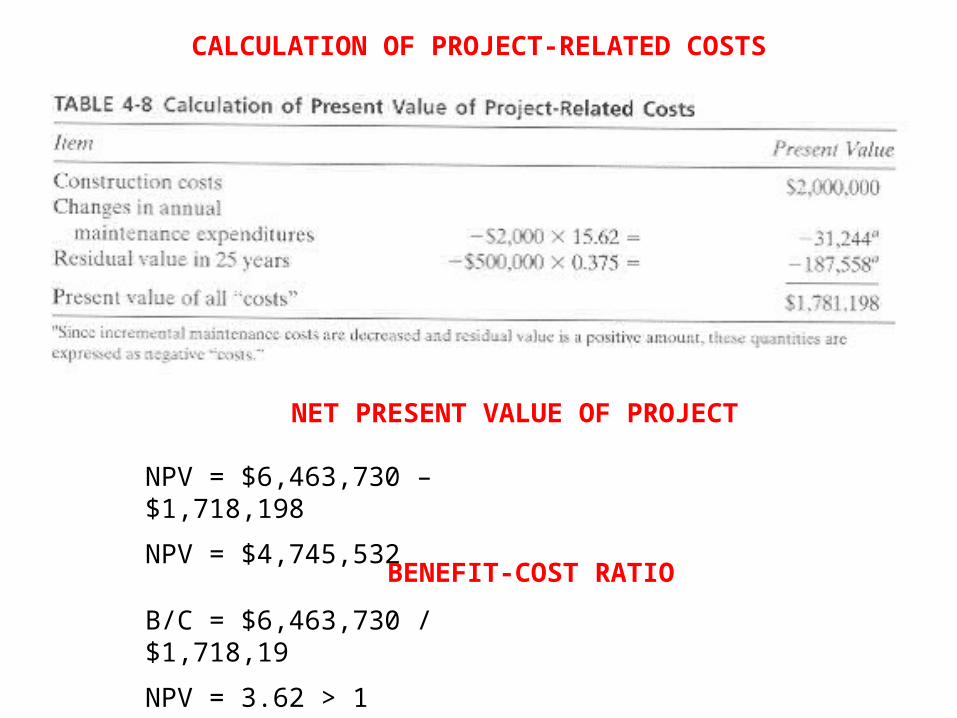
CALCULATION OF PROJECT-RELATED COSTS
NET PRESENT VALUE OF PROJECT
NPV = $6,463,730 – $1,718,198
NPV = $4,745,532BENEFIT-COST RATIO
B/C = $6,463,730 / $1,718,19
NPV = 3.62 > 1
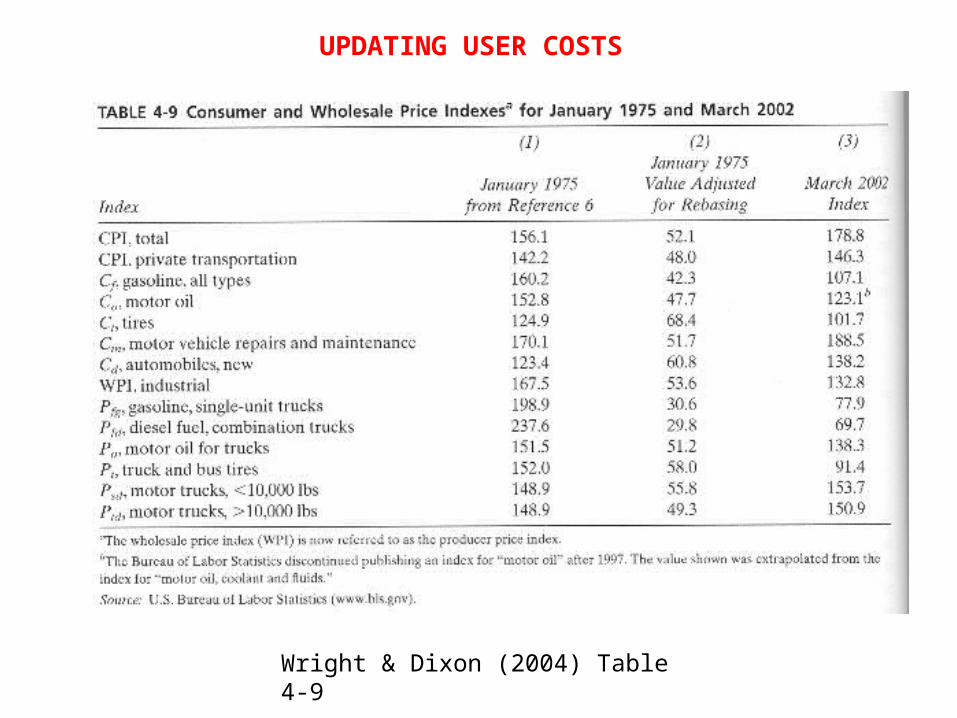
UPDATING USER COSTS
Wright & Dixon (2004) Table 4-9
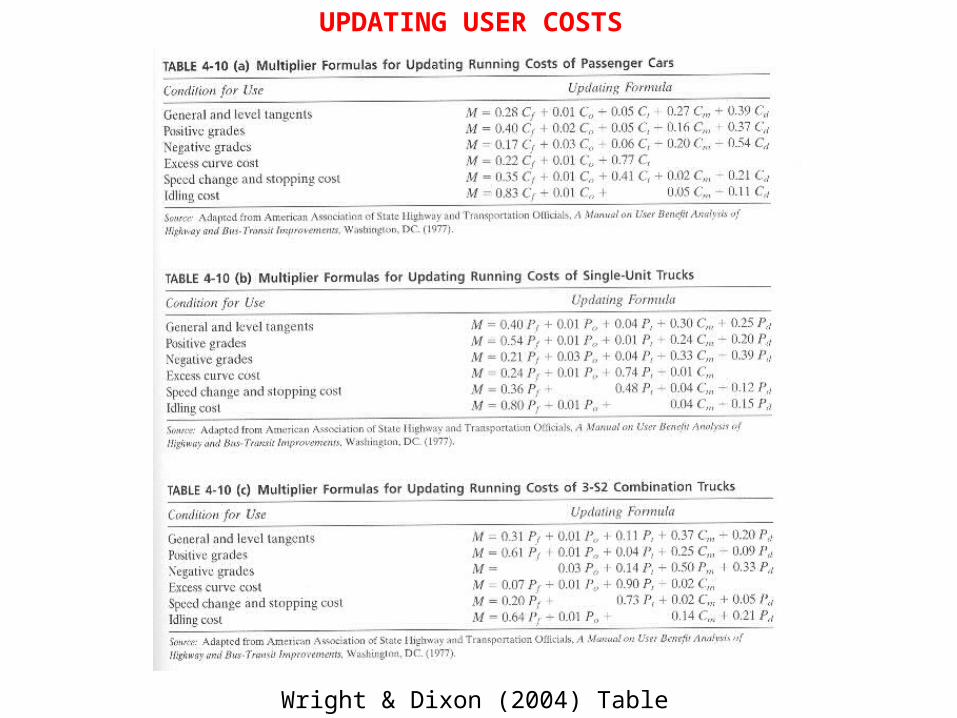
UPDATING USER COSTS
Wright & Dixon (2004) Table 4-10
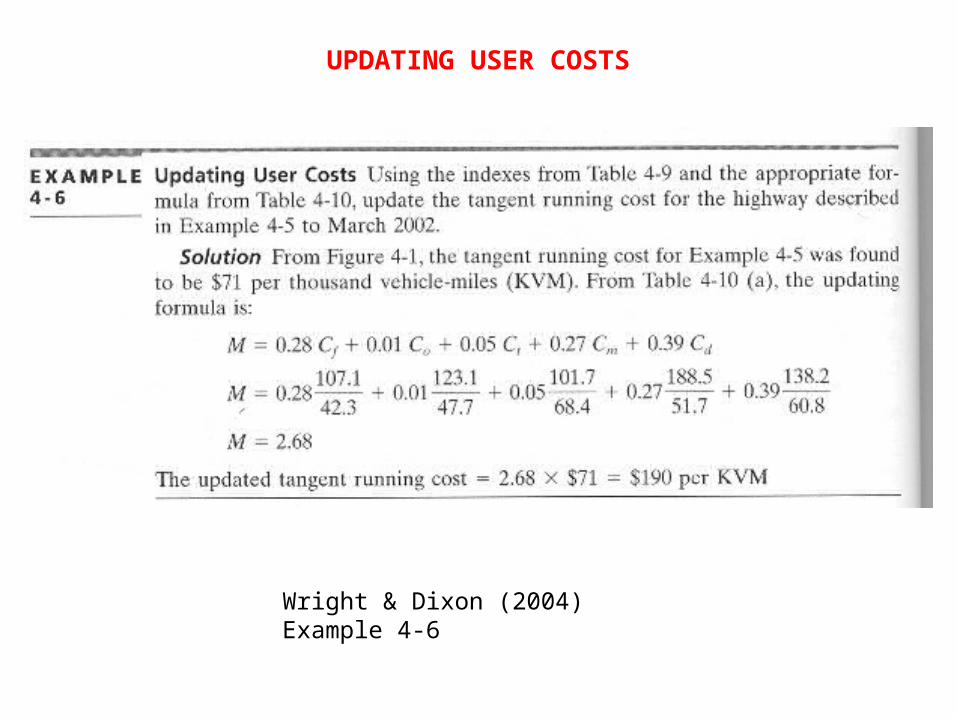
UPDATING USER COSTS
Wright & Dixon (2004) Example 4-6
Construction Unit Costs
http://www.fao.org/docrep/T0579E/t0579e06.htm
Some useful websites:
http://www.dot.state.tx.us/insdtdot/orgchart/cmd/cserve/bidprice/s_0101.htm
http://www.bookmarki.com/index.asp?PageAction=VIEWPROD&ProdID=45