highly sensitive microfluidic competitive enzyme immunoassay based on chemiluminescence resonance...
TRANSCRIPT
Electrophoresis 2014, 00, 1–7 1
Tingzhen Yang1
Marina Vdovenko2
Xue Jin1
Ivan Yu. Sakharov2 ∗Shulin Zhao1
1Key Laboratory for theChemistry and MolecularEngineering of MedicinalResources, College of Chemistryand Pharmacy, Guangxi NormalUniversity, Guilin, China
2Department of Chemistry,Lomonosov Moscow StateUniversity, Moscow, Russia
Received December 14, 2013Revised March 20, 2014Accepted March 23, 2014
Research Article
Highly sensitive microfluidic competitiveenzyme immunoassay based onchemiluminescence resonance energytransfer for the detection of neuron-specificenolase
A microfluidic competitive enzyme immunoassay based on chemiluminescence resonanceenergy transfer (CRET) was developed for highly sensitive detection of neuron-specific eno-lase (NSE). The CRET system consisted of horseradish peroxidase (HRP)/luminol as a lightdonor and fluorescein isothiocyanate as an acceptor. When fluorescein isothiocyanate-labeled antibody binds with HRP-labeled antigen to form immunocomplex, the donorand acceptor are brought close each other and CRET occurs in the immunocomplex. Inthe MCE, the immunocomplex and excess HRP–NSE were separated, and the chemi-luminescense intensity of immunocomplex was used to estimate NSE concentration.The calibration curve showed a linearity in the range of NSE concentrations from 9.0 to950 pM with a correlation coefficient of 0.9964. Based on a S/N of 3, the detection limit forNSE determination was estimated to be 4.5 pM, which is two-order magnitude lower thanthat of without CRET detection. This assay was applied for NSE quantification in humanserum. The obtained results demonstrated that the proposed immunoassay may serve asan alternative tool for clinical analysis of NSE.
Keywords:
Chemiluminescence / Enzyme immunoassays / Microchip electrophoresis /Neuron-specific enolase / Resonance energy transfer
DOI 10.1002/elps.201300630
1 Introduction
Increased concentration of neuron-specific enolase (NSE) inhuman serum may be attributed to cerebral injury due tophysical damage or ischemia caused by infarction or cere-bral hemorrhage, coupled with increased permeability of theblood–brain barrier [1], and the serum NSE concentrationhas been reported to correlate with the extent of damage andneurological outcome [2]. Additionally, a secondary elevationof serum NSE concentration may be a marker of delayed neu-ronal injury resulting from cerebral vasospasm, and serumNSE concentration reflects the metabolic and secretion activ-ity of tumors [3]. As the � -subunit of enolase, NSE presentsprimarily in the cytoplasm of neurons and neuroendocrinecells. The NSE levels are 5–12 ng/mL in serum and 20 ng/mL
Correspondence: Professor Shulin Zhao, Key Laboratory for theChemistry and Molecular Engineering of Medicinal Resources,College of Chemistry and Pharmacy, Guangxi Normal University,Guilin 541004, ChinaE-mail: [email protected]: +86-773-5832294
Abbreviations: CL, chemiluminescence; CRET, chemilumi-nescence resonance energy transfer; HRP, horseradish per-oxidase; NSE, neuron-specific enolase; PIP, Para-iodophenol
in cerebrospinal fluid in normal human beings [4]. Therefore,the detection of serum NSE concentration may be a usefultool for the tumors diagnosis.
Several assays procedures based on electrochemicalimmunoassay [5–7], gel electrophoresis [8], and fluoroim-munoassay [9] have been reported to be effective for NSE de-tection during the past two decades. Although each methodhas its advantages, many reported techniques involve stillsome tedious and time-consuming procedures. Thus, it ishighly desirable to develop simple, sensitive, and selectiveassay for the determination of NSE in human serum.
MCE is a modern trace analysis technique. Since Manzand co-workers presented this technique in 1993 [10], MCEhas been rapidly developed, and widely used in chemical, bio-chemical, and clinic analysis [11]. Microfluidic immunoas-say also attracts a great attention in analytical chemists.The advantages of MCE include shortened assay time, lowersample/reagent consumption, and the possibility of beingfully automated [12, 13]. However, since the microfluidicchannels are extremely narrow, and minimum amounts of
∗Additional corresponding author: Professor Ivan Yu. Sakharov,E-mail: [email protected]
Colour Online: See the article online to view Fig. 6 and Scheme 1 incolour.
C© 2014 WILEY-VCH Verlag GmbH & Co. KGaA, Weinheim www.electrophoresis-journal.com
2 T. Yang et al. Electrophoresis 2014, 00, 1–7
detectable labels are used, a highly sensitive detection sys-tem is required for this assay. Although LIF detection as adetection system is already widely used in MCE to improveits sensitivity [14–17], a conventional LIF detector is sophis-ticated and functions at a limited number of wavelengths.Furthermore, a derivatization of analytes with a fluorophoreis often necessary.
Chemiluminescence (CL)-based detection offers advan-tages such as simplicity in instrumentation, high sensitivity,and wide linear range [18, 19]. It has been widely used in im-munoassays [20–22]. CL resonance energy transfer (CRET)involves nonradioactive (dipole–dipole) energy transfer be-tween a CL donor and fluorophore acceptor when are in closeproximity (normally �10 nm) [23,24]. Since no external lightsource is used for excitation in CRET, nonspecific signalscaused by external light excitation often observed in fluo-rescence measurements can be minimized. Therefore, us-ing CRET system can enhance the detection sensitivity. Re-cently, Zhang and co-workers developed a CRET-based assayfor the detection of adenosine triphosphate present in cancercells [25]. Willner and co-workers applied horseradish peroxi-dase (HRP) mimicking DNAzyme-stimulated CRET to quan-tum dots for the detection of DNA, metal ions, and aptamersubstrate complexes [26, 27]. Lee and co-workers reported agraphene-based CRET immunosensing platform for homo-geneous detection of C-reactive protein in human serum sam-ples [28]. These studies indicated that the CRET system wassimple and useful to detect biomolecules with low detectionlimit.
In the present work, taking the advantages of approachesmentioned above, we designed a novel analytical strategybased on microfluidic enzyme immunoassay with CRET-based detection for the determination of NSE. The antigen(NSE) was labeled with HRP, which catalyzed the oxidation ofluminol with the production of light (donor), and the antibodywas labeled with FITC (acceptor). When the immunocomplexis formed, CRET occurs in immunocomplex. Based on thisprinciple, a highly sensitive microfluidic enzyme immunoas-say for NSE determination was developed, and applied for thequantification of NSE in human serum.
2 Materials and methods
2.1 Reagents and apparatus
All reagents used in this work were of analytical grade. NSE(Ag), FITC-labeled antibody (Ab*), and HRP-labeled antigen(Ag*) were purchased from Sangon Biotechnology (Shang-hai, China). Luminol was purchased from Aldrich (Milwau-kee, WI, USA). SDS was provided by Shanghai Reagents(Shanghai, China). Para-iodophenol (PIP), hydrogen perox-ide (H2O2), and sodium hydrogen carbonate (NaHCO3) wereobtained from Taopu Chemicals (Shanghai, China). Waterwas purified by employing a Milli-Q plus 185 equip fromMillipore (Bedford, MA, USA), and used throughout thework.
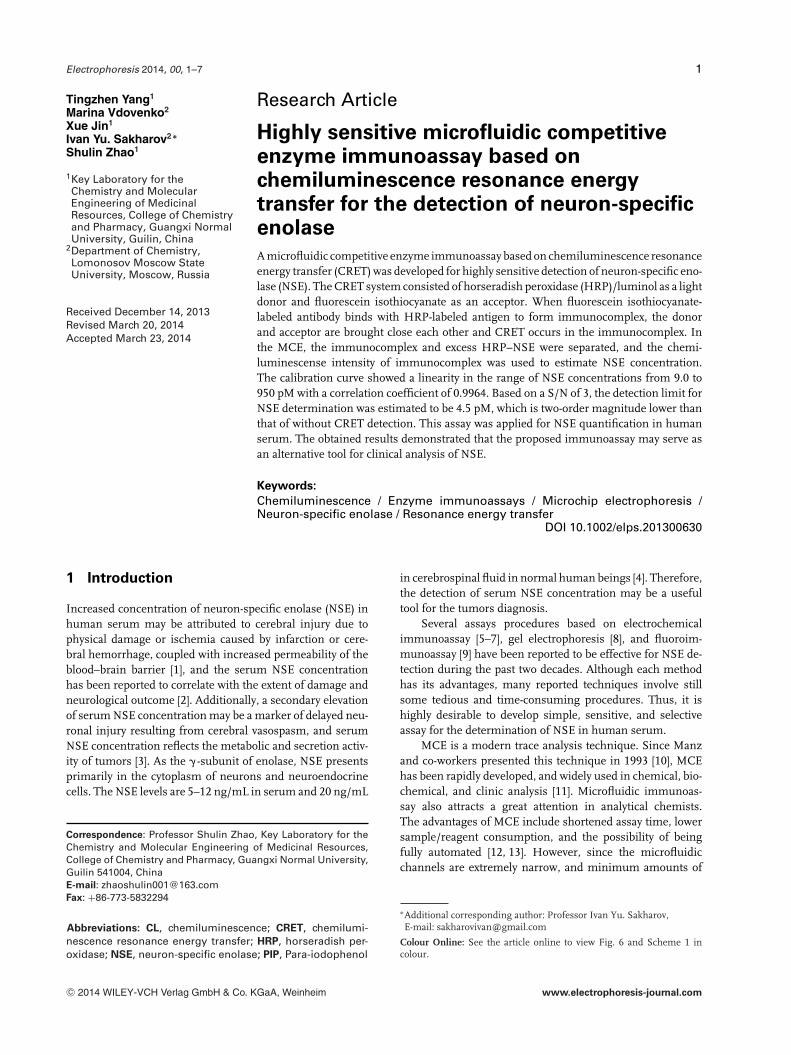
Figure 1. The diagram of the layout of the glass/PDMS microchip.S: sample reservoir; B: buffer reservoir; SW: sample waste reser-voir; BW: buffer waste reservoir; R: the oxidizer reagent reservoir.
Solutions of the antigen and antibodies were preparedby dissolving the reagents in 30 mM PBS, pH 7.4. The elec-trophoretic buffer was 30 mM borate solution (pH 9.0) con-taining 0.1 mM luminol and 30 mM SDS. The oxidizer solu-tion was 35 mM NaHCO3 buffer solution (pH 8.8) containing100 mM H2O2 and 0.5 mM PIP. All solutions were filteredthrough 0.22 �m membrane filters before use.
CL spectra were measured with a LS-55 luminescencespectrometer (Perkin-Elmer, USA); UV-visible spectra weremeasured with a TU-1901 UV-visible spectrophotometer(Beijing Purkinje General Instrument, China). The MCE–CLdetection was performed using a laboratory built system de-scribed previously [29]. A home-made glass/PDMS microchipwas used in this work, and its schematic layout is illustratedin Fig. 1. The procedure of microchip fabrication was as de-scribed previously [19]. The channel between reservoir S andSW was used for sampling, the channel between B and BWwas used for the separation and the channel between R andBW was used for the oxidizer introduction. The width of mi-crochannels is 65 �m (except oxidizer introduction channelis 250 �m). The depth of all microchannels is 25 �m, and thedouble “T” size is 60 �m.
2.2 Immunological reaction
A 20 �L volume of standard NSE or sample solution weremixed with 20 �L of 0.25 �M FITC-labeled antibody (Ab*)and 20 �L of 0.50 �M HRP-labeled antigen (Ag*) in a 0.5 mLcentrifuge tube. This solution was diluted up to 100 �L, andthe mixture solution was then incubated for 35 min at 37°C.The resulting solution was analyzed by MCE–CL.
2.3 MCE–CL assay
The microchannels were rinsed sequentially with 0.1 MNaOH, water, and electrophoretic buffer for 5 min each.Prior to the MCE separation, the reservoirs B, S, SW, andBW were filled with the electrophoretic buffer, reservoir Rwas filled with the oxidizer solution, and vacuum was appliedto the reservoir BW in order to fill the separation channel withthe electrophoretic buffer. Then, the electrophoretic buffer inreservoir S was replaced by sample solution. For loading thesample solution, a set of electrical potentials was applied tofive reservoirs: reservoir S at 550 V, reservoir B at 200 V,
C© 2014 WILEY-VCH Verlag GmbH & Co. KGaA, Weinheim www.electrophoresis-journal.com
Electrophoresis 2014, 00, 1–7 Microfluidics and Miniaturization 3
reservoir BW at 300 V, reservoir SW at grounded, and reser-voir R floating. The sample solution was transported fromreservoir S to SW in a pinched mode. After 25 s, potentialswere switched to reservoir B, S, SW, and R at 2700, 1700, 1700,and 550 V, respectively, while reservoir BW was grounded forseparation and detection.
3 Results and discussion
3.1 Design of CRET system
Design of an effective CRET system is critical for developing auseful microfluidic enzyme immunoassay with CRET-baseddetection. Luminol-PIP-H2O2 reaction is one of the most sen-sitive CL reactions, and widely used in bioanalysis [30]. SinceHRP effectively catalyzes this CL reaction [31,32], this enzymewas used to label NSE (antigen). FITC is a highly fluorescentcompound, and a widely used fluorescent label in immunoas-say [33], and the CL emission spectrum of luminol was largelyoverlapped with the FITC absorption spectrum [34]. There-fore, FITC was selected to label the anti-NSE antibody.
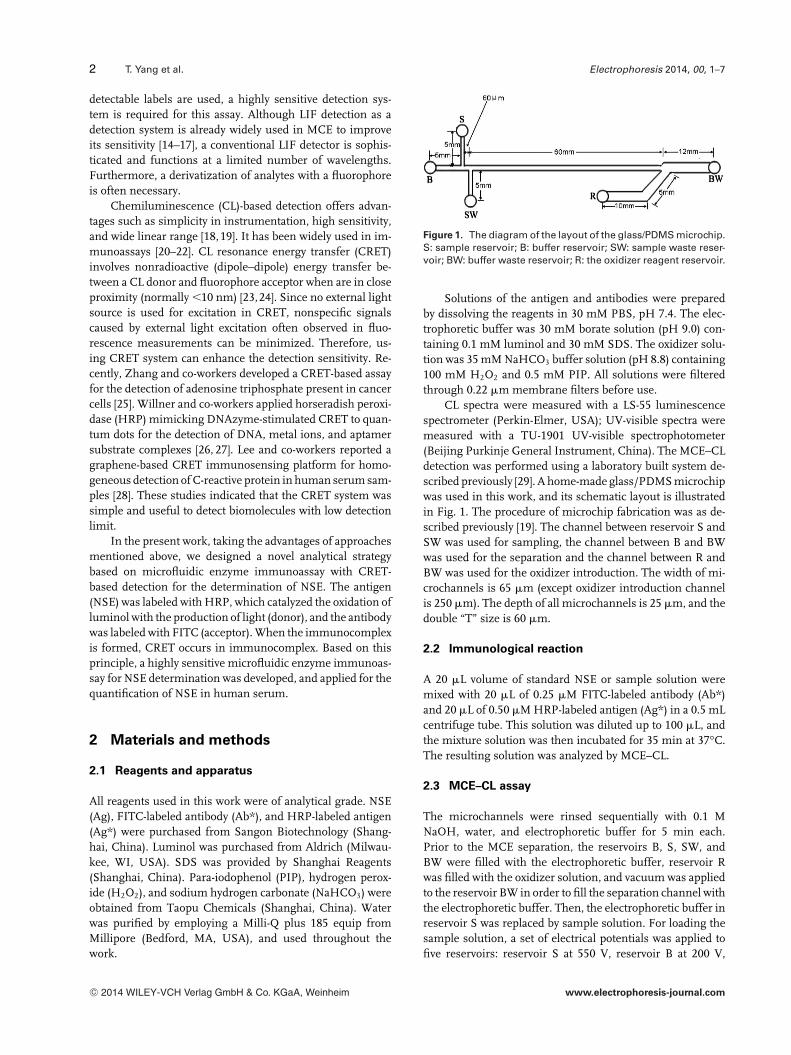
Based on the principle of CRET, a novel homogeneousmicrofluidic enzyme immunoassay for NSE detection wasdeveloped. The competitive immunoassay is illustrated inScheme 1. Free NSE and HRP-labeled NSE compete for inter-action with FITC-labeled anti-NSE antibody. Two complexes,that is, NSE–FITC–anti-NSE and HRP–NSE–FITC–anti-NSEare formed. However, CRET occurs only in the HRP–NSE–FITC–anti-NSE immunocomplex, where the donor and ac-ceptor are brought close to each other, which results in CLintensity markedly increase compared to that of HRP–NSE.
Therefore, the concentration of NSE is inversely proportionalto the CRET intensity observed.
In the MCE experiments, the HRP–NSE–FITC–anti-NSEimmunocomplex and free HRP–NSE were quickly separated,and the CL intensity of the immunocomplex was used todetermine NSE concentration. Because the concentration ofNSE is inversely proportional to that of the HRP–NSE–FITC–anti-NSE immunocomplex, the concentration of NSE in thesample can be determined by measuring the CL intensityof HRP–NSE–FITC–anti-NSE immunocomplex after beingseparated from the HRP–NSE with high sensitivity.
3.2 Optimization of conditions for immunoreaction
High concentration of FITC-labeled antibody and HRP-labeled antigen gave a high CL intensity for the immuno-complex when NSE concentration was kept unchanged.However, the FITC-labeled antibody concentration higherthan 50 nM had no benefits for the increase in the CL inten-sity of immunocomplex. In order to ensure the FITC-labeledantibody and HRP-labeled antigen to have an enough im-munocapacity with NSE for competitive immunoreactions,the concentration of HRP-labeled antigen should be in excess.Considering the detection sensitivity and reagent consump-tion as a whole, 50 nM FITC-labeled antibody and 100 nMHRP-labeled antigen were chosen for the immunoreactions.
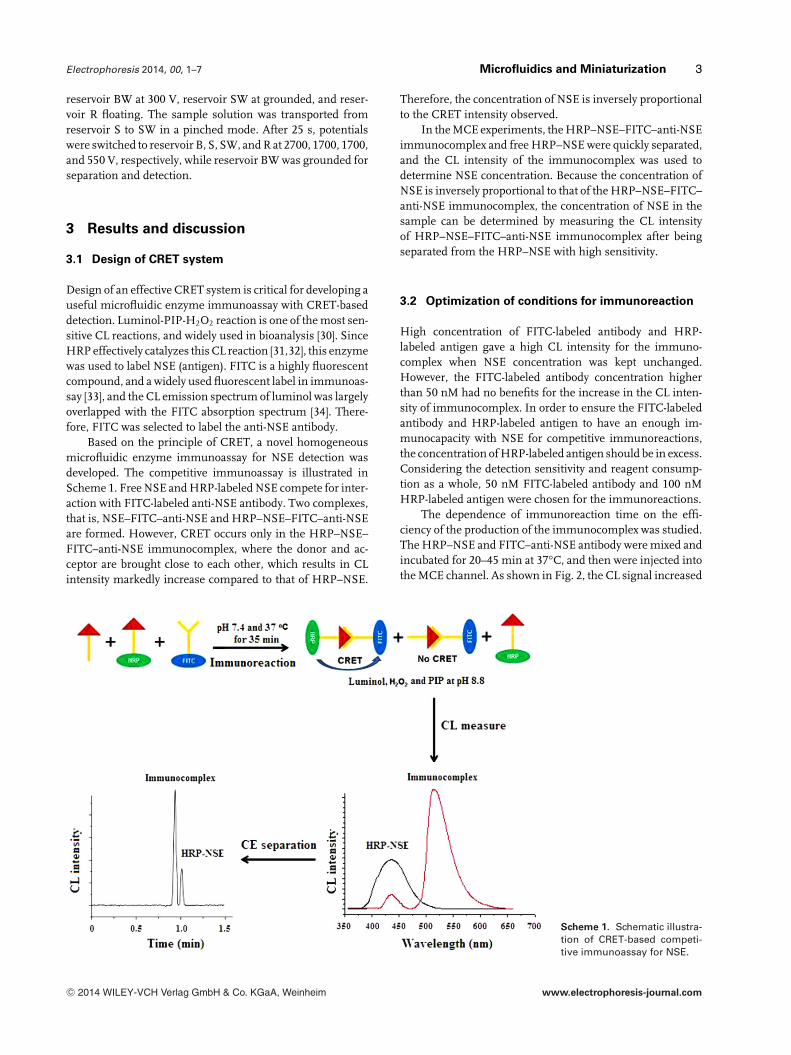
The dependence of immunoreaction time on the effi-ciency of the production of the immunocomplex was studied.The HRP–NSE and FITC–anti-NSE antibody were mixed andincubated for 20–45 min at 37°C, and then were injected intothe MCE channel. As shown in Fig. 2, the CL signal increased
Scheme 1. Schematic illustra-tion of CRET-based competi-tive immunoassay for NSE.
C© 2014 WILEY-VCH Verlag GmbH & Co. KGaA, Weinheim www.electrophoresis-journal.com
4 T. Yang et al. Electrophoresis 2014, 00, 1–7
Figure 2. The effect of the incubation time on the CL intensity ofthe immunocomplex of FITC–anti-NSE and HRP–NSE. A mixtureof 0.05 �M FITC–anti-NSE and 0.1 �M HRP–NSE was incubatedat 37°C, and then analyzed at different time intervals from 20 to45 min. Electrophoresis buffer was 30 mM borate solution (pH 9.0)containing 30 mM SDS and 0.1 mM luminol. The oxidizer solutionwas 35 mM NaHCO3 buffer (pH 8.8) containing 0.1 M H2O2 and0.5 mM PIP.
rapidly with increasing the incubation time up to 35 min, andthen remained constant. The results indicated that the bind-ing of HRP–NSE to FITC–anti-NSE reached equilibrium for35 min.
3.3 Optimization of conditions for CL reaction
To improve the sensitivity of CL detection following theCE separation, the experimental conditions such as pH ofoxidizer solution, concentrations of H2O2, and PIP in postcol-umn oxidizer solution, luminol, and SDS in the electrophore-sis buffer solution were optimized.
Since the volume of the solution in the separation chan-nel of MCE is very small compared with the volume ofthe postcolumn oxidizer solution, the acidity of CL reac-tion is mainly dependent on the oxidizer solution. The ef-fect of pH of oxidizer solution (35 mM NaHCO3) on theCL intensity was investigated by varying pH from 8.0 to9.5. It was found that the maximum CL was obtained atpH 8.8.
H2O2 as an oxidizer of luminol plays an important rolein the CL reaction. With the increase of H2O2 concentrationfrom 0.06 to 0.10 M, the CL intensity also increased, andfurther increasing H2O2 concentration result in the decreaseof CL intensity. Therefore, a 0.1 M H2O2 solution was usedin further work.
The effect of luminol concentration was investigated.With the increase of lumilol concentration from 0.05 to0.10 mM, the CL intensity increased. Further increasingthe luminol concentration resulted in the decrease of CL
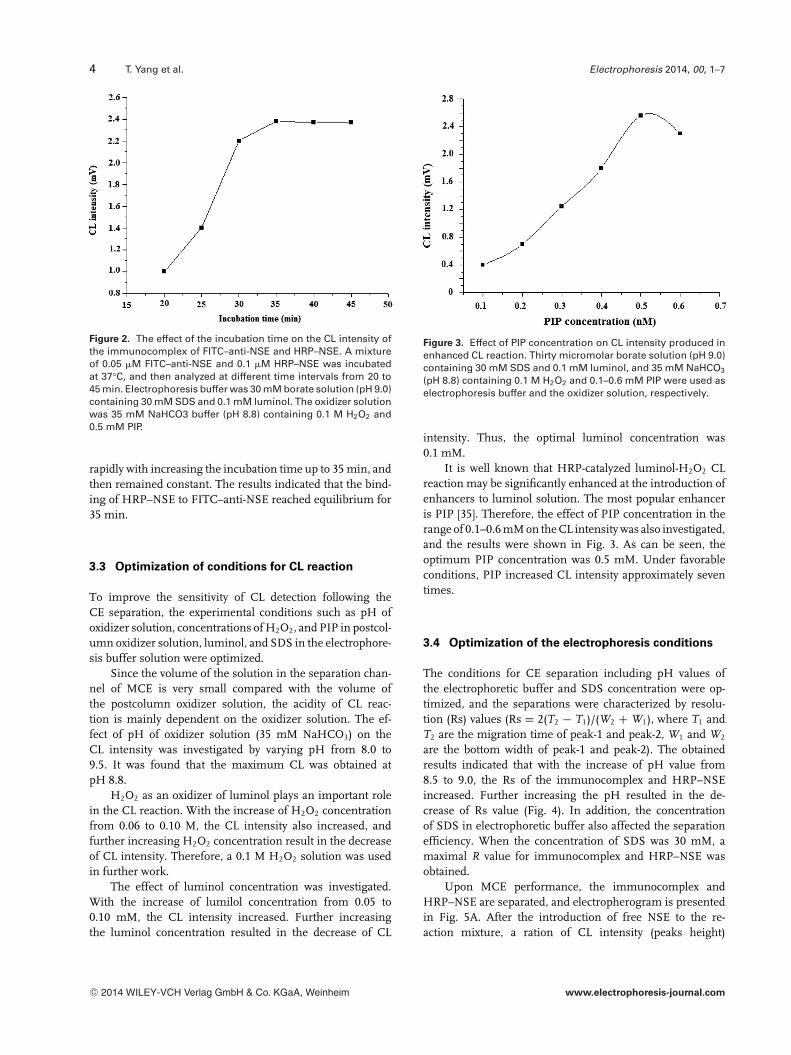
Figure 3. Effect of PIP concentration on CL intensity produced inenhanced CL reaction. Thirty micromolar borate solution (pH 9.0)containing 30 mM SDS and 0.1 mM luminol, and 35 mM NaHCO3
(pH 8.8) containing 0.1 M H2O2 and 0.1–0.6 mM PIP were used aselectrophoresis buffer and the oxidizer solution, respectively.
intensity. Thus, the optimal luminol concentration was0.1 mM.
It is well known that HRP-catalyzed luminol-H2O2 CLreaction may be significantly enhanced at the introduction ofenhancers to luminol solution. The most popular enhanceris PIP [35]. Therefore, the effect of PIP concentration in therange of 0.1–0.6 mM on the CL intensity was also investigated,and the results were shown in Fig. 3. As can be seen, theoptimum PIP concentration was 0.5 mM. Under favorableconditions, PIP increased CL intensity approximately seventimes.
3.4 Optimization of the electrophoresis conditions
The conditions for CE separation including pH values ofthe electrophoretic buffer and SDS concentration were op-timized, and the separations were characterized by resolu-tion (Rs) values (Rs = 2(T2 − T1)/(W2 + W1), where T1 andT2 are the migration time of peak-1 and peak-2, W1 and W2
are the bottom width of peak-1 and peak-2). The obtainedresults indicated that with the increase of pH value from8.5 to 9.0, the Rs of the immunocomplex and HRP–NSEincreased. Further increasing the pH resulted in the de-crease of Rs value (Fig. 4). In addition, the concentrationof SDS in electrophoretic buffer also affected the separationefficiency. When the concentration of SDS was 30 mM, amaximal R value for immunocomplex and HRP–NSE wasobtained.
Upon MCE performance, the immunocomplex andHRP–NSE are separated, and electropherogram is presentedin Fig. 5A. After the introduction of free NSE to the re-action mixture, a ration of CL intensity (peaks height)
C© 2014 WILEY-VCH Verlag GmbH & Co. KGaA, Weinheim www.electrophoresis-journal.com

Electrophoresis 2014, 00, 1–7 Microfluidics and Miniaturization 5
Figure 4. The effect of pH value of the electrophoretic buffer onresolution of the immunocomplex of FITC–anti-NSE with HRP–NSE and HRP–NSE. Electrophoretic buffer was 30 mM boratebuffer (pH 9.0) containing 0.1 mM luminol and 30 mM SDS atdifferent pH value. The oxidizer solution was 35 mM NaHCO3
buffer containing 0.1 M H2O2 (pH 8.8) and 0.5 mM PIP.
corresponding to the concentrations of the immunocomplexand HRP–NSE is changed (Fig. 5B). These results demon-strated the competitive binding of NSE to the specific anti-body. It is worth noting that the immunocomplex was wellseparated from free HRP–NSE making the proposed assayselective and useful for clinical analysis.
3.5 Analytical figures of merit
The method was evaluated in terms of response linearity,LOD, and reproducibility. Under the selected MCE–CL con-ditions, seven standard NSE solutions at various concentra-tions were analyzed. Figure 6 showed the plot of relative CLintensity versus the concentration of NSE. Linear regressionanalysis of data yielded the following equation: � I = 7.35[NSE] + 1.25, where � I is the relative CL intensity (�V), and[NSE] is the concentration of NSE (pM). The calibration curveshowed excellent linearity in the range from 9 to 950 pM witha correlation coefficient of 0.9964. Based on a S/N of 3, thedetection limit for NSE was estimated to be 4.8 pM. Assay re-producibility was estimated by analyzing a standard solutionof NSE of 450 pM (n = 9). The results showed that the RSDsof the migration time and peak height of the peak 1 were 2.8and 3.5%, whereas for peak 2 the migration time and peakheight were 2.6 and 3.9%, respectively.
3.6 Quantification of NSE in human serum
Human serum samples taken from four healthy volunteersand three lung cancer patients were analyzed to demonstratethe feasibility of proposed MCE–CL method for the deter-mination of NSE. The electropherograms obtained upon the
Figure 5. Electropherograms from separating the noncompeti-tive and competitive immunoreaction solutions. (A) without NSE;(B) with 0.45 nM NSE. The concentration of FITC–anti-NSE andHRP–NSE are 0.05 and 0.1 �M, respectively. MCE conditions:electrophoretic buffer is 30 mM phosphate buffer (pH 9.0) con-taining 30 mM SDS and 0.1 mM luminol; the oxidizer solutionwas 35 mM NaHCO3 buffer containing 0.1 M H2O2 (pH 8.8)and 0.5 mM PIP. Peak identification: (1) HRP–NSE–FITC–anti-NSEimmunocomplex; (2) HRP–NSE.
analysis of the studied samples are shown in Fig. 7. The re-sults are summarized in Table 1. The NSE level in the serumsamples from healthy subjects was found be in the range6.6 × 10−11–10.1 × 10⁻¹¹ M. The NSE level in the samplesof lung cancer patients was found to be higher and lay in therange 96.2 × 10⁻¹¹–130.4 × 10⁻¹¹ M. RSDs for the determi-nation of NSE were in the ranges of 2.7–5.1%.
Recovery of NSE from these samples was studied. NSEwas spiked to each sample and analyzed. Recoveries werefound to be in the range of 96.7–102.6%. The resultssuggested a potential application of the proposed assay inexpress primary diagnosis of diseases such as lung cancerpatients.
C© 2014 WILEY-VCH Verlag GmbH & Co. KGaA, Weinheim www.electrophoresis-journal.com

6 T. Yang et al. Electrophoresis 2014, 00, 1–7
Figure 6. The plot of relative CL intensity versus the concentra-tion of NSE. MCE conditions were as in Fig. 5.
Figure 7. Electropherograms of serum samples. (A) normalserum sample; (B) patient serum sample (diluted ten times). Theconditions were as Fig. 6. Peak identification: (1) HRP–anti-NSE–FITC–NSE immunocomplex; (2) HRP–anti-NSE. MCE conditionswere as in Fig. 5.
Table 1. Assay results and recovery of NSE in human serumsamples
Sample Found(10−11 M)
RSD(%, n = 3)
Added(10−11 M)
Total found(10−11 M)
Recovery(%)
Normal 1 6.6 2.7 10 16.32 97.2Normal 2 8.3 3.5 10 18.16 98.6Normal 3 10.1 3.1 10 20.36 102.6Normal 4 7.9 3.3 10 17.81 99.1Patient 1 96.2 4.1 100 192.9 96.7Patient 2 130.4 5.1 100 231.6 101.2Patient 3 117.3 4.7 100 214.4 97.1
4 Concluding remarks
A novel microfluidic competitive enzyme immunoassaybased on CRET has been developed for the detection of NSE.The CRET system consisted of HRP/luminol as a light donorand FITC as an acceptor. When FITC-labeled antibody bindsto the conjugate of the antigen (NSE) and HRP, the donorand acceptor are brought close each other and CRET occurs.In the MCE, the immunocomplex and HRP–NSE conjugatewere separated. By using the CRET detection, the methodallows the detection of 4.8 × 10⁻¹² M for NSE, which is twoorders magnitude lower than that of without CRET detection.To the best of our knowledge, the proposed CRET-based im-munoassay for NSE is one of the most sensitive immunoas-say in a microfluidic format. Although microfluidic compet-itive enzyme immunoassay based on CRET is demonstratedonly for NSE in this work, assays for other compounds canbe developed similarly by using corresponding antigens andrespective antibodies.
This work was supported by the National Natural Sci-ence Foundations of China (NSFC, Grant nos. 21175030,21311120056), and the Russian Foundation for Basic Research(13-04-91164-GFEN_a).
The authors have declared no conflict of interest.
5 References
[1] Barton, A. C., Davis, F., Higso, S. P. J., Anal. Chem. 2008,80, 9411–9416.
[2] Martens, P., Raabe, A., Johnsson, P., Stroke 1998, 29,2363–2366.
[3] Baudin, E., Gigliotti, A., Ducreux, M., Ropers, J., Comoy,E., Sabourin, J. C., Bidart, J. M., Cailleux, A. F., Bonacci,R, Ruffie P., Schlumberger, M., Br. J. Cancer 1998, 78,1102–1107.
[4] Marangos, P. J., Schmechel, D. E., Ann. Rev. Neu-rosci.1987, 10, 269–295.
[5] Barton, A. C., Seamus, F. D., Higson, P. J., Anal. Chem.2008, 80, 9411–9416.
[6] Zhong, Z. Y., Peng, N., Qing, Y., Shan, J. L., Li, M. X.,Guan, W., Dai, N., Gu, X. Q., Wang, D., ElectrochimicaActa 2011, 56, 5624–5629.
C© 2014 WILEY-VCH Verlag GmbH & Co. KGaA, Weinheim www.electrophoresis-journal.com
Electrophoresis 2014, 00, 1–7 Microfluidics and Miniaturization 7
[7] Han, J., Zhuo, Y., Chai, Y. Q., Yuan, Y. L., Yuan, R., Biosens.Bioelectron. 2012, 31, 399–405.
[8] Inga, A., Monika, B., Markus, O., Sigrid, P., Otto, W.,Hans, A. K., Olaf, G., Thomas, W., Lancet 1996, 348,846–849.
[9] Cao, Z. J., Li, H., Laua C., Zhang, Y. H., Anal. Chim. Acta2011, 698, 44–50.
[10] Harrison, D. J., Fluri, K., Seiler, K., Fan, Z., Effenhauser,C. S., Manz, A., Science 1993, 261, 895–897.
[11] Reyes, D. R., Iossifidis, D., Manz, A., Anal. Chem. 2002,74, 26223–26236.
[12] Morozov, V. N., Groves, S., Turell, M. J., Bailey, C., J. Am.Chem. Soc. 2007, 129, 12628–12629.
[13] Bange, A., Halsall, H. B., Heineman, W. R., Biosens. Bio-electron. 2005, 20, 2488–2503.
[14] Koutny, L. B., Schmalzing, D., Taylor, T. A., Fuchs, M.,Anal. Chem. 1996, 68, 18–22.
[15] Chiem, N., Harrison, D. J., Anal. Chem. 1997, 69,373–378.
[16] Wang, J., Ibanez, A., Chatrathi, M. P., J. Am. Chem. Soc.2003, 125, 8444–8445.
[17] Dishinger, J. F., Kennedy, R. T., Anal. Chem. 2007, 79,947–954.
[18] Roda, A., Guardigli, M., Anal. Bioanal. Chem. 2012, 402,69–76.
[19] Vdovenko, M. M., Demiyanova, A. S., Chemleva, T. A.,Sakharov, I. Yu., Talanta 2012, 94, 223–226.
[20] Sakharov, I. Yu., Demiyanova, A. S., Gribas, A. V.,Uskova, N. A., Efremov, E. E., Vdovenko, M. M., Talanta2013, 115, 414–417.
[21] Zhao, L. X., Sun L., Chu, X. G., Trends Anal. Chem. 2009,28, 404–414.
[22] Marquette, C. A., Blum, L. J., Bioanalysis 2009, 1,1259–1269.
[23] Sapsford, K. E. Berti, L., Medintz, I. L., Angew. Chem. Int.Ed. 2006, 45, 4562–4588.
[24] Huang, X. Y., Li, L., Qian, H. F., Dong, C. Q., Ren, J.,Angew. Chem. Int. Ed. 2006, 45, 5140–5143.
[25] Zhang, S., Yan, Y., Bi, S., Anal. Chem. 2009, 81,8695–8701.
[26] Freeman, R., Liu, X., Willner, I., J. Am. Chem. Soc. 2011,133, 11597–11604.
[27] Liu, X., Freeman, R., Golub, E., Willner, I., ACS Nano2011, 5, 7648–7655.
[28] Lee, J. S., Joung, H. A., Kim, M. G., Park, C. B., ACS Nano,2012, 6, 2978–2983.
[29] Zhao, S., Li, X., Liu, Y. M., Anal. Chem. 2009, 81,3873–3878.
[30] Lara, F. J., Garcıa-Campana, A. M., Aaron, J. J., Anal.Chim. Acta 2010, 679, 17–30.
[31] Thorpe, G. H. G., Kricka, L. J., Moseley, S. R., Whitehead,T. P., Clin. Chem. 1985, 31, 1335–1341.
[32] Whitehead, T. P., Thorpe, G. H. G., Carter, T.J.N., Groucutt,C., Kricka, L. J., Nature 1983, 305, 159–160.
[33] Shi, M. Zhao, S., Huang, Y., Liu, Y. M., Ye, F., J. Chro-matogr. B 2011, 879, 2840–2846.
[34] Qin, G., Zhao, S., Huang, Y., Jiang, J., Ye, F., Anal. Chem.2012, 84, 2708–2712.
[35] Wang, J., Ren, J., Electrophoresis 2005, 26, 2402–2408.
C© 2014 WILEY-VCH Verlag GmbH & Co. KGaA, Weinheim www.electrophoresis-journal.com