highly sensitive homogenous immunoassay of cancer biomarker using silver nanoparticles enhanced...
TRANSCRIPT
Hn
LC
a
ARRAA
KSFFHA
1
fcattasipdiflcrtn
to
0d
Talanta 81 (2010) 1560–1567
Contents lists available at ScienceDirect
Talanta
journa l homepage: www.e lsev ier .com/ locate / ta lanta
ighly sensitive homogenous immunoassay of cancer biomarker using silveranoparticles enhanced fluorescence correlation spectroscopy
ichuan Tang, Chaoqing Dong, Jicun Ren ∗
ollege of Chemistry and Chemical Engineering, State Key Laboratory of Metal Matrix Composites, Shanghai Jiaotong University, 800 Dongchuan Road, Shanghai, 200240, PR China
r t i c l e i n f o
rticle history:eceived 18 December 2009eceived in revised form 1 March 2010ccepted 2 March 2010vailable online 7 March 2010
eywords:ilver nanoparticle
a b s t r a c t
In this paper, we developed a highly sensitive homogeneous immunoassay by combining fluorescencecorrelation spectroscopy (FCS) with silver nanoparticles (SNPs)–antibody conjugates as probes. We firstsynthesized 14 nm SNPs in aqueous solution and then modified SNPs with 11-mercaptoundecanoicacid(MUA) via SNP–S bond. Resonance light scattering correlation spectroscopy (RLSCS) was utilized to char-acterize SNPs and MUA–functionalized SNPs (MUA–SNPs). The immune reaction of alpha fetal protein(AFP) antigen and its antibody was used as a reaction model and AFP labeled with Alexa Fluor 647 was usedas the tracer antigen in homogeneous competitive immunoassay. We observed that the antigen–antibody
luorescence correlation spectroscopyluorescence enhancementomogeneous immunoassaylpha fetal protein
complexes showed the significant increase in the diffusion times and fluorescence intensity compared tofree dye-labeled antigen. On the advantages of the effects of SNPs on fluorescence enhancement and dif-fusion time, the homogeneous competitive immunoassay was performed by the two-component modelanalysis of FCS. Under the optimal condition, the detection limit was 1.5 pM and the linear range wasfrom 6 pM to 60 pM (R > 0.99). This assay was successfully applied for the determination of the AFP level
s, the
in human serum sample90%.. Introduction
Currently, immunoassay is widely used in clinical diagnosis,ood and environmental analysis and biological and biomedi-al studies [1–5]. The conventional heterogeneous immunoassaysre considered to be labor intensive and time-consuming due tohe requirements of tedious separation and washing steps beforehe signal measurement [6]. Homogeneous immunoassay is anttractive alternative to conventional heterogeneous immunoas-ays since it can directly determine analytes (antigen or antibody)n the immune reaction mixture, and this method is usually sim-le, fast and amenable to miniaturization and automation [7,8]. Toate, several analytical methods have been used in homogeneous
mmunoassays, which mainly include fluorescence polarization [8],uorescence resonance energy transfer (FRET) [9], and fluorescenceorrelation spectroscopy (FCS) [10–12]. However, most of the cur-ent homogeneous immunoassays are generally less sensitive thanheir heterogeneous counterparts due to their high background
oise.FCS is a single molecule detection (SMD) technique based on theime-averaging fluctuation analysis for observation of the diffusionf molecules (or particles) in the small detection volume [13–15].
∗ Corresponding author. Tel.: +86 21 54746001; fax: +86 21 54741297.E-mail address: [email protected] (J. Ren).
039-9140/$ – see front matter © 2010 Elsevier B.V. All rights reserved.oi:10.1016/j.talanta.2010.03.002
relative standard deviation was about 5%, and the recoveries were over
© 2010 Elsevier B.V. All rights reserved.
On the advantages of high sensitivity, extremely small samplerequirement and short analysis time, FCS currently becomes anall-purposed and powerful technique to study binding interac-tions [16,17], especially in homogeneous immunoassays [10,11,18].Nevertheless, FCS system is still difficult to be utilized for clinicaldiagnoses since the specificity and sensitivity were unsatisfactory.So far, two strategies are used to overcome this limitation: (1)Use of fluorescence cross-correlation spectroscopy (FCCS) model.In this strategy, FCCS model can overcome the limitation above-mentioned and increase the detection sensitivity and selectivity[10,19], but this model requires the complicated two laser opti-cal system and two-color labeling process. (2) Amplification of themolecular weight difference between antigen and immune com-plex. In general, to distinguish two components in FCS assay, theircharacteristic diffusion times must differ by a factor of at least 1.6[20]. Sandwich immune strategy was used to increase the molecu-lar weight of the immune complex [11,21], but the sensitivity wasrestricted by the limited diffusion difference and the interferenceof multiple antibodies. In competitive immunoassay, only few littleantigens and large antibodies match such requirement of molecularweight difference [17,18,22].
Gold nanoparticles (GNPs) and silver nanoparticles (SNPs) asprobes are widely used in cell imaging [23–25], DNA hybridiza-tion detection [7,26–29], proteins interaction [30–32], due totheir extremely strong absorption and light scattering in theplasmon resonance wavelength regions. Recently, some groups
L. Tang et al. / Talanta 81 (2010) 1560–1567 1561
F r nanm The imc assay
fit(cflooifl
icitees1wcMj[Aip
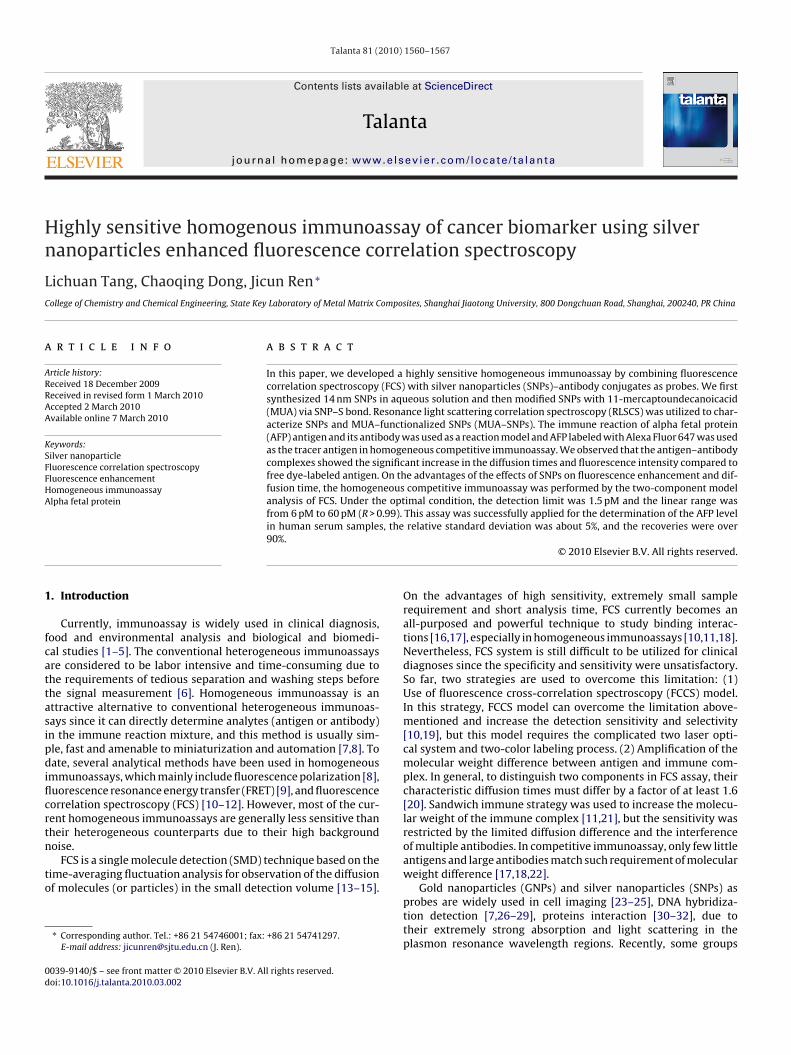
ig. 1. Schematic illustration of homogeneous competitive immunoassay using silveodification of SNPs with MUA. (B) Conjugation of SNP–MUA with antibody. (C)
ompetitive immune reaction. (E) and (F) The principle of the competitive immuno
ound that some metal nanoparticles such as SNPs were used toncrease the fluorescent intensity in the metal–fluorophore sys-em [33–37]. This effect is called as metal-enhanced fluorescenceMEF) [28,33,38]. The enhancement efficiency is proved to belosely related with the distance between metal nanoparticles anduorophores, and generally, about 10 nm is considered to be anptimal value for the most efficient MEF [33,39]. But, in the casef large proteins such as green fluorescence protein (GFP) [40] andmmune reaction system [41], SNPs also show MEF coupled withuorophores.
In this paper, we developed a highly sensitive homogeneousmmunoassay by using silver nanoparticles enhanced fluorescenceorrelation spectroscopy (FCS). The principle and procedure of thismmunoassay are shown in Fig. 1. In the immunoassay, SNPs servedwo functions. The one was to enlarge the molecule weight differ-nce between the immunocomplex and antigen, and another was tonhance the fluorescent intensity of fluoroprobes. We first synthe-ized 14 nm SNPs in aqueous solution and then modified SNPs with1-mercaptoundecanoicacid (MUA) via SNP–S bond. MUA–SNPsere covalently linked with antibody. Resonance light scattering
orrelation spectroscopy (RLSCS) [42] was utilized to characterizeUA–functionalized SNPs (MUA–SNPs) and SNPs–antibody con-
ugates. The immune reaction of alpha fetal protein (AFP) antigen43] and its antibody was used as a reaction model in this study.FP labeled with Alexa Fluor 647 was used as the tracer antigen
n homogeneous competitive immunoassay. In the FCS based com-etitive immunoassay, we used the two-component analysis model
oparticles (SNPs) enhanced fluorescence correlation spectroscopy (FCS). (A) Surfacemune reaction of SNP–antibody conjugations with dye-labeled antigen. (D) The
based on FCS.
[11,17,18,22]. Under the optimal condition, the detection limit was1.5 pM AFP and the linear ranges were from 6 pM to 60 pM. Thisassay was successfully applied for the determination of the AFPlevel in human serum samples.
2. Experimental
2.1. Reagents and instruments
Sodium citrate trihydrate (≥99.9%), AgNO3 (≥99.9%), NaBH4(≥98%), and poly(ethylene glycol) (PEG. 2 kDa) were prod-ucts of Sinophram Chemical Reagent Co. (Shanghai, China).11-Mercaptoundecanoic acid (MUA, ≥95%), and 1-ethyl-3-(3-dimethylaminopropyl)-carbodiimide hydrochloride (EDC, ≥99%)and N-hydroxysulfosuccinimide (Sulfo-NHS, ≥98.5%) were pur-chased from Sigma–Aldrich. Mouse anti-human monoclonal alphafetal protein antibodies and AFP antigen protein were provided byBeijing North Institute of Biological Technology (Beijing, China).Alexa Fluor 647 was obtained from Invitrogen Co. (USA). All solu-tions were prepared using ultra-pure water (18.2 M�) obtainedfrom the Millipore Simplicity System (Millipore, Bedford, MA, USA).
2.2. Preparation of Alexa Fluor 647-labeled antigen
The antigen (AFP) was labeled with the succinimidyl esters flu-orescence dye (Alexa Fluor 647) according to the manufacturer’sinstruction. The amine-reactive succinimidyl ester form of the dye
1 ta 81
aaareg(Na
2
dosNckTse
2
1TS(f
2
EcStp(stPe
s2wdu(m
2
as
t
))
562 L. Tang et al. / Talan
nd antigen were dissolved in sodium carbonate-sodium bicarbon-te buffer solution (pH 9.4, containing 20 mL of 0.01 M Na2CO3nd 80 mL of 0.01 M NaHCO3) at a molar ratio of 1/1 for 24 hesulting in the covalent attachment of the dye to the lysine andnd-terminal amine groups on the antigen. The dye-labeled anti-en was ultrafiltrated three times to remove unbound dye with PBSpH 7.4, containing 81 mL of 0.01 M Na2HPO4 and 19 mL of 0.015 MaH2PO4). The residue was dissolved in PBS and stored in the darkt 4 ◦C and working dilutions were made daily.
.3. Synthesis of SNPs
Synthesis of SNPs was performed according to the procedureescribed in the reference [24,44]. Briefly, we first mixed 96 mLf 0.25 mM AgNO3 solution with 1 mL 30 mM sodium citrate andtirred this mixture constantly at 30 ◦C. And then, 3 mL of 10 mMaBH4 stored in ice was added into the mixed solution, and theolor of the solution changed from colorless to bright yellow. Weept up stirring the mixed solution at room temperature for 30 min.he as-prepared SNPs were characterized by UV–vis absorptionpectroscopy, resonance scattering spectroscopy and transmissionlectron microscopy, respectively.
.4. Modification of SNPs with MUA
Twenty five micrograms of MUA in ethanol was added intomL SNPs solution (about 1.4 nM) and then stirred for 30 seconds.his mixture was kept up reacting at room temperature for 2–4 h.NPs–MUA was washed three times with PBS by centrifugation12,000 rpm, 30 min, at 4 ◦C). SNPs–MUA was stored at 4 ◦C forurther use.
.5. Conjugation of SNPs with antibody
Conjugation of SNPs with antibody was carried out usingDC and Sulfo-NHS as linking reagents according to the proto-ol described in the reference [24]. Briefly, 8 �g EDC and 39 �gulfo-NHS were first added into 1 mL SNP–MUA solution (2.8 nM)o amidate carboxyl terminus of MUA on SNPs for 40 min to pre-are SNP–MUA@NH nanoparticles in the presence of 0.05% PEGw/v). PEG was used to block nonspecific binding sites on theurface of metal nanoparticles for preventing nonspecific adsorp-ion of the antibody in following reaction [24]. PBS containingEG (0.05%, w/v) was used in the following steps unless oth-rwise indicated. And then, a given of antibody was added the
olution above, the solution was stirred for 2 min and reacted forh at room temperature and 12 h at 4 ◦C. The final SNPs–antibodyas centrifuged to remove unbound antibody in suspension. Theeposition was redissolved in PBS and was stored at 4 ◦C forse within one week. We obtained two different molar ratioSNPs/antibody) SNPs–antibody conjugates by controlling the
olar ratio of SNPs/antibody in conjugation process.
G(�) = 1N
(1 − Tt + Tt exp
(−�
�triple
.6. Immune reaction
All immune reactions were preformed in PBS containing PEGnd all vessels including pipettes, tips and the coverslip wereterilized strictly. The mixture of Alexa Fluor 647-labeled anti-
(2010) 1560–1567
gen (AFP) and SNPs–antibody conjugates (2:1 and 6:1 molar ratiosfor low-antibody–SNPs conjugate and high-antibody–SNPs con-jugate respectively) was incubated at 37 ◦C for 30 min to formthe SNPs–antibody–fluorescent-labeled AFP complex (SAFAC). TheSAFAC solution was stored at 4 ◦C. In competitive immunoassay, theunlabeled AFP reacted with the SAFAC to release the dye-labeledAFP. With the increase of the unlabeled AFP, the SAFAC concen-tration would decrease and the dye-labeled AFP concentrationwould increase in solution. Experimentally, a given of unlabeledAFP and SAFAC prepared freshly were mixed gently and incubatedfor another 30 min at 37 ◦C, and then about 30 �L sample was sub-jected to FCS measurements immediately. The measuring time persample was 120 s.
2.7. FCS measurements
FCS measurements were carried on a home-built FCS systemsimilar to the previously reported setup [45]. In brief, an invertedfluorescence microscope (IX71, Olympus, Japan) was used as theoptical system. He–Ne laser with 632.8 nm wavelength (HongyangLaser Co., Shanghai, China) was reflected by a dichroic mirror (650DRLP, Omega Optical, USA), and then focused into the samplesolution by a water immersion objective (UplanApo, 60 × NA1.2,Olympus, Japan). About 30 �L sample was placed on a cover-slip. The fluorescence emission was filtered by a band-pass filter(682DF20, Omega Optical, USA), and lastly, was collected after pass-ing the 65 �m pinhole by avalanche photodiodes (SPCM-AQR14,PerkinElmer EG&G, Canada). The yielded signals were tracked andcorrelated by a real time correlator (Flex02-12D/C, Correlator.com,USA). The measuring time per sample was 60–120 s.
2.8. Data analysis
For fluorescent particles diffusing in a three-dimensional Gaus-sian volume element, FCS function is expressed according to Eq. (1)[13–15]
G(�) = 1N
·(
1 + Tte−�/�triplet
1 − Tt
)· 1(
1 + ��D
) · 1√1 +
(ω0z0
)2 · ��D
(1)
All obtained FCS data were analyzed with the standard equationfor particles diffusing in a three-dimensional Gaussian volume ele-ment and nonlinearly fitted with the Origin 6.1 software packagebased on the Levenberg–Marquardt algorithm. This fit is based ontwo-component model as following [11,17,18,22]:⎛⎜⎜⎝ 1 − Y(
1 + ��free
)√1 + ω2
0Z2
0
��free
+ Y
(1 + �
�bound
)√1 + ω2
0Z2
0
��bound
⎞⎟⎟⎠ (2)
Where Y denotes the bound ratio of the antibody to the antigen, ifY = 0, the Eq. (2) denotes single-component model. �free and �bound
are the characteristic diffusion times of the free Alexa Fluor 647-labeled antigen and the SNPs–antibody–antigen complex.
2.9. Resonance light scattering correlation spectroscopy (RLSCS)
The principle and set of RLSCS are similar to that of FCS onthe basis of the effect of resonance light scattering (RLS) of metal
nanoparticles. Like FCS, RLSCS offers scattering light intensities andcharacteristic diffusion time of metal nanoparticles such as GNPs,as well as other information obtained by autocorrelation function[42]. Herein, RLSCS was used to characterize the modification ofSNPs and conjugation of SNPs with antibody. In RLSCS, argon ion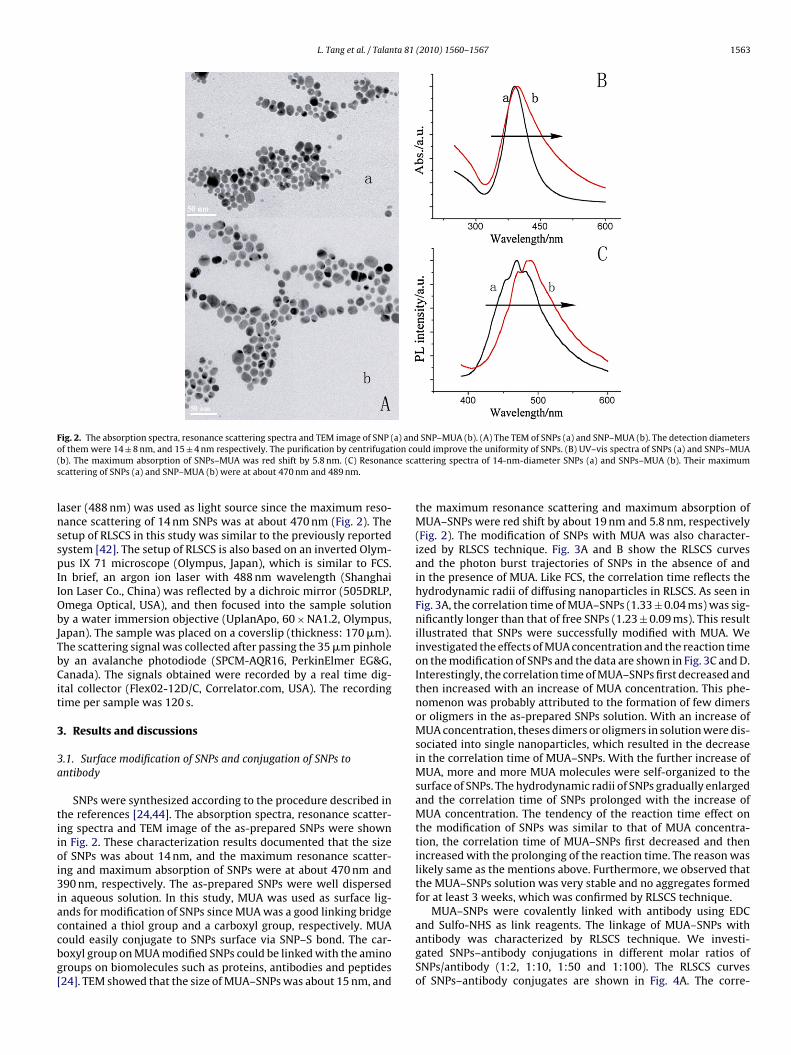
L. Tang et al. / Talanta 81 (2010) 1560–1567 1563
F a) ando ion co( ce scas
lnsspIIObJTbCit
3
3a
tiioi3iaccbg[
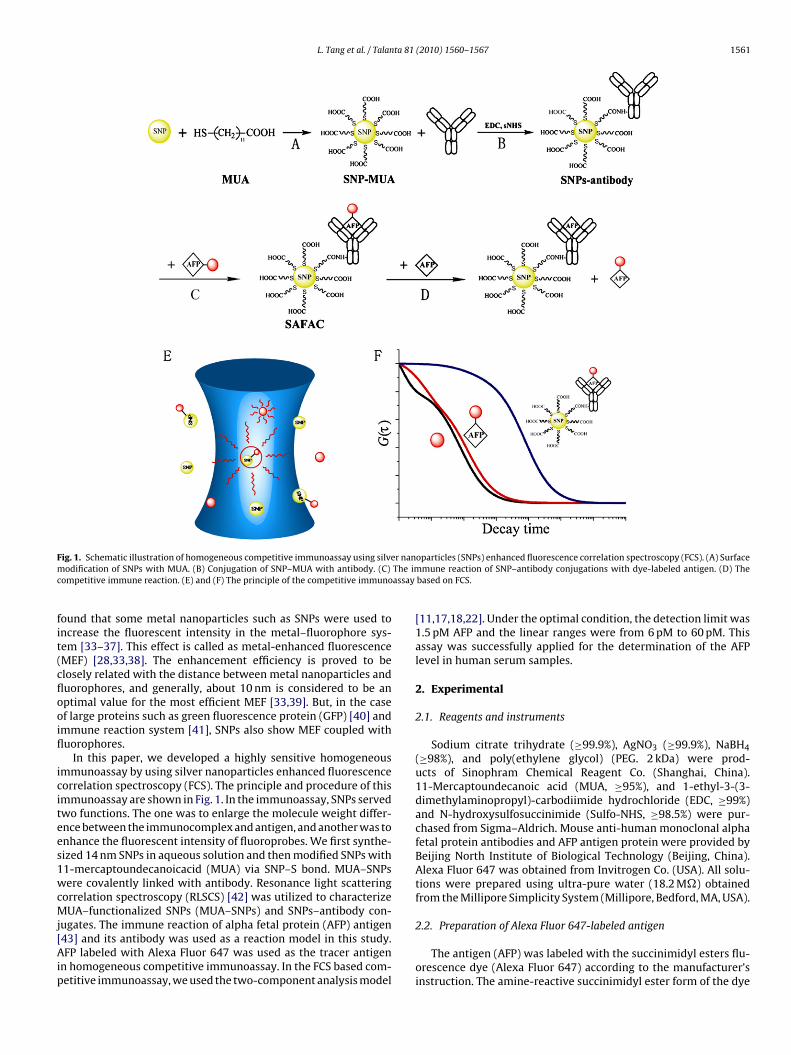
ig. 2. The absorption spectra, resonance scattering spectra and TEM image of SNP (f them were 14 ± 8 nm, and 15 ± 4 nm respectively. The purification by centrifugatb). The maximum absorption of SNPs–MUA was red shift by 5.8 nm. (C) Resonancattering of SNPs (a) and SNP–MUA (b) were at about 470 nm and 489 nm.
aser (488 nm) was used as light source since the maximum reso-ance scattering of 14 nm SNPs was at about 470 nm (Fig. 2). Theetup of RLSCS in this study was similar to the previously reportedystem [42]. The setup of RLSCS is also based on an inverted Olym-us IX 71 microscope (Olympus, Japan), which is similar to FCS.
n brief, an argon ion laser with 488 nm wavelength (Shanghaion Laser Co., China) was reflected by a dichroic mirror (505DRLP,mega Optical, USA), and then focused into the sample solutiony a water immersion objective (UplanApo, 60 × NA1.2, Olympus,apan). The sample was placed on a coverslip (thickness: 170 �m).he scattering signal was collected after passing the 35 �m pinholey an avalanche photodiode (SPCM-AQR16, PerkinElmer EG&G,anada). The signals obtained were recorded by a real time dig-
tal collector (Flex02-12D/C, Correlator.com, USA). The recordingime per sample was 120 s.
. Results and discussions
.1. Surface modification of SNPs and conjugation of SNPs tontibody
SNPs were synthesized according to the procedure described inhe references [24,44]. The absorption spectra, resonance scatter-ng spectra and TEM image of the as-prepared SNPs were shownn Fig. 2. These characterization results documented that the sizef SNPs was about 14 nm, and the maximum resonance scatter-ng and maximum absorption of SNPs were at about 470 nm and90 nm, respectively. The as-prepared SNPs were well dispersed
n aqueous solution. In this study, MUA was used as surface lig-nds for modification of SNPs since MUA was a good linking bridge
ontained a thiol group and a carboxyl group, respectively. MUAould easily conjugate to SNPs surface via SNP–S bond. The car-oxyl group on MUA modified SNPs could be linked with the aminoroups on biomolecules such as proteins, antibodies and peptides24]. TEM showed that the size of MUA–SNPs was about 15 nm, andSNP–MUA (b). (A) The TEM of SNPs (a) and SNP–MUA (b). The detection diametersuld improve the uniformity of SNPs. (B) UV–vis spectra of SNPs (a) and SNPs–MUAttering spectra of 14-nm-diameter SNPs (a) and SNPs–MUA (b). Their maximum
the maximum resonance scattering and maximum absorption ofMUA–SNPs were red shift by about 19 nm and 5.8 nm, respectively(Fig. 2). The modification of SNPs with MUA was also character-ized by RLSCS technique. Fig. 3A and B show the RLSCS curvesand the photon burst trajectories of SNPs in the absence of andin the presence of MUA. Like FCS, the correlation time reflects thehydrodynamic radii of diffusing nanoparticles in RLSCS. As seen inFig. 3A, the correlation time of MUA–SNPs (1.33 ± 0.04 ms) was sig-nificantly longer than that of free SNPs (1.23 ± 0.09 ms). This resultillustrated that SNPs were successfully modified with MUA. Weinvestigated the effects of MUA concentration and the reaction timeon the modification of SNPs and the data are shown in Fig. 3C and D.Interestingly, the correlation time of MUA–SNPs first decreased andthen increased with an increase of MUA concentration. This phe-nomenon was probably attributed to the formation of few dimersor oligmers in the as-prepared SNPs solution. With an increase ofMUA concentration, theses dimers or oligmers in solution were dis-sociated into single nanoparticles, which resulted in the decreasein the correlation time of MUA–SNPs. With the further increase ofMUA, more and more MUA molecules were self-organized to thesurface of SNPs. The hydrodynamic radii of SNPs gradually enlargedand the correlation time of SNPs prolonged with the increase ofMUA concentration. The tendency of the reaction time effect onthe modification of SNPs was similar to that of MUA concentra-tion, the correlation time of MUA–SNPs first decreased and thenincreased with the prolonging of the reaction time. The reason waslikely same as the mentions above. Furthermore, we observed thatthe MUA–SNPs solution was very stable and no aggregates formedfor at least 3 weeks, which was confirmed by RLSCS technique.
MUA–SNPs were covalently linked with antibody using EDC
and Sulfo-NHS as link reagents. The linkage of MUA–SNPs withantibody was characterized by RLSCS technique. We investi-gated SNPs–antibody conjugations in different molar ratios ofSNPs/antibody (1:2, 1:10, 1:50 and 1:100). The RLSCS curvesof SNPs–antibody conjugates are shown in Fig. 4A. The corre-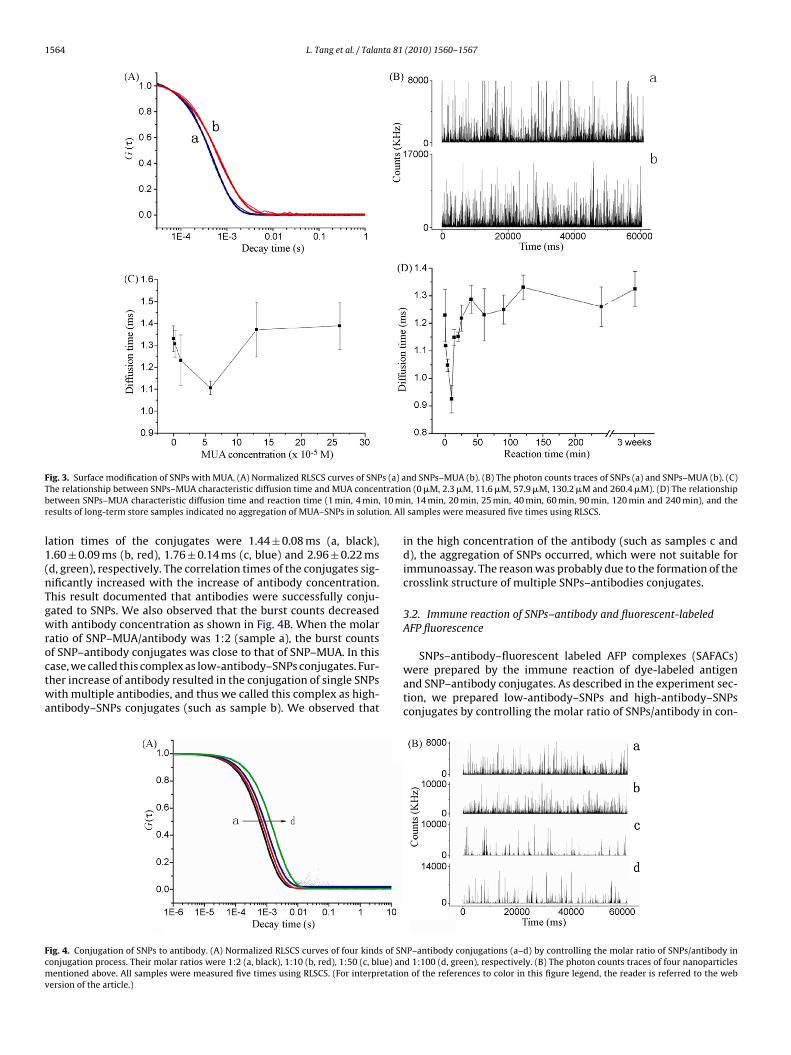
1564 L. Tang et al. / Talanta 81 (2010) 1560–1567
F s (a) aT tratiob 10 mir on. All
l1(nTgwroctwa
Fcmv
ig. 3. Surface modification of SNPs with MUA. (A) Normalized RLSCS curves of SNPhe relationship between SNPs–MUA characteristic diffusion time and MUA concenetween SNPs–MUA characteristic diffusion time and reaction time (1 min, 4 min,esults of long-term store samples indicated no aggregation of MUA–SNPs in soluti
ation times of the conjugates were 1.44 ± 0.08 ms (a, black),.60 ± 0.09 ms (b, red), 1.76 ± 0.14 ms (c, blue) and 2.96 ± 0.22 msd, green), respectively. The correlation times of the conjugates sig-ificantly increased with the increase of antibody concentration.his result documented that antibodies were successfully conju-ated to SNPs. We also observed that the burst counts decreasedith antibody concentration as shown in Fig. 4B. When the molar
atio of SNP–MUA/antibody was 1:2 (sample a), the burst counts
f SNP–antibody conjugates was close to that of SNP–MUA. In thisase, we called this complex as low-antibody–SNPs conjugates. Fur-her increase of antibody resulted in the conjugation of single SNPsith multiple antibodies, and thus we called this complex as high-ntibody–SNPs conjugates (such as sample b). We observed that
ig. 4. Conjugation of SNPs to antibody. (A) Normalized RLSCS curves of four kinds of SNonjugation process. Their molar ratios were 1:2 (a, black), 1:10 (b, red), 1:50 (c, blue) anentioned above. All samples were measured five times using RLSCS. (For interpretatio
ersion of the article.)
nd SNPs–MUA (b). (B) The photon counts traces of SNPs (a) and SNPs–MUA (b). (C)n (0 �M, 2.3 �M, 11.6 �M, 57.9 �M, 130.2 �M and 260.4 �M). (D) The relationshipn, 14 min, 20 min, 25 min, 40 min, 60 min, 90 min, 120 min and 240 min), and thesamples were measured five times using RLSCS.
in the high concentration of the antibody (such as samples c andd), the aggregation of SNPs occurred, which were not suitable forimmunoassay. The reason was probably due to the formation of thecrosslink structure of multiple SNPs–antibodies conjugates.
3.2. Immune reaction of SNPs–antibody and fluorescent-labeledAFP fluorescence
SNPs–antibody–fluorescent labeled AFP complexes (SAFACs)were prepared by the immune reaction of dye-labeled antigenand SNP–antibody conjugates. As described in the experiment sec-tion, we prepared low-antibody–SNPs and high-antibody–SNPsconjugates by controlling the molar ratio of SNPs/antibody in con-
P–antibody conjugations (a–d) by controlling the molar ratio of SNPs/antibody ind 1:100 (d, green), respectively. (B) The photon counts traces of four nanoparticlesn of the references to color in this figure legend, the reader is referred to the web
L. Tang et al. / Talanta 81 (2010) 1560–1567 1565
F plex-( pM) an lexa 6i
jflslat7mo(tiSsLhF
tflcptc
FrS(t
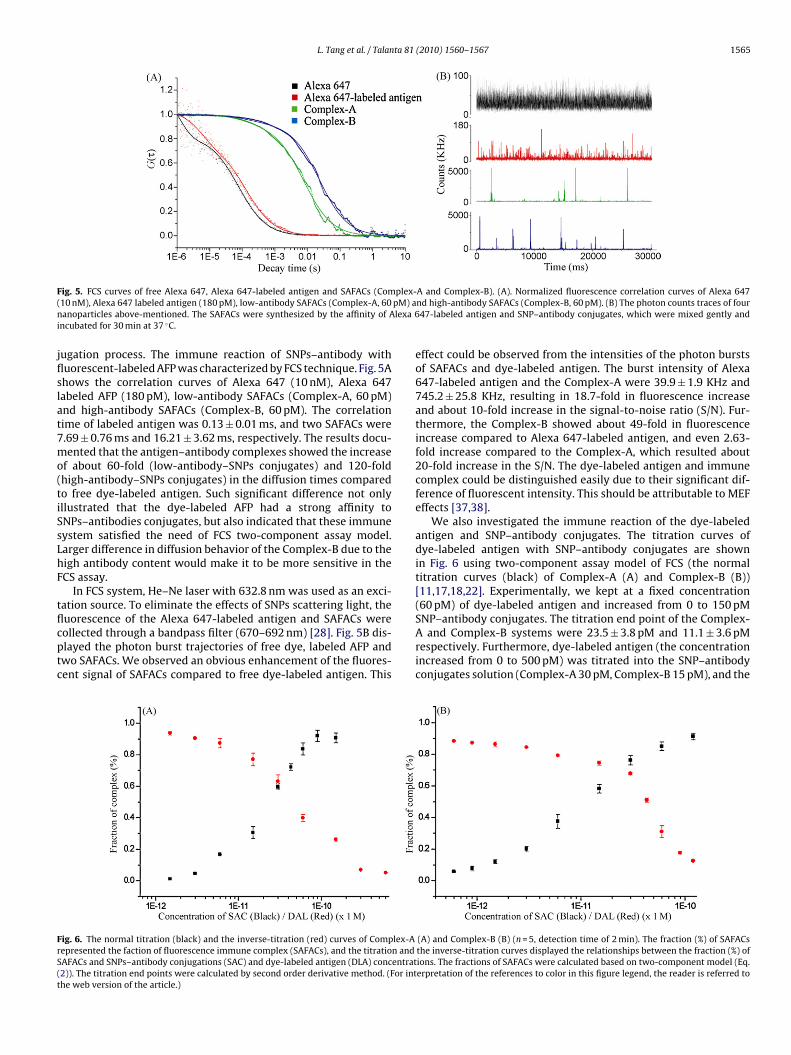
ig. 5. FCS curves of free Alexa 647, Alexa 647-labeled antigen and SAFACs (Com10 nM), Alexa 647 labeled antigen (180 pM), low-antibody SAFACs (Complex-A, 60anoparticles above-mentioned. The SAFACs were synthesized by the affinity of A
ncubated for 30 min at 37 ◦C.
ugation process. The immune reaction of SNPs–antibody withuorescent-labeled AFP was characterized by FCS technique. Fig. 5Ahows the correlation curves of Alexa 647 (10 nM), Alexa 647abeled AFP (180 pM), low-antibody SAFACs (Complex-A, 60 pM)nd high-antibody SAFACs (Complex-B, 60 pM). The correlationime of labeled antigen was 0.13 ± 0.01 ms, and two SAFACs were.69 ± 0.76 ms and 16.21 ± 3.62 ms, respectively. The results docu-ented that the antigen–antibody complexes showed the increase
f about 60-fold (low-antibody–SNPs conjugates) and 120-foldhigh-antibody–SNPs conjugates) in the diffusion times comparedo free dye-labeled antigen. Such significant difference not onlyllustrated that the dye-labeled AFP had a strong affinity toNPs–antibodies conjugates, but also indicated that these immuneystem satisfied the need of FCS two-component assay model.arger difference in diffusion behavior of the Complex-B due to theigh antibody content would make it to be more sensitive in theCS assay.
In FCS system, He–Ne laser with 632.8 nm was used as an exci-ation source. To eliminate the effects of SNPs scattering light, the
uorescence of the Alexa 647-labeled antigen and SAFACs wereollected through a bandpass filter (670–692 nm) [28]. Fig. 5B dis-layed the photon burst trajectories of free dye, labeled AFP andwo SAFACs. We observed an obvious enhancement of the fluores-ent signal of SAFACs compared to free dye-labeled antigen. Thisig. 6. The normal titration (black) and the inverse-titration (red) curves of Complex-Aepresented the faction of fluorescence immune complex (SAFACs), and the titration andAFACs and SNPs–antibody conjugations (SAC) and dye-labeled antigen (DLA) concentrat2)). The titration end points were calculated by second order derivative method. (For inthe web version of the article.)
A and Complex-B). (A). Normalized fluorescence correlation curves of Alexa 647nd high-antibody SAFACs (Complex-B, 60 pM). (B) The photon counts traces of four47-labeled antigen and SNP–antibody conjugates, which were mixed gently and
effect could be observed from the intensities of the photon burstsof SAFACs and dye-labeled antigen. The burst intensity of Alexa647-labeled antigen and the Complex-A were 39.9 ± 1.9 KHz and745.2 ± 25.8 KHz, resulting in 18.7-fold in fluorescence increaseand about 10-fold increase in the signal-to-noise ratio (S/N). Fur-thermore, the Complex-B showed about 49-fold in fluorescenceincrease compared to Alexa 647-labeled antigen, and even 2.63-fold increase compared to the Complex-A, which resulted about20-fold increase in the S/N. The dye-labeled antigen and immunecomplex could be distinguished easily due to their significant dif-ference of fluorescent intensity. This should be attributable to MEFeffects [37,38].
We also investigated the immune reaction of the dye-labeledantigen and SNP–antibody conjugates. The titration curves ofdye-labeled antigen with SNP–antibody conjugates are shownin Fig. 6 using two-component assay model of FCS (the normaltitration curves (black) of Complex-A (A) and Complex-B (B))[11,17,18,22]. Experimentally, we kept at a fixed concentration(60 pM) of dye-labeled antigen and increased from 0 to 150 pM
SNP–antibody conjugates. The titration end point of the Complex-A and Complex-B systems were 23.5 ± 3.8 pM and 11.1 ± 3.6 pMrespectively. Furthermore, dye-labeled antigen (the concentrationincreased from 0 to 500 pM) was titrated into the SNP–antibodyconjugates solution (Complex-A 30 pM, Complex-B 15 pM), and the(A) and Complex-B (B) (n = 5, detection time of 2 min). The fraction (%) of SAFACsthe inverse-titration curves displayed the relationships between the fraction (%) ofions. The fractions of SAFACs were calculated based on two-component model (Eq.erpretation of the references to color in this figure legend, the reader is referred to
1566 L. Tang et al. / Talanta 81 (2010) 1560–1567
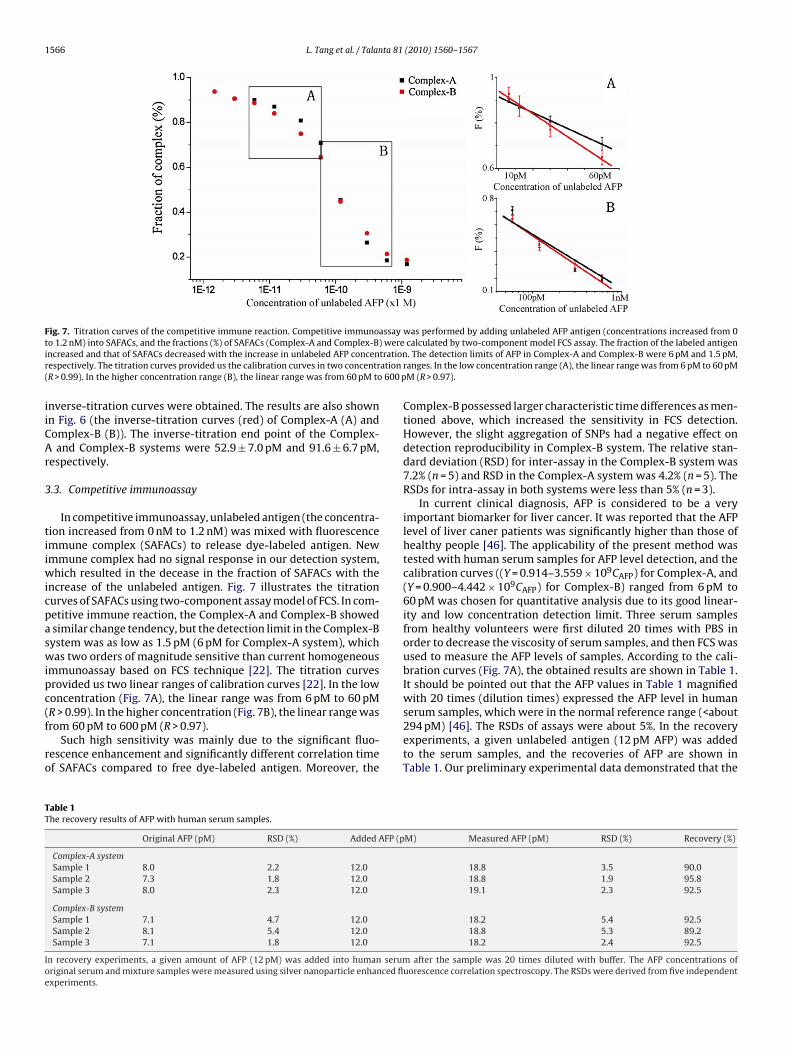
Fig. 7. Titration curves of the competitive immune reaction. Competitive immunoassay was performed by adding unlabeled AFP antigen (concentrations increased from 0t werei trationr ation( 600 p
iiCAr
3
tiiwicpaswipc(f
ro
TT
Ioe
o 1.2 nM) into SAFACs, and the fractions (%) of SAFACs (Complex-A and Complex-B)ncreased and that of SAFACs decreased with the increase in unlabeled AFP concenespectively. The titration curves provided us the calibration curves in two concentrR > 0.99). In the higher concentration range (B), the linear range was from 60 pM to
nverse-titration curves were obtained. The results are also shownn Fig. 6 (the inverse-titration curves (red) of Complex-A (A) andomplex-B (B)). The inverse-titration end point of the Complex-and Complex-B systems were 52.9 ± 7.0 pM and 91.6 ± 6.7 pM,
espectively.
.3. Competitive immunoassay
In competitive immunoassay, unlabeled antigen (the concentra-ion increased from 0 nM to 1.2 nM) was mixed with fluorescencemmune complex (SAFACs) to release dye-labeled antigen. Newmmune complex had no signal response in our detection system,
hich resulted in the decease in the fraction of SAFACs with thencrease of the unlabeled antigen. Fig. 7 illustrates the titrationurves of SAFACs using two-component assay model of FCS. In com-etitive immune reaction, the Complex-A and Complex-B showedsimilar change tendency, but the detection limit in the Complex-Bystem was as low as 1.5 pM (6 pM for Complex-A system), whichas two orders of magnitude sensitive than current homogeneous
mmunoassay based on FCS technique [22]. The titration curvesrovided us two linear ranges of calibration curves [22]. In the lowoncentration (Fig. 7A), the linear range was from 6 pM to 60 pM
R > 0.99). In the higher concentration (Fig. 7B), the linear range wasrom 60 pM to 600 pM (R > 0.97).Such high sensitivity was mainly due to the significant fluo-escence enhancement and significantly different correlation timef SAFACs compared to free dye-labeled antigen. Moreover, the
able 1he recovery results of AFP with human serum samples.
Original AFP (pM) RSD (%) Added AFP (p
Complex-A systemSample 1 8.0 2.2 12.0Sample 2 7.3 1.8 12.0Sample 3 8.0 2.3 12.0
Complex-B systemSample 1 7.1 4.7 12.0Sample 2 8.1 5.4 12.0Sample 3 7.1 1.8 12.0
n recovery experiments, a given amount of AFP (12 pM) was added into human serumriginal serum and mixture samples were measured using silver nanoparticle enhanced flxperiments.
calculated by two-component model FCS assay. The fraction of the labeled antigen. The detection limits of AFP in Complex-A and Complex-B were 6 pM and 1.5 pM,
ranges. In the low concentration range (A), the linear range was from 6 pM to 60 pMM (R > 0.97).
Complex-B possessed larger characteristic time differences as men-tioned above, which increased the sensitivity in FCS detection.However, the slight aggregation of SNPs had a negative effect ondetection reproducibility in Complex-B system. The relative stan-dard deviation (RSD) for inter-assay in the Complex-B system was7.2% (n = 5) and RSD in the Complex-A system was 4.2% (n = 5). TheRSDs for intra-assay in both systems were less than 5% (n = 3).
In current clinical diagnosis, AFP is considered to be a veryimportant biomarker for liver cancer. It was reported that the AFPlevel of liver caner patients was significantly higher than those ofhealthy people [46]. The applicability of the present method wastested with human serum samples for AFP level detection, and thecalibration curves ((Y = 0.914–3.559 × 10⁹CAFP) for Complex-A, and(Y = 0.900–4.442 × 10⁹CAFP) for Complex-B) ranged from 6 pM to60 pM was chosen for quantitative analysis due to its good linear-ity and low concentration detection limit. Three serum samplesfrom healthy volunteers were first diluted 20 times with PBS inorder to decrease the viscosity of serum samples, and then FCS wasused to measure the AFP levels of samples. According to the cali-bration curves (Fig. 7A), the obtained results are shown in Table 1.It should be pointed out that the AFP values in Table 1 magnifiedwith 20 times (dilution times) expressed the AFP level in humanserum samples, which were in the normal reference range (<about
294 pM) [46]. The RSDs of assays were about 5%. In the recoveryexperiments, a given unlabeled antigen (12 pM AFP) was addedto the serum samples, and the recoveries of AFP are shown inTable 1. Our preliminary experimental data demonstrated that theM) Measured AFP (pM) RSD (%) Recovery (%)
18.8 3.5 90.018.8 1.9 95.819.1 2.3 92.5
18.2 5.4 92.518.8 5.3 89.218.2 2.4 92.5
after the sample was 20 times diluted with buffer. The AFP concentrations ofuorescence correlation spectroscopy. The RSDs were derived from five independent
ta 81
ie
4
MaAtaOcaotspe
A
2(
R
[
[
[[[[[[[[[[
[[[[[[
[[
[[[[[[[[[[[
L. Tang et al. / Talan
mmunoassay using SNPs enhancement FCS was a sensitive andfficient method for the detection of AFP marker.
. Conclusion
In this work, we first characterized the modification of SNPs withUA and conjugation of SNPs with antibody by RLSCS technique,
nd then investigated the immune reaction of SNPs–antibody andFP antigen by FCS. In the immunoassay, SNPs were used to enlarge
he molecule weight difference between the immunocomplex andntigen, and to enhance the fluorescent intensity of fluoroprobes.n the base of the SNPs effects, we developed the homogeneousompetitive immunoassay using the two-component model of FCSnalysis. This assay was successfully applied for the determinationf the AFP level in normal human serum samples. When comparedo current immunoassays, our method can be characterized as highensitivity, good selectivity, simplicity and short analysis time, andossesses great potential applications in clinical diagnosis, food andnvironmental analysis and biological and biomedical studies.
cknowledgements
This work was financially supported by NSFC (20727005,0975067) and National Basic Research Program of China2009CB930400).
eferences
[1] Z. Lin, X. Wang, Z.J. Li, S.Q. Ren, G.N. Chen, X.T. Ying, J.M. Lin, Talanta 75 (2008)965.
[2] P. Su, X.X. Zhang, Y.C. Wang, W.B. Chang, Talanta 60 (2003) 969.
[3] J.A. Gabaldon, A. Maquieira, R. Puchades, Talanta 71 (2007) 1001.[4] J. Wang, W. Huang, Y. Liu, J. Cheng, J. Yang, Anal. Chem. 76 (2004) 5393.[5] Z. Fu, H. Liu, H. Ju, Anal. Chem. 78 (2006) 6999.[6] K. Aurich, S. Nagel, G. Glockl, W. Weitschies, Anal. Chem. 79 (2007) 580.[7] C. Xie, F.G. Xu, X.Y. Huang, C.Q. Dong, J.C. Ren, J. Am. Chem. Soc. 131 (2009)12763.
[[[[[[
(2010) 1560–1567 1567
[8] T. Tachi, N. Kaji, M. Tokeshi, Y. Baba, Lab Chip 9 (2009) 966.[9] L.Z. Liu, M. Shao, X.H. Dong, X.F. Yu, Z.H. Liu, Z.K. He, Q.Y. Wang, Anal. Chem. 80
(2008) 7735.10] F. Fujii, M. Horiuchi, M. Ueno, H. Sakata, I. Nagao, M. Tamura, M. Kinjo, Anal.
Biochem. 370 (2007) 131.11] O.A. Mayboroda, A. Van Remoortere, H.J. Tanke, C.H. Hokke, A.M. Deelder, J.
Biotechnol. 107 (2004) 185.12] Z. Foldes-Papp, U. Demel, G.P. Tilz, J. Immunol. Methods 260 (2002) 117.13] E. Elson, D. Magde, Biopolymers 13 (1974) 1.14] R. Rigler, U. Mets, J. Widengren, P. Kask, Eur. Biophys. J. 22 (1993) 169.15] E. Haustein, P. Schwille, Annu. Rev. Biophys. Biomol. Struct. 36 (2007) 151.16] J. Ries, S.R. Yu, M. Burkhardt, M. Brand, P. Schwille, Nat. Methods 6 (2009) 643.17] S.Y. Tetin, K.M. Swift, E.D. Matayoshi, Anal. Biochem. 307 (2002) 84.18] S.Y. Tetin, S.D. Stroupe, Curr. Pharm. Biotechnol. 5 (2004) 9.19] Q. Ruan, S.Y. Tetin, Anal. Biochem. 374 (2008) 182.20] P. Schwille, F.J. Meyer-Almes, R. Rigler, Biophys. J. 72 (1997) 1878.21] A. Barriale, M. Rossi, M. Staiano, E. Terpetschnig, B. Barbieri, M. Rossi, S. D’Auria,
Anal. Chem. 79 (2007) 4687.22] C. Xie, C.Q. Dong, J.C. Ren, Talanta 79 (2009) 971.23] H. He, C. Xie, J.C. Ren, Anal. Chem. 80 (2008) 5951.24] T. Huang, P.D. Nallathamby, D. Gillet, X.N. Xu, Anal. Chem. 79 (2007) 7708.25] J. Zhang, Y. Fu, D. Liang, R.Y. Zhao, J.R. Lakowicz, Anal. Chem. 81 (2009) 883.26] J.W. Liu, Y. Lu, J. Am. Chem. Soc. 126 (2004) 12298.27] Y. Jiang, H. Zhao, N.N. Zhu, Y.Q. Lin, P. Yu, L.Q. Mao, Angew. Chem. Int. Ed. 47
(2008) 8601.28] K. Ray, J. Zhang, J.R. Lakowicz, Anal. Chem. 80 (2008) 7313.29] D.G. Thompson, A. Enright, K. Faulds, W.E. Smith, D. Graham, Anal. Chem. 80
(2008) 2805.30] H. Surin, I. Choi, S. Lee, Y.I. Yang, T. Kang, J. Yi, Anal. Chem. 81 (2009) 1378.31] C. Cao, S.J. Sim, Lab Chip 9 (2009) 1836.32] N. Chanda, R. Shukla, K.V. Katti, R. Kannan, Nano Lett. 9 (2009) 1798.33] J.R. Lakowicz, Anal. Biochem. 337 (2005) 171.34] K. Ray, R. Badugu, J.R. Lakowicz, J. Am. Chem. Soc. 128 (2006) 8998.35] K. Ray, M.H. Chowdhury, J.R. Lakowicz, Anal. Chem. 80 (2008) 6942.36] J. Zhang, Y. Fu, M.H. Chowdhury, J.R. Lakowicz, Nano Lett. 7 (2007) 2101.37] Y. Fu, J. Zhang, J.R. Lakowicz, Chem. Commun. 3 (2009) 313.38] J. Zhang, Y. Fu, M.H. Chowdhury, J.R. Lakowicz, J. Phys. Chem. C 112 (2008) 9172.39] K. Ray, R. Badugu, J.R. Lakowicz, J. Phys. Chem. C 111 (2007) 7091.40] Y. Fu, J. Zhang, J.R. Lakowicz, Biochem. Biophys. Res. Commun. 376 (2008) 712.
41] J. Ling, Y.F. Li, C.Z. Huang, Anal. Chem. 81 (2009) 1707.42] K.L. Wang, X. Qiu, C.Q. Dong, J.C. Ren, ChemBioChem 8 (2007) 1126.43] G.I. Abelev, Cancer Res. 28 (1968) 1344.44] L. Lu, A. Kobayashi, K. Tawa, Y. Ozaki, Chem. Mater. 18 (2006) 4894.45] P.D. Zhang, C.Q. Dong, H.F. Qian, J.C. Ren, Anal. Chim. Acta. 546 (2005) 46.46] J.R. Bloomer, Digest. Dis. Sci. 25 (1980) 241.