high performance · pdf filehigh performance lending. ... • non interest income •...
TRANSCRIPT

High Performance LendingIt’s All About the Fundamentals
© 2014 Resurgent Performance Inc.
For more information, contact 770-670-6717 or [email protected]

High Performance LendingIn previous High Performance Executive Briefings, we have focused on the traditional measures of bank performance—Return on Assets, Return on Equity, Efficiency Ratio, and other financial measures that shed light on the overall health of a bank. Today’s levels of performance may have changed from twenty years ago; however, the measures by which we judge the success, or lack thereof, in a financial institution have largely remained the same.
But what about the biggest driver to community bank earnings? How does lending factor into High Performance? One thing is clear. For community banks to remain viable into the next decade and beyond, they must be developing High Performing lending platforms that facilitate growth and quality. Organizations who do so will produce increased loans more quickly with fewer resources and – believe it not – with better risk management and compliance practices. This Executive Briefing, therefore, introduces a new facet to measuring High performance. In this study, we measure High Performance not just on the traditional ratios, but also on whether an organization is making quality, balanced, and profitable loans proportionate to their asset size.
Measuring the Lending Side of the HouseFor this study, we first defined a modified universe of High Performance Banks based on a proprietary RPI formula of two sets of financial ratios:
High Performance Lending It’s All About the FundamentalsBy L. T. (Tom) Hall, President & CEO
“To keep your balance you must keep moving.” --Albert Einstein
1© 2014 Resurgent Performance Inc.
• Efficiency Ratio
• Return on Assets
• Return on Equity
• Net Interest Margin
• Non Interest Income
• Non Interest Expense
• Leverage Ratio
• Loans to Deposits
• Loans to Core Deposits
• Loan Loss Allowance to Loans
• Noncurrent Assets + REO to Loans
• Yield on Earning Assets
• Noncurrent Loans
We divided banks from $50 million to $10 billion into four asset size bands. To account for any one-time or anomalous extremes of high or low performance, we removed any bank that was either in the top 2%, or bottom 2%, of any of the 13 measures in each asset band.

Within the asset size results, we calculated the RPI Lending Performance Score for each bank and ranked the asset size groups according to that score. A Player Banks are those organizations that rank in the Top 10% of the RPI Lending Performance Score. As with our previous High Performance briefings, B Players are those that are in the top 20%. Bankers, for most of you, you will find that being in the Top 20% is precisely the target you want to aim for in order to enhance your share and franchise value. Furthermore, getting there is all about managing the fundamentals.
A Player Performance on the Balanced RPI Performance ScoreThe balanced RPI Lending Performance Score takes into account both the lending health of an organization as evidenced by its Loans to Deposits and Core Deposits, its loan quality as evidenced by Noncurrent Loans and Noncurrent Assets, and loan profitability as evidenced by Yield and Net Interest Margin. It also balances the performance on these lending measures by demanding similarly High Performance on traditional measures of bank profitability, including ROA, ROE, and Efficiency.
In this paper, we examine how the A Players, those that score in the top 10%, measure up on both traditional and more lending-specific performance ratios.
Next, we provide some general observations on the asset size groups, as well as identify the Top 10 banks of each asset size group with the highest RPI Lending Performance Scores.
We also take a deep dive into the loan portfolios of each asset band’s A Players to examine what an A Player’s portfolio looks like in terms of commercial, consumer, mortgage, and agricultural lending.
Finally, we make recommendations that will allow all organizations to more fully balance both sides of their financial performance, while still focusing on future growth.
2© 2014 Resurgent Performance Inc.

Return on AssetsIn our previous High Performance studies in which we did not directly and specifically take into account lending measures, the A Player Banks typically outperform their B Player and lower counterparts by a wide margin. When we expand the definition of High Performance to include specific lending metrics, we find that as a result of their outstanding performance on some lending measures, A Player High Performance Lending banks do not always outperform their B Player counterparts on more traditional performance measures. In part because of their more intense focus on bringing loans into the bank, the A Player Return on Assets measure a few basis points lower than their B Player counterparts in banks over $1 billion. Some of this anomaly results from the fact that many of the A Player banks have larger than normal non margin/non interest income lines of business.
Return on EquityThe Return on Equity numbers of the smaller banks look like we might have suspected—markedly higher for A Player banks. After a bank reaches $1 billion, however, Return on Equity is not necessarily higher in the A Players, suggesting that there may be some sacrifice in terms of Return on Equity in order to keep the lending side growing. Again, the B Player banks, and banks over $1 billion, are leveraging capital to a greater extent through their non interest income.
3© 2014 Resurgent Performance Inc.

4© 2014 Resurgent Performance Inc.
Efficiency RatioA Player banks, in terms of the RPI Lending Performance Score, outperform their counterparts on Efficiency. We also found that size plays a part, as the larger the bank, typically the more efficient their operations through normal operating leverage. Certainly, that is no surprise.
Non Interest IncomeBecause A Player Banks in this study exhibit extremely strong performance on the lending side and margin management, their B Player counterparts sometimes outperform them in terms of Non Interest Income. We wouldn’t suggest A Players change their lending practices other than monitoring and optimizing as much origination income and servicing-related fees, as their markets and organizational infrastructures will bear.

Non Interest ExpenseIn banks less than $1 billion, Non Interest Expense numbers are relatively flat across all asset performance bands, which is what we expected to see. As we have discussed in previous papers on High Performance, spending less on Non Interest Expense (i.e., technology) does not necessarily equate to better efficiencies and therefore better performance. In fact, quite the reverse can be true. Often the more a bank invests in technology, which can skew its Non Interest Expense numbers short term, the more efficient and better performing they become. Other banks are investing in growth in new delivery channels and new lines of fee businesses, while rationalizing branches, streamlining lending delivery models, and controlling staff expense growth.
Net Interest MarginHands down, Net Interest Margin is a key driver of A and B Player performance in banks less than $1 billion. Banks in the top 20% in these asset size groups outscored their lower-performing peers by roughly 45 basis points. The larger the bank, however, the less impact Net Interest Margin plays in their performance, suggesting that banks over $1 billion are driven as much by loan volume as they are by margin. Banks under $1 billion in assets continue to benefit greatly from better pricing opportunities on loans and deposits.
5© 2014 Resurgent Performance Inc.
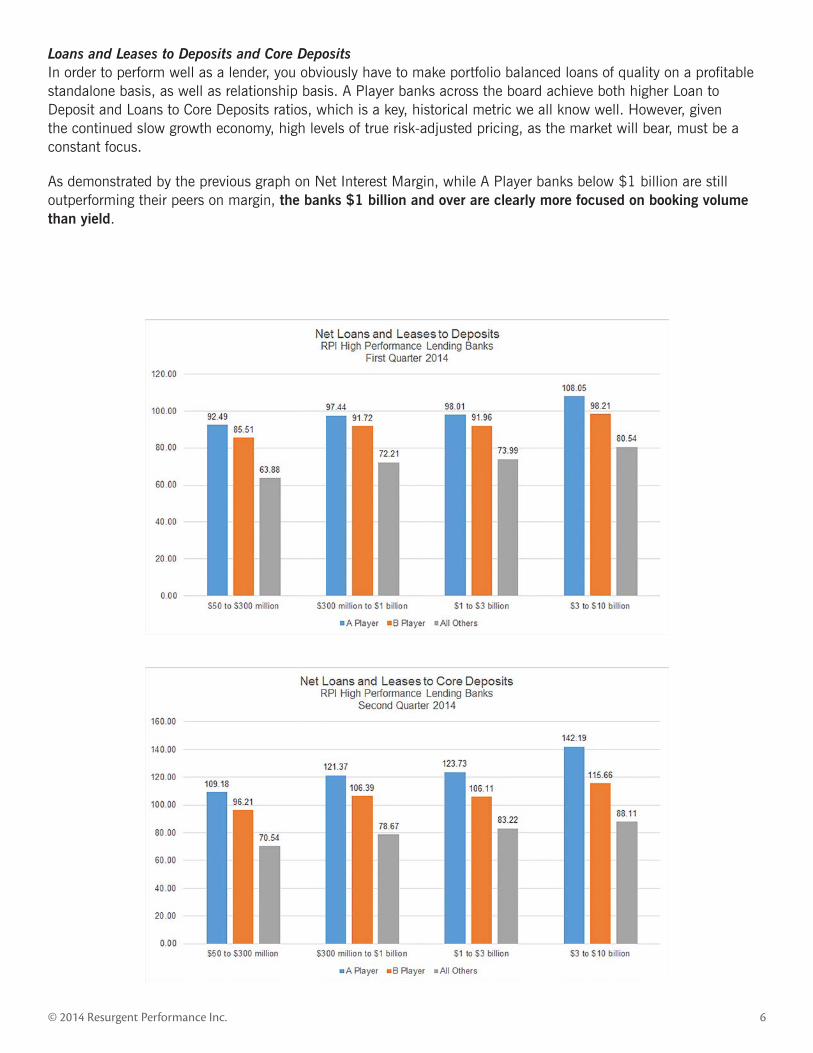
Loans and Leases to Deposits and Core DepositsIn order to perform well as a lender, you obviously have to make portfolio balanced loans of quality on a profitable standalone basis, as well as relationship basis. A Player banks across the board achieve both higher Loan to Deposit and Loans to Core Deposits ratios, which is a key, historical metric we all know well. However, given the continued slow growth economy, high levels of true risk-adjusted pricing, as the market will bear, must be a constant focus.
As demonstrated by the previous graph on Net Interest Margin, while A Player banks below $1 billion are still outperforming their peers on margin, the banks $1 billion and over are clearly more focused on booking volume than yield.
6© 2014 Resurgent Performance Inc.

Noncurrent Loans and Noncurrent AssetsEven though the worst of the all-too-recent credit crisis has passed, Noncurrent Loans and Noncurrent Assets still plague the portfolios of lower performing banks. Another flash of the obvious, but worth mentioning: The more solid the credit quality of a bank’s portfolio, the better their RPI Lending Performance Score. We mention this because in this part of the economic cycle, we are already seeing banks that are taking on excessive risks in their lending today.
7© 2014 Resurgent Performance Inc.
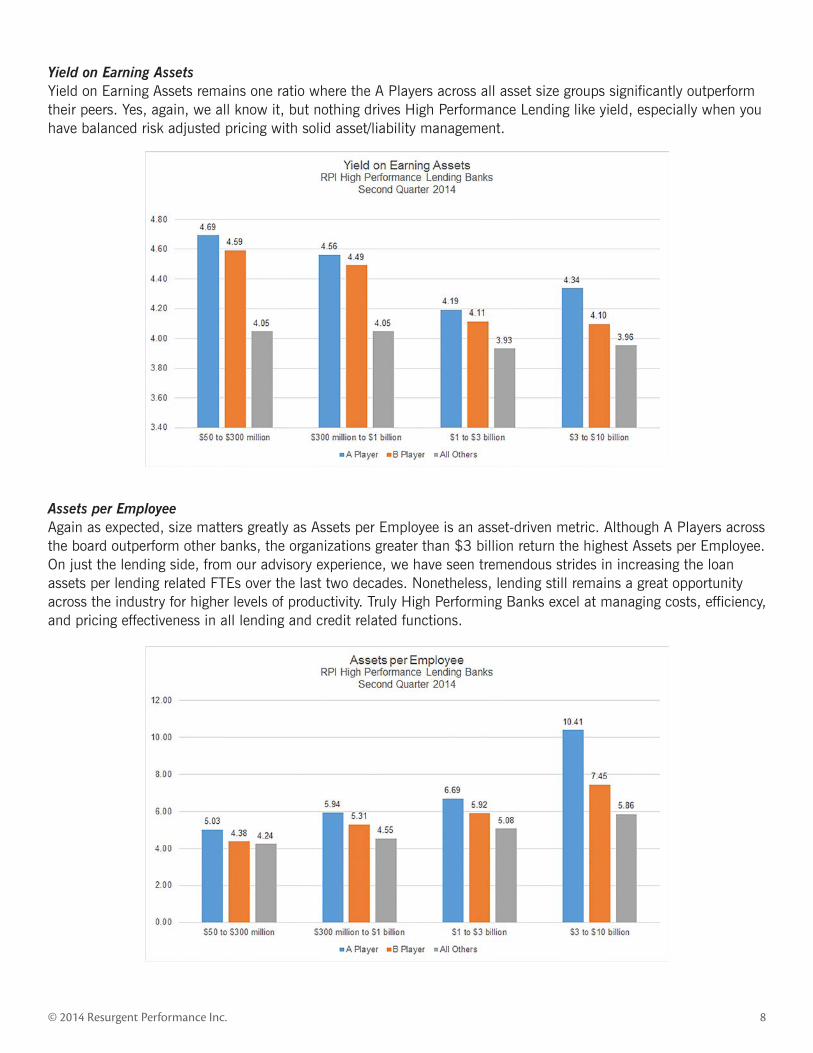
Yield on Earning AssetsYield on Earning Assets remains one ratio where the A Players across all asset size groups significantly outperform their peers. Yes, again, we all know it, but nothing drives High Performance Lending like yield, especially when you have balanced risk adjusted pricing with solid asset/liability management.
Assets per EmployeeAgain as expected, size matters greatly as Assets per Employee is an asset-driven metric. Although A Players across the board outperform other banks, the organizations greater than $3 billion return the highest Assets per Employee. On just the lending side, from our advisory experience, we have seen tremendous strides in increasing the loan assets per lending related FTEs over the last two decades. Nonetheless, lending still remains a great opportunity across the industry for higher levels of productivity. Truly High Performing Banks excel at managing costs, efficiency, and pricing effectiveness in all lending and credit related functions.
8© 2014 Resurgent Performance Inc.

Some General Observations on the Financial and Lending Performance Numbers
$50 to $300 Million Banks• Essentially, the poorer performing banks have significantly lower Loan to Deposits and have measurably lower
yields on that lower loan volume.
• Bank Non Interest Expense is typically below 3% for the Higher Performing banks.
• Many of the Higher Performing banks have higher charter numbers, reflecting that they were chartered after 2000 and have had the advantage of developing their banks with advanced technologies and lower costing delivery channels and credit/compliance analytic tools. They are also not burdened by a high-cost legacy branch network. The charter numbers tend to be lower at the bottom of the list of the banks in this asset size, reflective of much older banks that are likely burdened by brick-and-mortar branches that have not readily adopted newer technologies.
$300 Million to $1 Billion Banks• The higher performing banks report yields on earning assets generally ranging from 4.6% to 5.3%, while
banks at the bottom of this asset size category report yields that are predominately in the 3.2% to 3.7% range. Essentially, there is a 150 basis point differential between the low and High Performing banks
• Many of the Higher Performing banks appear well prepared for higher Dodd-Frank capital requirements, with most reporting core capital ranging from 10% to 14%.
• Most of the Higher Performing banks in this category have Efficiency Ratios between 50%-60%, while this figure rises to the 80% range for those banks at the bottom of this asset size category.
• Assets per Employee trends down noticeably from Higher Performing banks to lower performing ones in this asset category.
$1 to $3 Billion Banks• This group of banks boasts some of the highest ratios of net loans and leases to core deposits, with some ratios
of the top performers reaching above 120%.
• This group of banks also tends to have stronger earnings coverage of net charge-offs.
$3 to $10 Billion Banks• The high performance banks in this category measurably better leverage their human resources, with assets per
employee significantly above all other asset categories, and Non Interest Expense measurably lower than the other asset categories. However, this Non Interest Expense observation doesn’t hold true for the non-A player banks, where NIE is fairly comparable to the non-A player banks in the smaller bank categories.
• Banks in the $3-10 billion grouping have measurably higher Net Loans and Leases to Core Deposits over their counterparts in the other groupings.
9© 2014 Resurgent Performance Inc.

Identifying the Top Performing Banks on the RPI Performance Score
As you can see, achieving A-Level Performance on both financial performance and lending metrics is a difficult task for any financial institution. The banks you have come to “expect” to see as High Performers on the traditional measure are sometimes noticeably absent from the RPI Lending Performance Score, which demands a balanced performance on the lending side. The following tables identify the Top 10 banks within each asset size group.
10© 2014 Resurgent Performance Inc.
$300 Million to $1 Billion Banks$50 to $300 Million Banks
$1 to $3 Billion Banks $3 to $10 Billion Banks

Portfolio View: $50 million to $300 millionA key characteristic of the loan portfolio of the average A Player from $50 to $300 million is the higher percentage of Ag and Mortgage and the lower percentage of Commercial. Often we hear that True Local Community Banks (those under $300 million who specifically focus on a single market) bemoaning the fact that their commercial portfolios are not growing fast enough, when in fact the commercial portfolio of a bank this size is likely going
to make up just over half of the total. These smaller banks have an excellent opportunity to secure profitable farm and farmland loans, and while their commercial portfolios have the same relative balance among CRE, C&I, and C&D loans as their larger counterparts, the volume of the commercial side is lower.
The mortgage portfolio is more than three quarters first mortgages, while credit cards make up about only 1% of the consumer portfolio.
11© 2014 Resurgent Performance Inc.
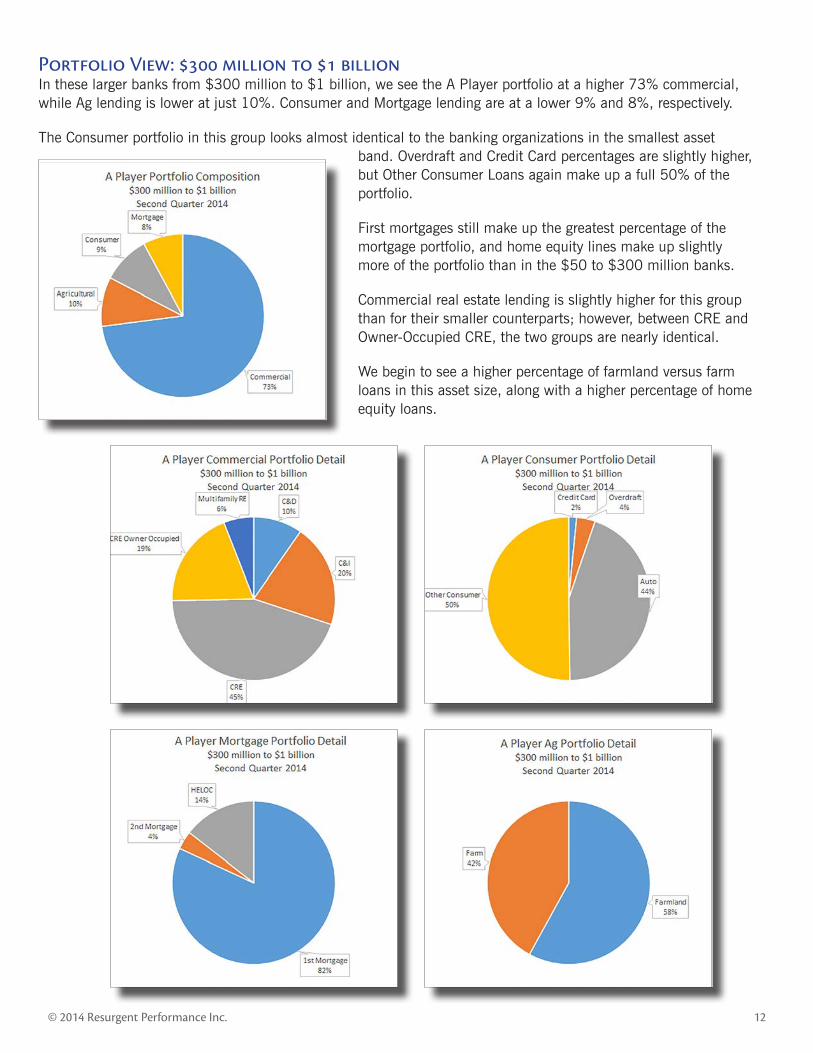
Portfolio View: $300 million to $1 billionIn these larger banks from $300 million to $1 billion, we see the A Player portfolio at a higher 73% commercial, while Ag lending is lower at just 10%. Consumer and Mortgage lending are at a lower 9% and 8%, respectively.
The Consumer portfolio in this group looks almost identical to the banking organizations in the smallest asset band. Overdraft and Credit Card percentages are slightly higher, but Other Consumer Loans again make up a full 50% of the portfolio.
First mortgages still make up the greatest percentage of the mortgage portfolio, and home equity lines make up slightly more of the portfolio than in the $50 to $300 million banks.
Commercial real estate lending is slightly higher for this group than for their smaller counterparts; however, between CRE and Owner-Occupied CRE, the two groups are nearly identical.
We begin to see a higher percentage of farmland versus farm loans in this asset size, along with a higher percentage of home equity loans.
12© 2014 Resurgent Performance Inc.

Portfolio View: $1 billion to $3 billionIn the A Player banks greater than $1 billion we start to see a full 80% of the loan portfolio dedicated to commercial loans. Interestingly, the detailed distribution within the commercial portfolio is still relatively similar to the smaller bank A Players with slightly more emphasis on Commercial & Industrial Loans.
“Other Consumer” lending decreases slightly with almost double the volume in Overdraft and related plans.
Second mortgages retain a steady 4% at all asset size groups under $3 billion, while HELOCs are slightly lower for this group than for the $300 million to $1 billion banks.
13© 2014 Resurgent Performance Inc.

Portfolio View: $3 billion to $10 billionWithin the $3 to $10 billion asset size band, commercial loans are the vast majority of the portfolio, and Ag lending has virtually disappeared. Within the commercial portfolio, multi-family real estate makes up nearly half the portfolio, while CRE is only about 41%.
Within the consumer portfolio, auto lending makes up nearly three quarters of the whole, and “Other Consumer” is a much smaller percentage than with the smaller banks. Of the Ag portfolio that is left, 85% is in farmland.
14© 2014 Resurgent Performance Inc.

Thoughts for Future Growth
Borrowers Are More Comfortable TodayWith a somewhat improving economy, borrowers are beginning to feel more comfortable taking out loans, and interest rates are expected to increase next year, maybe even by 50 basis points. Interestingly enough, the Southeast, once known for their excess bank failures, along with the Southwest and West Coast, are predicted to be the leaders of this growth. Changing demographics and higher interest rates position these banks to lead the pack in loan growth. We are currently seeing, to some extent, businesses beginning to make money and grow again. Because of this, they are anxious to secure the best rate and terms possible, hence the new demand.
Keep Up with P2P (And All!) Lending CompetitionPeer To Peer lending is a new trend in which borrowers seek loans from individual investors. Community Banks need to be hyperaware of this new competition, especially on the SBA lending front, as industry experts predict significant growth in the P2P SBA lending area in the next 24 months.
While this platform is still in the very early stages, it is still imperative to make sure you are actively tracking P2P interest rates so that you may remain competitive to your niche market. On the same front, it is vitally important to closely follow all of your competition and their lending trends.
Regaining ground – and not losing more – relative to consumer and small and micro business lending clearly must be a priority for commercial banks. To that end, we will see more innovation in all forms of lending facilitated by new technologies.
Lenders and Bankers: There Is No Silver Bullet—It is all about the basics High Performing Lending Banks are focused on:
• Managing credit risks deeper with greater skill sets on the front-end and post-closing.
• Being compliant—increase training on compliance and changing regulations, automate compliance management, and in general, make compliance a priority.
• Striving for better pricing and more fee income, which means you may need to find niche opportunities in lending products, markets, or industries that you serve.
• Streamlining credit processes for faster delivery with fewer resources.
• Avoiding excessive loan concentrations – diversify by type, location, term, and industry.
• Using all appropriate lending technologies possible that can provide greater service, risk management, and efficiency.
• Lending closer to home—know your borrowers and their businesses better than ever, as bankers and lenders are returning to becoming the Trusted Advisors to their customers.
• Cross selling creatively and constantly with all of the bank’s services and products is critical, as current bank activity levels, account openings, loan origination, and branch visits are all relatively low across commercial banks in the United States.
• Training more lending staff and support staff in credit, financial analysis, compliance, and relationship management, as well as in marketing and sales.
• Redefining your cultures and strategies to include accountability—tie it to strategies, plans and goals from the top down. This is a game changer.
15© 2014 Resurgent Performance Inc.

Improved Loan Growth—If You Have It—Doesn’t Mean It’s Time to RelaxFor the banks that are experiencing loan growth and improved portfolios, it’s a good time to take a breath, right? Wrong. More than ever it is important for banks to continue to find ways to improve their strategies and overall performance. Competition is fierce, and while the economy is improving, it certainly isn’t completely stable. At this point we simply can’t be sure of what the future holds, so continually seeking ways to lower expenses, while determining new ways to package your products to drive profitability, is critically important. High Performers never take a break from looking for ways they can improve. n
16© 2014 Resurgent Performance Inc.