high-fidelity nano-hole-enhanced raman spectroscopy
TRANSCRIPT
ARTICLES
High-Fidelity Nano-Hole-Enhanced Raman Spectroscopy
John T. Bahns,*,† Qiti Guo,‡ Jason M. Montgomery,§ Stephen K. Gray,§ Heinrich M. Jaeger,‡
and Liaohai Chen*,†
Biosciences DiVision, Argonne National Laboratory; 9700 South Cass AVenue, Argonne, Illinois 60439,The James Franck Institute, The UniVersity of Chicago; 929 East 57th Street; Chicago, Illinois 60637, andChemical Sciences and Engineering DiVision, Argonne National Laboratory; 9700 South Cass AVenue,Argonne, Illinois 60439
ReceiVed: January 26, 2009; ReVised Manuscript ReceiVed: May 9, 2009
Surface enhanced Raman spectroscopy (SERS) is a sensitive technique that can even detect single molecules.However, in many SERS applications, the strongly inhomogeneous distribution of intense local fields makesit very difficult for a quantitive assessment of the fidelity, or reproducibility of the signal, which limits theapplication of SERS. Herein, we report the development of exceptionally high-fidelity hole-enhanced Ramanspectroscopy (HERS) from ordered, 2D hexagonal nanohole arrays. We take the fidelity f to be a measure ofthe percent deviation of the Raman peaks from measurement to measurement. Overall, area averaged fidelitiesfor 12 gold array samples ranged from f ∼2-15% for HERS using aqueous R6G molecules. Furthermore,intensity modulations of the enhanced Raman spectra were measured for the first time as a function ofpolarization angle. The best of these measurements, which focus on static laser spots on the sample, could beconsistent with even higher fidelities than the area-averaged results. Nanohole arrays in silver providedsupporting polarization measurements and a more complete enhanced Raman fingerprint for phenylalaninemolecules. We also carried out finite-difference time-domain calculations to assist in the interpretation of theexperiments, identifying the polarization dependence as possibly arising from hole-hole interactions. Ourresults represent a step toward making quantitative and reproducible enhanced Raman measurements possibleand also open new avenues for a large-scale source of highly uniform hot spots.
Introduction
Although Raman spectroscopy is a powerful analytical tool,due to its nondestructive nature and structural fingerprintingcapability with very narrow and highly resolved bands (0.1 nm),the Raman effect is particularly weak. Typically, only 1 in 108
incident photons are inelastically scattered. Therefore, obtaininga reliable Raman spectrum from just a few molecules requirescollection times on the order of minutes, rather than seconds,and fairly high laser power. The Raman process can be enhancedby many orders of magnitude compared with the normal Ramanscattering process by using a substrate (a metal particle or arough metallic surface) for surface enhanced Raman spectros-copy (SERS).1-5 The SERS enhancement is thought to be theresult of a combination of metal-molecule chemical effects andintense, localized fields (hot spots) arising from surface plasmonresonances in and between metallic nanoparticles (junctions).6-12
Unfortunately, random and uncontrolled positioning of metallicnanoparticles precludes any direct control over the strength,polarization, and spatial distribution of these local fields andadversely affects the observed spectral fidelity, f, a figure ofmerit representing the percent deviation of the Raman signal
from measurement to measurement. Recent work with nanopillararrays,13 inverted pits,14 and nanostructured films15 have achievedf ) ∼15%, ∼10%, > 5.5% (respectively).
Nanohole structures also exhibit localized fields that can beexploited for Raman enhancements. Recently, we reportednonresonant hole-enhanced Raman spectroscopy (HERS) fromfilms containing randomly distributed nanoholes and the conceptof an enhanced Raman spectroscopic medium containing stable2D hot spots.16 Holes in thin metal films have demonstrated anumber of advantages over substrates based on metal colloids(particles). Holes tend to be more mechanically stable thanjunctions; therefore, they fluctuate less and have a high degreeof spatial uniformity. Random holes also have a single broadplasmon resonance, making them less sensitive to excitationwavelength.17 Furthermore, plasmon resonance maxima can betuned to the excitation wavelength by controlling the holediameter, the average center-to-center (c-c) interhole distance(hole surface density), and the refractive index of adjoiningdielectric surfaces.
It is well established that propagating surface plasmonpolaritons (SPPs) are launched from the edges of holes in metalfilms along the incident polarization angle.18,19 It is also the casethat near-field intensities in the proximity of these hole edgescan be enhanced relative to the incident intensity owing tostationary or local surface plasmon (LSP) excitations.17,19 Theseexcitations have been shown to be analogous to the correspond-ing excitations in metal nanoparticles.17 3D FDTD calculations
* To whom correspondence should be addressed. E-mail: [email protected] [email protected].
† Biosciences Division, Argonne National Laboratory.‡ The James Franck Institute, The University of Chicago.§ Chemical Sciences and Engineering Division, Argonne National
Laboratory.
J. Phys. Chem. C 2009, 113, 11190–1119711190
10.1021/jp900764a CCC: $40.75 2009 American Chemical SocietyPublished on Web 06/09/2009
(discussed below) for periodicities associated with 100 nmdiameter holes in hexagonal hole arrays (200-346 nm c-cspacings) with an incident wavelength of 633 nm show thatLSP excitations are expected to be the dominant source for theenhanced Raman spectra.
In this article, we report the extension of HERS to an orderednanohole array substrate, aimed at dramatically improving andbench-marking the fidelity for enhanced Raman spectroscopy,thus enabling quantitative substrate enhanced Raman charac-terization of molecules. The new results include: 1) fabricationof a novel HERS substrate composed of ordered, 2D arrays ofholes in gold or silver film using electron-beam lithography, 2)determination of excellent area-averaged spectral fidelities(f ) ∼2-15%) for HERS of aqueous R6G molecules, 3)quantification of R6G Raman intensity modulations as a functionof laser polarization, 4) improved spectral fingerprint forphenylalanine molecules, and 5) 3D finite-difference time-domain (FDTD) calculations to assist in the interpretation ofour experimental results.
Experimental Methods
The nanohole arrays were fabricated by combining electron-beam lithography (EBL) with subsequent metal evaporation. Assubstrates, we used regular glass 1/4 circle coverslips with athickness of ∼150 µm. The fabrication procedure started withsubstrate cleaning (organic solvents followed by short intervalsof reactive ion etching with CF4 and O2). A layer of ∼200 nmthick PMMA (950K, 3 wt % PMMA in Anisole) was then spin-coated onto the etched side of the substrate and baked for 1 hat 150-175 °C. To reduce charging effects during the subse-quent EBL, a thin layer (4 to 6 nm thickness) of Cr was thenevaporated on top of the PMMA. A Hitachi S-2700 scanningelectron microscope (SEM) equipped with a Nabity patterngenerator was used to write the array pattern into the PMMA.After removal of the Cr layer with etchant solution, the patternwas developed in MIBK solution (MIBK/IPA ) 1: 3) for 30 sand blown dry with grade 5 nitrogen.
To metalize the array pattern, we used oblique-angle evapora-tion. The sample was mounted on a rotating stage tilted 45°toward the metal source. To improve the sticking to the PMMA,we evaporated 4-6 nm thick Cr first, followed by 20-30 nmAu. The gold thickness varied with the diameter of the holes inthe array. In general, we evaporated thicker Au films for biggerholes (Table 1). Lift-off of the metal covering areas not exposedby the electron beam was achieved by soaking the sample inacetone. A similar procedure was used for silver metalization.
Nanohole array patterns on coverslips were prepared forrecording liquid-phase HERS spectra (aqueous R6G or pheny-lalanine molecules) by inverted placement onto clean 24 × 40mm #1 coverslips to form a fixed gap width between glasssurfaces sandwiching the hole array pattern. To mount each hole
array sample, the gap spacing was fixed by applying a fewmicroliters of a fast-drying, water immiscible, adhesive (Ducocement) to each of the three corners of the 1/4 circle and allowto air-dry completely. Small liquid samples (<1 µL) were thencarefully introduced by micropipet to the fixed gap by capillaryaction. With the aqueous liquid samples saturating the hole arraypattern within the fixed gap, two of the three sides of the 1/4
circle were sealed with adhesive and a larger volume of liquidsample (∼10 µL) was placed in contact with the gap of thethird side to serve as a liquid reservoir and to prevent the sampledry-out during spectral measurements.
The mounted liquid samples were placed on a previouslydescribed inverted microscope (Olympus IX-71) equipped witha 60 × /1.2 water immersion objective and computer controlledX-Y stage and then coupled to a spectrograph (Jobin Yvon Triax320) equipped with a liquid nitrogen cooled CCD detector.16
In general, area-averaged HERS spectra were taken in epi-illumination configuration by scanning a focused laser beam(633 nm @ 1 mW, I ) ∼105 W/cm2). We used fluorescencecorrelation analysis of standard dye solutions to confirm thatthe spot size or beam diameter was a diffraction-limited ∼0.64µm.
Each hole array sample we studied, corresponding to a givennanohole diameter, typically consisted of 4 individual (40 µm× 34.6 µm) hexagonal nanohole arrays on a 1/4 circle coverslip.Within each array, we chose four random 100 µm2 areas andmeasured an area-averaged HERS spectra for each, giving riseto up to 16 HERS spectra per sample. The scanned areas weresampled by a square serpentine raster while collecting spectraat constant exposure time of 10 s (all other relevant instrumentalparameters held constant; e.g. laser power, intensity, slit width,etc.). All HERS spectra were based on intensity measurementsevaluated at the strong xanthene ring stretching feature (1361cm-1) for R6G (or at the symmetric ring breathing mode (1000cm-1) for phenylalanine, as seen in Table 2).
A fidelity for each of the four arrays within a given sampleis determined for the area-averaged HERS measurements notedabove as follows. We do not use the actual peak heights butthe difference between the peak maximum and the averageintensity at the line wings, or baseline, of the transition. Supposewe have a set of different measurements of this adjusted peakheight, {Ij}, j ) 1,...,N. One measure of fidelity is to find thetwo measured values of the set, Ib and Ia, that give the largestmagnitude difference, |Ib-Ia|, and to normalize this maximumdeviation by the mean value, (Ib+Ia)/2, representing this relativemaximum deviation as a percentage:
TABLE 1: Area-Averaged HERS Results for 12 Separate Nanohole Samples in Gold Films Based on Intensity Measurementsat the 1361 cm-1 Line of R6Ga
d (nm) counts/s (f) averages, [EF]
80 49 (3.6%) 144 (2.1%) 97 (2.9%), [∼5 × 10⁴]100 280 (1.7%) 160 (5.6%) 56 (13%) 97 (8.7%) 148 (7.3%), [∼105]120 124 (13%) 120 (14%) 156 (15%) 75 (6.7%) 119 (12%), [∼7 × 10⁴]140 206 (5.9%) 150 (9%) 178 (7.5%), [∼105]
Overall Averages: 135 (8.2%) [∼8 × 10⁴]
a Column 1: diameter, d, of holes in a given sample. Columns 2-5: counts/s and calculated fidelity (f) (eq 1) for each array in the sample.Column 6: average count/s, average f, and estimated enhancement factor [EF] (eq 2.). Bottom row: overall averages. Counts can be correctedfor total system through-put by dividing by 0.013.16 For each sample, the smaller c-c distance is twice the hole diameter. Typical chromiumand gold film thicknesses were: (4.5, 20), (5.0, 25), (5.0, 30), and (5.0, 35), respectively.
f )2|Ib - Ia|
(Ib + Ia)× 100% (1)
Nano-Hole-Enhanced Raman Spectroscopy J. Phys. Chem. C, Vol. 113, No. 26, 2009 11191
(The highest fidelity is of course given by the smallestpercentage value, f.) This definition of fidelity parallels that usedin Raman difference spectroscopy.20 Now, within each of the 4nanohole arrays of a sample, we have available four area-averaged HERS spectra. This corresponds to 6 unique differencespectra I1-I2,..., I3-I4, for each array upon which to determinethe particular Ia and Ib that lead to the maximum adjusted peakdifference and the fidelity, as shown in eq 1. (Each samplefidelity we report in Table 1 corresponds to the average of thefour array fidelities for the sample.)
Results and Discussion
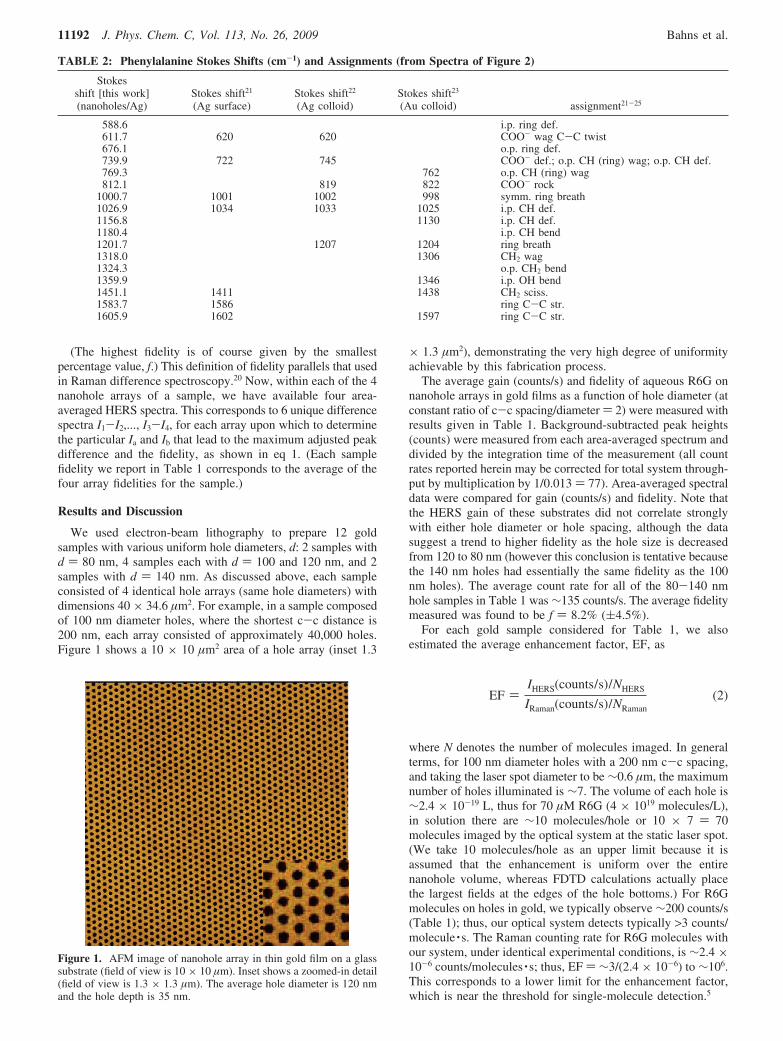
We used electron-beam lithography to prepare 12 goldsamples with various uniform hole diameters, d: 2 samples withd ) 80 nm, 4 samples each with d ) 100 and 120 nm, and 2samples with d ) 140 nm. As discussed above, each sampleconsisted of 4 identical hole arrays (same hole diameters) withdimensions 40 × 34.6 µm2. For example, in a sample composedof 100 nm diameter holes, where the shortest c-c distance is200 nm, each array consisted of approximately 40,000 holes.Figure 1 shows a 10 × 10 µm2 area of a hole array (inset 1.3
× 1.3 µm2), demonstrating the very high degree of uniformityachievable by this fabrication process.
The average gain (counts/s) and fidelity of aqueous R6G onnanohole arrays in gold films as a function of hole diameter (atconstant ratio of c-c spacing/diameter ) 2) were measured withresults given in Table 1. Background-subtracted peak heights(counts) were measured from each area-averaged spectrum anddivided by the integration time of the measurement (all countrates reported herein may be corrected for total system through-put by multiplication by 1/0.013 ) 77). Area-averaged spectraldata were compared for gain (counts/s) and fidelity. Note thatthe HERS gain of these substrates did not correlate stronglywith either hole diameter or hole spacing, although the datasuggest a trend to higher fidelity as the hole size is decreasedfrom 120 to 80 nm (however this conclusion is tentative becausethe 140 nm holes had essentially the same fidelity as the 100nm holes). The average count rate for all of the 80-140 nmhole samples in Table 1 was ∼135 counts/s. The average fidelitymeasured was found to be f ) 8.2% ((4.5%).
For each gold sample considered for Table 1, we alsoestimated the average enhancement factor, EF, as
where N denotes the number of molecules imaged. In generalterms, for 100 nm diameter holes with a 200 nm c-c spacing,and taking the laser spot diameter to be ∼0.6 µm, the maximumnumber of holes illuminated is ∼7. The volume of each hole is∼2.4 × 10⁻¹⁹ L, thus for 70 µM R6G (4 × 10¹⁹ molecules/L),in solution there are ∼10 molecules/hole or 10 × 7 ) 70molecules imaged by the optical system at the static laser spot.(We take 10 molecules/hole as an upper limit because it isassumed that the enhancement is uniform over the entirenanohole volume, whereas FDTD calculations actually placethe largest fields at the edges of the hole bottoms.) For R6Gmolecules on holes in gold, we typically observe ∼200 counts/s(Table 1); thus, our optical system detects typically >3 counts/molecule · s. The Raman counting rate for R6G molecules withour system, under identical experimental conditions, is ∼2.4 ×10⁻⁶ counts/molecules · s; thus, EF ) ∼3/(2.4 × 10-6) to ∼106.This corresponds to a lower limit for the enhancement factor,which is near the threshold for single-molecule detection.5
TABLE 2: Phenylalanine Stokes Shifts (cm-1) and Assignments (from Spectra of Figure 2)
Stokesshift [this work](nanoholes/Ag)
Stokes shift21
(Ag surface)Stokes shift22
(Ag colloid)Stokes shift23
(Au colloid) assignment21-25
588.6 i.p. ring def.611.7 620 620 COO- wag C-C twist676.1 o.p. ring def.739.9 722 745 COO- def.; o.p. CH (ring) wag; o.p. CH def.769.3 762 o.p. CH (ring) wag812.1 819 822 COO- rock
1000.7 1001 1002 998 symm. ring breath1026.9 1034 1033 1025 i.p. CH def.1156.8 1130 i.p. CH def.1180.4 i.p. CH bend1201.7 1207 1204 ring breath1318.0 1306 CH2 wag1324.3 o.p. CH2 bend1359.9 1346 i.p. OH bend1451.1 1411 1438 CH2 sciss.1583.7 1586 ring C-C str.1605.9 1602 1597 ring C-C str.
Figure 1. AFM image of nanohole array in thin gold film on a glasssubstrate (field of view is 10 × 10 µm). Inset shows a zoomed-in detail(field of view is 1.3 × 1.3 µm). The average hole diameter is 120 nmand the hole depth is 35 nm.
EF )IHERS(counts/s)/NHERS
IRaman(counts/s)/NRaman(2)
11192 J. Phys. Chem. C, Vol. 113, No. 26, 2009 Bahns et al.
We also determined enhancement factors for the silversamples corresponding to uniform arrays with hole diametersof 60 and 80 nm: EF ) ∼3 × 10⁶ for 60 nm holes (c-c ) 100nm) and ∼3 × 10⁵ for 80 nm holes (c-c ) 160 nm). The latterresult is a factor of ∼6 greater than for the 80 nm (c-c ) 160nm) gold substrates (Table 1), where the overall estimatedenhancement factor measured for all gold samples was foundto be EF ) ∼8 × 10⁴.
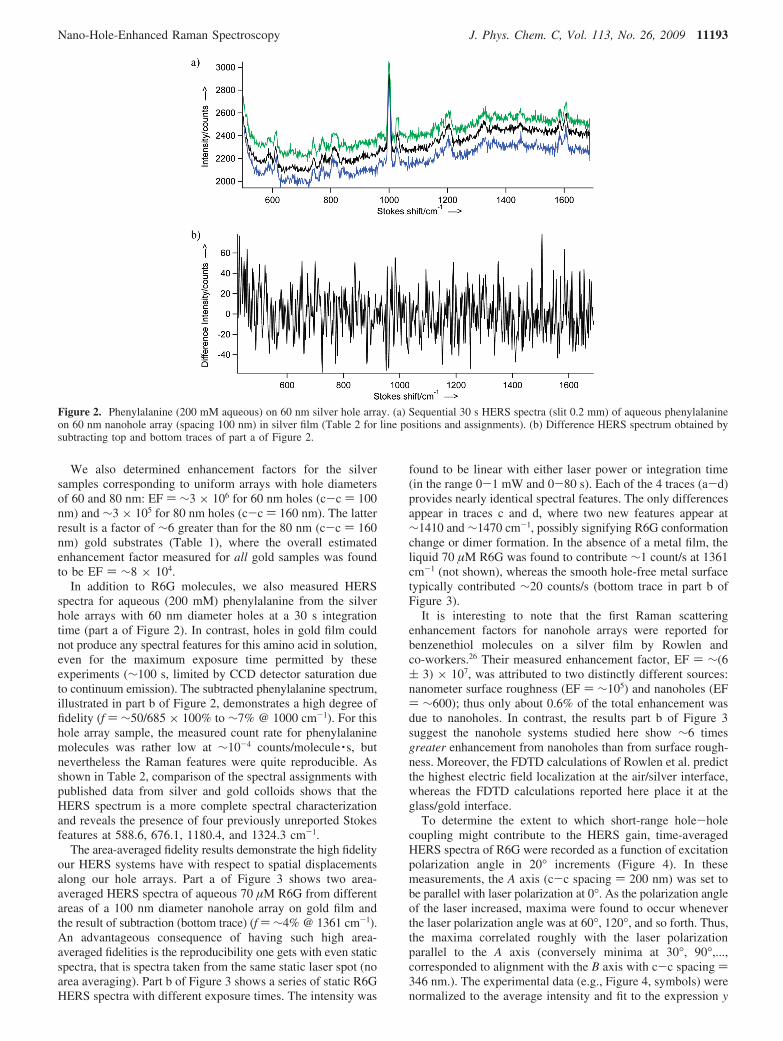
In addition to R6G molecules, we also measured HERSspectra for aqueous (200 mM) phenylalanine from the silverhole arrays with 60 nm diameter holes at a 30 s integrationtime (part a of Figure 2). In contrast, holes in gold film couldnot produce any spectral features for this amino acid in solution,even for the maximum exposure time permitted by theseexperiments (∼100 s, limited by CCD detector saturation dueto continuum emission). The subtracted phenylalanine spectrum,illustrated in part b of Figure 2, demonstrates a high degree offidelity (f ) ∼50/685 × 100% to ∼7% @ 1000 cm-1). For thishole array sample, the measured count rate for phenylalaninemolecules was rather low at ∼10-4 counts/molecule · s, butnevertheless the Raman features were quite reproducible. Asshown in Table 2, comparison of the spectral assignments withpublished data from silver and gold colloids shows that theHERS spectrum is a more complete spectral characterizationand reveals the presence of four previously unreported Stokesfeatures at 588.6, 676.1, 1180.4, and 1324.3 cm-1.
The area-averaged fidelity results demonstrate the high fidelityour HERS systems have with respect to spatial displacementsalong our hole arrays. Part a of Figure 3 shows two area-averaged HERS spectra of aqueous 70 µM R6G from differentareas of a 100 nm diameter nanohole array on gold film andthe result of subtraction (bottom trace) (f ) ∼4% @ 1361 cm-1).An advantageous consequence of having such high area-averaged fidelities is the reproducibility one gets with even staticspectra, that is spectra taken from the same static laser spot (noarea averaging). Part b of Figure 3 shows a series of static R6GHERS spectra with different exposure times. The intensity was
found to be linear with either laser power or integration time(in the range 0-1 mW and 0-80 s). Each of the 4 traces (a-d)provides nearly identical spectral features. The only differencesappear in traces c and d, where two new features appear at∼1410 and ∼1470 cm-1, possibly signifying R6G conformationchange or dimer formation. In the absence of a metal film, theliquid 70 µM R6G was found to contribute ∼1 count/s at 1361cm-1 (not shown), whereas the smooth hole-free metal surfacetypically contributed ∼20 counts/s (bottom trace in part b ofFigure 3).
It is interesting to note that the first Raman scatteringenhancement factors for nanohole arrays were reported forbenzenethiol molecules on a silver film by Rowlen andco-workers.26 Their measured enhancement factor, EF ) ∼(6( 3) × 107, was attributed to two distinctly different sources:nanometer surface roughness (EF ) ∼105) and nanoholes (EF) ∼600); thus only about 0.6% of the total enhancement wasdue to nanoholes. In contrast, the results part b of Figure 3suggest the nanohole systems studied here show ∼6 timesgreater enhancement from nanoholes than from surface rough-ness. Moreover, the FDTD calculations of Rowlen et al. predictthe highest electric field localization at the air/silver interface,whereas the FDTD calculations reported here place it at theglass/gold interface.
To determine the extent to which short-range hole-holecoupling might contribute to the HERS gain, time-averagedHERS spectra of R6G were recorded as a function of excitationpolarization angle in 20° increments (Figure 4). In thesemeasurements, the A axis (c-c spacing ) 200 nm) was set tobe parallel with laser polarization at 0°. As the polarization angleof the laser increased, maxima were found to occur wheneverthe laser polarization angle was at 60°, 120°, and so forth. Thus,the maxima correlated roughly with the laser polarizationparallel to the A axis (conversely minima at 30°, 90°,...,corresponded to alignment with the B axis with c-c spacing )346 nm.). The experimental data (e.g., Figure 4, symbols) werenormalized to the average intensity and fit to the expression y
Figure 2. Phenylalanine (200 mM aqueous) on 60 nm silver hole array. (a) Sequential 30 s HERS spectra (slit 0.2 mm) of aqueous phenylalanineon 60 nm nanohole array (spacing 100 nm) in silver film (Table 2 for line positions and assignments). (b) Difference HERS spectrum obtained bysubtracting top and bottom traces of part a of Figure 2.
Nano-Hole-Enhanced Raman Spectroscopy J. Phys. Chem. C, Vol. 113, No. 26, 2009 11193
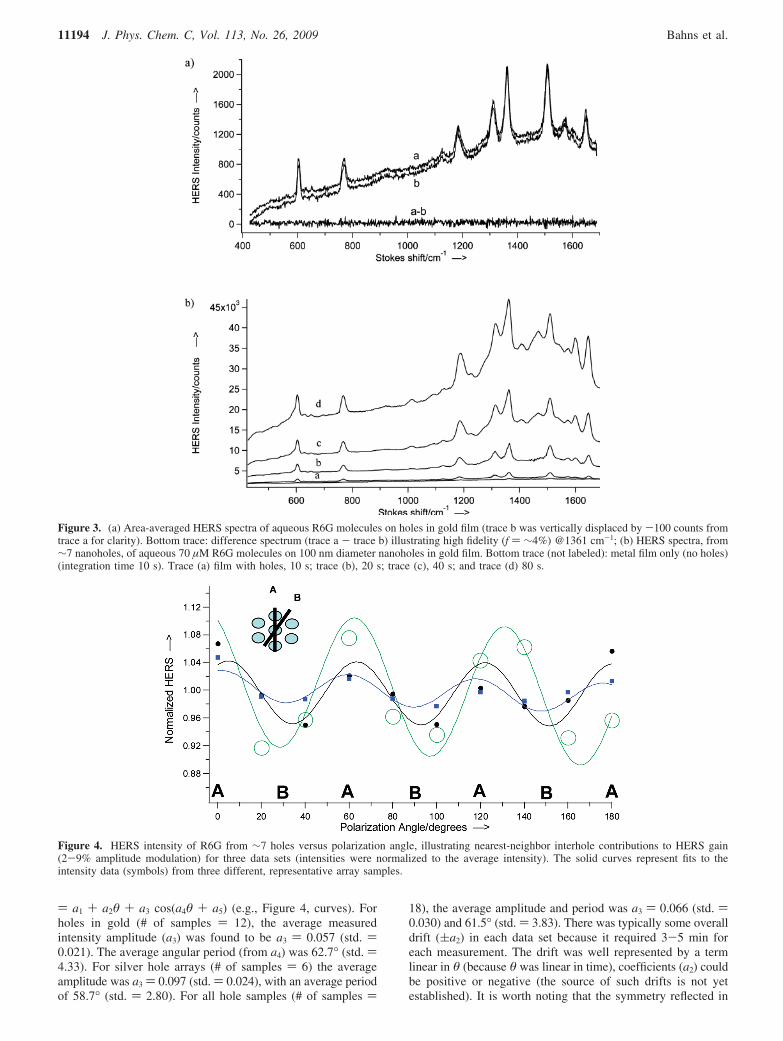
) a1 + a2θ + a3 cos(a4θ + a5) (e.g., Figure 4, curves). Forholes in gold (# of samples ) 12), the average measuredintensity amplitude (a3) was found to be a3 ) 0.057 (std. )0.021). The average angular period (from a4) was 62.7° (std. )4.33). For silver hole arrays (# of samples ) 6) the averageamplitude was a3 ) 0.097 (std. ) 0.024), with an average periodof 58.7° (std. ) 2.80). For all hole samples (# of samples )
18), the average amplitude and period was a3 ) 0.066 (std. )0.030) and 61.5° (std. ) 3.83). There was typically some overalldrift ((a2) in each data set because it required 3-5 min foreach measurement. The drift was well represented by a termlinear in θ (because θ was linear in time), coefficients (a2) couldbe positive or negative (the source of such drifts is not yetestablished). It is worth noting that the symmetry reflected in
Figure 3. (a) Area-averaged HERS spectra of aqueous R6G molecules on holes in gold film (trace b was vertically displaced by -100 counts fromtrace a for clarity). Bottom trace: difference spectrum (trace a - trace b) illustrating high fidelity (f ) ∼4%) @1361 cm-1; (b) HERS spectra, from∼7 nanoholes, of aqueous 70 µM R6G molecules on 100 nm diameter nanoholes in gold film. Bottom trace (not labeled): metal film only (no holes)(integration time 10 s). Trace (a) film with holes, 10 s; trace (b), 20 s; trace (c), 40 s; and trace (d) 80 s.
Figure 4. HERS intensity of R6G from ∼7 holes versus polarization angle, illustrating nearest-neighbor interhole contributions to HERS gain(2-9% amplitude modulation) for three data sets (intensities were normalized to the average intensity). The solid curves represent fits to theintensity data (symbols) from three different, representative array samples.
11194 J. Phys. Chem. C, Vol. 113, No. 26, 2009 Bahns et al.
these polarization experiments may be due primarily to hole-holeinteractions because the measured intensity modulations reflectthe hexagonal symmetry of the arrays. See also the FDTDcalculations below which further confirm this picture.
It is also worth noting that the data in Figure 4 would not beobservable from a low-fidelity substrate. In particular, the lowestintensity amplitude variations observed, 2-4% (Figure 4, blue),suggest that under some circumstances static HERS spectra withfidelities better than 2% can be achieved. In related polarizationexperiments, Odom and co-workers performed polarization-dependent enhanced optical transmission (EOT) measurementsfor microscale square arrays of nanoholes in gold film.27 Themeasured EOT for circular holes at normal incidence and forpolarization alignment with different lattice axes showed nonoticeable difference. In other related work, Le Ru andco-workers28 measured polarization-resolved relative enhance-ments for R6G molecules on square arrays of oblate sphericalas well as prolate elliptically shaped gold nanoparticles withthe polarization in alignment with one or both of the twoprincipal array axes (resolved both in excitation as well asdetection). However, the measurements represent Raman en-hancements due to particle shapes rather than interparticle (thecomplement to hole-hole) interactions.
To better understand our experimental results, we carried out3D finite-difference time-domain (FDTD) calculations.19,29,30 Thetechnical details of the calculations were similar to those of priorwork.19,30 The calculations employed periodic boundary condi-tions consistent with a hexagonal array of holes in a gold filmwith glass (refractive index n ) 1.5) below and with water(n ) 1.33) above. The incident light was normal from withinthe water, and we calculated the electromagnetic near-fieldenhancements consistent with an incident wavelength of λ0 )633 nm. Similar to the experimental setup, we used a gold filmthickness of 26 nm, 100 nm diameter circular holes, and ahexagonal lattice constant of a0 ) 200 nm, which correspondsto nearest-neighbor c-c separation of the holes along rows thatare parallel to the A axis of the hexagonal array. The c-cseparation of holes in rows parallel to the B axis is �3j a0. Wecarried out separate calculations with the incident light polarizedalong the A axis and along the B axis. To obtain reliable near-field amplitudes, we used 0.5 nm grid spacings.
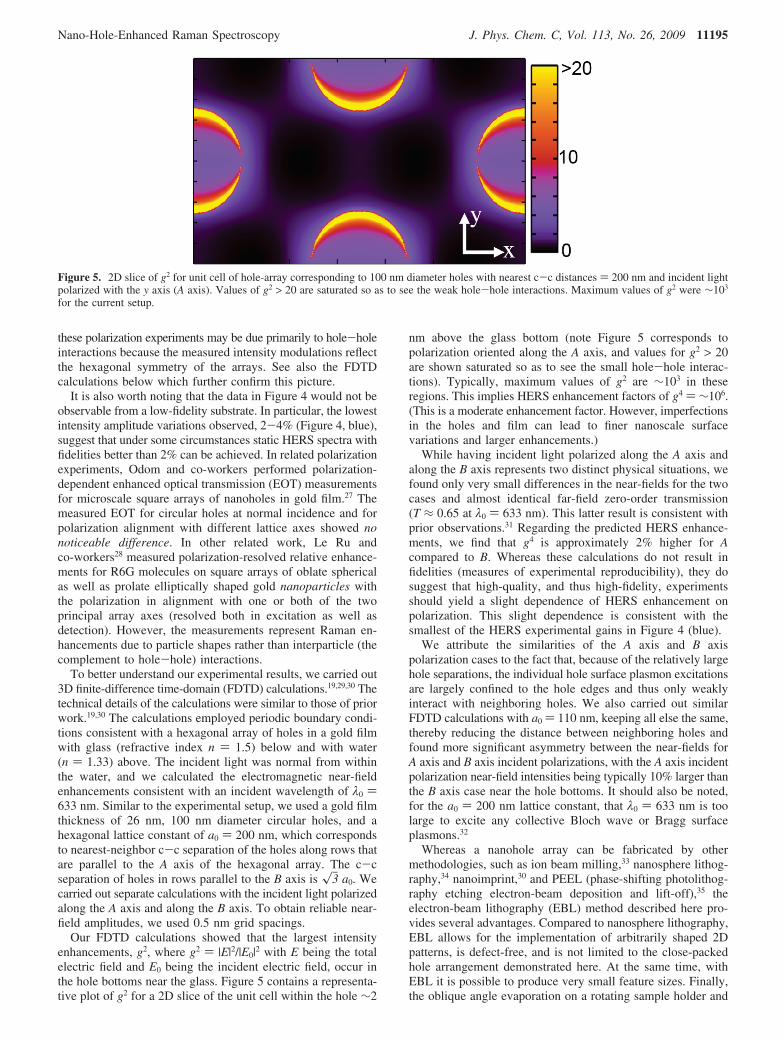
Our FDTD calculations showed that the largest intensityenhancements, g2, where g2 ) |E|2/|E0|2 with E being the totalelectric field and E0 being the incident electric field, occur inthe hole bottoms near the glass. Figure 5 contains a representa-tive plot of g2 for a 2D slice of the unit cell within the hole ∼2
nm above the glass bottom (note Figure 5 corresponds topolarization oriented along the A axis, and values for g2 > 20are shown saturated so as to see the small hole-hole interac-tions). Typically, maximum values of g2 are ∼103 in theseregions. This implies HERS enhancement factors of g4 ) ∼106.(This is a moderate enhancement factor. However, imperfectionsin the holes and film can lead to finer nanoscale surfacevariations and larger enhancements.)
While having incident light polarized along the A axis andalong the B axis represents two distinct physical situations, wefound only very small differences in the near-fields for the twocases and almost identical far-field zero-order transmission(T ≈ 0.65 at λ0 ) 633 nm). This latter result is consistent withprior observations.31 Regarding the predicted HERS enhance-ments, we find that g4 is approximately 2% higher for Acompared to B. Whereas these calculations do not result infidelities (measures of experimental reproducibility), they dosuggest that high-quality, and thus high-fidelity, experimentsshould yield a slight dependence of HERS enhancement onpolarization. This slight dependence is consistent with thesmallest of the HERS experimental gains in Figure 4 (blue).
We attribute the similarities of the A axis and B axispolarization cases to the fact that, because of the relatively largehole separations, the individual hole surface plasmon excitationsare largely confined to the hole edges and thus only weaklyinteract with neighboring holes. We also carried out similarFDTD calculations with a0 ) 110 nm, keeping all else the same,thereby reducing the distance between neighboring holes andfound more significant asymmetry between the near-fields forA axis and B axis incident polarizations, with the A axis incidentpolarization near-field intensities being typically 10% larger thanthe B axis case near the hole bottoms. It should also be noted,for the a0 ) 200 nm lattice constant, that λ0 ) 633 nm is toolarge to excite any collective Bloch wave or Bragg surfaceplasmons.32
Whereas a nanohole array can be fabricated by othermethodologies, such as ion beam milling,33 nanosphere lithog-raphy,34 nanoimprint,30 and PEEL (phase-shifting photolithog-raphy etching electron-beam deposition and lift-off),35 theelectron-beam lithography (EBL) method described here pro-vides several advantages. Compared to nanosphere lithography,EBL allows for the implementation of arbitrarily shaped 2Dpatterns, is defect-free, and is not limited to the close-packedhole arrangement demonstrated here. At the same time, withEBL it is possible to produce very small feature sizes. Finally,the oblique angle evaporation on a rotating sample holder and
Figure 5. 2D slice of g2 for unit cell of hole-array corresponding to 100 nm diameter holes with nearest c-c distances ) 200 nm and incident lightpolarized with the y axis (A axis). Values of g2 > 20 are saturated so as to see the weak hole-hole interactions. Maximum values of g2 were ∼103
for the current setup.
Nano-Hole-Enhanced Raman Spectroscopy J. Phys. Chem. C, Vol. 113, No. 26, 2009 11195
the small film thickness lead to highly uniform metal coverage.As the inset to Figure 1 shows, the metal films consist of denselypacked grains, with typical sizes ∼40 nm. Whereas the newfabrication method reported herein uses PMMA, all detectabletraces of this compound are removed. This provides a substratewith continuum emission, originating from the metallic struc-tures and enhanced fluorescence, that is highly reproducible andtherefore reliably subtracted (part b of Figure 2 and part a ofFigure 3), as a requisite for enabling enhanced Raman differencespectroscopy. Although nanoholes in gold films have less gainthan for silver, they were better suited for this study for tworeasons. Gold films were found to be more resistant to opticalor chemical damage, and they have a longer shelf life. (Holearrays in silver were easily damaged by optical intensities of∼105 W/cm2). No optical damage threshold for holes in goldcould be observed with our laser but it is at least three timeshigher than for silver. Optical damage appeared as thin, 1-2µm etched tracks in the silver hole arrays. Holes in silver werealso observed to degrade on contact with aqueous samples,particularly when the liquid had a high ionic strength; suchevidence of optical or chemical attack was not observed withany of the gold substrates. Thirty day storage of gold arrays indesiccators at room temperature typically had ∼30% lower gainthan fresh arrays; silver displayed significantly larger losses thatwere difficult to quantify.
Although Raman scattering has been enhanced to the degreethat single-molecule SERS is achievable, without adequatefidelity, full spectrum characterization (up to single molecule)and quantification by Raman spectroscopy remains challenging.Initial investigations of nanohole arrays as Raman substratessuccessfully detected small numbers of Oxa-720 dye mol-ecules.36 Since then, there have been significant improvementsin the gain of these substrates, for example through carefuloptimization of hole spacings and shapes.37
Detailed comparisons by Parsons et al.38 of arrays ofcylindrical holes with comparable disk-shaped particles indicatethat approximately 2-fold larger LSP fields for particle arraysare possible. However, increased enhancement from hole arraysis possible through modification of the hole shape. For example,Koerkamp et al.39 observed 10-fold transmission enhancementswhen hole shapes are changed from circular to rectangular andLesuffleur et al.37 observed a 12-fold increase in Raman fromoxazine 720 molecules on double-hole aperture arrays versusarrays of single holes.
However, further improvements in fidelity are highly desir-able. Our ordered nanohole array substrate aims at dramaticallyimproving fidelity as well as enhancement factors whileproviding complete spectral characterization. The nominalfidelity obtained for well established Raman difference spec-troscopy is f ) ∼0.1%.20,40 Thus, because the fidelity of thesenanohole substrates lies within a factor of 10 of well establishedRaman difference spectroscopy methodology, the realization ofsubtractive HERS appears within reach. The factors limitingfidelity for these substrates are not known; however, closeinspection of hole array AFM images do show small irregulari-ties, which include noncircular hole shapes,37,39 crystalline orgranular structures at the hole perimeters, and small heightvariations in film topography. Plausibly, the fidelity of thesesubstrates can be further improved with optimization of holeshapes and spacings (and substrate composition) and furtherreductions in surface irregularities. In the near future, weanticipate new analytic applications for these substrates, inparticular subtractive HERS, with further improvements inenhancement.
Conclusions
In conclusion, a new technique for preparing highly uniform2D nanohole arrays in gold and silver by EBL and oblique metalevaporation was established. Area-averaged HERS measure-ments for the gold hole array substrates indicate sufficient gainto detect small numbers of R6G molecules at area-averagedfidelities of ∼2-15%. Spectra of aqueous phenylalanine fromnanoholes in silver film provided a more complete enhancedRaman spectrum, including four previously unreported Ramanfeatures. Static HERS spectra exhibited interesting intensitymodulations consistent with hole-hole interactions and possiblyeven better fidelities.
Nanohole array substrates and hole-enhanced Raman spec-troscopy not only make quantitive and reproducible enhancedRaman measurements possible but also open new avenues forcharacterizing molecular orientation and hierarchical structuresas the method is sensitive to the orientation of the sample onthe substrate. Extending the nanohole arrays to the scale ofinches is currently under experimental investigation.
Acknowledgment. This work was supported by NIH grantR01 NS047719. We are very grateful to Jeffrey M. McMahonfor helpful discussions and providing us with his parallel FDTDprogram. This research used resources of the National EnergyResearch Scientific Computing Center, which is supported bythe Office of Science of the U.S. Department of Energy underContract No. DE-AC02-05CH11231. The work at ArgonneNational Laboratory was supported by the U.S. Department ofEnergy, Office of Basic Energy Sciences, under contract DE-AC02-06CH11357.
References and Notes
(1) Nie, S.; Emory, S. R. Science 1997, 275, 1102–1106.(2) Kneipp, K.; Wang, Y.; Kneipp, H.; Perelman, L. T.; Itzkan, I.;
Dasari, R. R.; Feld, M. S. Phys. ReV. Lett. 1997, 78, 1667–1670.(3) Wei, Y.; Cao, C.; Jin, R.; Mirkin, C. A. Science 2002, 297, 1536–
1540.(4) Stuart, D. A.; Haes, A. J.; Yonzon, C. R.; Hicks, E. M.; Van Duyne,
R. P. IEEE Proc.-Nanobiotechnol. 2005, 152, 13–32.(5) Le Ru, E. C.; Blackie, E.; Meyer, M.; Etchegoin, P. G. J. Phys.
Chem. C 2007, 111, 13794–13803.(6) Moskovits, M. J. Raman Spectrosc. 2005, 36, 485–496.(7) Xu, H.; Aizpurua, J.; Kall, M.; Apell, P. Phys. ReV. E 2000, 62,
4318–4324.(8) Svedberg, F.; Li, Z.; Xu, H.; Kall, M. Nano Lett. 2006, 6, 2639–
2641.(9) Zhu, Z.; Zhu, T.; Liu, Z. Nanotechnol. 2004, 15, 357–364.
(10) Nordlander, P.; Oubre, C.; Prodan, E.; Li, K.; Stockman, M. I. NanoLett. 2004, 4, 899–903.
(11) Jiang, J.; Bosnick, K.; Maillard, M.; Brus, L. J. Phys. Chem. B2003, 107, 9964–9972.
(12) Futamata, M.; Maruyama, Y.; Ishikawa, M. J. Mol. Struct. 2005,735-736, 75–84.
(13) Ruan, C.; Eres, G.; Wang, W.; Zhang, Z.; Gu, B. Langmuir 2007,23, 5757–5760.
(14) Perney, N. M. B.; Baumberg, J. J.; Zoorob, M. E.; Charlton,M. D. B.; Mahnkopf, S.; Netti, C. M. Opt. Expr. 2006, 14, 847–857.
(15) Park, H. K.; Yoon, J. K.; Kim, K. Langmuir 2006, 22, 1626–1629.(16) Bahns, J. T.; Yan, F.; Qiu, D.; Wang, R.; Chen, L. Appl. Spectrosc.
2006, 60, 989–993.(17) Prikulis, J.; Hanarp, P.; Olofsson, L.; Sutherland, D.; Kall, M. Nano
Lett. 2004, 4, 1003–1007.(18) Yin, L.; Vlasko-Vlasov, V. K.; Rydh, A.; Pearson, J.; Welp, U.;
Chang, S.-H.; Gray, S. K.; Schatz, G. C.; Brown, D. B.; Kimball, C. W.Appl. Phys. Lett. 2004, 85, 467–469.
(19) Chang, S.-H.; Gray, S. K.; Schatz, G. C. Opt. Expr. 2005, 13, 3150–3165.
(20) Callender, R.; Deng, H.; Gilmanshin, R. J. Raman Spectrosc. 1998,29, 15–21.
(21) Stewart, S.; Fredericks, P. M. Spectrochim. Acta, Part A 1999, 55,1641–1660.
(22) Podstawka, E.; Ozaki, Y.; Proniewicz, L. M. Appl. Spectrosc. 2004,58, 570–580.
11196 J. Phys. Chem. C, Vol. 113, No. 26, 2009 Bahns et al.
(23) Podstawka, E.; Ozaki, Y.; Proniewicz, L. M. Appl. Spectrosc. 2005,59, 1516–1526.
(24) Ravikumar, B.; Rajaram, R. K.; Ramakrishnan, V. J. RamanSpectrosc. 2006, 37, 597–605.
(25) Olsztynska, S.; Komorowska, M.; Vrielynck, L.; Dupuy, N. Appl.Spectrosc. 2001, 55, 901–907.
(26) Reilly, T. H.; Chang, S.-H.; Corbman, J. D.; Schatz, G. C.; Rowlen,K. L. J. Phys. Chem. C 2007, 111, 1689–1694.
(27) Lee, M. H.; Gao, H.; Henzie, J.; Odom, T. W. Small 2007, 3, 2029–2033.
(28) Le Ru, E. C.; Grand, J.; Felidj, N.; Aubard, J.; Levi, G.; Hohenau,A.; Krenn, J. R.; Blackie, E.; Etchegoin, P. C. J. Phys. Chem. C 2008, 112,8117–8121.
(29) Taflove, A.; Hagness, S. C. Computational Electrodynamics: TheFinite-Difference Time-Domain Method, 3rd Edition ; Artech House: Boston,2005.
(30) Stewart, M. E.; Mack, N. H.; Malyarchuk, V.; Soares, J. A. N. T.;Lee, T.-W.; Gray, S. K.; Nuzzo, R. G.; Rogers, J. A. Proc. Nat. Acad. Sci.U.S.A. 2006, 103, 17143–17148.
(31) Suckling, J. R.; Sambles, J. R.; Lawrence, C. R. New J. Phys. 2007,9, 101(11).
(32) Thio, T.; Ghaemi, H. F.; Lezec, H. J.; Wolff, P. A.; Ebbesen, T. W.Opt. Soc. Am. B 1999, 16, 1743–1748.
(33) Brolo, A. G.; Kwok, S. C.; Moffitt, M. G.; Gordon, R.; Riordon,J.; Kavanagh, K. L. J. Am. Chem. Soc. 2005, 127, 14936–14941.
(34) Jiang, P.; McFarland, M. J. J. Am. Chem. Soc. 2005, 127, 3710–3711.
(35) Gao, H.; Henzie, J.; Odom, T. W. Nano Lett. 2006, 6, 2104–2108.(36) Brolo, A. G.; Arctanger, E.; Gordon, R.; Leathem, B.; Kavanagh,
K. L. Nano lett. 2004, 4, 2015–2018.(37) Lesuffleur, A.; Kumar, L. K. S.; Brolo, A. G.; Kavanagh, K. L.;
Gordon, R. J. Phys. Chem. C 2007, 111, 2347–2350.(38) Parsons, J.; Hendry, E. ; Burrows, C. P.; Auguie, J. R.; Barnes,
W. L. Phys. ReV. B 2009, 79, 073412(4).(39) Koerkamp, K. J. K.; Enoch, S.; Segerink, F. B.; van Hulst, N. F.;
Kuipers, L. Phys. ReV. Lett. 2004, 92, 183901–183904.(40) Deng, H.; Callender, R. J. Raman Spectrosc. 1999, 30, 685–691.
JP900764A
Nano-Hole-Enhanced Raman Spectroscopy J. Phys. Chem. C, Vol. 113, No. 26, 2009 11197