hexaware technologies adds 9 clients in q2cy15, buy
TRANSCRIPT
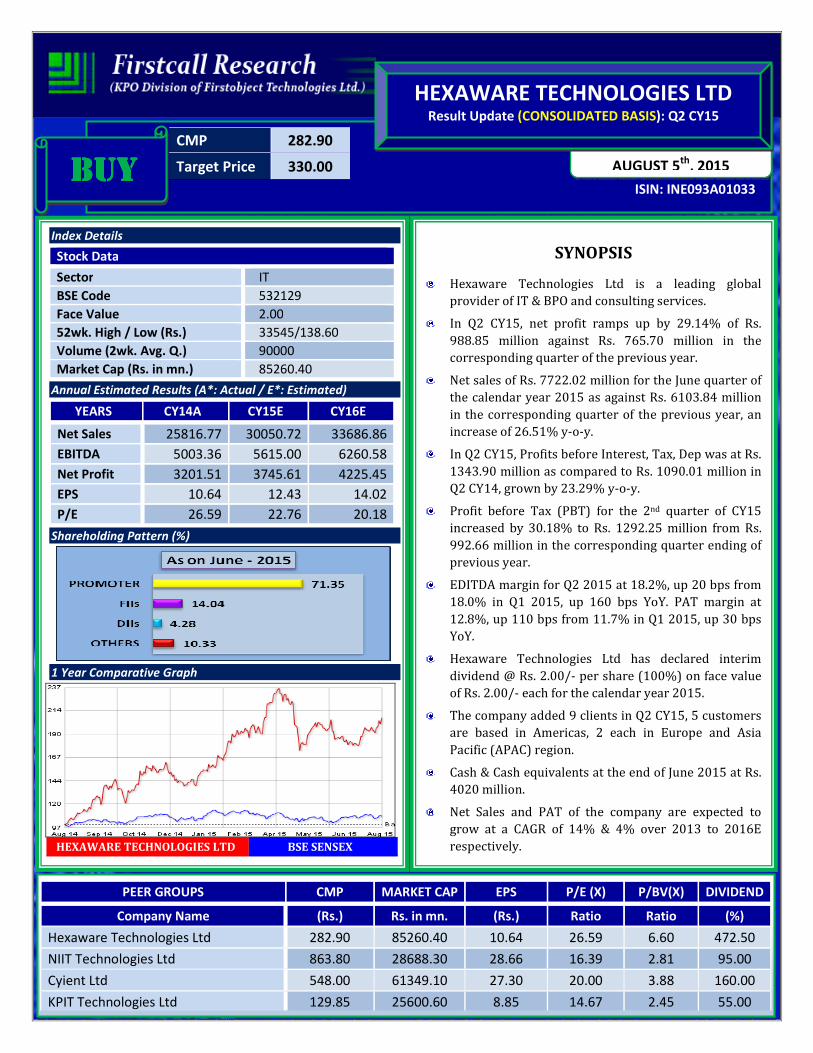
CMP 282.90
Target Price 330.00
ISIN: INE093A01033
AUGUST 5th
, 2015
HEXAWARE TECHNOLOGIES LTD
Result Update (CONSOLIDATED BASIS): Q2 CY15
BUYBUYBUYBUY
Index Details
Stock Data
Sector IT
BSE Code 532129
Face Value 2.00
52wk. High / Low (Rs.) 33545/138.60
Volume (2wk. Avg. Q.) 90000
Market Cap (Rs. in mn.) 85260.40
Annual Estimated Results (A*: Actual / E*: Estimated)
YEARS CY14A CY15E CY16E
Net Sales 25816.77 30050.72 33686.86
EBITDA 5003.36 5615.00 6260.58
Net Profit 3201.51 3745.61 4225.45
EPS 10.64 12.43 14.02
P/E 26.59 22.76 20.18
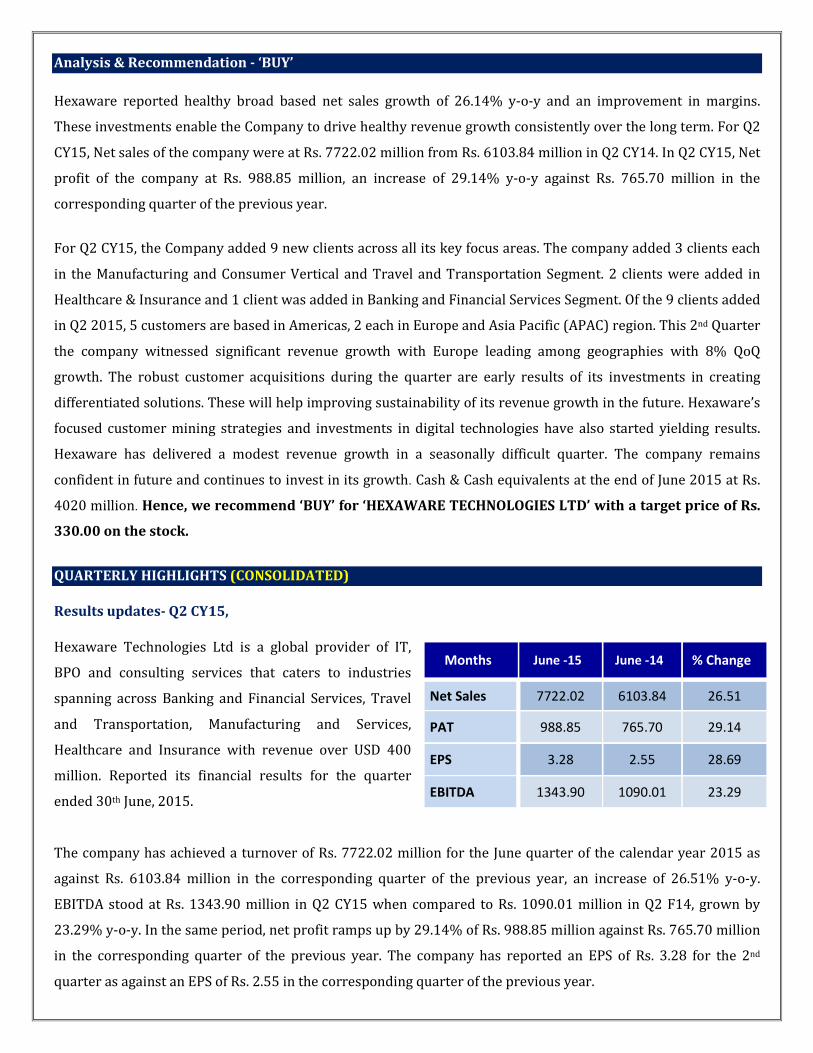
Shareholding Pattern (%)
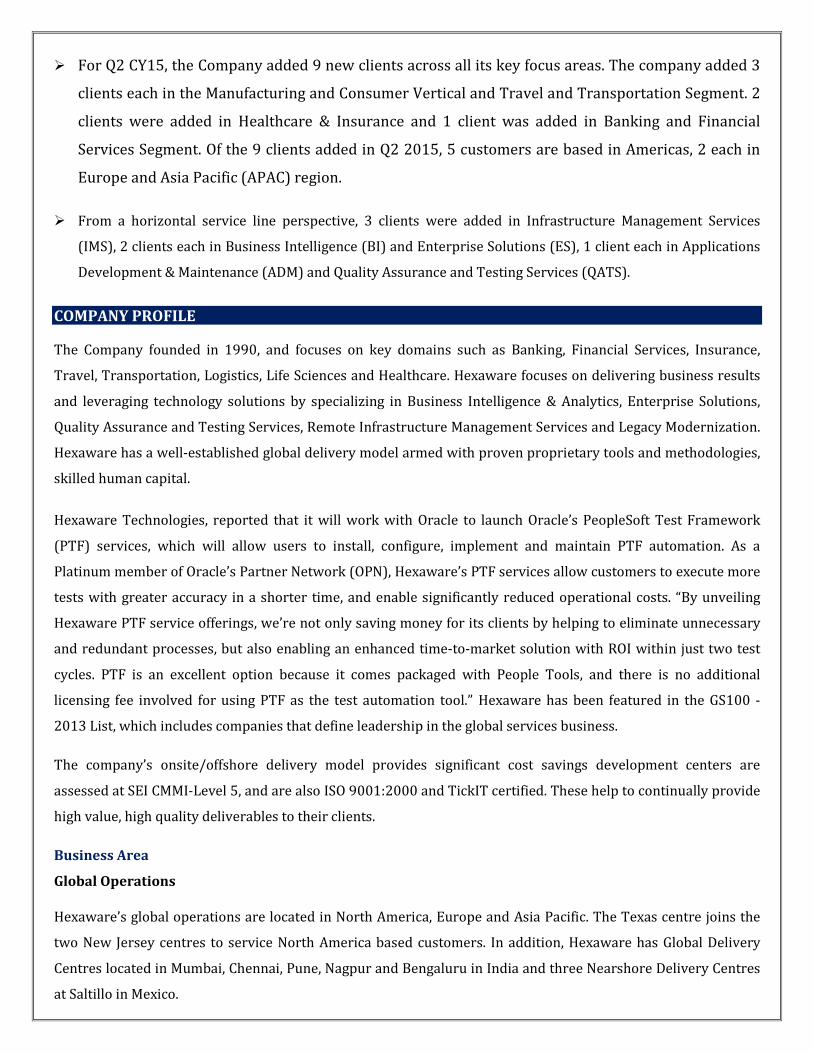
1 Year Comparative Graph
HEXAWARE TECHNOLOGIES LTD BSE SENSEX
SYNOPSIS
Hexaware Technologies Ltd is a leading global
provider of IT & BPO and consulting services.
In Q2 CY15, net profit ramps up by 29.14% of Rs.
988.85 million against Rs. 765.70 million in the
corresponding quarter of the previous year.
Net sales of Rs. 7722.02 million for the June quarter of
the calendar year 2015 as against Rs. 6103.84 million
in the corresponding quarter of the previous year, an
increase of 26.51% y-o-y.
In Q2 CY15, Profits before Interest, Tax, Dep was at Rs.
1343.90 million as compared to Rs. 1090.01 million in
Q2 CY14, grown by 23.29% y-o-y.
Profit before Tax (PBT) for the 2nd quarter of CY15
increased by 30.18% to Rs. 1292.25 million from Rs.
992.66 million in the corresponding quarter ending of
previous year.
EDITDA margin for Q2 2015 at 18.2%, up 20 bps from
18.0% in Q1 2015, up 160 bps YoY. PAT margin at
12.8%, up 110 bps from 11.7% in Q1 2015, up 30 bps
YoY.
Hexaware Technologies Ltd has declared interim
dividend @ Rs. 2.00/- per share (100%) on face value
of Rs. 2.00/- each for the calendar year 2015.
The company added 9 clients in Q2 CY15, 5 customers
are based in Americas, 2 each in Europe and Asia
Pacific (APAC) region.
Cash & Cash equivalents at the end of June 2015 at Rs.
4020 million.
Net Sales and PAT of the company are expected to
grow at a CAGR of 14% & 4% over 2013 to 2016E
respectively.
PEER GROUPS CMP MARKET CAP EPS P/E (X) P/BV(X) DIVIDEND
Company Name (Rs.) Rs. in mn. (Rs.) Ratio Ratio (%)
Hexaware Technologies Ltd 282.90 85260.40 10.64 26.59 6.60 472.50
NIIT Technologies Ltd 863.80 28688.30 28.66 16.39 2.81 95.00
Cyient Ltd 548.00 61349.10 27.30 20.00 3.88 160.00
KPIT Technologies Ltd 129.85 25600.60 8.85 14.67 2.45 55.00
Analysis & Recommendation - ‘BUY’
Hexaware reported healthy broad based net sales growth of 26.14% y-o-y and an improvement in margins.
These investments enable the Company to drive healthy revenue growth consistently over the long term. For Q2
CY15, Net sales of the company were at Rs. 7722.02 million from Rs. 6103.84 million in Q2 CY14. In Q2 CY15, Net
profit of the company at Rs. 988.85 million, an increase of 29.14% y-o-y against Rs. 765.70 million in the
corresponding quarter of the previous year.
For Q2 CY15, the Company added 9 new clients across all its key focus areas. The company added 3 clients each
in the Manufacturing and Consumer Vertical and Travel and Transportation Segment. 2 clients were added in
Healthcare & Insurance and 1 client was added in Banking and Financial Services Segment. Of the 9 clients added
in Q2 2015, 5 customers are based in Americas, 2 each in Europe and Asia Pacific (APAC) region. This 2nd Quarter
the company witnessed significant revenue growth with Europe leading among geographies with 8% QoQ
growth. The robust customer acquisitions during the quarter are early results of its investments in creating
differentiated solutions. These will help improving sustainability of its revenue growth in the future. Hexaware’s
focused customer mining strategies and investments in digital technologies have also started yielding results.
Hexaware has delivered a modest revenue growth in a seasonally difficult quarter. The company remains
confident in future and continues to invest in its growth. Cash & Cash equivalents at the end of June 2015 at Rs.
4020 million. Hence, we recommend ‘BUY’ for ‘HEXAWARE TECHNOLOGIES LTD’ with a target price of Rs.
330.00 on the stock.
QUARTERLY HIGHLIGHTS (CONSOLIDATED)
Results updates- Q2 CY15,
Hexaware Technologies Ltd is a global provider of IT,
BPO and consulting services that caters to industries
spanning across Banking and Financial Services, Travel
and Transportation, Manufacturing and Services,
Healthcare and Insurance with revenue over USD 400
million. Reported its financial results for the quarter
ended 30th June, 2015.
The company has achieved a turnover of Rs. 7722.02 million for the June quarter of the calendar year 2015 as
against Rs. 6103.84 million in the corresponding quarter of the previous year, an increase of 26.51% y-o-y.
EBITDA stood at Rs. 1343.90 million in Q2 CY15 when compared to Rs. 1090.01 million in Q2 F14, grown by
23.29% y-o-y. In the same period, net profit ramps up by 29.14% of Rs. 988.85 million against Rs. 765.70 million
in the corresponding quarter of the previous year. The company has reported an EPS of Rs. 3.28 for the 2nd
quarter as against an EPS of Rs. 2.55 in the corresponding quarter of the previous year.
Months June -15 June -14 % Change
Net Sales 7722.02 6103.84 26.51
PAT 988.85 765.70 29.14
EPS 3.28 2.55 28.69
EBITDA 1343.90 1090.01 23.29

Break up of Expenditure
Segment Revenue
Latest Updates
� EDITDA margin for Q2 2015 at 18.2%, up 20 bps from 18.0% in Q1 2015, up 160 bps YoY. PAT margin at
12.8%, up 110 bps from 11.7% in Q1 2015, up 30 bps YoY.
� Return on Equity (RoE) at 30.9 % at the end of Q2 2015 up from 26.9% last quarter.
� Gross margin for Q2 2015 at 36.0%, up 30 bps QoQ.
� Hexaware and Riversand enter into a global partnership to Transform Data Management for Digital
Businesses.
� The Company has hedges worth $ 177.00 mn at an effective rate of Rs. 67.73 and € 6.68 mn at an effective
exchange rate of Rs. 75.68 maturing over the course of the next eight quarters (from July 2015 to April 2017).
Break up of Expenditure (Rs. in millions)
Q2 CY15 Q2 CY14 Chng %
Employee Benefit Exp 4307.87 3390.19 27%
Operating & Other Exp 1316.21 1054.65 25%
Dep & Amortin Exp 114.87 107.64 7%
Software and other Exp 1316.21 1054.65 25%
� For Q2 CY15, the Company added 9 new clients across all its key focus areas. The company added 3
clients each in the Manufacturing and Consumer Vertical and Travel and Transportation Segment. 2
clients were added in Healthcare & Insurance and 1 client was added in Banking and Financial
Services Segment. Of the 9 clients added in Q2 2015, 5 customers are based in Americas, 2 each in
Europe and Asia Pacific (APAC) region.
� From a horizontal service line perspective, 3 clients were added in Infrastructure Management Services
(IMS), 2 clients each in Business Intelligence (BI) and Enterprise Solutions (ES), 1 client each in Applications
Development & Maintenance (ADM) and Quality Assurance and Testing Services (QATS).
COMPANY PROFILE
The Company founded in 1990, and focuses on key domains such as Banking, Financial Services, Insurance,
Travel, Transportation, Logistics, Life Sciences and Healthcare. Hexaware focuses on delivering business results
and leveraging technology solutions by specializing in Business Intelligence & Analytics, Enterprise Solutions,
Quality Assurance and Testing Services, Remote Infrastructure Management Services and Legacy Modernization.
Hexaware has a well-established global delivery model armed with proven proprietary tools and methodologies,
skilled human capital.
Hexaware Technologies, reported that it will work with Oracle to launch Oracle’s PeopleSoft Test Framework
(PTF) services, which will allow users to install, configure, implement and maintain PTF automation. As a
Platinum member of Oracle’s Partner Network (OPN), Hexaware’s PTF services allow customers to execute more
tests with greater accuracy in a shorter time, and enable significantly reduced operational costs. “By unveiling
Hexaware PTF service offerings, we’re not only saving money for its clients by helping to eliminate unnecessary
and redundant processes, but also enabling an enhanced time-to-market solution with ROI within just two test
cycles. PTF is an excellent option because it comes packaged with People Tools, and there is no additional
licensing fee involved for using PTF as the test automation tool.” Hexaware has been featured in the GS100 -
2013 List, which includes companies that define leadership in the global services business.
The company’s onsite/offshore delivery model provides significant cost savings development centers are
assessed at SEI CMMI-Level 5, and are also ISO 9001:2000 and TickIT certified. These help to continually provide
high value, high quality deliverables to their clients.
Business Area
Global Operations
Hexaware’s global operations are located in North America, Europe and Asia Pacific. The Texas centre joins the
two New Jersey centres to service North America based customers. In addition, Hexaware has Global Delivery
Centres located in Mumbai, Chennai, Pune, Nagpur and Bengaluru in India and three Nearshore Delivery Centres
at Saltillo in Mexico.

Technology Services
Industry Solutions
The Company focuses on key domains such as Banking, Financial Services, Insurance, Travel, Transportation,
Logistics, Life Sciences and Healthcare.
Technology solutions
Hexaware focuses on delivering business results and leveraging technology solutions by specializing in
• Enterprise Solutions(applications)
• Quality assurance and Testing Services
• Business intelligence & Analytics
• Microsoft Technology Services
• Legacy Management and technology
• Product Engineering
• Specialized Services
• Infrastructure management Services
• Java Technology Services
• Mobility Services
Partners
Hexaware partnerships are aimed at delivering real business value to clients. Each partnership helps their clients
leverage and enable strong competency and delivery capabilities with the comprehensiveness and strengths of
partner solutions and platforms. Some of these partners are
Oracle
Sap
HP
Microsoft
Lufthansa Systems
Informatica
Unisys
Alaric
eBaoTech
Herald Logic
EiQ Networks
Jamo Solutions
GreenLine
ZAP Technologies
Information Builders
Net APP(service provider)
MicroStrategy
Liferay
IBM
I create software
Checkmarx
Experitest
Cloudera
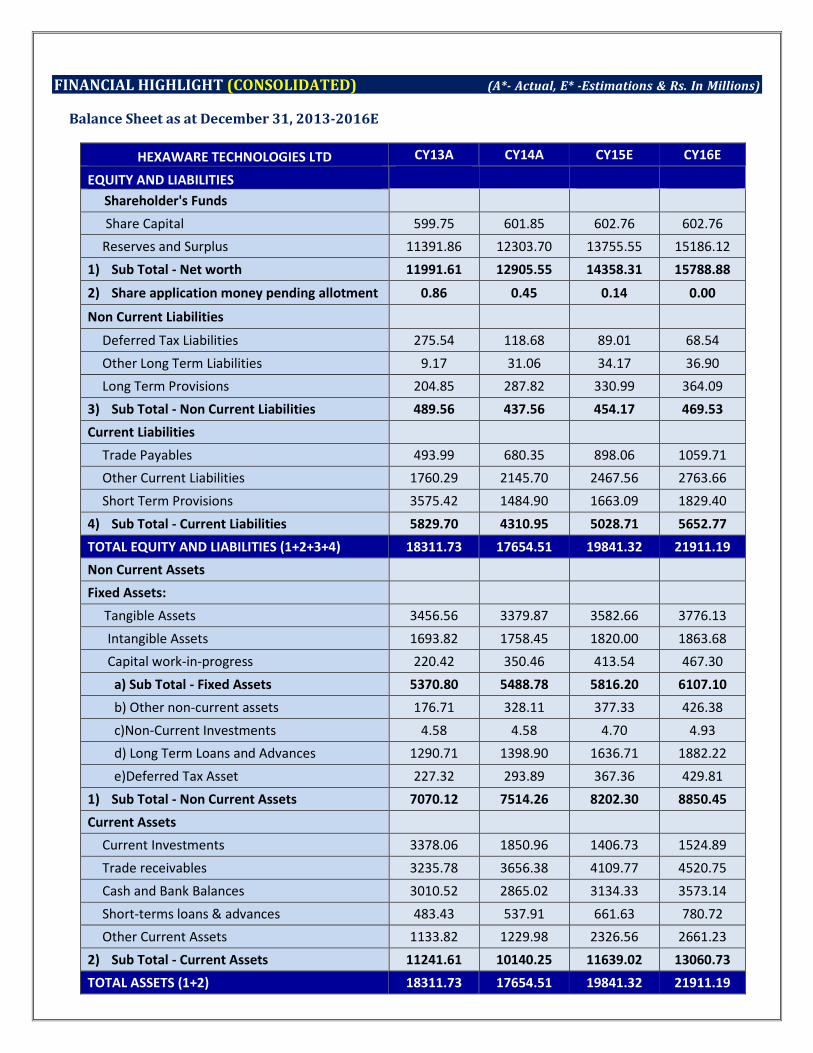
FINANCIAL HIGHLIGHT (CONSOLIDATED) (A*- Actual, E* -Estimations & Rs. In Millions)
Balance Sheet as at December 31, 2013-2016E
HEXAWARE TECHNOLOGIES LTD CY13A CY14A CY15E CY16E
EQUITY AND LIABILITIES
Shareholder's Funds
Share Capital 599.75 601.85 602.76 602.76
Reserves and Surplus 11391.86 12303.70 13755.55 15186.12
1) Sub Total - Net worth 11991.61 12905.55 14358.31 15788.88
2) Share application money pending allotment 0.86 0.45 0.14 0.00
Non Current Liabilities
Deferred Tax Liabilities 275.54 118.68 89.01 68.54
Other Long Term Liabilities 9.17 31.06 34.17 36.90
Long Term Provisions 204.85 287.82 330.99 364.09
3) Sub Total - Non Current Liabilities 489.56 437.56 454.17 469.53
Current Liabilities
Trade Payables 493.99 680.35 898.06 1059.71
Other Current Liabilities 1760.29 2145.70 2467.56 2763.66
Short Term Provisions 3575.42 1484.90 1663.09 1829.40
4) Sub Total - Current Liabilities 5829.70 4310.95 5028.71 5652.77
TOTAL EQUITY AND LIABILITIES (1+2+3+4) 18311.73 17654.51 19841.32 21911.19
Non Current Assets
Fixed Assets:
Tangible Assets 3456.56 3379.87 3582.66 3776.13
Intangible Assets 1693.82 1758.45 1820.00 1863.68
Capital work-in-progress 220.42 350.46 413.54 467.30
a) Sub Total - Fixed Assets 5370.80 5488.78 5816.20 6107.10
b) Other non-current assets 176.71 328.11 377.33 426.38
c)Non-Current Investments 4.58 4.58 4.70 4.93
d) Long Term Loans and Advances 1290.71 1398.90 1636.71 1882.22
e)Deferred Tax Asset 227.32 293.89 367.36 429.81
1) Sub Total - Non Current Assets 7070.12 7514.26 8202.30 8850.45
Current Assets
Current Investments 3378.06 1850.96 1406.73 1524.89
Trade receivables 3235.78 3656.38 4109.77 4520.75
Cash and Bank Balances 3010.52 2865.02 3134.33 3573.14
Short-terms loans & advances 483.43 537.91 661.63 780.72
Other Current Assets 1133.82 1229.98 2326.56 2661.23
2) Sub Total - Current Assets 11241.61 10140.25 11639.02 13060.73
TOTAL ASSETS (1+2) 18311.73 17654.51 19841.32 21911.19

Annual Profit & Loss Statement for the period of 2013 to 2016E
Value(Rs.in.mn) CY13A CY14A CY15E CY16E
Description 12m 12m 12m 12m
Net Sales 22853.48 25816.77 30050.72 33686.86
Other Income 372.73 227.76 145.77 163.26
Total Income 23226.21 26044.53 30196.49 33850.12
Expenditure -17731.19 -21041.17 -24581.49 -27589.54
Operating Profit 5495.02 5003.36 5615.00 6260.58
Interest -2.04 -8.98 -5.21 -5.73
Gross profit 5492.98 4994.38 5609.79 6254.85
Depreciation -386.04 -439.72 -470.50 -510.49
Exceptional Items -311.99 -373.47 -306.25 -321.56
Profit Before Tax 4794.95 4181.19 4833.04 5422.80
Tax -1003.61 -979.68 -1087.43 -1197.35
Net Profit 3791.34 3201.51 3745.61 4225.45
Equity capital 599.75 601.85 602.76 602.76
Reserves 11391.86 12303.71 13755.55 15186.12
Face value 2.00 2.00 2.00 2.00
EPS 12.64 10.64 12.43 14.02
Quarterly Profit & Loss Statement for the period of 31st Dec, 2014 to 30th Sept, 2015E
Value(Rs.in.mn) 31-Dec-14 31-Mar-15 30-Jun-15 30-Sep-15E
Description 3m 3m 3m 3m
Net sales 7117.98 7134.26 7722.02 8084.95
Other income 38.17 36.64 20.66 16.94
Total Income 7156.15 7170.90 7742.68 8101.90
Expenditure -5700.06 -5863.16 -6398.78 -6621.58
Operating profit 1456.09 1307.74 1343.90 1480.32
Interest -2.06 -0.16 -0.02 -2.75
Gross profit 1454.03 1307.58 1343.88 1477.57
Depreciation -113.43 -115.43 -114.87 -117.17
Exceptional Items -214.12 -134.08 63.24 -11.05
Profit Before Tax 1126.48 1058.07 1292.25 1349.35
Tax -253.89 -224.58 -303.40 -296.86
Net Profit 872.59 833.49 988.85 1052.50
Equity capital 600.65 602.25 602.76 602.76
Face value 2.00 2.00 2.00 2.00
EPS 2.91 2.77 3.28 3.49
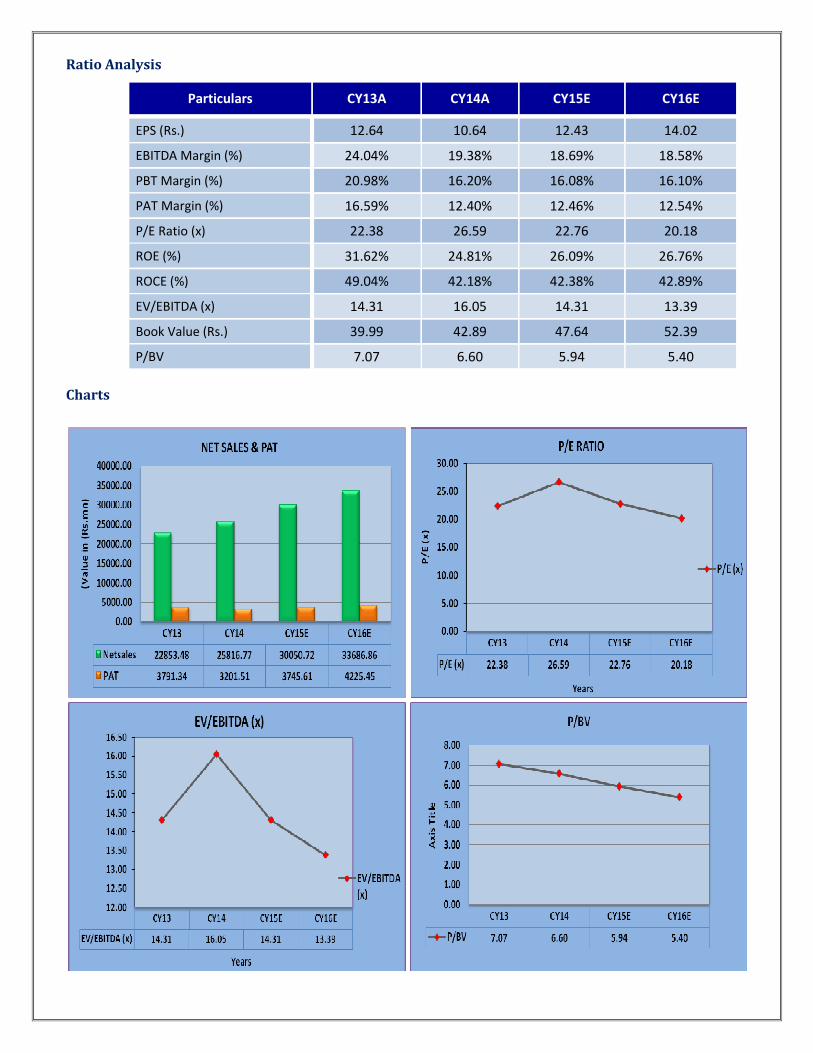
Ratio Analysis
Particulars CY13A CY14A CY15E CY16E
EPS (Rs.) 12.64 10.64 12.43 14.02
EBITDA Margin (%) 24.04% 19.38% 18.69% 18.58%
PBT Margin (%) 20.98% 16.20% 16.08% 16.10%
PAT Margin (%) 16.59% 12.40% 12.46% 12.54%
P/E Ratio (x) 22.38 26.59 22.76 20.18
ROE (%) 31.62% 24.81% 26.09% 26.76%
ROCE (%) 49.04% 42.18% 42.38% 42.89%
EV/EBITDA (x) 14.31 16.05 14.31 13.39
Book Value (Rs.) 39.99 42.89 47.64 52.39
P/BV 7.07 6.60 5.94 5.40
Charts

OUTLOOK AND CONCLUSION
� At the current market price of Rs. 282.90, the stock P/E ratio is at 22.76 x CY15E and 20.18 x CY16E
respectively.
� Earning per share (EPS) of the company for the earnings for CY15E and CY16E is seen at Rs. 12.43and Rs.
14.02 respectively.
� Net Sales and PAT of the company are expected to grow at a CAGR of 14% & 4% over 2013 to 2016E
respectively.
� On the basis of EV/EBITDA, the stock trades at 14.31 x for CY15E and 13.39 x for CY16E.
� Price to Book Value of the stock is expected to be 5.94 x and 5.40 x respectively for CY15E and CY16E.
� We recommend ‘BUY’ in this particular scrip with a target price of Rs. 330.00 for Medium to Long term
investment.
INDUSTRY OVERVIEW
The International Monetary Fund expects world economy to grow at 3.5 and 3.7 percent in 2015-16, downward
revisions of 0.3 percent relative to the October 2014 World Economic Outlook (WEO). The lower estimates
mirrors the reappraise of forecasts in China, Russia, the euro area, and Japan besides weaker activity in some
major oil exporters due to the sharp drop in oil prices. The economic growth in the United States is expected to
transcend 3% during 2015-16 and has been revised to 3.6% aided by domestic demand that will be driven by the
sharp fall in oil prices, moderate fiscal adjustment, and an accommodative monetary policy stance, despite the
projected gradual rise in interest rates. However, the dollar surge is projected to reduce net exports. Although
lower oil prices and quantitative easing support the Euro zone prospects, the IMF has lowered the economic
growth to 1.2% for 2015 weighed by stagnation and inflation. The impact of Abenomics is yet to translate into
positive economic growth prospect for Japan as it witnessed a technical recession in the third quarter of 2014.
The IMF has revised downward the economic growth to 0.6% in 2015 however; it has indicated lower oil prices
and yen depreciation to aid growth in 2015-16. For emerging market and developing economies, the IMF
forecasts economic growth to remain broadly stable at 4.3% in 2015 and to rise to 4.7% in 2016-a weaker pace
than forecast in the October 2014 WEO.
IT INDUSTRY OVERVIEW
Global it industry
Gartner in its IT Spending Forecast Summary, Q4 2014 Update estimates the US-dollar-valued worldwide IT
spending in 2015 is forecast to grow by 2.4%, down from the 3.9% forecast in last quarter's update. Stripping out
the impact of exchange rate movements, the corresponding constant-currency growth figure is 3.7%.The
worldwide IT services market will exceed USD 980 billion in 2015, growing 3.9% in constant currency in 2015,
or 2.5% in U.S. dollars. With outsourcing contributing more than half of market growth, the market will reach
USD 1.1 trillion in 2018.
Growth trends in the it industry
• Emerging geographies and verticals, non-linear growth due to platforms, products and automation.
• Revival in demand for IT services from US and Europe.
• Increasing adoption of technology and telecom by consumers and focused government initiatives –
leading to increased ICT adoption.
• High value client additions bigger than USD 1 million – the highest in the last 5 years, registering 13.5%
growth.
• Emerging verticals (retail, healthcare, utilities) are driving growth above 14%.
• The SMAC (social, mobility, analytics, cloud) market is expected to grow to USD 225 billion by 2020.
• USD 1.6 billion is spent annually on training workforce and growing R&D spend.
• The National Optical Fibre Network (NOFN) is being laid down in phases to connect all the 250,000 gram
panchayats in the country.
INDIAN IT INDUSTRY SCENARIO
o The Indian IT Services industry is expected to report a 12.6% export revenue growth in FY15E highlights
Nasscom. The revival in demand for IT Services from the US and Europe to be the growth driver for the
Indian IT Services industry in FY2015.
o The Indian IT-BPM industry is expected to maintain its positive momentum following the thrust provided
by the Indian government in the form of Digital India and Smart Cities projects. The industry is likely to
register 12.3% growth in FY 2015 in terms of export revenues led by renewal in demand from the US
reckons Nasscom.
o The Indian IT-BPM industry is expected to maintain its positive momentum following the thrust provided
by the Indian government in the form of Digital India and Smart Cities projects. The industry is likely to
register 12.3% growth in FY2015 in terms of export revenues led by renewal in demand from the US as
per Nasscom.
Disclaimer:
This document is prepared by our research analysts and it does not constitute an offer or solicitation for the
purchase or sale of any financial instrument or as an official confirmation of any transaction. The information
contained herein is from publicly available data or other sources believed to be reliable but we do not represent that
it is accurate or complete and it should not be relied on as such. Firstcall Research or any of its affiliates shall not be
in any way responsible for any loss or damage that may arise to any person from any inadvertent error in the
information contained in this report. Firstcall Research and/ or its affiliates and/or employees will not be liable for
the recipients’ investment decision based on this document.

Firstcall India Equity Research: Email – [email protected]
C.V.S.L.Kameswari Pharma & Diversified
U. Janaki Rao Capital Goods
B. Anil Kumar Auto, IT & FMCG
M. Vinayak Rao Diversified
G. Amarender Diversified
Firstcall Research Provides
Industry Research on all the Sectors and Equity Research on Major Companies
forming part of Listed and Unlisted Segments
For Further Details Contact:
Tel.: 022-2527 2510/2527 6077 / 25276089 Telefax: 022-25276089
040-20000235 /20000233
E-mail: [email protected]
www.firstcallresearch.com