hess and rube paper m15 sbs final updated
TRANSCRIPT
Hess and Rube 1
EXAMINING SLOW BUS SPEED SECTIONS OF THE M15 SELECT BUS SERVICE 1
ROUTE IN NEW YORK CITY 2
3 Word Count: 4,893 (text) + 250 * 8 (figures and tables) + 500 (references) = 7,393 4
5
Submission Date: May 21, 2015 6
7
8
9
10
11
12
13
14
15
16
17
18
19
20
21
22
23
24
25
26
27
28
29
30
31
32
33
34
35
36
37
38
Matthias Hess and Kate Rube 39
Grove School of Engineering 40
Steinman Hall 41
City College of New York 42
160 Convent Avenue 43
New York, NY 10031 44
Phone: 202-236-8713 Fax: Not Available 45
Email: [email protected], [email protected] 46
Hess and Rube 2
ABSTRACT 1 Like most bus systems, New York City buses experience significant delays because of traffic 2
congestion, frequent stops, and slow single-door boarding. To address these problems, in 2008 3
the City launched a branded “Select Bus Service” featuring dedicated bus lanes, stops that are 4
farther apart, and off-board fare payment with multi-door boarding (although not all routes 5
include all of these features). SBS routes have demonstrated marked improvements in trip time, 6
although there are still delays due to obstructions in bus lanes, roadway construction, and 7
conflicts with traffic at intersections. This paper analyzes average speeds of individual route 8
segments along the M15 SBS route running along 1st and 2nd Avenues in Manhattan, as well as 9
conditions and transit design characteristics along the route in an effort to identify defining 10
characteristics of the fastest- and slowest-operating areas. Higher-speed route sections were 11
found to be associated with the presence of a dedicated bus lane, the absence of roadway 12
construction, low numbers of vehicle obstructions in the bus lane, and lower intersection density, 13
suggesting that these factors can improve bus service. Further investigation of the slowest-speed 14
route sections is recommended in order to identify contributing factors that should be addressed 15
on this route and on other SBS routes throughout the city. 16

Hess and Rube 3
INTRODUCTION 1 In 2008, Select Bus Service was introduced to solve the problems of unmet demand, slow buses, 2
and limited funds for transit expansion. With increasing transit ridership and little in the way of 3
subway expansion, higher quality bus service was chosen as an economical way to improve the 4
capacity and functionality of the transit system (1). There are now seven Select Bus Service 5
routes in the city, with more planned to launch over the next few years. The M15 route was 6
prioritized for SBS treatment because the single subway line on the east side of Manhattan 7
operates at maximum capacity and the route serves key employment, health, and many other 8
important destinations (2). 9
This paper examines the average bus speed of the M15 Select Bus Service (M15 SBS) in 10
Manhattan, identifying sections of the route where buses move the fastest and the slowest in 11
order to explore opportunities for speed improvements. The M15 SBS is an express version of 12
the M15, which runs along 1st and 2nd Avenues in Manhattan. With a dedicated lane along most 13
of the 8.5-mile route, off-board fare payment and wider stop spacing, Select Bus Service is New 14
York City’s version of Bus Rapid Transit (3). 15
16
LITERATURE REVIEW 17 Bus Rapid Transit systems have grown in popularity worldwide over the past decade because of 18
their ability to improve travel times and ridership numbers at a relatively modest cost compared 19
to other transit options, such as light or heavy rail. The Federal Transit Administration defines 20
BRT as a ‘rapid mode of transportation that can provide the quality of rail transit and the 21
flexibility of buses’ (4). TCRP Report 118 states that ‘BRT is an integrated system of facilities, 22
equipment, services, and amenities that improves the speed, reliability, and identity of bus 23
transit’ (5). 24
There is a rich set of literature about the benefits of BRT (6,7), although there are also 25
frequent challenges to planning and implementation (8). Compared to rail systems, BRT can be 26
implemented quickly, incrementally, and cost-effectively (5). When properly implemented, BRT 27
has been shown to increase bus speeds, reduce travel times, and increase ridership (6,7). A 28
review of BRT systems worldwide found that the average operating speed of BRT routes ranges 29
from 17.5-20 km/hour (10.9-12.4 miles/hour) but that interference from cars turning right or 30
obstructing the bus lane reduces operating speeds (8). 31
The characteristics of BRT vary from system to system, and can include buses traveling 32
in mixed traffic lanes, dedicated curb bus lanes, or busways in the street median that are 33
physically segregated from other vehicle lanes (9). Lindau found that due to an easier 34
implementation, 80 percent of BRT lines worldwide have dedicated lanes instead of physically 35
segregated facilities, termed “exclusive lanes” in that paper (8). BRT stations are often farther 36
apart than on regular bus routes, and service is frequent. The stations often are of higher quality 37
than basic bus stops, with amenities for passenger comfort and convenience. Some BRT systems 38
have raised platforms to allow for more seamless bus boarding. BRT buses can include features 39
that help to reduce dwell times, such as low floors and more and wider doors. Finally, many BRT 40
systems use forms of Intelligent Transportation Systems to improve bus travel speeds and to 41
provide passengers with service information (9). A Finnish study cited in TCRP Report 110 42
found that bus-only lanes can improve speeds by 15-20 percent, while traffic signal priority can 43
reduce delays by 40-50 percent (5). A case study in New York City showed that dedicated bus 44
lanes, combined with signal priority and off-board fare collection, immediately resulted in 45
Hess and Rube 4
dramatic performance improvements; further improvement is expected as passengers become 1
familiar with the off-board fare payment system (10). 2
BRT can be implemented in many different forms and with diverse design features. 3
Traffic signal prioritization and fare prepayment can help BRT routes to improve running times 4
and boost ridership (8,9,11). Because on-street bus lanes can be negatively affected by traffic 5
congestion (12), dedicated bus lanes have been identified as a very important feature to improve 6
service and ridership numbers (8,9,7,13,14,15), which makes them an efficient use of roadway 7
space (16). However, camera enforcement is critical to keeping these lanes free from obstruction 8
(17,18,19). TCRP Report 118 details features of BRT systems that help to boost ridership, and 9
physically segregated bus lanes is weighted the highest, at 20 points, as opposed to specially 10
designated bus lanes (5 points) that are not physically separated from adjacent traffic. (5) 11
Research in San Francisco, which has similar bus-only lanes to New York City’s Select 12
Bus Service, found that 25-60 percent of vehicles on observed streets are violating the bus-only 13
lane (19). Just a few vehicles illegally in a dedicated bus lane can lead to significant bus delays 14
(20), which is why strict enforcement or physical separation is so important (8). 15
A study in New York City found that offsetting dedicated bus lanes and painting them 16
red contributed to a lower rate of obstruction (21). Kiesling’s paper recommends that bus-only 17
lane enforcement ‘should be increased where buses are regularly hampered by congestion caused 18
by other vehicles violating the bus-only lane’ (19). Researchers in Boston found that most 19
congestion delay could be eliminated by applying a variety of bus priority measures in problem 20
areas (22). 21
A TCRP report notes that bus delays generally can be attributed to one or more of the 22
following sources: 23
● Travel time in traffic, which is impacted by congestion levels 24
● Time stopped at traffic signals 25
● Pulling into and out of bus stops 26
● Dwell times for passengers to board the bus 27
● Inefficient routing, such as the inclusion of many turns (5) 28
29
Two areas relevant to this study that could benefit from further research are: 30
1) The difference in bus speeds, travel times, and ridership between dedicated bus lanes, 31
which characterize the M15 SBS, and exclusive bus lanes that are physically separated 32
from traffic and would prevent any other vehicles from entering the lane 33
2) Factors that contribute to bus delays and slow speeds for buses specifically operating in 34
dedicated lanes 35
36
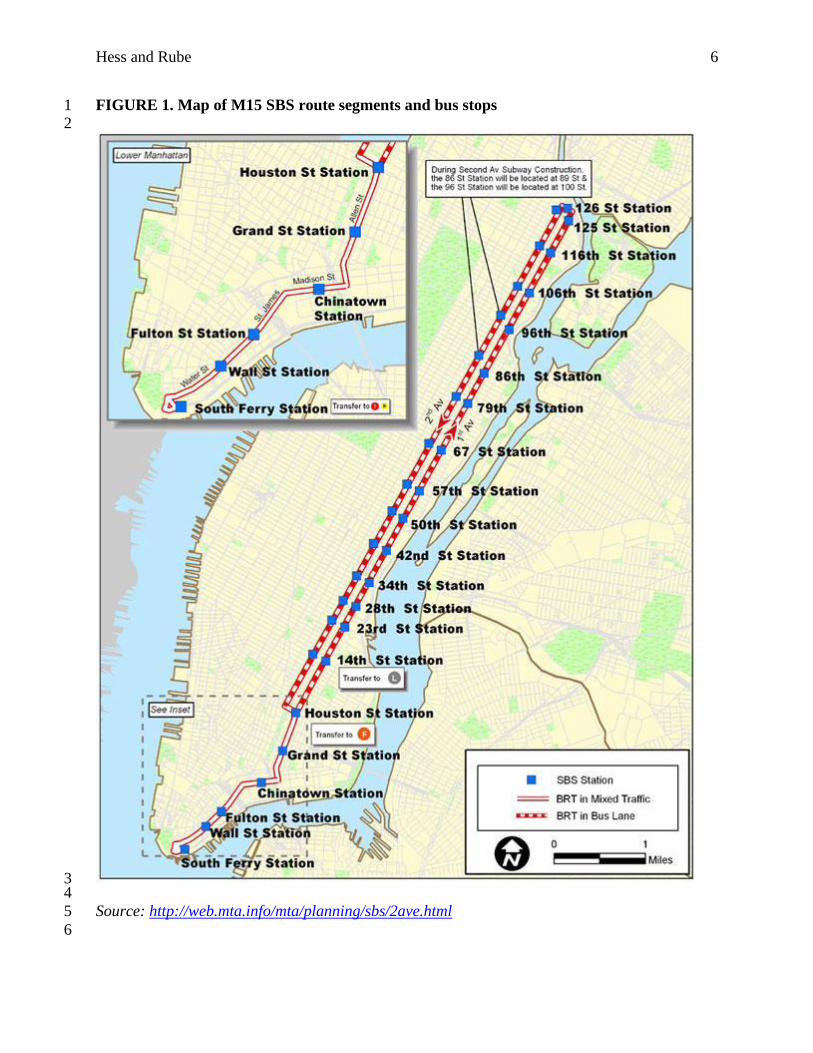
BACKGROUND ON M15 SELECT BUS SERVICE 37 The M15 SBS operates between 125th Street in East Harlem and South Ferry at the southern tip 38
of Manhattan (see Figure 1). The majority of the route runs south on 2nd Avenue and north on 39
1st Avenue, both one-way streets (1). In each direction there are 20 stations about ½ mile apart 40
(23). The characteristics of the M15 SBS that were designed to improve bus speeds include: 41
● A dedicated lane throughout most of the route, except for the section south of Houston 42
Street. The lane is painted terra cotta red and varies between a curbside and offset 43
position. There are overhead signs that identify the lane as bus-only at all times for offset 44
sections and during peak hours (7-10am and 2-7pm, Mon to Fri) for curbside sections. 45
Non-bus vehicles are permitted to enter the bus lane to make right turns, to access 46
Hess and Rube 5
driveways and parking spots, and to quickly pick up or drop off passengers. Enforcement 1
of the bus lanes is aided by video cameras along the route; the number and location of 2
cameras is not made public. 3
● Fare-prepayment, which requires that riders use curbside machines to pay in advance of 4
boarding the bus to improve dwell times. Riders receive receipts for their payments, 5
which are checked randomly by a team of fare inspectors. 6
● Three-door, low floor buses, which are also designed to improve dwell times; passengers 7
can board the bus from any door. 8
● Transit signal prioritization for the route section south of Houston Street, which shortens 9
red cycles and extends green cycles when buses are present (1,23). 10
Since launching in October 2010, the M15 SBS has improved travel times by 15-18 percent 11
compared to the M15 Limited service it replaced, and has boosted corridor ridership by nine 12
percent, according to the MTA. In particular, fare prepayment methods and multiple-door 13
boarding has reduced dwell times by 40 percent (23). Analysis by the New York City 14
Department of Transportation and MTA has also showed that removing a vehicle travel lane in 15
order to create the dedicated bus lane has had minimal impact on traffic volumes and automobile 16
speeds (3,23). 17
There are some features often associated with Bus Rapid Transit systems that are missing 18
from the M15 SBS, however. There is no Transit Signal Priority north of Houston Street, which 19
comprises the majority of the route; instead, the buses take advantage of the already-in-place 20
strong signal progression of 1st and 2nd Avenues, as do cars and other buses (23). Since the 21
dedicated bus lane is not physically separated, general traffic can enter the bus lane legally at 22
intersections to turn right. Deliveries, passenger drop offs, and other obstructions in the dedicated 23
lane are also difficult to prevent, although an MTA report on the M15 SBS noted that more than 24
30,000 bus-lane violations were issued between the route’s launch and July 2011 (23). 25
A recent news article also reported that congestion and road construction, much of it 26
associated with the new 2nd Avenue subway line, has negatively impacted the M15 SBS route 27
and potentially contributed to the four percent decline in its ridership between 2011 and 2014. 28
Declining ridership is a trend across New York City’s bus lines, the article notes, even as city 29
subway ridership continues to grow. The ridership decline on the M15 SBS is, however, less than 30
the 13 percent drop in ridership on other local north-south routes over the same time period. (24) 31
Hess and Rube 6
FIGURE 1. Map of M15 SBS route segments and bus stops 1 2
3 4
Source: http://web.mta.info/mta/planning/sbs/2ave.html 5
6
Hess and Rube 7
RESEARCH QUESTION 1 This paper examines the sections of the M15 Select Bus Service route that have the fastest and 2
slowest moving bus speeds, and considers factors that could be contributing to congestion in the 3
slow segments. 4
The M15 SBS was selected for analysis because it presents an opportunity to examine 5
several aspects of bus service. As the second SBS route in New York City, it was implemented 6
to operate in a combination of offset lanes, curbside lanes, and mixed traffic, allowing bus speeds 7
in these different configurations to be compared. It is also an important transit route in that the 8
corridor includes very dense neighborhoods and many large employers (the United Nations, 9
health institutions). With a parallel subway route that is at or over capacity throughout the day, it 10
is important that the M15 SBS line can offer a competitive transit alternative, which requires 11
efficient speeds and travel times. 12
13
METHODOLOGY 14 This study uses quantitative analysis of average running times to identify problem areas; 15
qualitative analysis of facility characteristics was then applied in an effort to identify factors that 16
may explain slow speeds. 17
18
Quantitative Analysis of Running Time 19
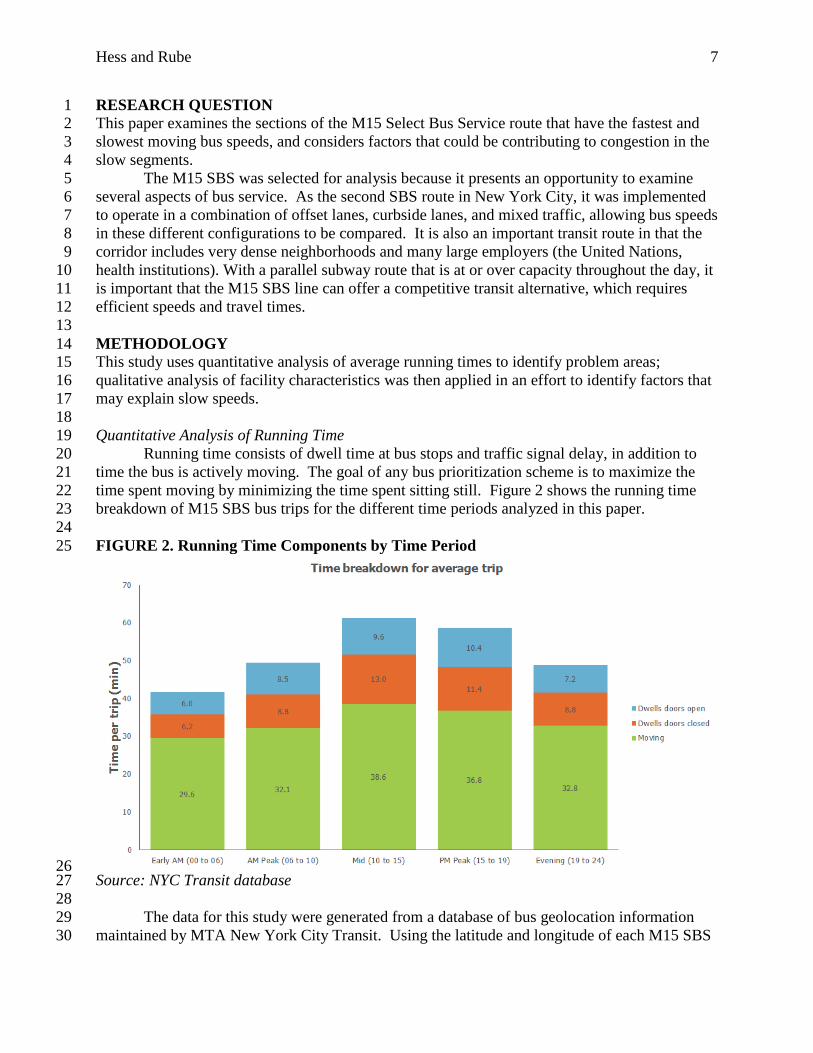
Running time consists of dwell time at bus stops and traffic signal delay, in addition to 20
time the bus is actively moving. The goal of any bus prioritization scheme is to maximize the 21
time spent moving by minimizing the time spent sitting still. Figure 2 shows the running time 22
breakdown of M15 SBS bus trips for the different time periods analyzed in this paper. 23
24
FIGURE 2. Running Time Components by Time Period25
26 Source: NYC Transit database 27
28
The data for this study were generated from a database of bus geolocation information 29
maintained by MTA New York City Transit. Using the latitude and longitude of each M15 SBS 30
Hess and Rube 8
bus stop, a seven-day (April 6 - 12, 2015) report of bus running times was generated for each 1
adjacent pair of stops, in each direction (for 20 northbound route segments and 20 southbound). 2
This time period was chosen as a typical week without holidays, major weather events or service 3
disruptions. Figure 2 shows the M15 SBS route, including bus stop locations. The average 4
running times were divided into weekdays, weekends, and five time periods for each route 5
segment: early morning (12-6am), AM peak (6-10am), midday (10am-3pm), PM peak (3-7pm), 6
and evening (7pm-12am). 7
Google Maps was used to measure the distance between stops, ranging from 0.2 to 0.8 8
(average 0.43) miles. These running time and distance values were used to calculate the average 9
speed in miles per hour for each route segment. 10
11
Qualitative Analysis of the SBS M15 Route Segments 12
Six ride checks (three in each direction) were then conducted to observe conditions along 13
the route and to record factors that could impact bus speeds. The ride checks were conducted at 14
the following times: 15
● AM Peak Southbound: Tuesday, April 21 16
● PM Peak Northbound: Tuesday, April 21 17
● Mid-day Southbound: Wednesday, April 22 18
● Mid-day Northbound: Friday, April 24 19
● Weekend Southbound: Saturday, April 25 20
● Weekend Northbound: Saturday, April 25 21
22
The following attributes were recorded for each segment of the route during these ride checks, 23
since these factors could help to potentially explain differences in bus speeds: 24
● Number of intersections (nearly all are signalized) 25
● Number of right turns permitted 26
● Number of right turns observed 27
● Number of driveways 28
● Condition of traffic in adjacent vehicle lanes (free-flowing, congested, or gridlock) 29
● Location of bus stops (near side of the intersection, far side, or mid block) 30
● Bus lane description (curbside, offset, or mixed traffic) 31
● Number of cars in the dedicated bus lane (if applicable) 32
● Number of trucks in the dedicated bus lane (if applicable) 33
● Locations of construction that interferes with the bus lane 34
● Other observations, including boarding of wheelchair passengers 35
36
RESULTS 37 Average Speed 38
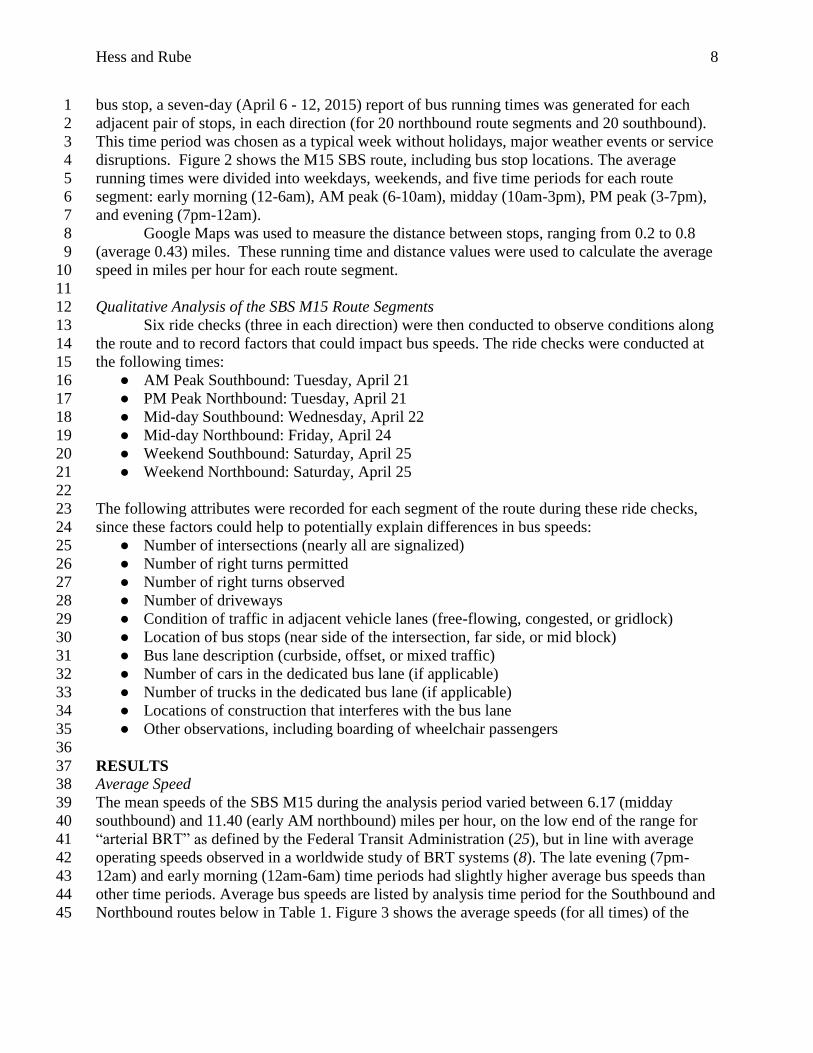
The mean speeds of the SBS M15 during the analysis period varied between 6.17 (midday 39
southbound) and 11.40 (early AM northbound) miles per hour, on the low end of the range for 40
“arterial BRT” as defined by the Federal Transit Administration (25), but in line with average 41
operating speeds observed in a worldwide study of BRT systems (8). The late evening (7pm-42
12am) and early morning (12am-6am) time periods had slightly higher average bus speeds than 43
other time periods. Average bus speeds are listed by analysis time period for the Southbound and 44
Northbound routes below in Table 1. Figure 3 shows the average speeds (for all times) of the 45
Hess and Rube 9
M15 SBS route segments, grouped into the fastest quartile (green segments), slowest quartile 1
(red), and middle quartiles (blue), by direction. 2
3
TABLE 1. M15 SBS Average Speeds by Time Period and Direction 4 5
Weekday (Mon to Fri) Weekend (Sat/Sun)
Time Period Southbound
Average Speed
Northbound
Average Speed
Southbound
Average Speed
Northbound
Average Speed
0:00-6:00 10.28 mph 11.40 mph N/A N/A
6:00-10:00 6.88 mph 8.86 mph 8.82 mph 10.24 mph
10:00-15:00 6.17 mph 7.74 mph 7.28 mph 9.26 mph
15:00-19:00 6.73 mph 8.22 mph 7.16 mph 9.08 mph
19:00-0:00 8.23 mph 9.81 mph 8.08 mph 9.75 mph
6
Hess and Rube 10
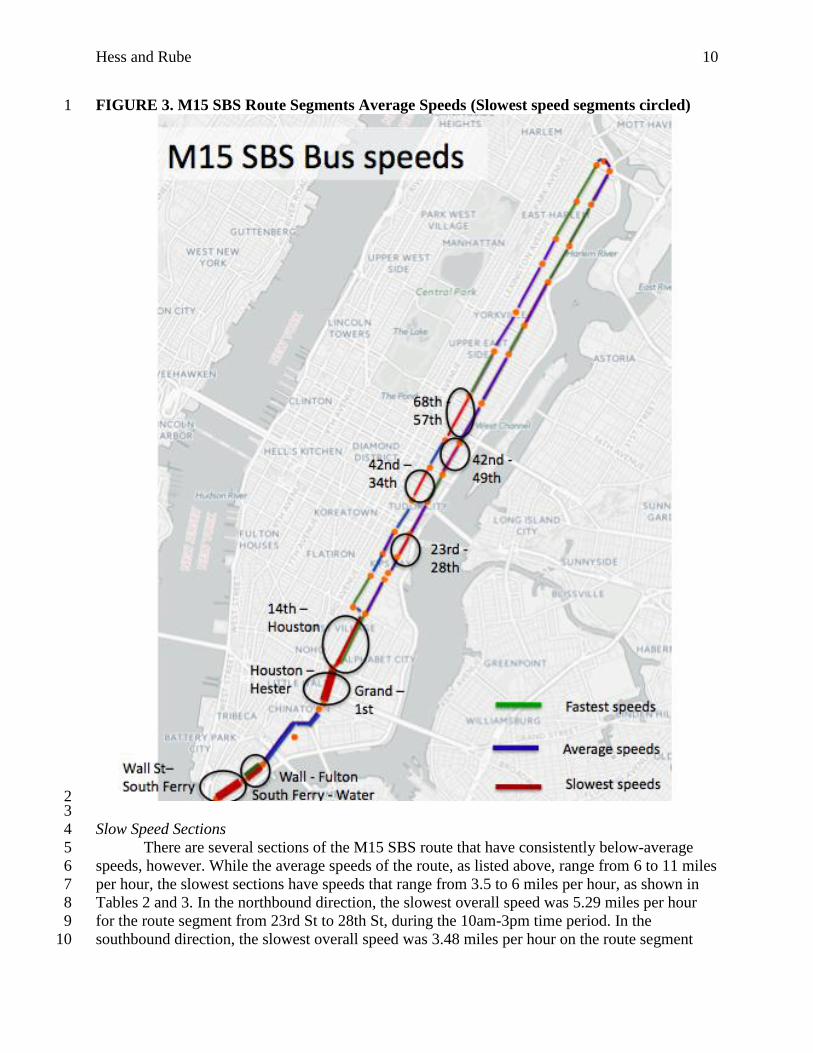
FIGURE 3. M15 SBS Route Segments Average Speeds (Slowest speed segments circled) 1
2 3
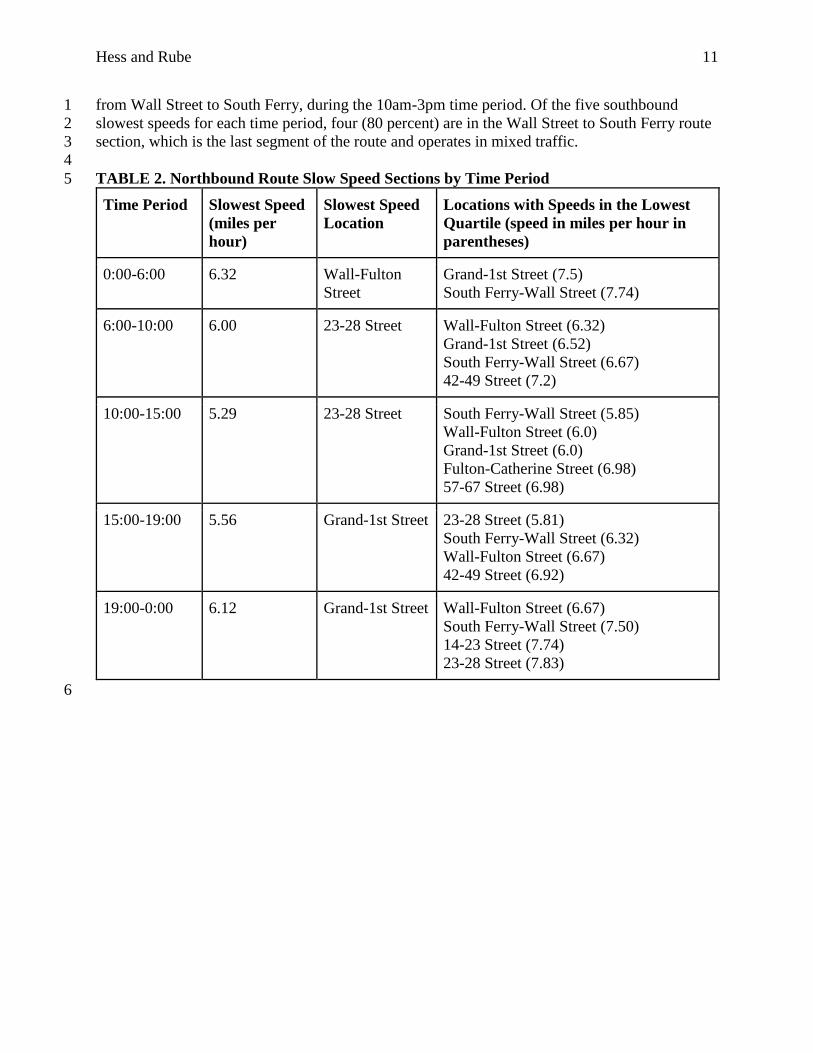
Slow Speed Sections 4
There are several sections of the M15 SBS route that have consistently below-average 5
speeds, however. While the average speeds of the route, as listed above, range from 6 to 11 miles 6
per hour, the slowest sections have speeds that range from 3.5 to 6 miles per hour, as shown in 7
Tables 2 and 3. In the northbound direction, the slowest overall speed was 5.29 miles per hour 8
for the route segment from 23rd St to 28th St, during the 10am-3pm time period. In the 9
southbound direction, the slowest overall speed was 3.48 miles per hour on the route segment 10
Hess and Rube 11
from Wall Street to South Ferry, during the 10am-3pm time period. Of the five southbound 1
slowest speeds for each time period, four (80 percent) are in the Wall Street to South Ferry route 2
section, which is the last segment of the route and operates in mixed traffic. 3
4
TABLE 2. Northbound Route Slow Speed Sections by Time Period 5
Time Period Slowest Speed
(miles per
hour)
Slowest Speed
Location
Locations with Speeds in the Lowest
Quartile (speed in miles per hour in
parentheses)
0:00-6:00 6.32 Wall-Fulton
Street
Grand-1st Street (7.5)
South Ferry-Wall Street (7.74)
6:00-10:00 6.00 23-28 Street Wall-Fulton Street (6.32)
Grand-1st Street (6.52)
South Ferry-Wall Street (6.67)
42-49 Street (7.2)
10:00-15:00 5.29 23-28 Street South Ferry-Wall Street (5.85)
Wall-Fulton Street (6.0)
Grand-1st Street (6.0)
Fulton-Catherine Street (6.98)
57-67 Street (6.98)
15:00-19:00 5.56 Grand-1st Street 23-28 Street (5.81)
South Ferry-Wall Street (6.32)
Wall-Fulton Street (6.67)
42-49 Street (6.92)
19:00-0:00 6.12 Grand-1st Street Wall-Fulton Street (6.67)
South Ferry-Wall Street (7.50)
14-23 Street (7.74)
23-28 Street (7.83)
6
Hess and Rube 12
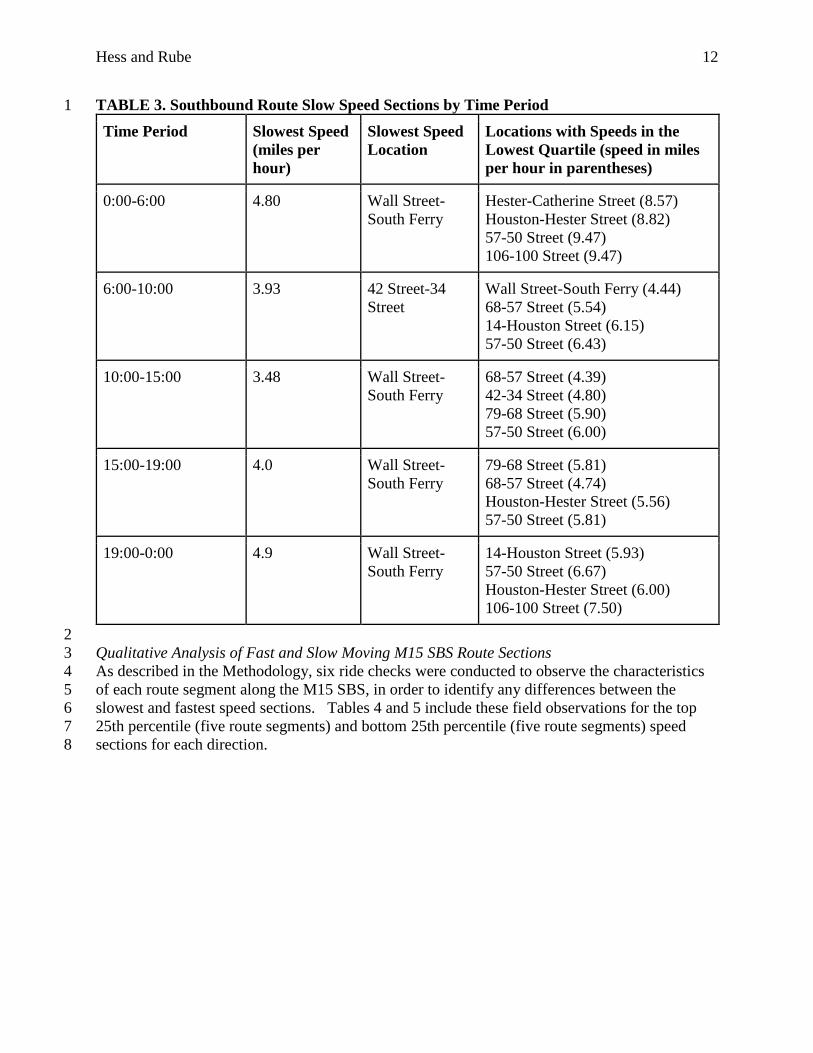
TABLE 3. Southbound Route Slow Speed Sections by Time Period 1
Time Period Slowest Speed
(miles per
hour)
Slowest Speed
Location
Locations with Speeds in the
Lowest Quartile (speed in miles
per hour in parentheses)
0:00-6:00 4.80 Wall Street-
South Ferry
Hester-Catherine Street (8.57)
Houston-Hester Street (8.82)
57-50 Street (9.47)
106-100 Street (9.47)
6:00-10:00 3.93 42 Street-34
Street
Wall Street-South Ferry (4.44)
68-57 Street (5.54)
14-Houston Street (6.15)
57-50 Street (6.43)
10:00-15:00 3.48 Wall Street-
South Ferry
68-57 Street (4.39)
42-34 Street (4.80)
79-68 Street (5.90)
57-50 Street (6.00)
15:00-19:00 4.0 Wall Street-
South Ferry
79-68 Street (5.81)
68-57 Street (4.74)
Houston-Hester Street (5.56)
57-50 Street (5.81)
19:00-0:00 4.9 Wall Street-
South Ferry
14-Houston Street (5.93)
57-50 Street (6.67)
Houston-Hester Street (6.00)
106-100 Street (7.50)
2
Qualitative Analysis of Fast and Slow Moving M15 SBS Route Sections 3
As described in the Methodology, six ride checks were conducted to observe the characteristics 4
of each route segment along the M15 SBS, in order to identify any differences between the 5
slowest and fastest speed sections. Tables 4 and 5 include these field observations for the top 6
25th percentile (five route segments) and bottom 25th percentile (five route segments) speed 7
sections for each direction. 8
Hess and Rube 13
Aver
age
Spee
d
Num
ber o
f Inte
rsec
tions
Inte
rsect
ions
per m
ile
Rig
ht turn
s obse
rved
Num
ber o
f Drive
ways
(only
on b
us si
de)
Num
ber o
f car
s in
dedic
ated
bus la
ne
Num
ber o
f tru
cks in
dedic
ated
bus la
ne
Bus la
ne posi
tion
Bus s
top p
ositio
n
Constr
uctio
n?
Note
s/Oth
er
Northbound
Fast
Segments
1st-14th 11.05 13 21.67 2.00 - 1.67 0.33 Offset
mid block,
mid block yes
Construction in bus lane
just north of 14th St
34th-42nd 10.32 4 10 2.00 - 1.50 0.67 Curbside
mid block,
mid block no
79th-86th 11.46 8 20 3.00 - 1.00 0.33 Offset
mid block,
mid block no
Heavy right turns at 86th
(bus lane ends)
97th-105th 13.63 5 10 2.00 1.00 1.33 - Offset
mid block,
mid block no
105th-116th 12.61 5 10 2.00 3.00 3.67 0.33 Offset
mid block,
mid block no
Ending segment loops
around with many
curves/turns
AVERAGE -
FAST
SEGMENTS 11.82 7.00 14.33 2.20 0.80 1.83 0.33
0% mixed
traffic 20%
Northbound
Slow
Segments
S Ferry-Wall St 6.49 6 15 - - N./A N./A
mixed
traffic
Off street,
mid block no
Wall-Fulton 6.47 5 25 - 1.00 N./A N./A
mixed
traffic
Mid block,
mid block no
Lots of double-parked
cars/taxis
Grand-1st 6.00 7 14 - - N./A N./A
mixed
traffic
Mid block,
mid block yes
Dedicated lane starts at
Houston; Paint is faded
23rd-28th 6.03 5 16.67 - 3.00 - - Offset
Mid block,
near side no
42nd-49th 7.39 3 10 - 3.00 - - Curbside
Mid block,
mid block no
AVERAGE -
SLOW
SEGMENTS 6.48 5.20 16.13 - 1.40 - -
60%
mixed
traffic 20%
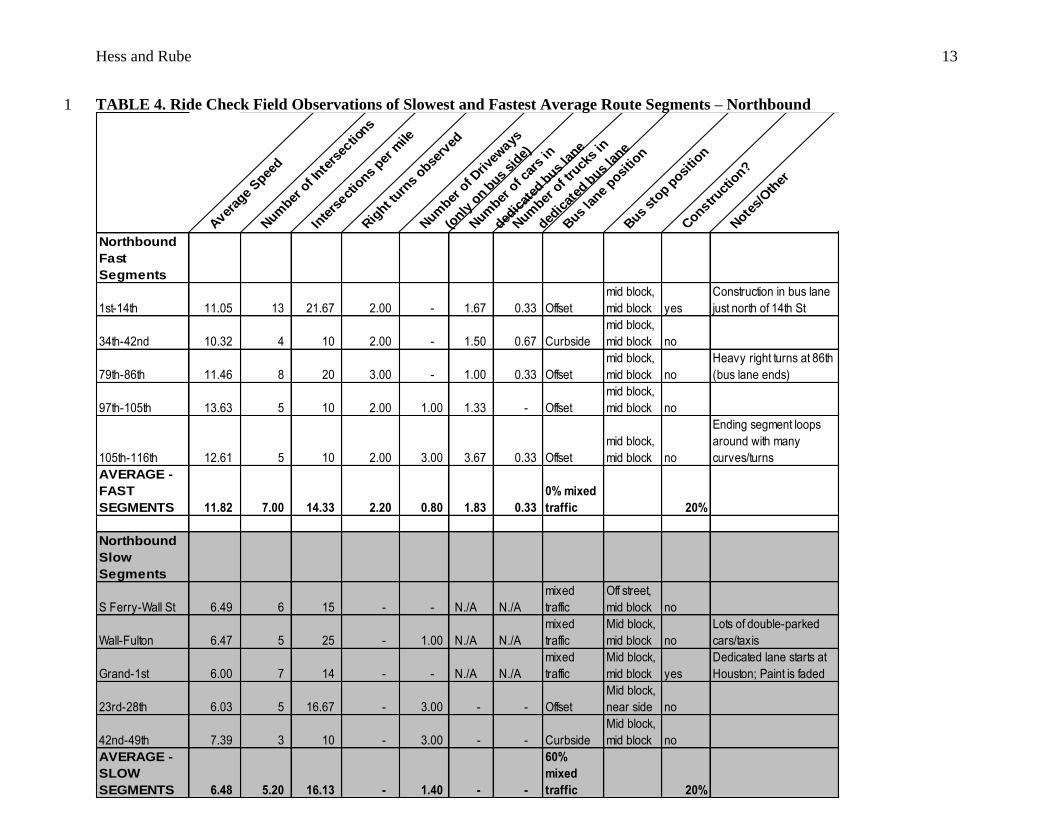
TABLE 4. Ride Check Field Observations of Slowest and Fastest Average Route Segments – Northbound 1
Hess and Rube 14
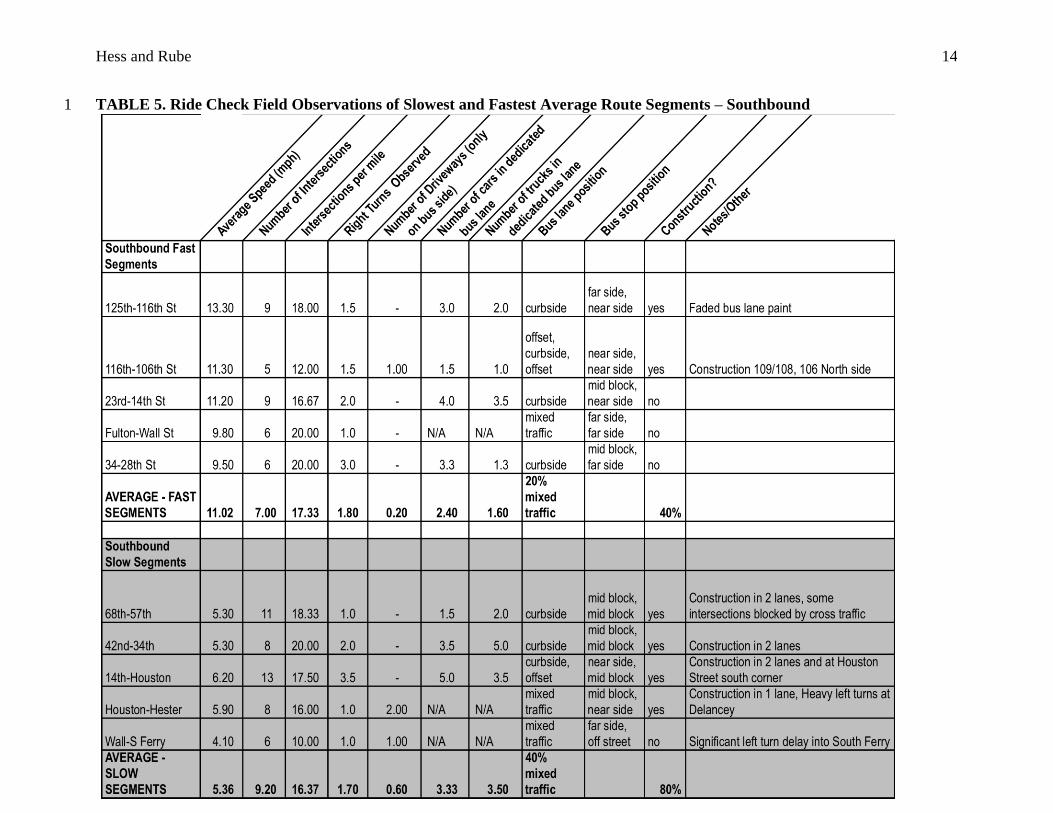
TABLE 5. Ride Check Field Observations of Slowest and Fastest Average Route Segments – Southbound1
Hess and Rube 15
The slowest northbound route sections had the following characteristics, compared to the fastest 1
sections: 2
● A higher number of mixed traffic bus lanes: all five of the fastest sections featured an 3
offset or curbside bus lane, while only two out of the five slowest bus sections had a 4
dedicated lane. 5
● A higher average intersection density (16.13 intersections per mile) compared to the 6
fastest sections (14.33) 7
8
Analysis of the northbound runtimes also yielded some surprising findings: 9
● An average of 2.2 right turns were observed in the fastest sections, but no right turns were 10
observed in the slowest sections. It is likely that high average speed due to other factors 11
compensated for delays from turning vehicles. 12
● The fastest sections all had mid-block bus stops, while the slowest had a mix of 13
configurations. 14
● Roadway construction occurred in one of the slowest and one of the fastest route 15
sections. 16
17
For the southbound route, there were slight differences in the characteristics of the five 18
fastest route sections and the five slowest route sections that when combined, this may explain 19
their differing speeds. The slowest route sections had the following characteristics, compared to 20
the fastest sections: 21
● More vehicles obstructing the dedicated bus lane in sections where it existed (an average 22
of 6.8 cars and trucks combined per section compared to 4.0 cars and trucks combined for 23
the fastest sections) 24
● A slightly higher number of mixed traffic lanes: two of the slowest speed segments had 25
mixed traffic lanes, as opposed to just one mixed traffic lane segment among the fastest 26
speed sections. 27
● A higher incidence of construction impacting the roadway (80 percent of the slowest 28
speed sections had construction interference, versus only 40 percent of the highest speed 29
sections) 30
● A smaller number of far side bus stops (a single far side stop among the slowest speed 31
sections, versus three far side stops among the fastest speed sections; the remainder of 32
stops were in mid-block or near side locations) 33
34
Surprisingly, for the southbound route, the fastest and slowest southbound route sections 35
also had similar numbers of right turns and similar intersection density levels. 36
37
Attributes of the five route segments with the overall slowest speeds are discussed below: 38
39
1. Southbound, Wall Street to South Ferry: 40
This is the last segment of the route, where the bus operates in mixed traffic. The bus 41
runs south on Water Street, which has only one vehicle lane in each direction, so 42
congestion could occur relatively easily. During the ride checks, traffic conditions varied 43
between congested and free-flowing in this segment. The bus route has several turns in 44
this segment, including a left turn into the South Ferry terminal. During one of the ride 45
checks, a significant delay occurred at this point due to heavy pedestrian and vehicle 46
Hess and Rube 16
traffic. 1
2
2. Southbound, 42nd Street to 34th Street: 3
This segment of the bus route was congested or experiencing gridlock in its vehicle lanes 4
during the ride checks. There were relatively high numbers of vehicles in the curbside 5
bus lane (3.5 cars and 5 trucks on average), which forced the bus to deviate into slow-6
moving mixed traffic. 42nd Street and 34th Street also have mid-block bus stations, 7
which can be less efficient than far-side bus stops. 8
9
3. Northbound, 23rd Street to 28th Street: 10
This short segment was free-flowing when observed during ride checks. It is 11
characterized by an offset bus lane, three driveways, and three intersections allowing 12
right turns. The bus lane was observed to be unobstructed, and the stop at 28th Street 13
features a bus bulb which should allow efficient passenger boarding and alighting. 14
Further investigation is needed to understand why this section has one of the slowest 15
average bus speeds. 16
17
4. Northbound, Grand Street to 1st Street: 18
This segment was frequently congested when observed, and without a bus lane, buses are 19
delayed by traffic conditions. With five intersections allowing right turns, turning 20
vehicles could be a source of delay, although no right turns were observed during the ride 21
checks. Construction along the right-of-way also contributes to slow traffic. 22
23
5. Northbound, Wall Street to Fulton Street: 24
This segment was frequently congested when observed, with double-parked vehicles 25
slowing traffic. With no dedicated bus lane, buses are subject to these delays. The mid-26
block configuration of bus stops did not appear to hinder operation. 27
28
CONCLUSIONS 29 Speeds on the SBS M15 route vary widely depending on the characteristics of the route section 30
and the behavior of other vehicles on the roadway. Several factors appear to contribute to 31
differences between the high and low speed sections of the SBS M15 route, including: 32
33
1. Presence of a dedicated bus lane: For the northbound route in particular, the presence of 34
a dedicated bus lane was associated with higher speed segments. On the southbound 35
route, there was construction present in so many of the dedicated lane sections that the 36
bus frequently was forced to operate in mixed traffic, making this association more 37
problematic, although there was a higher number of mixed traffic segments among the 38
slowest speed southbound sections than the fastest speed segments. 39
40
2. Roadway construction interfering with the bus lane and traffic conditions: As mentioned 41
previously, the southbound route includes a significant amount of roadway construction. 42
The slowest route sections were associated with the presence of construction, since it 43
contributes to blocking the dedicated bus lane, increasing congestion in mixed traffic 44
conditions, or potentially encouraging more cars and trucks to deviate into the bus lane to 45
avoid congestion. There is very little roadway construction happening along the 46
Hess and Rube 17
northbound route, so this was less of a factor in that direction. 1
2
3. Presence of cars and/or trucks illegally occupying the dedicated bus lane: For the 3
southbound route, the highest speed locations had fewer cars and trucks blocking the 4
dedicated bus lane than did the slowest route sections (4.0 versus 6.8 cars and trucks per 5
section on average). On the northbound route, the fastest route sections had very low 6
numbers of cars and trucks blocking the dedicated bus lane (2.2 cars and trucks per 7
section). When buses need to merge into mixed traffic to avoid obstructions in a 8
dedicated bus lane, it can cause significant delays. 9
10
4. Intersection Density: A slightly higher number of intersections per mile was associated 11
with the slowest speed route sections, compared to the fastest sections, although the 12
difference was quite small. This is to be expected, as time spent at traffic signals 13
contributes to bus delay. 14
15
Several of the other issues observed during the ride checks had inconclusive evidence of 16
impact on bus speeds, including bus stop location and the number of right turns observed. 17
Further investigation, particularly a more in-depth analysis of right-turn volumes at intersections 18
along the route, would be helpful. In addition, having access to additional traffic data, such as 19
average Level of Service of traffic conditions along the route could help to provide context for 20
bus delays and speeds. 21
22
Other Observations Potentially Impacting Bus Speeds 23
During the ride checks, several other issues were observed that could impact bus speeds, 24
including: 25
● In places, faded terra cotta red paint makes it difficult to recognize the presence of the 26
bus lane. 27
● Confusion and potential problems related to the fare prepayment machines: Several bus 28
customers at South Ferry paid onboard with their MetroCards; at other stops two 29
passengers boarded without prepaying and stated that they could not get the machines to 30
work for them. The driver personally assisted one passenger with the curbside machine. 31
32
Recommendations 33
Research on the challenges to implementing successful Bus Rapid Transit systems 34
highlights several barriers to implementation, including underestimating the effort required for 35
implementation and politicians’ desires for quick wins, which can sometimes compromise the 36
quality of the product (8). While the M15 SBS has realized significant improvements in travel 37
times, the presence of route sections where speeds are only 3.5-6 miles an hour indicates that the 38
line is not living up to its full potential. In addition, average speeds for the route are only in the 39
6-11.5 mph range, while physically segregated lanes can reach speeds of 30 miles per hour (10). 40
There has been a desire in New York City to implement the SBS system very quickly, 41
which may have forestalled important but challenging considerations, such as the needs for 42
physically segregated bus lanes and to compensate for planned roadway construction impacts on 43
service. 44
Moving forward, further investigation of the slowest sections of the M15 SBS should be 45
conducted, including longer term observation of bus lane obstructions, right turn volumes, 46
Hess and Rube 18
boarding and alighting at stops, construction, and other factors that could compromise speeds. 1
Based on this initial research, some options to improve bus speeds along the route, targeted to 2
slow speed locations, are: 3
● Exploring opportunities for a dedicated bus lane south of Houston Street, even if the 4
route must be diverted slightly from its current configuration 5
● Creating a plan to minimize impacts of roadway construction on bus speeds 6
● Considering ways to better separate and differentiate the dedicated bus lane to minimize 7
car and truck obstructions. NYCDOT and MTA should study the traffic impacts of 8
having a dedicated bus lane during all days and times (except potentially 12am-6am, to 9
facilitate night deliveries). Some physical separation that would still allow trucks access 10
to the lane when necessary, such as roadway bumps, or allowing access only at 11
intersections, could help to minimize violations. 12
● In absence of solutions to better physically segregate the bus lane from other traffic, 13
NYCDOT and MTA should work with the New York Police Department to increase 14
round-the-clock enforcement and towing in route segments that consistently have the 15
highest number of bus lane violators. 16
17
Future Research 18
In addition to expanding the observations and data analysis for the M15 SBS route as 19
discussed above, NYCDOT and MTA should perform similar analysis on other SBS routes to 20
identify slow-moving route segments in need of improvements. Additional data gathered from 21
other SBS routes would also allow for cross-analysis of the factors that most contribute to slow 22
SBS performance. Finally, NYCDOT and MTA should investigate options to physically separate 23
the M15 SBS line from other traffic, and perform a cost-benefit analysis of the most feasible 24
physical segregation solutions to evaluate those opportunities for the future.25
Hess and Rube 19
REFERENCES 1 1. Metropolitan Transportation Authority (MTA) website. Select Bus Service. 2
http://web.mta.info/mta/planning/sbs/ Accessed April 26, 2015. 3
2. Select Bus Service Report. Metropolitan Transportation Authority and New York City 4
Department of Transportation. http://www.nyc.gov/html/dot/downloads/pdf/nyc-dot-select-bus-5
service-report.pdf Accessed March 20, 2015. 6
3. Metropolitan Transportation Authority (MTA) website. M15 First/Second Avenues SBS. 7
http://web.mta.info/mta/planning/sbs/2ave.html Accessed April 16, 2015. 8
4. Levinson, Herbert S., Samuel Zimmerman, Jennifer Clinger, and C. Scott Rutherford. Bus 9
Rapid Transit: An Overview. http://www.nctr.usf.edu/wp-content/uploads/2010/03/JPT-5-21-10
Levinson.pdf Accessed April 26, 2015. 11
5. Transportation Research Board of the National Academies. Transit Cooperative Research 12
Program Report 118: Bus Rapid Transit Practitioner’s Guide. 2007. 13
6. Gardner, Kevin; Tim Melhuish, David McKenna, and Thomas Rice. The Benefits of Bus 14
Priority within the Central London Congestion Charging Zone. Association for European 15
Transport web site, 2006. http://abstracts.aetransport.org/paper/download/id/2379 Accessed 16
March 16, 2015. 17
7. Patankar, V., R. Kumar, and G. Tiwari. Impacts of Bus Rapid Transit Lanes on Traffic and 18
Commuter Mobility. Journal of Urban Planning and Development, Vol. 133(2), 99–106, 2007. 19
8. Lindau, da Silva, Monteiro, Petzhold, Facchini. BRT and bus priority corridors including 20
BHLS: a global overview. Transportation Research Board 94th Annual Meeting, 2015. 21
9. Currie, Graham and Alexa Delbosc. Assessing Bus Rapid Transit system performance in 22
Australasia. Research in Transportation Economics, Vol. 48, 142-151, 2014. 23
10. Weinzimmer, David. The Immediate Performance Impacts of Implementing Select Bus 24
Service at New York City Transit: A Case Study of the Bx41 Route. February 19, 2014. 25
University of California, Berkeley. http://davidweinzimmer.com/Final_SBS_Bx41_Study.pdf 26
Accessed April 29, 2015. 27
11. Gouge, Taylor R, Eric Beaton, Evan Bialostozky, Patrick Dougherty, and Theodore V Orosz. 28
Designing the Modern Multi-Modal Urban Arterial: A Case Study of the Webster Avenue Bus 29
Rapid Transit Project. Transportation Research Board 94th Annual Meeting, 2015. 30
12. Safran, Jeremy. The Impact of Bus Lanes on the Moving Speed of Buses Relative to General 31
Traffic. Unpublished study, 2013. 32
13. Scorcia, Harvey. Design and Evaluation of BRT and Limited-Stop Services. Massachusetts 33
Institute of Technology, June 2010. http://dspace.mit.edu/handle/1721.1/60812 Accessed April 34
14, 2015. 35
14. Surprenant-Legault, Julien and Ahmed M. El-Geneidy. Introduction of reserved bus lane: 36
Impact on bus running time and on-time performance. Transportation Research Board, October 37
2010. 38
15. Diab, Ehab I; El-Geneidy, Ahmed M. Understanding the Impacts of a Combination of 39
Service Improvement Strategies on Bus Running Time and Passengers’ Perception. 40
Transportation Research Part A, 40, 614-625, 2012. 41
16. Mahendra, Anjali and Jeffrey Ang-Olson. Cost/Benefit Analysis of Converting a Mixed 42
Traffic Roadway Lane for Bus Rapid Transit. Transportation Research Board 2012 Annual 43
Meeting. 44
17. Butcher, Louise. Buses: Bus Lanes and Priority Measures. UK Parliament web site. 45
http://www.parliament.uk/briefing-papers/SN00032.pdf Accessed March 14, 2015. 46
Hess and Rube 20
18. Greater Manchester Passenger Transport Authority. Quality Bus Corridors in Greater 1
Manchester: Best Practice Guidelines. GMPTE web site, 2007. 2
http://www.tfgm.com/buses/Documents/QBC_Guidelines_270808.pdf Accessed March 15 2015. 3
19. Kiesling, Michael and Matthew Ridgway. Effective Bus-Only Lanes. ITE Journal, Vol. 76, 4
Issue 7, 24-29, 2006. 5
20. Wang, Rui, Fumihiko Nakamura, Toshiyuki Okamura, and Shinji Tanaka. Analyzing the 6
Impact of Illegal Parking on Performance of Arterial Curbside Bus-Only Lanes: Utilizing Bus 7
Camera Data. Transportation Research Board 92nd Annual Meeting, Paper 13-1146, 2013. 8
21. Beaton, Eric, Jeremy Safran, and Robert Thompson. Factors Contributing to Bus Lane 9
Obstruction and Usage in NYC: Does Design Matter? Transportation Research Board website, 10
2014. http://trid.trb.org/view.aspx?id=1288446 Accessed March 12, 2015. 11
22. Boll, Christopher Michael. Congestion protection for public transportation: strategies and 12
application to MBTA bus route 66 Civil Engineering Master's Thesis, Paper 4, (2008). 13
http://hdl.handle.net/2047/d1001858x Accessed March 12, 2015. 14
23. Select Bus Service on First and Second Avenues: Progress Report. Metropolitan 15
Transportation Authority and New York City Department of Transportation. 16
http://www.nyc.gov/html/brt/downloads/pdf//201111_1st2nd_progress_report.pdf Accessed 17
March 20, 2015. 18
24. Rivoli, Dan. MTA bus ridership plummeting, statistics show. AM New York, May 17, 2015. 19
25. Diaz, Roderick B., ed. Characteristics of Bus Rapid Transit for Decision-Making. FTA web 20
site, August 2004. http://www.fta.dot.gov/documents/CBRT.pdf Accessed March 12, 2015. 21