henry schein 2003annualreport
TRANSCRIPT

ONEWORLD. ONECOMPANY. ONETEAM.
2003 Annual Report

Henry Schein, Inc.
ABOUTHENRYSCHEIN
Henry Schein, Inc., a FORTUNE 500® company, is the largest distributor ofhealthcare products and services to office-based healthcare practitioners in thecombined North American and European markets. The Company's salesreached a record $3.4 billion in 2003.
Recognized for its excellent customer service and highly competitive prices, Henry Schein’s four business groups—Dental, Medical, International, andTechnology—serve more than 425,000 customers worldwide. Its customersinclude:
� Approximately 75% of the estimated 135,000 U.S. and Canadian office-based dental practices and 15,000 dental laboratories;
� Over 45% of the estimated 230,000 U.S. office-based physician practices,as well as surgical centers and other alternate-care sites;
� Over 70% of the estimated 24,000 U.S. veterinary clinics;
� Approximately 170,000 office-based dental, medical, and veterinary practicesoverseas, primarily in Western Europe, Australia, and New Zealand; and
� Government and other institutions providing healthcare services.
Henry Schein operates through a centralized and automated distributionnetwork that serves customers in more than 125 countries. The Companyoffers a comprehensive selection of over 90,000 national and Henry Schein private-brand products.
Henry Schein also offers a wide range of innovative value-added practicesolutions, including such leading practice-management software systems asDENTRIX® and Easy Dental® for dental practices, and AVIMark® for veterinaryclinics, which were installed in over 50,000 practices; and ARUBA®, HenrySchein's electronic catalog and ordering system.
With headquarters in Melville, N.Y., Henry Schein employs nearly 8,000people in 16 countries.
3,35
3.8
2,55
8.2
2,38
1.7
2,28
4.5
$ 3,000
$ 2,500
$ 2,000
$ 1,500
$ 1,000
$ 500
099 00 01 02 03
2,82
5.0
$ 3,500 7.0
7%
6%
5%
4%
3%
2%
1%
099 00 01 02 03
5.8
5.4
5.2
6.9
3.09
2.59
$ 2.50
$ 2.00
$ 1.50
$ 1.00
$ .50
099 00 01 02 03
2.01
1.67
1.44
$ 3.00
$ 3.50 35%
30%
25%
20%
15%
10%
5%
099 00 01 02 03
34.1
22.0 23
.5
27.2
34.0
128,
843
134,
669
$ 200
$ 150
$ 100
$ 50
$ 25
099 00 01 02 03
56,4
93
152,
994
190,
911
NET SALES OPERATING EARNINGS PER DILUTED SHARE RETURN ON OPERATING CASH FLOW MARGIN FROM CONTINUING OPERATIONS COMMITTED CAPITAL FROM CONTINUING OPERATIONS
($ in millions) (in dollars) ($ in thousands)
Note: Operating Margin and Earnings Per Diluted Share from Continuing Operations have been adjusted to exclude certain one-time items. See “Reconciliation of CertainOperating Results” on page 15. Return on Committed Capital represents operating income over average committed capital (committed capital equals inventory plus tradeaccounts receivables and net property, plant, and equipment less trade accounts payables).


To our Shareholders,
One world of healthcare customers is emerging, and Henry
Schein is ideally positioned as one company to take
advantage of the opportunity this presents, with nearly
8,000 Team Schein Members working together to serve a
growing base of more than 425,000 customers.
One World – We are strategically positioned to serve dental, medical and veterinaryoffice-based practitioners who have many shared needs. Many of these healthcareproviders serve an increasingly affluent and insured patient base, are benefiting fromsignificant demographic changes, and are using clinical and technological advancesin healthcare. Regardless of their country, these practitioners share a common goal:to operate a practice that is as efficient and profitable as possible while providing ahigh quality of care.
One Company – As this global healthcare market emerges, there is a tremendousopportunity for us to meet the needs of office-based practitioners in multiplecountries. Henry Schein has the strategic commitment and infrastructure to do so, andwe have proven our success in the dental, medical and veterinary markets, both in theUnited States and abroad. Our international presence provides us with significanteconomies of scale. As such, we are uniquely positioned to add value to ourcustomers through the sharing of best practices and operational efficiencies.
One Team – For one company to meet this challenge, all employees must work together seamlessly as a team. We have kept pace with our quickly changing world through internal growth and by successfully integrating a number of strategicacquisitions. Throughout this process, we retain our unique and powerful culture,with all Team Schein Members dedicated to delivering the best possible customer service.
One World. One Company. One Team. This was the opportunity we saw, and we madethe most of it—posting record 2003 financial results,and for the first time, entering the FORTUNE 500® listof America’s largest publicly traded companies.
Henry Schein, Inc.
SHAREHOLDERSLETTER
2
FORTUNE is a registeredtrademark of FORTUNE Magazine, a division of Time Inc.

3
2003 FINANCIAL RESULTS AND HIGHLIGHTSDuring 2003 we posted record net sales of $3.4 billion, an increase of 19% from2002. In local currencies, our sales rose 15%, including 13% internal growth. Salesfor our Dental Group in 2003 were a record $1.4 billion. This represents an 11%increase over 2002, or 10% in local currencies, of which 8% was internally generated.Our Medical Group posted record sales for 2003 of $1.3 billion, 22% higher than2002, with internal growth accounting for 21%. For 2003, record International saleswere $577 million, growing by 32% in U.S. dollars and 13% in local currencies overlast year, with 7% internally generated. And last, Technology and Value-AddedServices sales for 2003 were a record $74 million, a growth of 11% over 2002,substantially all of which was internally generated.
Net income from continuing operations for the year was $139.5 million, up 18% (20%on a comparable basis) compared with 2002, and earnings per diluted share fromcontinuing operations were $3.10, up 18% (19% on a comparable basis) over theprior year.
In 2003 we achieved impressive growth and gainedmarket share in each of our four business Groups, butthese financial results are just part of the story in a yearmarked by progress across a number of initiatives.
Strategic acquisitions – We completed severalstrategic acquisitions in 2003, including ColonialSurgical, Hager Dental, American Medical Servicesand Damer & Cartwright. We also began the processof acquiring three of Europe’s leading dentaldistributors—with our pending acquisitions ofdemedis GmbH, KRUGG S.p.A., and DentalMVGmbH (Muller & Weygandt).
Vaccines and injectables – This growing productcategory contributed to our success in 2003, as weshipped more than 20 million doses of influenzavaccine during the U.S. flu season. We also signednew agreements that added important products toour offering. For example, as part of our growingHenry Schein Rx Services, we now distributeRemicade, Centocor’s intravenous infusion therapyfor treating rheumatoid arthritis and Crohn’s disease,to physician offices across the United States.
Corporate responsibility – Through broad-based programs supported by HenrySchein Cares, we demonstrated our commitment to corporate responsibility moreclearly and strongly than ever before, including our continuing commitment to theAmerican Dental Association’s “Give Kids a SmileSM” Day and the Institute for Diversityin Leadership. In addition, in support of the U.S. Centers for Disease Control andPrevention’s (CDC) national education campaign and immunization initiative, HenrySchein donated flu vaccine to CDC selected sites across the country.
Corporate governance – In 2003, we increased the size of our Board of Directorsby adding two valuable new independent members: Louis W. Sullivan, M.D., formerU.S. Secretary of Health and Human Services, and the founding Dean, Director, andPresident Emeritus of the Morehouse School of Medicine in Atlanta; and Margaret A.Hamburg, M.D., former Assistant Secretary for Planning and Evaluation, U.S.Department for Health and Human Services, and former Commissioner of Health forthe City of New York.
OUR FUTURE LOOKS BRIGHT2003 was a banner year for Henry Schein, but for a number of reasons I am confidentthat our best years are yet to come.
We serve attractive markets. The population of the geographies we serve is aging,and the market to serve their healthcare needs is growing.
We have powerful strengths to build upon. Henry Schein has unique sales andmarketing expertise, a world-class centralized infrastructure, and a broad productoffering at highly competitive prices. We are committed to providing superiorcustomer service, and have a large user base of practice management software.
We have clear growth strategies. We are dedicated to further transitioning ourbusiness from being a pure distributor of products to becoming a provider ofintegrated products and services. To achieve this we will expand our offering of value-added products and services, and continue to further build customer loyalty byproviding critical practice-enhancing tools. We will expand Privileges™, our highlysuccessful customer loyalty program for dental customers, and offer a portfolio ofexclusive and semi-exclusive products. We will also grow our customer base byincreasing the number and productivity of our field sales consultants and by using ourextensive customer database to focus our marketing efforts.
Another important growth strategy is to continue pursuing complementary initiativesto accelerate future growth in sales and operating income. To achieve this we will
continue to develop our high-growth dentalspecialty business and implement our Henry ScheinRx Services plan, adding new vaccines, injectablesand related services to our medical offering. In addition, we will continue to pursue strategicacquisitions, selectively capitalizing on consolidationopportunities to increase sales, and our force of fieldsales consultants, equipment sales specialists, andequipment service technicians. We will also seekacquisition opportunities that improve our productoffering by providing us with greater expertise in a particular product category, enhancing ourprocurement leverage, or adding new product lines.
We have clear priorities to help reach our goals.To achieve success, we are committed to attracting,training and retaining highly qualified and motivatedpeople. We will continue to gather and analyzeinformation to help us better understand and serveour customers. And we will make investments intechnology to expand our e-commerce and othersystems capabilities as we institutionalize best-practices on a company-wide basis.
ONE WORLD, ONE COMPANY, ONE TEAM – HENRY SCHEINWe are confident that our growth strategies will continue to support and enhancepartnerships with our current and future customers, helping practitioners to improvetheir practice efficiency and profitability, while delivering the highest quality care.
Finally, we will work to further diversity within the healthcare industry, with the goal ofincreasing access to care as it affects professionals and their patients in underservedcommunities. As part of this commitment, we will endeavor to ensure that TeamSchein reflects the cultural diversity of our customer base, and support programs thatenhance this diversity, thereby helping our customers better serve their patients.
One world of customers looking to one company to serve their needs, and one teamrising to meet this challenge. This is our vision for the future of Henry Schein.
Sincerely,
Stanley M. BergmanChairman, Chief Executive Officer and President
ONEWORLD.ONECOMPANY. ONETEAM.
SHAREHOLDERSLETTER
2003 was a banneryear for
Henry Schein...for a number ofreasons I am
confident that ourbest years are yet to come.

Henry Schein, Inc.
ONEWORLD.
4
Henry Schein serves an increasingly diverse customer
base of dentists, physicians, and veterinarians who seek
to operate efficient and profitable practices as they deliver
high quality healthcare.
Sullivan-Schein Representatives—including Field Sales Consultants, Design Professionals, Equipment Sales Specialists and Equipment Service Technicians—work together seamlessly with
our dental customers to design, create and support aesthetically pleasing offices that optimize work flow and space utilization, maximize practice efficiency, and enable dental teams
to focus on delivering the high quality care.

The markets we serve are thriving, as an
aging population uses more healthcare
services each year. For example, life
expectancy in the United States is now
77.2 years, up from 75.4 years in 1990.
And the population over 45 years old is
expected to increase by 42% by 2020,
and by 58% by 2030.
Practice trends also bode well for Henry
Schein. Expenditures on dental services
are expected to rise steadily. There is an
increasing recognition of the correlation
between oral health and overall well-
being, and in many countries there is an
increase in dental insurance coverage
for patients and a greater emphasis on
cosmetic dentistry. Dental pharmaceutical
therapies and noninvasive diagnostic
procedures are on the rise, and with fewer dentists to meet
increasing demand, dental practice productivity will be more
important.
In the medical arena, expenditures on physician and clinical
services are also expected to increase. Procedures continue
to migrate from acute-care settings to less costly physician
offices and alternate-care sites. Technological advances are
enhancing medical practices, and our customers are becoming
more frequent prescribers and dispensers of specialty
pharmaceutical products. In addition,
there is continued growth in the use of
injectables and diagnostic tests, and
new vaccines for adults are being
developed.
As a result, Henry Schein’s future holds
great promise. Throughout the years
the healthcare market has shown
growth in both strong and weak
economic times. And because we work
in highly fragmented markets, there are
still opportunities for further industry
consolidation and continued growth.
We are well positioned to capitalize
on these trends, and provide our
customers with an ever-increasing array
of value-added products and services.
Beyond the United States and Canada,
we serve approximately 170,000 customers. We have
operations in 14 countries outside of North America, primarily
in Western Europe, Australia and New Zealand, and typically
enjoy a leadership position in these countries. We also serve
healthcare practitioners in 125 countries through Schein Direct™,
which provides rapid door-to-door air package delivery.
In a world that is progressively more complex and diverse, Henry
Schein is there to meet the needs of our customers.
ONEWORLD.ONECOMPANY. ONETEAM.
ONEWORLD
The markets we serve are
thriving, as an aging
population uses more
healthcare services each year.
5

Henry Schein is a model of one company that is
strategically positioned to meet the needs of office-based
practitioners in many countries around the world.
The core of our success lies in our strengths, beginning
with a strong brand identity that is rooted in 72 years of
healthcare distribution experience. We reach healthcare
practitioners through the sales and marketing expertise
of 1,550 field sales consultants, equipment sales
specialists, and more than 875 telesales representatives.
In 2003, we supported their efforts by delivering more
than 31 million targeted direct marketing pieces to over
650,000 healthcare practitioners.
Henry Schein, Inc.
ONECOMPANY.
6
Henry Schein offers a comprehensive selection of over 90,000products, including an array of over 8,000 Henry Schein private
brand products. We update our product offerings regularly to meet our customers’ changing needs.
Our customers know they can order from Henry Schein 24/7 viatelephone, fax, CD-ROM, and the Internet. In 2003, Henry Schein’s
Internet sales increased 63% over the previous year.

A steadfast commitment to superior
customer service distinguishes Henry
Schein from our competitors.
Customers can order from us 24/7 via
telephone, fax, CD-ROM and the
Internet, and they are increasingly
doing so: our Internet sales increased
63% during 2003 compared with 2002.
But order placement is just the
beginning of customer satisfaction. We
ship nearly nine million orders to our
customers each year. In the U.S. and
Canadian markets, 99% of our orders
are shipped the same day the order
is placed, are delivered within two
days of placement, and are shipped
with virtually 100% accuracy. In the
countries we serve beyond the United
States and Canada, our statistics for efficiency and accuracy are
also impressive. To support our customers’ dental equipment
service needs, we have nearly 800 highly qualified dental
Equipment Service Technicians operating out of 121 locations
throughout the world.
In addition to offering in-office installation and repair services for
large dental equipment, we also offer rapid turn-around services
for dental handpieces and dental, medical and veterinary small
equipment and sterilizers through our ProRepair® division. With
operations across the United States and abroad, we believe
ProRepair® is the leading handpiece and small equipment repair
service to office-based practitioners in the world.
Henry Schein’s centralized infrastructure and supply chain is
another pillar of our superior customer service. We have more
than 2.1 million square feet of distribution space at 15
strategically located distribution centers in North America,
Europe and Australia. Important capital
investments in this highly efficient
infrastructure—in inventory management
technology, special capabilities such as
cold-chain distribution, and information
technology— help ensure that we remain
an industry leader.
We are a single source for virtually all of
our customers’ practice needs, with a
broad offering of products and services
at highly competitive prices. This
includes more than 90,000 SKUs in North
America, 75,000 SKUs in Europe and
8,000 Henry Schein private brand SKUs.
Another important strength is our large
installed user base of practice-
management software. More than
44,000 installed DENTRIX® and Easy
Dental® systems and over 6,000 installed AVIMark® systems
provide us with opportunities to cross-sell our core distribution
offering, sell add-on products and services, and strengthen our
customer relationships by providing critical tools for managing
their businesses more efficiently and profitably. An independent
dental products research laboratory has recognized DENTRIX®
as being first in customer satisfaction, with the fastest growing
user-base, and as having superior clinical features.
In addition, Henry Schein’s Web site was recognized during
2003 as leading the industry in customer satisfaction.
By bringing these significant strengths to bear, Henry Schein has
emerged as a company well positioned to meet the needs of
office-based healthcare practitioners in many countries around
the world.
ONECOMPANY
A steadfast commitment
to superior customer service
distinguishes
Henry Schein from
our competitors.
7ONEWORLD.ONECOMPANY. ONETEAM.
DENTRIX®’s proprietary DDO (Digital Dental Office)technology provides seamless integration of all
information that drives a practice. In 2003, DENTRIX®
was ranked by an independent dental productsresearch laboratory as being first in customer
satisfaction, with the fastest growing user base, and superior clinical features.

Throughout North America and in 14 other countries,nearly 8,000 dedicated individuals are working togetheras one team—Team Schein—to deliver the bestpossible customer service.
Team Schein Members contribute to and are influencedby the unique and powerful culture of Henry Schein, avalues-based company that engenders an atmosphere ofmutual respect and cooperation. Mutual responsibility,ethical behavior, creativity, and open communications arethe guiding principles of Henry Schein. Each person isa spoke in the Team Schein “Wheel of Success,” and thecontribution of each Team Schein Member is valued asintegral toward reaching our goals. And through aremarkable period of organic growth and strategicacquisitions, we have been able to retain thisdistinguishing culture.
Henry Schein, Inc.
ONETEAM.
8
CUSTOMERFOCUS TEAM
SCHEINCULTURE
FLEXIBLE GAME PLAN
FOSTERCREATIVECHANGEMAXIMUM
EFFICIENCYFOR OPTIMUM
QUALITY
“THEBOTTOM
LINE”
MONETARYRESOURCES COMMUNICATION
COMPETITIVEBENCHMARKING
Our commitment to corporate responsibility is put into action through Henry Schein Cares, which provides resources to help narrow the disparity in the delivery of healthcare
information and services in underserved communities in the United States and abroad.

Part of the Team Schein culture is a
commitment to education and training, as
exemplified by our Dental Career
Development programs and Sullivan-
Schein University (SSU). Intensive sales
training sessions, product demonstrations
and training on proprietary sales tools
equip our sales force with the knowledge
they need to succeed. Our online
learning tool includes over 60 vendor
training and 30 career development
modules that enable individuals to learn
at their own pace. Graduates of our
Career Development programs are now
counseling dental practices on
marketing, effective scheduling, practice
management and problem solving.
Henry Schein is committed to
enhancing diversity and inclusiveness
within the healthcare industry, leading to improved access to
care for people in underserved communities. To this end, we are
a corporate sponsor of the American Dental Association’s
Diversity in Leadership initiative, and are working closely to
create a diversity leadership institute for the dental profession.
We recently partnered with the New York State Dental
Association to host the first Diversity Meeting and Educational
Seminar in New York. We provide financial and logistical support
to the Hispanic Dental Association, Indian Health Services
clinics, National Dental Association, Medical Education for South
African Blacks and many other groups that enhance diversity in
the healthcare professions. We also sponsor dozens of
healthcare outreach programs within the United States and in
developing countries.
Another aspect of Team Schein’s culture is our commitment
to corporate responsibility, which we put into action through
Henry Schein Cares. The mission of
Henry Schein Cares is to assist in
narrowing the disparity of healthcare
services and information in underserved
communities, both in the United States
and abroad, by providing resources to
support the programs of community-
based healthcare professionals and their
organizations. We achieve this by making
product donations and cash awards,
supporting programs for the under-
served, volunteering our time, delivering
healthcare information, partnering with
other organizations and enhancing the
quality of life for Team Schein Members.
Through Henry Schein Cares, we
donated influenza vaccine to expand
the scope of two Centers for Disease
Control and Prevention programs,
vaccinating thousands of additional underserved people in 19
U.S. cities and the Mississippi Delta who might otherwise have
gone unvaccinated. We also have served as the exclusive
distributor of professional products for the American Dental
Association’s “Give Kids a Smile” Day for the past two years. In
the program’s second year, we recruited 51 vendor partners and
helped over 35,000 dental team volunteers treat underserved
children in the United States free of charge. On this day, an
estimated one million children received care valued at
approximately $100 million in “Give Kids a Smile” events
nationwide.
Mutual respect, extensive experience, unwavering commitment,
and a sense of caring and responsibility are just some of the
hallmark qualities of Team Schein.
ONEWORLD.ONECOMPANY. ONETEAM.
ONETEAM
Mutual responsibility, ethical
behavior, creativity, and open
communications are the
guiding principles of
Henry Schein.
9
Among our many Henry Schein Cares activities in 2003 were the American Dental Association’s “Give Kids a Smile” Day, which treated more than one million underserved children in the United States
free of charge, and our annual Back-to-School Program, which provided underprivileged children with a backpack filled with school supplies and clothing for their first day of school.

10 Henry Schein, Inc.
ATAGLANCE
DENTALGROUP MEDICALGROUP
In 2003 the Dental Group recorded sales of $1.4 billion, 41% oftotal Company revenues, which represents growth of 11% over2002, including 9% growth in consumable merchandise salesand 18% growth in equipment sales and service revenue.
The Dental Group includes Sullivan-Schein Dental in the UnitedStates, Henry Schein Arcona in Canada, and the Zahn Dentallaboratory supply business, and has approximately 30% share ofthe estimated $4.4 billion U.S. and Canadian dental distributionmarket. We serve over 75% of the estimated 135,000 U.S. andCanadian dental practices, and approximately 15,000 dentallaboratories. We are also a major supplier to large grouppractices, schools, government and other institutions.
The Group includes more than 900 field sales consultants(including equipment sales specialists), nearly 600 equipmentservice technicians, and 84 equipment sales and servicecenters. Counseling the Group from the dental practitioners’perspective is a Dental Advisory Board that includes manyleaders of the profession.
We support dentists by offering more than 70,000 SKUs,including many Henry Schein exclusives, such as Oral CDx®,BriteSmile-To-Go™, Debacterol®, X-Rite’s ShadeVision™,BruxGuard™, Norad®, Titan Instruments and Pentron® dentallaboratory products.
We also provide dentists with several important technology-based value-added services, including our DENTRIX® and EasyDental® practice-management software systems, financialservices, continuing education and dental electronic claimsprocessing. PRIVILEGES™, our highly successful and innovativecustomer loyalty program helps us attract, retain and rewardcustomers, and provides us with a platform to introduce our otherproducts to our customers. By the end of 2003, PRIVILEGES™
had enrolled more than 16,000 members, and these membersare increasing their business with Henry Schein at a rate farabove that of our average customer.
The Medical Group posted record sales of $1.3 billion in 2003,22% higher than the previous year, representing 40% of totalCompany revenues.
Henry Schein’s Medical Group serves over 45% of the estimated230,000 U.S. office-based physician practices and hasapproximately 16% of the estimated $7.1 billion market. We offerover 30,000 SKUs to the physician marketplace through threeprimary brands: Henry Schein Medical, which offers a fullportfolio of products and services to all 50 states through morethan 230 telesales representatives; Caligor, with more than 350field sales consultants in 41 states offering a similar portfolio ofproducts and services; and General Injectables and Vaccines(GIV), whose more than 40 telesales representatives specialize invaccines and other injectables and serve practitioners across thenation. This Group also ships over 25% of the U.S. doses for theVaccine for Children’s (VFC) program, and over 25% of the U.S.influenza vaccine supply to physicians.
During 2003, the Company also acquired Damer & Cartwright, aspecialty distributor of pharmaceuticals focused on oncology,infertility, hepatitis, transplant and respiratory disease states, andAmerican Medical Services, a distributor of oncology drugs.
The Medical Group also serves institutions, surgical centers,alternate-care facilities and acute-care facilities in the northeastUnited States, as well as over 70% of the estimated 24,000 U.S.veterinary clinics. Offering more than 40,000 SKUs to ourveterinary customers, we are a primary vendor to VCA Antech, thelargest provider of clinical petcare in the country.
We are a major supplier to the formulary plans of manyprofessional groups, such as the American Medical Associationand the American Society of Plastic Surgeons. Already a leadingprovider of vaccines, injectables and other pharmaceuticals withexpertise in cold-chain distribution, we are uniquely positioned totake advantage of the trend toward increased use of vaccinesand injectables in physicians offices and alternate-care settings.
The Medical Group receives the counsel of many leadingmedical professionals through its Medical Advisory Board, whichprovides valuable insights into practitioners’ needs.

11ONEWORLD.ONECOMPANY. ONETEAM.
ATAGLANCE
INTERNATIONALGROUP TECHNOLOGY&VALUE-ADDEDSERVICESGROUP
In 2003 the International Group posted record sales of $577million, 17% of total Company revenues, which represented 32% growth in U.S. dollars and 13% in local currencies fromthe previous year.
The year was highlighted by particular sales strength in France,Spain and Austria. The Group has an approximate 9% share ofthe Western European dental, medical and veterinary markets inwhich we operate.
The mission of the International Group is to provide best-in-classcapabilities on a Pan-European basis, offering products andservices to dental, medical and veterinary office-basedpractitioners. We offer more than 75,000 SKUs to our growingbase of 170,000 customers located in 14 countries outside ofNorth America, including Austria, Australia, Belgium, the CzechRepublic, France, Germany, Iceland, Ireland, Israel, theNetherlands, New Zealand, Portugal, Spain and the UnitedKingdom. In addition, we serve healthcare practitioners in 125countries through Schein Direct™, which provides rapid door-to-door air package delivery.
In 2003 the strategic acquisition of Hager Dental strengthened theGroup’s equipment sales and service presence in Germany andadded over 40 field sales consultants. In addition, Henry Scheinbegan the process of acquiring three of Europe’s leading dentaldistributors—with our pending acquisitions of demedis GmbH, aleading full-service distributor of dental consumables andequipment in Germany, Austria and the Benelux countries, whichwill further our strategy to be a full-service, high-value provider ofproducts and services to European dentists; KRUGG S.p.A., Italy’sleading distributor of dental consumable products, which willprovide us entrée into Europe’s second-largest dental market andfurther our Pan-European strategy; and DentalMV GmbH (Muller &Weygandt), one of Europe’s leading direct marketing distributors ofdental consumable products, which will enhance our Europeandirect marketing capabilities.
There is tremendous opportunity for Henry Schein’s expansion inEurope. Nearly 45% of Western European dental practices arenot active Henry Schein customers, and there is substantialopportunity in the Western European medical and veterinarymarkets. We are well positioned to help meet the needs ofmedical, dental and veterinary office-based practitioners in manycountries around the world.
In 2003 the Technology and Value-Added Services Groupposted record sales of $74 million, growth of 11% from theprevious year, which represented 2% of total Companyrevenues.
This Group provides leading software, technology and othervalue-added products and services to healthcare providers in thedental, medical and veterinary professions. We seek to providepractitioners with products and services that will improve practiceefficiency and profitability while enabling our customers to deliverhigh quality care.
Approximately one-third of all U.S. dental practices use ourDENTRIX® or Easy Dental® practice-management software. In2003 DENTRIX was ranked by an independent dental productsresearch laboratory as being first in customer satisfaction, withthe fastest growing user base, and superior clinical features.
Through our Digital Dental Office initiative or “DDO”, we offercustomers a suite of technologically advanced products thatseamlessly integrate imaging, clinical and financial applicationsfor the dental office.
Our AVIMark® practice-management software has been installedin over 6,000 companion animal clinics, representing more than25% of the veterinary clinics in the United States.
In addition, we provide an increasing number of value-addedservices to practitioners. We believe we are one of the dentalindustry’s largest processors of electronic claims, withapproximately 25 million processed in 2003. Through HenrySchein Financial Services, we offer low rates for equipmentleasing and financing, patient-financing options, electronic creditcard processing and lines of credit. Other services includeHenry Schein’s Continuing Education for HealthcareProfessionals program, through which participants can accessfully accredited courses on the latest healthcare technology inperson, in print or online.

12
Stanley M. BergmanChairman, Chief Executive Officer and President
Gerald A. Benjamin Executive Vice President and Chief Administrative Officer
James P. Breslawski Executive Vice President and President, Sullivan-Schein Dental
Leonard A. DavidVice President, Human Resources and Special Counsel
Stanley Komaroff, Esq.Senior Advisor
Mark E. MlotekExecutive Vice President, Business Development
Steven Paladino Executive Vice President and Chief Financial Officer
Michael RacioppiPresident, Medical Group
Michael ZackSenior Vice President, International Group
Stanley M. Bergman Chairman, Chief Executive Officer and President
Barry J. Alperin (1) (2) (3)Retired Vice Chairman, Hasbro, Inc.
Gerald A. Benjamin Executive Vice President and Chief Administrative Officer
James P. Breslawski Executive Vice President and President, Sullivan-Schein Dental
Margaret A. Hamburg, M.D. (4)Former Assistant Secretary for Planning and Evaluation, U.S. Department of Health and Human Services and Former Commissioner of Health for the City of New York
Pamela JosephDirector, MaNose Studios
Donald J. Kabat (1) (2) Retired Partner, Accenture
Philip A. Laskawy (1) (3) (4)Retired Chairman, Ernst & Young
Norman S. Matthews (2) (4)Former President, Federated Department Stores
Mark E. MlotekExecutive Vice President, Business Development
Steven Paladino Executive Vice President and Chief Financial Officer
Marvin H. Schein Founder, Schein Dental Equipment Corp.
Irving Shafran, Esq.Attorney at Law
Louis W. Sullivan, M.D. (3) (4)Former U.S. Secretary of Health and Human Servicesand Founding Dean, Director, and President Emeritus of the Morehouse School of Medicine
Henry Schein, Inc.
BOARDOFDIRECTORS
EXECUTIVEOFFICERS
DIRECTORSOFFICERS
(1) Member Audit Committee (2) Member Compensation Committee (3) Member Nominating and Governance Committee (4) Member Strategic Advisory Committee

FINANCIAL INFORMATION
Table of Contents
14 Market for Registrant’s Common Equity and Related Stockholder Matters
16 Selected Financial Data
18 Management’s Discussion and Analysis of Financial Condition and Results of Operations
30 Quantitative and Qualitative Disclosures About Market Risk
Consolidated Financial Statements:
32 Report of Independent Certified Public Accountants
33 Balance Sheets as of December 27, 2003 and December 28, 2002
34 Statements of Income for the Years Ended
December 27, 2003, December 28, 2002, and December 29, 2001
35 Statements of Changes in Stockholders’ Equity for the Years Ended
December 27, 2003, December 28, 2002, and December 29, 2001
36 Statements of Cash Flows for the Years Ended
December 27, 2003, December 28, 2002, and December 29, 2001
37 Notes to Consolidated Financial Statements
13

MARKET FOR REGISTRANT’S COMMON EQUITY AND RELATED STOCKHOLDER MATTERS
Our common stock is quoted through the NASDAQ National Market tier of the NASDAQ Stock Market under the symbol “HSIC”. Thefollowing table sets forth, for the periods indicated, the high and low reported sales prices of our common stock as reported on theNASDAQ National Market System for each quarterly period in fiscal 2003 and 2002:
High Low
Fiscal 2003:
1st Quarter $46.60 $34.17
2nd Quarter 54.15 40.89
3rd Quarter 60.32 51.50
4th Quarter 70.00 55.34
Fiscal 2002:
1st Quarter $46.11 $35.34
2nd Quarter 50.59 43.10
3rd Quarter 54.98 39.00
4th Quarter 57.73 40.30
On March 2, 2004, there were approximately 636 holders of record of our common stock. On March 2, 2004, the last reported sales pricewas $73.97.
We maintain several stock incentive plans for the benefit of certain officers, directors and employees. Certain plans are subject tostockholder approval while other plans have been authorized solely by the Board of Directors. Descriptions of these plans are describedin the notes to our consolidated financial statements. The following table summarizes information relating to the Plans as of December27, 2003:
Number of CommonShares to be Issued Upon Weighted-Average Number of CommonExercise of Outstanding Exercise Price of Shares Available for
Options and Rights Outstanding Options Future Issuances
Plans Approved by Stockholders 4,208,706 $34.12 1,986,677
Plans Not Approved by Stockholders 25,000 40.82 ––
Total 4,233,706 $34.16 1,986,677
14

Dividend Policy
We have not declared any cash dividends on our common stock during fiscal years 2003 or 2002. We currently do not anticipate declaringany cash dividends on our common stock in the foreseeable future. We intend to retain earnings to finance the expansion of our businessand for general corporate purposes, including our stock repurchase program. Any declaration of dividends will be at the discretion of ourBoard of Directors and will depend upon the earnings, financial condition, capital requirements, level of indebtedness, contractualrestrictions with respect to payment of dividends and other factors. Our revolving credit agreement, as well as the agreements governingour Senior Notes, limit the distribution of dividends without the prior written consent of the lenders.
Reconciliation of Certain Operating Results
The following table sets forth, for the periods indicated, a reconciliation of Operating income and Net income, as reported to Adjustedoperating income and Adjusted net income.
Years ended
December 27, December 28, December 29, December 30, December 25,2003 2002 2001 2000 1999
(In thousands, except per share data)
Operating income, as reported $233,719 $197,003 $147,750 $112,589 $105,765
Adjustments:
Merger, integration and restructuring (credits) costs –– (734) –– 15,024 13,467
Adjusted operating income 233,719 196,269 147,750 127,613 119,232
Adjusted operating margin 7.0% 6.9% 5.8% 5.4% 5.2%
Net income, as reported 137,510 117,987 87,373 56,749 50,312
Adjustments, net of tax:
Merger, integration and restructuring (credits) costs –– (734) –– 9,855 9,484
Gains on real estate transactions (454) (890) –– –– ––
Loss on sale of Novocol –– –– –– 1,925 ––
Loss on sale of UK Technology Business –– –– –– 1,618 ––
Loss on sale of discontinued operation - PMA Bode 2,012 –– –– –– ––
Adjusted net income $139,068 $116,363 $ 87,373 $ 70,147 $ 59,796
Earnings per diluted share:
As reported $ 3.06 $ 2.63 $ 2.01 $ 1.35 $ 1.21
Adjusted 3.09 2.59 2.01 1.67 1.44
Weighted-average diluted common shares outstanding: 44,988 44,872 43,545 42,007 41,438
15

SELECTED FINANCIAL DATAThe following selected financial data, with respect to our financial position and results of operations for each of the five years in the periodended December 27, 2003, set forth below, has been derived from our consolidated financial statements. The selected financial datapresented below should be read in conjunction with “Management’s Discussion and Analysis of Financial Condition and Results ofOperations” and our consolidated financial statements.
Years ended
December 27, December 28, December 29, December 30, December 25,2003 2002 2001 2000 1999
(In thousands, except per share data)
Statements of Operations Data:Net sales $3,353,805 $2,825,001 $2,558,243 $2,381,721 $2,284,544
Gross profit 927,194 794,904 699,324 647,901 608,596
Selling, general and administrativeexpenses 693,475 598,635 551,574 520,288 489,364
Merger, integration and restructuring (credits) costs (1) –– (734) –– 15,024 13,467
Operating income 233,719 197,003 147,750 112,589 105,765
Other expense, net (7,943) (6,574) (7,399) (16,055) (15,982)
Income before taxes on income,minority interest, equity inearnings (losses) of affiliatesand loss on sale of discontinuedoperation 225,776 190,429 140,351 96,534 89,783
Taxes on income from continuing operations (84,378) (70,510) (51,930) (36,150) (35,589)
Minority interest in net income of subsidiaries (2,807) (2,591) (1,462) (1,757) (1,690)
Equity in earnings (losses)of affiliates 931 659 414 (1,878) (2,192)
Net income from continuingoperations 139,522 117,987 87,373 56,749 50,312
Loss on sale of discontinuedoperation, net of tax (2) (2,012) –– –– –– ––
Net income $ 137,510 $ 117,987 $ 87,373 $ 56,749 $ 50,312
Net income from continuing operationsper common share:Basic $ 3.19 $ 2.71 $ 2.06 $ 1.38 $ 1.24 Diluted 3.10 2.63 2.01 1.35 1.21
Net income per common share:Basic $ 3.15 $ 2.71 $ 2.06 $ 1.38 $ 1.24 Diluted 3.06 2.63 2.01 1.35 1.21
Weighted-average commonshares outstanding:Basic 43,709 43,489 42,366 41,244 40,585 Diluted 44,988 44,872 43,545 42,007 41,438
16

Years ended
December 27, December 28, December 29, December 30, December 25,2003 2002 2001 2000 1999
(In thousands, except selected operating data)
Selected Operating Data(unaudited):
Number of orders shipped 8,825,000 7,861,000 7,891,000 8,280,000 7,979,000 Average order size $ 380 $ 359 $ 324 $ 288 $ 286
Net Sales by Market Data:Healthcare distribution (3):
Dental (4) $1,364,812 $1,227,273 $1,121,394 $1,087,073 $1,056,406 Medical (5) 1,338,084 1,093,956 982,569 851,301 767,258 International (6) 576,628 437,046 398,071 389,946 403,140
Total healthcare distribution 3,279,524 2,758,275 2,502,034 2,328,320 2,226,804
Technology (7) 74,281 66,726 56,209 53,401 57,740
Total $3,353,805 $2,825,001 $2,558,243 $2,381,721 $2,284,544
Balance Sheet Data:Total assets $1,819,370 $1,558,052 $1,385,428 $1,231,068 $1,204,102 Long-term debt 247,100 242,561 242,169 266,224 318,218 Minority interest 11,532 6,748 6,786 7,996 7,855 Stockholders' equity 1,004,118 861,217 680,457 579,060 517,867
(1) In 2002, we revised our original estimates of our anticipated merger, integration and restructuring costs. This change in estimates isattributable to facts and circumstances that arose subsequent to the original charges. As a result, we recorded additional expensesand reversed certain of our previously recorded expenses. Merger, integration and restructuring costs consisted primarily ofinvestment banking, legal, accounting and advisory fees, severance costs and benefits, facility costs, write-offs of duplicatemanagement information systems and other assets.
(2) In the third quarter of 2003, we sold PMA Bode GmbH, an x-ray film distribution business located in Germany, which was a componentof our healthcare distribution business. Due to immateriality, we have not reflected the operating results of PMA Bode separately asa discontinued operation for any of the periods presented.
(3) Consists of consumable products, small equipment, laboratory products, large dental equipment, branded and genericpharmaceuticals, surgical products, diagnostic tests, infection control products and vitamins.
(4) Consists of products sold in the United States and Canada.
(5) Consists of products sold in the United States’ Medical and Veterinary markets.
(6) Consists of products sold in the Dental, Medical and Veterinary markets, primarily in Europe.
(7) Consists of practice management software and other value-added products and services, which are sold primarily to healthcareprofessionals in the United States and Canada.
17

MANAGEMENT’S DISCUSSION AND ANALYSIS OF FINANCIAL CONDITION AND RESULTS OF OPERATIONS
Cautionary Note Regarding Forward-Looking Statements
Except for historical information contained herein, the statements in this report (including without limitation, statements indicating that we“expect”, “estimate”, “anticipate”, or “believe” and all other statements concerning future financial results, product or service offerings orother events that have not yet occurred) are forward-looking statements that are made pursuant to the safe harbor provisions of applicablesecurities legislation and regulations. Forward-looking statements involve known and unknown factors, risks and uncertainties which maycause our actual results in future periods to differ materially from those expressed in any forward-looking statements. Those factors, risksand uncertainties include, but are not limited to, the factors described under "Risk Factors" discussed later in this Annual Report.
Executive-Level Overview
We are the largest distributor of healthcare products and services primarily to office-based healthcare practitioners in the combined NorthAmerican and European markets with operations in the United States, Canada, the United Kingdom, the Netherlands, Belgium, Germany,France, Austria, Spain, Ireland, Portugal, Australia and New Zealand.
Our reportable segments are strategic business units that offer different products and services to the same customer base. We conductour business through two segments: healthcare distribution and technology.
Our healthcare distribution segment, which is comprised of our dental, medical (including veterinary) and international business groups,distributes healthcare products (primarily consumable) and services primarily to office-based healthcare practitioners and professionalsin the United States, Canada and international markets. Products, which are similar for each business group, are maintained anddistributed from strategically located distribution centers.
Our technology segment consists primarily of our practice management software business and certain other value-added products andservices that are distributed primarily to healthcare professionals in the United States and Canada. Most of the technology business,including members of its management, was acquired as a unit.
The following table summarizes the significant components of our operating results and cash flows for each of the three years endedDecember 27, 2003 (in thousands):
Years ended
December 27, December 28, December 29,2003 2002 2001
Operating Results:Net sales $3,353,805) $2,825,001) $2,558,243)Cost of sales 2,426,611) 2,030,097) 1,858,919)
Gross profit 927,194) 794,904) 699,324)
Operating expenses:Selling, general and administrative 693,475) 598,635) 551,574)Merger, integration and restructuring credits –– (734) ––
Operating income $ 233,719) $ 197,003) $ 147,750)
Other expense, net $ (7,943) $ (6,574) $ (7,399)Net income from continuing operations 139,522) 117,987) 87,373)Loss on sale of discontinued operation, net of tax (2,012) ––) ––)Net income 137,510) 117,987) 87,373)
Cash Flows:Net cash provided by operating
activities from continuing operations $ 128,843) $ 134,669) $ 190,911)Net cash used in investing activities 118,122) 142,758) 55,070) Net cash (used in) provided by financing activities (48,375) 18,683) 371)
18

Industry Overview
In recent years, the healthcare industry has increasingly focused on cost containment. This trend has benefited distributors capable ofproviding a broad array of products and services at low prices. This trend has also accelerated the growth of HMOs, group practices,other managed care accounts and collective buying groups which, in addition to their emphasis on obtaining products at low prices, tendto favor distributors capable of providing specialized management information support. We believe that the trend towards costcontainment has the potential to favorably impact demand for practice management systems and software that can enhance the efficiencyand facilitation of practice management.
Our operating results in recent years have been significantly impacted by strategies and transactions we undertook to expand ourbusiness, both domestically and internationally, in part, to address significant changes in the healthcare industry, including consolidationof healthcare distribution companies, potential healthcare reform, trends toward managed care, cuts in Medicare and collectivepurchasing arrangements.
Industry Consolidation
The office-based healthcare practitioner industry, in the geographic markets in which we operate, is highly fragmented and diverse.Encompassing the dental, medical and veterinary markets, this industry accounted for revenues of approximately $17 billion in 2003. Theindustry ranges from sole practitioners working out of relatively small offices to group practices or service organizations comprised ofbetween a few and a large number of practitioners who have combined or otherwise associated their practices.
Due in part to the inability of office-based healthcare practitioners to store and manage large quantities of supplies in their offices, thedistribution of healthcare supplies and small equipment to office-based healthcare practitioners has traditionally been characterized byfrequent, small quantity orders, and a need for rapid, reliable and substantially complete order fulfillment. The purchasing decision withinan office-based healthcare practice is typically made by the practitioner or an administrative assistant, and supplies and small equipmentare generally purchased from more than one distributor with one generally serving as the primary supplier.
We believe that consolidation within the supply industry serving office-based healthcare practitioners will continue to result in a numberof distributors, particularly companies with limited financial and marketing resources, seeking to combine with larger companies that canprovide opportunities for growth. This consolidation may also continue to result in distributors seeking to acquire companies that canenhance their current product offerings and expand the services they can offer or provide opportunities to serve a broader customer base.
Our trend with regard to acquisitions has been to expand our role as a provider of products to the healthcare industry. This trend hasresulted in expansion into service areas, which (a) complement our existing operations, and (b) provide opportunities for us to developsynergies with, and thus strengthen, the acquired businesses.
We are currently awaiting regulatory approval for the acquisition of demedis, a leading full-service distributor of dental consumables andequipment in Germany, Austria, and the Benelux countries, and EDH, which includes KRUGG S.p.A., Italy's leading distributor of dentalconsumable products and DentalMV GmbH (otherwise know as Muller & Weygandt), one of Europe's leading direct marketing distributorsof dental consumable products. These acquisitions will approximately double the net sales of our international operations (see Note 7 toour consolidated financial statements). Additionally, we have completed 22 acquisitions in the past five years, including 8 in 2003.
As industry consolidation continues, we believe that we are positioned to capitalize on this trend, as we believe we have the ability tosupport increased sales through our existing infrastructure. In the U.S. dental market, we estimate that there are currently over 300 smallerdistributors holding approximately 40% of the market. In the U.S. medical market, we estimate that over 500 smaller distributors holdapproximately 60% of the market, and in the European dental market, we estimate that over 200 competitors hold approximately 80% ofthe market.
As the healthcare industry continues to change, we continually evaluate possible candidates for merger or acquisition and intend tocontinue to seek opportunities to expand our role as a provider of products and services to the healthcare industry. There can be noassurance that we will be able to successfully pursue any such opportunity or consummate any such transaction, if pursued. If additionaltransactions are entered into or consummated, we would incur additional merger and acquisition related costs, and there can be noassurance that the integration efforts associated with any such transaction would be successful.
19

Aging Population and Other Market Influences
The healthcare products distribution industry continues to experience growth due to the aging population, increased healthcareawareness, the proliferation of medical technology and testing, new pharmacology treatments and expanded third-party insurancecoverage. In addition, the physician market continues to benefit from the shift of procedures and diagnostic testing in hospitals to thealternate site, particularly physician offices, despite significantly lower pricing of hospital medical products. As the cosmetic surgery andelective procedure markets continue to grow, physicians are increasingly performing more of these procedures in their offices. The eldercare market continues to benefit from the increasing growth rate of the population of elderly Americans.
The January 2000 U.S. Bureau of the Census estimates that the elderly population in America will more than double by the year 2040. In2000, four million Americans were age 85 years and older, the segment of the population most in need of long-term care and elder careservices. By the year 2040, that number is projected to more than triple to over 14 million. The population age 65 to 84 years is projectedto more than double in the same time period.
As a result of these market dynamics, the annual expenditures for healthcare services continue to increase in the U.S. The Centers forMedicaid and Medicare Services (CMS), Office of the Actuary published "Health Spending Projections Through 2013" in 2004, indicatingthat total national healthcare spending reached $1.6 trillion in 2002, or 14.9% of the nation’s gross domestic product. Healthcare spendingis projected to reach $3.4 trillion in 2013, an estimated 18.4% of the gross domestic product, the benchmark measure for annualproduction of goods and services in the U.S.
Governmental Influences
The healthcare industry is subject to extensive government regulation, licensure, and operating compliance procedures. Nationalhealthcare reform has been the subject of a number of legislative initiatives by Congress. Additionally, government and private insuranceprograms fund a large portion of the total cost of medical care. During 1997, the Balanced Budget Act passed by Congress significantlyreduced reimbursement rates for nursing homes and home healthcare providers, affecting spending levels and overall financial viabilityof these institutions.
The Medicare Prescription Drug, Improvement, and Modernization Act (the "Medicare Act") was passed by Congress and enacted byPresident Bush on December 8, 2003. The Medicare Act is the largest expansion of the Medicare program since its inception andprovides participants with voluntary prescription drug benefits effective in 2006 with an interim drug discount card. The Medicare Act alsoincludes provisions relating to medication management programs, generic substitution and provider reimbursement. Based upon currentinformation, we believe the Medicare Act may create additional volume demand and provide incentives for additional utilization of genericdrugs, both of which have potentially positive implications for our pharmaceutical distribution business.
Product Integrity
Certain pharmaceutical and medical-surgical product manufacturers and legislators are in discussions regarding the risks of counterfeitproducts in the supply chain and the manufacturers' concerns regarding the impact of secondary market distribution on counterfeiting.As a distributor of such products, we continue to work with our suppliers to help minimize the risks associated with counterfeit productsin the supply chain and with potential litigation.
20

Results of Operations2003 Compared to 2002
Net Sales
Net sales for 2003 and 2002 were as follows (in thousands):
% of % of2003 Total 2002 Total
Healthcare distribution (1):Dental (2) $1,364,812 40.7% $1,227,273 43.4%Medical (3) 1,338,084 39.9% 1,093,956 38.7%International (4) 576,628 17.2% 437,046 15.5%
Total healthcare distribution 3,279,524 97.8% 2,758,275 97.6%Technology (5) 74,281 2.2% 66,726 2.4%
Total $3,353,805 100.0% $2,825,001 100.0%
(1) Consists of consumable products, small equipment, laboratory products, large dental equipment, branded and genericpharmaceuticals, surgical products, diagnostic tests, infection control products and vitamins.
(2) Consists of products sold in the United States and Canada.
(3) Consists of products sold in the United States’ Medical and Veterinary markets.
(4) Consists of products sold in the Dental, Medical and Veterinary markets, primarily in Europe.
(5) Consists of practice management software and other value-added products and services, which are sold primarily to healthcareprofessionals in the United States and Canada.
For the year ended December 27, 2003, our net sales increased $528.8 million or 18.7% from the comparable prior year period. Of theincrease in total net sales, $521.2 million or 98.6% resulted from an 18.9% increase in our healthcare distribution business. Of thisincrease, $137.5 million resulted from an 11.2% increase in our dental business, $244.1 million resulted from a 22.3% increase in ourmedical business and $139.6 million resulted from a 31.9% increase in our international business. The remaining increase in net sales of$7.6 million resulted from an 11.3% increase in our technology business.
The $137.5 million or 11.2% increase in dental net sales, consisted of an increase in dental consumable merchandise of $91.0 million or9.4% and dental equipment of $46.5 million or 18.3%. The increase in dental net sales was primarily due to increased account penetrationof existing customers driven by our Privileges loyalty program and an acquisition. Excluding the effects of the acquisition and exchangerates, net sales for the dental business increased $96.3 million or 7.9%. The $244.1 million or 22.3% increase in medical net sales wasprimarily due to increased sales to physicians’ office and alternate care markets. The $139.6 million or 31.9% increase in international netsales was primarily due to an acquisition, favorable exchange rates and increased account penetration in France, Spain and Austria,partially offset by a divestiture. Excluding the effect of exchange rates, the acquisition and divestiture, net sales for the international marketincreased $31.6 million or 7.2%.
The increase in technology net sales of $7.6 million or 11.3% was primarily due to increased sales of value-added products includingsoftware products and related services, including the impact of our MarketOne marketing initiative. Under this initiative, certain technologyand equipment products were sold directly to end-user customers beginning with the third quarter of 2002, rather than through resellers,which resulted in a higher growth rate for the technology business. Without this change, the technology business net sales would haveincreased by 8.0%.
21

Gross Profit
Gross profit and gross margins for 2003 and 2002 by segment and in total were as follows (in thousands):
Gross Gross 2003 Margin % 2002 Margin %
Healthcare distribution $870,499 26.5% $743,880 27.0%Technology 56,695 76.3% 51,024 76.5%
Total $927,194 27.6% $794,904 28.1%
Gross profit increased $132.3 million or 16.6%, to $927.2 million for the year ended December 27, 2003 compared to the prior yearperiod.
Healthcare distribution gross profit increased $126.6 million or 17.0% to $870.5 million for the year ended December 27, 2003 comparedto the prior year period. Healthcare distribution gross profit margin decreased to 26.5% for the year ended December 27, 2003 from27.0% for the comparable prior year period, primarily due to our medical business experiencing higher sales of lower margin injectablepharmaceutical products, partially offset by a change in sales mix in our dental business.
Technology gross profit increased $5.7 million or 11.1% to $56.7 million for the year ended December 27, 2003 compared to the prior yearperiod. Technology gross profit margin decreased slightly to 76.3% for the year ended December 27, 2003 from 76.5% for the comparableprior year period, primarily due to changes in sales mix.
Selling, General and Administrative
Selling, general and administrative expenses by segment and in total for 2003 and 2002 were as follows (in thousands):
% of % ofRespective Respective
2003 Net Sales 2002 Net Sales
Healthcare distribution $665,470 20.3% $573,627 20.8%Technology 28,005 37.7% 25,008 37.5%
Total $693,475 20.7% $598,635 21.2%
Selling, general and administrative expenses increased $94.8 million or 15.8% to $693.5 million for the year ended December 27, 2003compared to the prior year period. As a percentage of sales, selling, general and administrative expenses decreased to 20.7% from21.2% for the comparable prior year period. This decrease was primarily due to lower payroll and rent costs in our healthcare distributionbusiness as a percentage of sales, realized through leveraging our infrastructure.
As a component of total selling, general and administrative expenses, selling and shipping expenses increased $67.4 million or 18.2% to$437.5 million for the year ended December 27, 2003 from $370.1 million for the prior year period. The increase was primarily due toexpenses directly associated with supporting increased sales volume. As a percentage of net sales, selling and shipping expensesdecreased slightly to 13.0% from 13.1% for the comparable prior year period.
As a component of total selling, general and administrative expenses, general and administrative expenses increased $27.4 million or12.0% to $256.0 million for the year ended December 27, 2003 from $228.5 million for the prior year period. As a percentage of net sales,general and administrative expenses decreased to 7.6% from 8.1% for the comparable prior year period primarily for the reasons statedabove.
Other Expense, Net
Other expense, net increased $1.4 million to $7.9 million for the year ended December 27, 2003 compared to the prior year period. Thenet increase was primarily due to decreased interest income primarily due to lower cash and cash equivalents and marketable securitiesbalances during 2003.
22

Income Taxes
For the year ended December 27, 2003, our effective tax rate was 37.4% compared to 37.2% for the prior year period. The differencebetween our effective tax rates and the federal statutory rates for both periods primarily relates to state income taxes.
Loss on Sale of Discontinued Operation
During the year ended December 27, 2003, we recognized a $2.0 million loss, net of tax, on the sale of a discontinued operation (SeeNote 7 to our consolidated financial statements).
Net Income
Net income increased $19.5 million or 16.5% to $137.5 million for the year ended December 27, 2003 compared to the prior year period.A real estate transaction gain of $454 thousand and a loss on sale of a discontinued operation of $2.0 million are included in 2003 netincome. A real estate transaction gain of $890 thousand and a restructuring accrual reversal of $734 thousand are included in 2002 netincome. The effect that such transactions had on diluted earnings per share was $(0.03) in 2003 and $0.04 in 2002.
2002 Compared to 2001
Net Sales
Net sales for 2002 and 2001 were as follows (in thousands):
% of % of2002 Total 2001 Total
Healthcare distribution (1):Dental (2) $1,227,273 43.4% $1,121,394 43.8%Medical (3) 1,093,956 38.7% 982,569 38.4%International (4) 437,046 15.5% 398,071 15.6%
Total healthcare distribution 2,758,275 97.6% 2,502,034 97.8%Technology (5) 66,726 2.4% 56,209 2.2%
Total $2,825,001 100.0% $2,558,243 100.0%
(1) Consists of consumable products, small equipment, laboratory products, large dental equipment, branded and genericpharmaceuticals, surgical products, diagnostic tests, infection control products and vitamins.
(2) Consists of products sold in the United States and Canada.
(3) Consists of products sold in the United States’ Medical and Veterinary markets.
(4) Consists of products sold in the Dental, Medical and Veterinary markets, primarily in Europe.
(5) Consists of practice management software and other value-added products and services, which are sold primarily to healthcareprofessionals in the United States and Canada.
For the year ended December 28, 2002, our net sales increased $266.8 million or 10.4% from the comparable prior year period. Of theincrease in total net sales, $256.3 million or 96.1% resulted from a 10.2% increase in our healthcare distribution business. Of this increase,$105.9 million resulted from a 9.4% increase in our dental business, $111.4 million resulted from an 11.3% increase in our medicalbusiness and $39.0 million resulted from a 9.8% increase in our international business. The remaining increase in net sales of $10.5 millionresulted from an 18.7% increase in our technology business.
23

The $105.9 million or 9.4% increase in dental net sales, consisted of an increase in dental consumable merchandise of $65.9 million or7.3% and dental equipment of $40.0 million or 18.5%. The increase in dental net sales was primarily due to increased dental equipmentsales and increased account penetration of existing customers driven by our Privileges loyalty program. The $111.4 million or 11.3%increase in medical net sales was primarily due to increased sales to physicians’ office and alternate care markets. The $39.0 million or9.8% increase in international net sales was primarily due to increased account penetration in France, United Kingdom and Australia andfavorable exchange rates. Excluding the effect of the exchange rates, net sales for the international market increased $18.7 million or4.7%.
The increase in technology net sales of $10.5 million or 18.7% was primarily due to increased sales of value-added products includingsoftware products and related services, including the impact of a new marketing initiative, MarketOne. Under this initiative, certaintechnology and equipment products were sold directly to end-user customers beginning with the third quarter of 2002, rather than throughresellers, which resulted in a higher growth rate for the technology business. Without this change, the technology business net saleswould have increased by 13.9%.
Gross Profit
Gross profit and gross margins for 2002 and 2001 by segment and in total were as follows (in thousands):
Gross Gross2002 Margin % 2001 Margin %
Healthcare distribution $743,880 27.0% $659,092 26.3%Technology 51,024 76.5% 40,232 71.6%
Total $794,904 28.1% $699,324 27.3%
Gross profit increased $95.6 million or 13.7% to $794.9 million for the year ended December 28, 2002 compared to the prior year period.Gross profit margin increased to 28.1% for the year ended December 28, 2002 from 27.3% for the comparable prior year period.
Healthcare distribution gross profit increased $84.8 million or 12.9% to $743.9 million for the year ended December 28, 2002 comparedto the prior year period. Healthcare distribution gross profit margin increased to 27.0% for the year ended December 28, 2002 from 26.3%for the comparable prior year period, primarily due to changes in sales mix.
Technology gross profit increased $10.8 million or 26.8% to $51.0 million for the year ended December 28, 2002 compared to the prioryear period. Technology gross profit margin increased to 76.5% for the year ended December 28, 2002 from 71.6% for the comparableprior year period, primarily due to changes in sales mix.
Selling, General and Administrative
Selling, general and administrative expenses for 2002 and 2001 by segment and in total were as follows (in thousands):
% of % ofRespective Respective
2002 Net Sales 2001 Net Sales
Healthcare distribution $573,627 20.8% $530,755 21.2%Technology 25,008 37.5% 20,819 37.0%
Total $598,635 21.2% $551,574 21.6%
Selling, general and administrative expenses increased $47.0 million or 8.5% to $598.6 million for the year ended December 28, 2002compared to the prior year period. As a percentage of sales, selling, general and administrative expenses decreased to 21.2% from21.6% for the comparable prior year period. This decrease was primarily due to lower rent costs in our healthcare distribution businessas a percentage of sales, realized through leveraging our infrastructure.
As a component of total selling, general and administrative expenses, selling and shipping expenses increased $36.0 million or 10.8% to$370.1 million for the year ended December 28, 2002 from $334.1 million for the prior year period. The increase was primarily due toexpenses directly associated with supporting increased sales volume. As a percentage of net sales, selling and shipping expensesremained constant at 13.1% compared to the prior year period.
24

As a component of total selling, general and administrative expenses, general and administrative expenses increased $11.0 million or5.1% to $228.5 million for the year ended December 28, 2002 from $217.5 million for the prior year period. As a percentage of net sales,general and administrative expenses decreased to 8.1% from 8.5% for the comparable prior year period. The decrease was primarilydue to the elimination of goodwill amortization expense with the adoption of FAS 142.
Other Expense, Net
Other expense, net decreased by $825 thousand to $6.6 million for the year ended December 28, 2002 compared to the prior year period.The net decrease was primarily due to the favorable settlement of a real estate transaction.
Income Taxes
For the year ended December 28, 2002, our effective tax rate was 37.2% compared to 37.0% for the comparable prior year period. Thedifference between our effective tax rates and the federal statutory rates for both periods primarily relates to state income taxes.
Net Income
Net income increased $30.6 million or 35.0% to $118.0 million for the year ended December 28, 2002 compared to the prior year. A realestate transaction gain of $890 thousand, a restructuring accrual reversal of $734 thousand and the effect of the implementation of FAS 142 at the beginning of 2002 which ceased amortization of goodwill and indefinite-lived intangible assets of approximately $7.3 millionare included in 2002 net income. The effect that such transactions had on diluted earnings per share was $0.20 in 2002.
Liquidity and Capital Resources
Our principal capital requirements include the funding of working capital needs, acquisitions, repurchases of common stock and capitalexpenditures resulting from increased sales and special inventory forward buy-in opportunities, pursuing growth opportunities andmanaging funding needs. Since sales tend to be strong during the fourth quarter and special inventory forward buy-in opportunities aremost prevalent just before the end of the year, our working capital requirements have generally been higher from the end of the thirdquarter to the end of the first quarter of the following year.
We finance our business primarily through cash generated from our operations, revolving credit facilities, private placement loans andstock issuances. Our principal source of cash is derived from our operations. Our ability to generate sufficient cash flows from operationsis dependent on the continued demand of our customers for our products and services. Given current operating, economic and industryconditions, we believe that demand for our products and services will remain consistent in the foreseeable future.
Net cash flow provided by operating activities from continuing operations was $128.8 million for the year ended December 27, 2003compared to $134.7 million for the prior year period. This decrease was primarily due to increased trade receivable and inventory levelsas of December 27, 2003 resulting from increased end of year sales and purchase activity for 2003 compared to 2002.
Net cash used in investing activities was $118.1 million for the year ended December 27, 2003 compared to $142.8 million for the prioryear period. The decrease was primarily due to an increase in net proceeds received from the sale and maturity of marketable securitiesand a reduction in capital expenditures, partially offset by an increase in cash used for acquisitions. We expect to invest approximatelybetween $35 million and $40 million during fiscal year 2004 in capital projects to modernize and expand our facilities, on computerinfrastructure systems and to integrate operations.
Net cash used in financing activities was $48.4 million for the year ended December 27, 2003 compared to $18.7 million provided byfinancing activities for the comparable prior year period. The net change was primarily due to payments made to repurchase our commonstock and a reduction in the proceeds received from the issuance of stock upon the exercise of stock options, partially offset by lowerprincipal payments on long-term debt.
On March 12, 2003, we announced that our Board of Directors had authorized the repurchase of up to two million shares of our commonstock, which represented approximately 4.5% of shares outstanding on the announcement date. During the year ended December 27,2003, we repurchased and retired 1,335,000 shares at an average price of $46.26 per share.
25

The following table summarizes selected measures of liquidity and capital resources (in thousands):
December 27, December 28,2003 2002
Cash and cash equivalents $157,351 $200,651 Marketable securities, including non-current 14,496 55,185 Working capital 637,296 604,199 Debt, net of cash and cash equivalents and
marketable securities (1) 84,565 __
(1) Debt includes bank credit lines and current and non-current portions of long-term debt, including Senior Notes and loans payable tobanks and capital lease obligations.
Our cash and cash equivalents consist of bank balances and investments in money market funds. These investments have staggeredmaturity dates, none of which exceed three months, and have a high degree of liquidity since the securities are traded in public markets.
Our marketable securities consist of short and long-term debt securities classified as available for sale, including corporate bonds ratedAAA by Moody’s (or an equivalent rating) and commercial paper rated P-1 by Moody’s (or an equivalent rating). The fair values of ourmarketable securities are determined by quoted market prices.
Our business requires a substantial investment in working capital that is susceptible to large variations during the year as a result ofinventory purchase patterns and seasonal demands. Inventory purchase activity is a function of sales activity, special inventory forwardbuy-in opportunities, new customer build-up requirements and the desired level of investment inventory. Working capital has increasedprimarily as a result of our higher sales volume.
Our accounts receivable days sales outstanding improved to 46.4 days for the year ended December 27, 2003 from 48.2 days for thecomparable prior year period primarily due to our continued focus on actively pursuing collection of aged receivables and tighteningcredit standards. Our inventory turns improved to 6.9 turns for the year ended December 27, 2003 from 6.6 turns for the prior year as aresult of increased sales of higher turnover products. We anticipate future increases in our working capital requirements as a result ofcontinued sales growth.
The following table shows our contractual obligations related to fixed and variable rate long-term debt, excluding interest, as well as leaseobligations and inventory purchase commitments as of December 27, 2003 (See Notes 8 and 13 to our consolidated financial statements):
Payments due by period (in thousands)< 1 year 1 - 3 years 4 - 5 years > 5 years Total
Contractual obligations:
Inventory purchase commitments $149,891 $129,440 $ –– $ –– $279,331
Long-term debt 2,622 24,362 42,316 178,715 248,015
Operating lease obligations 22,286 35,348 20,725 24,419 102,778
Capital lease obligations 631 943 376 388 2,338
Total $175,430 $190,093 $63,417 $203,522 $632,462
In prior years, we completed private placement transactions under which we issued $130.0 million and $100.0 million in Senior Notes.The $130.0 million notes come due on June 30, 2009 and bear interest at a fixed rate of 6.94% per annum. Principal payments totaling$20.0 million are due annually starting September 25, 2006 on the $100.0 million notes and bear interest at a fixed rate of 6.66% perannum. Interest on both notes is payable semi-annually.
During the fourth quarter of 2003, we entered into agreements relating to the $230.0 million Senior Notes to exchange our fixed interestrates for variable interest rates. The weighted-average variable interest rate is 4.25%. This weighted-average variable interest rate iscomprised of LIBOR, plus the spread, and resets on the interest due dates for the Senior Notes.
We have a Revolving Credit Facility of $200.0 million that is a four-year committed line scheduled to terminate in May 2006. There wereno borrowings under this credit facility as of December 27, 2003. As of December 27, 2003, certain of our subsidiaries had revolvingcredit facilities, which had outstanding balances of $6.1 million, against aggregate borrowing limits of $32.6 million.
In connection with our pending acquisition of demedis and EDH for approximately 255 million euros, as previously discussed, after makinga deposit on January 20, 2004 of 35 million euros, we will be paying approximately 220 million euros at closing. The remaining purchaseprice will be paid from existing cash resources and/or the proceeds of (i) a bridge loan and/or (ii) the issuance or sale in a public or privateplacement of equity interests or notes, debentures or other debt securities (or another debt financing) with a maturity in excess of oneyear (in any case, a "Permanent Financing"). We have obtained commitments for a $150.0 million bridge loan facility scheduled to matureon the six-month anniversary of the closing of the acquisition. The bridge loan will be unsecured, and will bear interest, at our option, at
26

LIBOR plus 0.925% or the prime rate. We intend to refinance the bridge loan by means of a Permanent Financing or, if a PermanentFinancing can be arranged prior to the consummation of the Acquisition, we will pay the purchase price with the proceeds of suchPermanent Financing. The acquisition is subject to standard closing conditions and regulatory approvals and is expected to close mid-year 2004.
Some holders of minority interests in entities we have acquired have the right at certain times to require us to acquire their interest at aprice that approximates fair value pursuant to a formula price based on earnings of the entity. Additionally, some prior owners of acquiredbusinesses are eligible to receive additional purchase price cash consideration if certain profitability targets are met. We have notaccrued any liabilities that may arise from these transactions since the outcome of the contingency is not determinable beyond areasonable doubt.
We finance our business to provide adequate funding for at least 12 months. Funding requirements are based on forecasted profitabilityand working capital needs, which, on occasion may change. Consequently, we may change our funding structure to reflect any newrequirements.
We believe that our cash and cash equivalents, investments in short and long-term marketable securities, ability to access public andprivate debt and equity markets and availability of funds under our existing credit facilities will provide us with sufficient liquidity to meetour currently foreseeable short-term and long-term capital needs.
Seasonality and Other Factors Affecting Our Business
Our business is subject to seasonal and other quarterly influences. Net sales and operating profits are generally higher in the third andfourth quarters due to timing of seasonal product sales, software and equipment sales, year-end promotions and purchasing patterns ofoffice-based healthcare practitioners and are generally lower in the first quarter primarily due to the increased purchases in the priorquarter.
Quarterly results also may be materially affected by a variety of other factors, including the timing of acquisitions and related costs, timingof sales, special promotional campaigns, fluctuations in exchange rates and adverse weather conditions.
E-Commerce
Traditional healthcare supply and distribution relationships are impacted by the advancement of electronic on-line commerce solutions.Our distribution business is characterized by rapid technological developments and is highly competitive. The rapid advancement of on-line commerce requires us to provide continuous improvement in performance, security, features and reliability of Internet content andtechnology, particularly in response to competitive offerings.
Through our proprietary technologically-based suite of products, we offer customers a variety of competitive alternatives. We believe thatour tradition of reliable service coupled with our name recognition and large customer base built on solid customer relationships positionsus well to participate in this growing aspect of the distribution business. We continue to explore ways and means to improve and expandour Internet presence and capabilities.
Critical Accounting Policies and Estimates
The preparation of consolidated financial statements requires us to make estimates and judgments that affect the reported amounts ofassets, liabilities, revenues and expenses and related disclosure of contingent assets and liabilities. On an ongoing basis, we evaluateestimates, including those related to sales allowance provisions, as described below, volume purchase rebates, income taxes, inventoryand bad debt reserves and contingencies. We base our estimates on historical data, when available, experience, industry and markettrends, and on various other assumptions that are believed to be reasonable under the circumstances, the combined results of which formthe basis for making judgments about the carrying values of assets and liabilities that are not readily apparent from other sources. Actualresults may differ from these estimates.
We believe that the following critical accounting policies affect the significant estimates and judgments used in the preparation of ourfinancial statements:
Revenue Recognition
We generate revenue from the sale of dental, medical and veterinary consumable products, as well as dental equipment, softwareproducts and services and other sources. Provisions for discounts, rebates to customers, customer returns and other adjustments arerecorded based upon historical data and are provided for in the period in which the related sales are recognized.
Revenue derived from the sale of consumable products is recognized when products are shipped to customers. Such sales typicallyentail high-volume, low-dollar orders shipped utilizing third-party common carriers. We believe that the shipment date is the mostappropriate point in time indicating the completion of the earnings process because we have no post-shipment obligations, the productprice is fixed and determinable, collection of the resulting receivable is probable and product returns are reasonably estimable.
27

Revenue derived from the sale of dental equipment is recognized when products are delivered to customers. Such sales typically entailscheduled deliveries of large equipment primarily by equipment service technicians. Some equipment sales require minimal installation,which is completed at the time of delivery.
Revenue derived from the sale of software products is recognized when products are shipped to customers. Such software is generallyinstalled by customers and does not require extensive training due to the nature of its design. Revenue derived from post-contractcustomer support for software, including annual support and/or training, is recognized ratably over the period in which the services areprovided.
Revenue derived from other sources including freight charges, equipment repairs and financial services, is recognized when the relatedproduct revenue is recognized or when the services are provided.
Accounts Receivable and Reserves
The carrying amount of accounts receivable reflects a reserve representing our best estimate of the amounts that will not be collected. Inaddition to reviewing delinquent accounts receivable, we consider many factors in estimating our reserve, including historical data,experience, customer types, credit worthiness, and economic trends. From time to time, we may adjust our assumptions for anticipatedchanges in any of these or other factors expected to affect collectability.
Goodwill and Other Indefinite-Lived Intangible Assets
In accordance with Statement of Financial Accounting Standard ("FAS") No. 141, "Business Combinations", and No. 142, "Goodwill andOther Intangible Assets", goodwill and intangible assets deemed to have indefinite lives are no longer amortized but are subject to annualimpairment tests. Such impairment tests require the comparison of the fair value and carrying value of reporting units. Measuring fairvalue of a reporting unit is generally based on valuation techniques using multiples of sales or earnings, unless supportable informationis available for using a present value technique, such as estimates of future cash flows. We assess the potential impairment of goodwilland other indefinite-lived intangible assets annually and on an interim basis whenever events or changes in circumstances indicate thatthe carrying value may not be recoverable. Some factors we consider important which could trigger an interim impairment review includethe following:
• Significant underperformance relative to expected historical or projected future operating results;• Significant changes in the manner of our use of the acquired assets or the strategy for our overall business; and• Significant negative industry or economic trends.
If we determine through the impairment review process that goodwill has been impaired, we record an impairment charge in ourconsolidated statement of income. Based on our 2003 impairment review process, we have not recorded any impairments during theyear ended December 27, 2003.
Long-Lived Assets
Long-lived assets, other than goodwill and other indefinite-lived intangible assets, are evaluated for impairment when events or changesin circumstances indicate that the carrying amount of the assets may not be recoverable through the estimated undiscounted future cashflows from the use of such assets. Other definite-lived intangible assets are amortized over their estimated useful lives. Such definite-lived intangible assets primarily consist of non-compete agreements and customer relationships. When an impairment exists, the relatedassets are written down to fair value. We have not recorded any impairments during the year ended December 27, 2003.
Stock-Based Compensation
We account for stock option awards to employees under the intrinsic value-based method of accounting prescribed by APB No. 25,"Accounting for Stock Issued to Employees". Under this method, no compensation expense is recorded provided the exercise price isequal to or greater than the quoted market price of the stock at the grant date.
We make pro forma disclosures of net income and earnings per share as if the fair value-based method of accounting (the alternativemethod of accounting for stock-based compensation) had been applied as required by FAS No. 123, "Accounting for Stock-BasedCompensation". The fair value-based method requires us to make assumptions to determine expected risk-free interest rates, stock pricevolatility, dividend yield and weighted-average option life.
28

Recently Issued Accounting Standards
In December 2003, the FASB issued a revision to FAS No. 132, "Employers’ Disclosures about Pensions and Other PostretirementBenefits." This statement does not change the measurement or recognition aspects for pensions and other postretirement benefit plans;however, it does revise employers’ disclosures to include more information about the plan assets, obligations to pay benefits and fundingobligations. FAS 132, as revised, was effective for our 2003 consolidated financial statements. The adoption of FAS 132 did not have amaterial effect on our consolidated financial statements.
In May 2003, the FASB issued FAS No. 150, "Accounting for Certain Financial Instruments with Characteristics of both Liabilities andEquity." FAS No. 150 clarifies the definition of a liability as currently defined in FASB Concepts Statement No. 6, "Elements of FinancialStatements," as well as other planned revisions. This statement requires a financial instrument that embodies an obligation of an issuerto be classified as a liability. In addition, the statement establishes standards for the initial and subsequent measurement of these financialinstruments and disclosure requirements. FAS 150 was effective for financial instruments entered into or modified after May 31, 2003. Forall instruments entered into or last modified prior to May 31, 2003, FAS 150 was effective at the beginning of our third quarter of 2003.The adoption of FAS 150 did not have a material effect on our financial position or results of operations.
In April 2003, the FASB issued FAS No. 149, "Amendment of Statement 133 on Derivative Instruments and Hedging Activities." FAS No.149 amends FAS No. 133 for decisions made by the FASB’s Derivatives Implementation Group, other FASB projects dealing with financialinstruments, and in response to implementation issues raised in relation to the application of the definition of a derivative. This statementis generally effective for contracts entered into or modified after June 30, 2003 and for hedging relationships designated after June 30,2003. The adoption of FAS 149 did not have a material effect on our financial position or results of operations.
In January 2003, the FASB issued Interpretation ("FIN") No. 46, "Consolidation of Variable Interest Entities" and in December 2003, arevised interpretation was issued (FIN No. 46(R)). In general, a variable interest entity ("VIE") is a corporation, partnership, trust, or anyother legal structure used for business purposes that either does not have equity investors with voting rights or has equity investors thatdo not provide sufficient financial resources for the entity to support its activities. FIN 46 requires a VIE to be consolidated by a companyif that company is designated as the primary beneficiary. Application of FIN 46 is required in financial statements of public entities thathave interest in structures that are commonly referred to as special-purpose entities, or SPEs, for periods ending after December 15, 2003.Application by public entities, other than small business issuers, for all other types of VIEs (i.e. non-SPEs) is required in financialstatements for periods ending after March 15, 2004. The adoption of FIN 46 did not have a material effect on our financial position orresults of operations.
In December 2002, the FASB issued FAS No. 148, "Accounting for Stock-Based Compensation – Transition and Disclosure." Thisstatement amends FAS No. 123, "Accounting for Stock-Based Compensation," to provide alternative methods of transition for a voluntarychange to the fair value based method of accounting for stock-based employee compensation. In addition, FAS 148 amends thedisclosure requirements of FAS 123 to require prominent disclosures in both annual and interim financial statements about the method ofaccounting for stock-based employee compensation and the effect of the method used on reported results. We adopted the disclosureprovisions of this standard.
In November 2002, the FASB reached a consensus regarding EITF Issue No. 00-21, "Revenue Arrangements with Multiple Deliverables."EITF 00-21 addresses accounting for arrangements that may involve the delivery or performance of multiple products, services, and/orrights to use assets. The guidance provided by EITF 00-21 is effective for contracts entered into on or after July 1, 2003. The adoptionof EITF 00-21 did not have a material effect on our financial position or results of operations.
In November 2002, the FASB issued FIN No. 45, "Guarantor’s Accounting and Disclosure Requirements for Guarantees, Including IndirectGuarantees of Indebtedness of Others". FIN 45 addresses the disclosures to be made by a guarantor in its interim and annual financialstatements about its obligations under certain guarantees. FIN 45 also clarifies that a guarantor is required to recognize, at the inceptionof a guarantee, a liability for the fair value of the obligation undertaken in issuing the guarantee. The disclosure requirements in thisInterpretation are effective for financial statements of interim or annual periods ending after December 15, 2002. The adoption of FIN 45did not have a material effect on our financial position or results of operations.
In June 2002, the FASB issued FAS 146, "Accounting for Costs Associated with Exit or Disposal Activities". This Statement addressesfinancial accounting and reporting for costs associated with exit or disposal activities and nullifies EITF Issue No. 94-3, "LiabilityRecognition for Certain Employee Termination Benefits and Other Costs to Exit an Activity (including Certain Costs Incurred in aRestructuring)". The principal difference between this Statement and EITF 94-3 relates to the Statement’s requirements for recognition ofa liability for a cost associated with an exit or disposal activity. This Statement requires that a liability for a cost associated with an exit ordisposal activity be recognized when the liability is incurred, whereas under EITF 94-3, a liability was recognized at the date of an entity’scommitment to an exit plan. This Statement is effective for exit or disposal activities that are initiated after December 31, 2002. Theadoption of FAS 146 did not have a material effect on our financial position or results of operations.
In June 2001, the FASB issued FAS No. 143, "Accounting for Asset Retirement Obligations," which addresses financial accountingrequirements for retirement obligations associated with tangible long-lived assets. In May 2002, the FASB issued FAS No. 145, "Rescissionof FASB Statements 4, 44, 64, Amendment to FASB Statement No. 13, and Technical Corrections as of April 2002." FAS 145 amends otherexisting authoritative pronouncements to make various technical corrections, clarify meanings, or describe their applicability underchanged conditions. FAS 143 and 145 were effective commencing April 1, 2003 and did not have a material effect on our financial positionor results of operations.
29
QUANTITATIVE AND QUALITATIVE DISCLOSURES ABOUT MARKET RISK
We are exposed to market risks, which include changes in U.S. and international interest rates, as well as changes in foreign currencyexchange rates as measured against the U.S. dollar and each other. We attempt to reduce these risks by utilizing interest rate swapagreements and foreign currency forward and swap contracts. These hedging activities provide only limited protection against interestrate and currency exchange risks. Factors that could impact the effectiveness of our programs include volatility of the interest rate andcurrency markets and availability of hedging instruments. All interest rate swap and currency contracts that we enter into are componentsof hedging programs and are entered into for the sole purpose of hedging an existing or anticipated interest rate and currency exposure,not for speculation.
Interest Rate Swaps
We have fixed rate Senior Notes of $130.0 million at 6.94% and $100.0 million at 6.66%. During the fourth quarter of 2003, we enteredinto interest rate swap agreements to exchange our fixed interest rates for variable interest rates payable on the $230.0 million SeniorNotes. The variable rate is comprised of LIBOR plus the spreads and resets on the interest due dates for the Senior Notes. As a resultof these interest rate swap agreements, as well as our existing variable rate credit lines and loan agreements, we are exposed to risk fromchanges in interest rates. A hypothetical 100 basis point increase in interest rates would increase our annual interest expense byapproximately $2.4 million.
As of December 27, 2003, the fair value of our interest rate swap agreements recorded in other non-current assets was approximately$700 thousand, which represented the amount that would be earned upon unwinding the interest rate swap agreements based on marketconditions at that time. Changes in the fair value of these interest rate swap agreements are reflected as an adjustment to the relatedassets with an offsetting adjustment to the carrying value of the $230.0 million notes as such hedges are deemed fully effective.
Foreign Exchange
The value of certain foreign currencies as compared to the U.S. dollar may affect our financial results. Fluctuations in exchange rates maypositively or negatively affect our revenues, gross margins, operating expenses, and retained earnings, all of which are expressed in U.S.dollars. Where we deem it prudent, we engage in hedging programs, using primarily foreign currency forward and swap contracts, aimedat limiting the impact of foreign currency exchange rate fluctuations on earnings. We purchase short-term foreign currency forward andswap contracts to protect against currency exchange risks associated with long-term intercompany loans, due from our internationalsubsidiaries and the payment of merchandise purchases to foreign vendors. We do not hedge the translation of foreign currency profitsinto U.S. dollars as we regard this as an accounting not an economic exposure.
As of December 27, 2003, we had outstanding foreign currency forward and swap contracts aggregating $105.5 million, of which $97.0million related to intercompany debt and $8.5 million related to the purchase of merchandise from foreign vendors. The contracts hedgeagainst currency fluctuations of British Pounds ($32.9 million), Euros ($61.7 million), Australian Dollars ($9.0 million), Swiss Francs ($1.4million), Japanese Yen ($355 thousand), Swedish Krona ($82 thousand) and New Zealand Dollars ($82 thousand). As of December 27,2003, the fair value of these contracts, calculated as the gross value of future U.S. dollar payments and receipts determined by quotedmarket prices was $114.9 million. These contracts expire through January 2005. For the year ended December 27, 2003, we recognizeda loss relating to our foreign currency forward and swap contracts of $200 thousand.
30

Risk Factors
Stockholders and investors should carefully consider the risks described below and other information in this annual report. Our business,financial condition and operating results, and the trading price of our common stock could be adversely affected if any of these risksmaterialize.
• The healthcare products distribution industry is highly competitive, and we compete with numerous companies, including majormanufacturers and distributors that have greater financial and other resources than us. Competitors could obtain exclusive rights tomarket particular products or manufacturers could increase their efforts to sell directly to end-users, thereby bypassing distributors likeus. Consolidation among healthcare products distributors could result in existing competitors increasing their market position. Inaddition, unavailability of products, whether due to our inability to gain access to products or interruptions in supply of products frommanufacturers, could adversely affect our operating results.
• In recent years, the healthcare industry has undergone significant change driven by various efforts to reduce costs, including thereduction of spending budgets by government and private insurance programs, such as Medicare, Medicaid and corporate healthinsurance plans; trends toward managed care; consolidation of healthcare distribution companies; electronic commerce; and collectivepurchasing arrangements among office-based healthcare practitioners. If we are unable to react effectively to these and other changesin the healthcare industry, our operating results could be adversely affected.
• Our technology segment, which primarily sells practice management software and other value-added products, depends uponcontinued product development, technical support and marketing. Failures in these and related areas could adversely affect our resultsof operations.
• Our business is subject to requirements under various local, state, federal and foreign governmental laws and regulations applicable tothe manufacture and distribution of pharmaceuticals and medical devices, including the Federal Food, Drug, and Cosmetic Act, thePrescription Drug Marketing Act of 1987 and the Controlled Substances Act. There is no assurance that current or future governmentregulations will not adversely affect our business.
• Our business involves a risk of product liability and other claims in the ordinary course of business, and from time to time we are namedas a defendant in cases as a result of our distribution of pharmaceutical and other healthcare products. We have insurance policies,including product liability insurance, and in many cases we have indemnification rights from manufacturers with respect to the productswe distribute. There is no assurance that insurance coverage or manufacturers' indemnity will be available in all of the pending or anyfuture cases brought against us, or that an unfavorable result in any such case will not adversely affect our financial condition or resultsof operations.
• Our business is dependent upon our ability to hire and retain qualified sales representatives, service specialists and other sales agents.Due to the relationships developed between our field sales representatives and their customers, upon the departure of a salesrepresentative we face the risk of losing the representative's customers, especially if the representative becomes an employee of oneof our competitors.
• Our business is subject to seasonal and other quarterly influences. Net sales and operating profits are generally higher in the third andfourth quarters due to timing of seasonal product sales, software and equipment sales, year-end promotions and purchasing patternsof office-based healthcare practitioners and are generally lower in the first quarter primarily due to the increased purchases in the priorquarter.
• Our international operations are subject to inherent risks, which could adversely affect our operating results. These risks includedifficulties in opening and managing foreign offices and distribution centers; difficulties in establishing channels of distribution;fluctuations in the value of foreign currencies; longer payment cycles of foreign customers and difficulty in collecting receivables inforeign jurisdictions; import/export duties and quotas; and unexpected regulatory, economic and political changes in foreign markets.
• Our expansion through acquisitions and/or joint ventures could result in a loss of customers, diversion of management attention andincreased demands on our operations, information systems and financial resources.
• We rely on third parties to ship products to our customers. Increases in shipping rates or interruptions of service could adversely affectour operating results.
• Changes in e-commerce could affect our business relationships and could require significant resources. The rapid advancement of on-line commerce requires us to provide continuous improvement in performance, security, features and reliability of Internet content andtechnology, particularly in response to competitive offerings.
31

REPORT OF INDEPENDENT CERTIFIED PUBLIC ACCOUNTANTS
Board of Directors and StockholdersHenry Schein, Inc. Melville, New York
We have audited the accompanying consolidated balance sheets of Henry Schein, Inc. as of December 27, 2003 and December 28,2002, and the related consolidated statements of income, changes in stockholders’ equity and cash flows for each of the three years inthe period ended December 27, 2003. These financial statements are the responsibility of the Company’s management. Ourresponsibility is to express an opinion on these financial statements based on our audits.
We conducted our audits in accordance with auditing standards generally accepted in the United States of America. Those standardsrequire that we plan and perform the audits to obtain reasonable assurance about whether the financial statements are free of materialmisstatement. An audit includes examining, on a test basis, evidence supporting the amounts and disclosures in the financial statements.An audit also includes assessing the accounting principles used and significant estimates made by management, as well as evaluatingthe overall financial statement presentation. We believe that our audits provide a reasonable basis for our opinion.
In our opinion, the consolidated financial statements referred to above present fairly, in all material respects, the consolidated financialposition of Henry Schein, Inc. at December 27, 2003 and December 28, 2002, and the consolidated results of its operations and its cashflows for each of the three years in the period ended December 27, 2003 in conformity with accounting principles generally accepted inthe United States of America.
As discussed in Note 5, the Company changed its policy of accounting for goodwill in 2002 as required by Financial AccountingStandards Board Statement No. 142, "Goodwill and Other Intangible Assets".
BDO SEIDMAN, LLP
New York, New YorkFebruary 24, 2004
32

HENRY SCHEIN, INC.CONSOLIDATED BALANCE SHEETS
(In thousands, except share and per share data)
December 27, December 28,2003 2002
ASSETS
Current assets:Cash and cash equivalents $ 157,351 $ 200,651 Marketable securities 3,012 31,209 Accounts receivable, net of reserves of $43,203 and $36,200 467,085 368,263 Inventories 385,846 323,080 Deferred income taxes 30,559 29,919 Prepaid expenses and other 112,631 74,407
Total current assets 1,156,484 1,027,529
Property and equipment, net 154,205 142,532 Goodwill 398,888 302,687 Other intangibles, net 37,551 7,661 Investments and other 72,242 77,643
Total assets $1,819,370 $1,558,052
LIABILITIES AND STOCKHOLDERS' EQUITY
Current liabilities:Accounts payable $ 278,163 $ 243,166 Bank credit lines 6,059 4,790 Current maturities of long-term debt 3,253 2,662 Accruals:
Payroll and related expenses 68,214 53,954 Taxes 45,969 32,196 Other expenses 117,530 86,562
Total current liabilities 519,188 423,330
Long-term debt 247,100 242,561 Other liabilities 37,432 24,196
Minority interest 11,532 6,748 Commitments and contingencies
Stockholders' equity:Preferred stock, $.01 par value, 1,000,000 authorized,
none outstanding –– ––Common stock, $.01 par value, 120,000,000 authorized,
43,761,973 and 44,041,591 outstanding 438 440 Additional paid-in capital 445,118 436,554 Retained earnings 533,654 430,389 Treasury stock, at cost, 0 and 62,479 shares –– (1,156)Accumulated other comprehensive income (loss) 24,999 (4,794)Deferred compensation (91) (216)
Total stockholders' equity 1,004,118 861,217
Total liabilities and stockholders' equity $1,819,370 $1,558,052
See accompanying notes.
33

HENRY SCHEIN, INCCONSOLIDATED STATEMENTS OF INCOME
(In thousands, except per share data)
Years ended
December 27, December 28, December 29,2003 2002 2001
Net sales $3,353,805 $2,825,001 $2,558,243 Cost of sales 2,426,611 2,030,097 1,858,919
Gross profit 927,194 794,904 699,324
Operating expenses:
Selling, general and administrative 693,475 598,635 551,574
Merger, integration and restructuring credits –– (734) ––
Operating income 233,719 197,003 147,750
Other income (expense):
Interest income 8,746 10,446 10,078
Interest expense (18,311) (17,960) (17,324)
Other, net 1,622 940 (153)
Income before taxes on income, minority interest,equity in earnings of affiliates and losson sale of discontinued operation 225,776 190,429 140,351
Taxes on income from continuing operations (84,378) (70,510) (51,930)
Minority interest in net income of subsidiaries (2,807) (2,591) (1,462)
Equity in earnings of affiliates 931 659 414
Net income from continuing operations 139,522 117,987 87,373
Loss on sale of discontinued operation, net of tax (2,012) –– ––
Net income $ 137,510 $ 117,987 $ 87,373
Net income from continuing operations per common share:
Basic $ 3.19 $ 2.71 $ 2.06
Diluted $ 3.10 $ 2.63 $ 2.01
Loss on discontinued operation, net of tax per common share:
Basic $ (0.04) $ –– $ ––
Diluted $ (0.04) $ –– $ ––
Net income per common share:
Basic $ 3.15 $ 2.71 $ 2.06
Diluted $ 3.06 $ 2.63 $ 2.01
Weighted-average common shares outstanding:
Basic 43,709 43,489 42,366
Diluted 44,988 44,872 43,545
See accompanying notes.
34

HENRY SCHEIN, INC.CONSOLIDATED STATEMENTS OF CHANGES IN STOCKHOLDERS’ EQUITY
(In thousands, except share and per share data)
Accumulated Common Stock Additional Other Total$.01 Par Value Paid-in Retained Treasury Comprehensive Deferred Stockholders'
Shares Amount Capital Earnings Stock Income (Loss) Compensation Equity
Balance, December 30, 2000 41,946,284 $419 $373,413 $225,029 $(1,156) $(18,179) $(466) $ 579,060
Net income –– –– –– 87,373 –– –– –– 87,373
Foreign currency translation loss –– –– –– –– –– (5,743) –– (5,743)
Total comprehensive income –– –– –– –– –– –– –– 81,630
Stock issued to ESOP trust 61,997 1 2,224 –– –– –– –– 2,225
Amortization of restricted stock –– –– –– –– –– –– 125 125
Stock issued upon exercise of stock options, including taxbenefit of $3,262 736,923 7 17,410 –– –– –– –– 17,417
Balance, December 29, 2001 42,745,204 427 393,047 312,402 (1,156) (23,922) (341) 680,457
Net income –– –– –– 117,987 –– –– –– 117,987
Foreign currency translation gain –– –– –– –– –– 18,989 –– 18,989
Net unrealized investment gain –– –– –– –– –– 139 –– 139
Total comprehensive income –– –– –– –– –– –– –– 137,115
Stock issued to ESOP trust 24,859 –– 1,340 –– –– –– –– 1,340
Amortization of restricted stock –– –– –– –– –– –– 125 125
Stock issued upon exercise of stock options, including taxbenefit of $8,058 1,271,528 13 42,167 –– –– –– –– 42,180
Balance, December 28, 2002 44,041,591 440 436,554 430,389 (1,156) (4,794) (216) 861,217
Net income –– –– –– 137,510 –– –– –– 137,510
Foreign currency translation gain –– –– –– –– –– 30,765 –– 30,765
Net unrealized investment loss –– –– –– –– –– (125) –– (125)
Pension adjustment loss –– –– –– –– –– (847) –– (847)
Total comprehensive income –– –– –– –– –– –– –– 167,303
Stock issued to ESOP trust 39,786 –– 2,300 –– –– –– –– 2,300
Amortization of restricted stock –– –– –– –– –– –– 125 125
Retirement of treasury stock (62,479) –– (571) (585) 1,156 –– –– ––
Repurchase and retirement of common stock (1,335,000) (13) (28,081) (33,660) –– –– –– (61,754)
Stock issued upon exercise of stock options, including tax benefit of $12,579 1,078,075 11 34,916 –– –– –– –– 34,927
Balance, December 27, 2003 43,761,973 $438 $445,118 $533,654 $ –– $ 24,999 $ (91) $1,004,118
See accompanying notes.
35

HENRY SCHEIN, INC.CONSOLIDATED STATEMENTS OF CASH FLOWS
(In thousands)
Years ended
December 27, December 28, December 29,2003 2002 2001
Cash flows from operating activities of continuing operations:
Net income $137,510 $117,987 $ 87,373
Loss on sale of discontinued operation, net of tax 2,012 –– ––
Net income from continuing operations 139,522 117,987 87,373
Adjustments to reconcile net income to net cash providedby operating activities of continuing operations:
Depreciation and amortization 36,843 28,272 35,642
Provision for losses and allowances on trade receivables 6,548 8,962 8,850
Stock issued to ESOP trust 2,300 1,340 2,225
Provision for deferred income taxes 5,524 226 292
Undistributed earnings of affiliates (931) (659) (414)
Minority interest in net income of subsidiaries 2,807 2,591 1,462
Other 2,005 145 7,067
Changes in operating assets and liabilities, net of effect of acquisitions:
Accounts receivable (69,543) (6,714) 2,332
Inventories (28,781) (23,075) (17,850)
Other current assets (16,957) (18,445) 8,808
Accounts payable and accruals 49,506 24,039 55,124
Net cash provided by operating activities of continuing operations 128,843 134,669 190,911
Cash flows from investing activities:
Purchases of capital expenditures (38,978) (47,543) (46,127)
Payments for business acquisitions, net of cash acquired (118,180) (36,224) (8,588)
Purchases of marketable securities (39,667) (55,211) ––
Proceeds from sales of marketable securities 40,619 –– ––
Proceeds from maturities of marketable securities 39,030 –– ––
Other, including discontinued operation (946) (3,780) (355)
Net cash used in investing activities (118,122) (142,758) (55,070)
Cash flows from financing activities:
Proceeds from issuance of long-term debt –– –– 10,166
Principal payments on long-term debt (8,667) (14,941) (13,042)
Proceeds from issuance of stock upon exercise of stock options 22,348 34,122 14,155
Net (payments on) borrowing from banks (180) 394 (10,752)
Payments for repurchases of common stock (61,754) –– ––
Other (122) (892) (156)
Net cash (used in) provided by financing activities (48,375) 18,683 371
Net change in cash and cash equivalents (37,654) 10,594 136,212
Effect of exchange rate changes on cash and cash equivalents (5,646) (3,310) (1,207)
Cash and cash equivalents, beginning of year 200,651 193,367 58,362
Cash and cash equivalents, end of year $157,351 $200,651 $193,367
See accompanying notes.
36

HENRY SCHEIN, INC.NOTES TO CONSOLIDATED FINANCIAL STATEMENTS
(In thousands, except share and per share data)
Note 1–Significant Accounting Policies
Nature of Operations
We distribute healthcare products and services primarily to office-based healthcare practitioners in the combined North American andEuropean markets with operations in the United States, Canada, the United Kingdom, the Netherlands, Belgium, Germany, France,Austria, Spain, Ireland, Portugal, Australia and New Zealand. We sell products and services to customers in dental practices and dentallaboratories, as well as physician practices, veterinary clinics, government and other institutions.
Principles of Consolidation
Our consolidated financial statements include the accounts of Henry Schein, Inc. and all of our wholly-owned and majority-ownedsubsidiaries. All intercompany accounts and transactions are eliminated in consolidation. Investments in unconsolidated affiliates, whichare greater than or equal to 20% and less than or equal to 50% owned, are accounted for under the equity method. Certain prior periodamounts have been reclassified to conform to the current period presentation.
Use of Estimates
The preparation of financial statements in conformity with generally accepted accounting principles requires us to make estimates andassumptions that affect the reported amounts of assets and liabilities and disclosure of contingent assets and liabilities at the date of thefinancial statements and the reported amounts of revenues and expenses during the reporting period. Actual results could differ fromthose estimates.
Fiscal Year
We report our operations and cash flows on a 52-53 week basis ending on the last Saturday of December. Each of the three years endedDecember 27, 2003 consisted of 52 weeks.
Revenue Recognition
We generate revenue from the sale of dental, medical and veterinary consumable products, as well as dental equipment, softwareproducts and services and other sources. Provisions for discounts, rebates to customers, customer returns and other adjustments arerecorded based upon historical data and are provided for in the period in which the related sales are recognized.
Revenue derived from the sale of consumable products is recognized when products are shipped to customers. Such sales typicallyentail high-volume, low-dollar orders shipped utilizing third-party common carriers. We believe that the shipment date is the mostappropriate point in time indicating the completion of the earnings process because we have no post-shipment obligations, the productprice is fixed and determinable, collection of the resulting receivable is probable and product returns are reasonably estimable.
Revenue derived from the sale of dental equipment is recognized when products are delivered to customers. Such sales typically entailscheduled deliveries of large equipment primarily by equipment service technicians. Some equipment sales require minimal installation,which is completed at the time of delivery.
Revenue derived from the sale of software products is recognized when products are shipped to customers. Such software is generallyinstalled by customers and does not require extensive training due to the nature of its design. Revenue derived from post-contractcustomer support for software, including annual support and/or training, is recognized ratably over the period in which the services areprovided.
Revenue derived from other sources including freight charges, equipment repairs and financial services, is recognized when the relatedproduct revenue is recognized or when the services are provided.
37

HENRY SCHEIN, INC.NOTES TO CONSOLIDATED FINANCIAL STATEMENTS (CONTINUED)
(In thousands, except share and per share data)
Note 1–Significant Accounting Policies (Continued)
Cash and Cash Equivalents
We consider all highly-liquid debt instruments and other short-term investments with an original maturity of three months or less to be cashequivalents. Book overdrafts representing outstanding checks in excess of funds on deposit, which are primarily related to payments forinventory, were classified as accounts payable. Such amounts were $0 and $27.0 million at December 27, 2003 and December 28, 2002.
Marketable Securities
Marketable securities are classified as available-for-sale and are recorded at fair value. The fair value of substantially all securities isdetermined by quoted market prices. Unrealized gains and losses, net of related taxes, are included as a separate component ofstockholders’ equity.
Accounts Receivable and Reserves
The carrying amount of accounts receivable is reduced by a valuation allowance that reflects our best estimate of the amounts that willnot be collected. The reserve for accounts receivable is comprised of allowance for doubtful accounts and sales returns. In addition toreviewing delinquent accounts receivable, we consider many factors in estimating our general allowance, including historical data,experience, customer types, credit worthiness and economic trends. From time to time, we may adjust our assumptions for anticipatedchanges in any of these or other factors expected to affect collectability.
Direct Shipping and Handling Costs
Freight and other direct shipping costs are included in cost of sales. Direct handling costs, which represent primarily direct compensationcosts of employees who pick, pack and otherwise prepare, if necessary, merchandise for shipment to our customers are reflected inselling, general and administrative expenses. These costs were $25.7 million, $23.2 million and $21.2 million for each of the three yearsended December 27, 2003.
Advertising and Promotional Costs
We generally expense advertising and promotional costs as incurred. Total advertising and promotional expenses were $18.6 million,$13.9 million and $14.3 million for each of the three years ended December 27, 2003.
Inventories
Inventories consist substantially of finished goods and are valued at the lower of cost or market. Cost is determined primarily by the first-in, first-out ("FIFO") method.
38

HENRY SCHEIN, INC.NOTES TO CONSOLIDATED FINANCIAL STATEMENTS (CONTINUED)
(In thousands, except share and per share data)
Note 1–Significant Accounting Policies (Continued)
Property and Equipment and Depreciation and Amortization
Property and equipment are stated at cost. Amortization of leasehold improvements is computed using the straight-line method over thelesser of the useful life of the assets or the lease term. Depreciation is computed primarily under the straight-line method over the followingestimated useful lives:
Years
Buildings and improvements 40
Machinery and warehouse equipment 5-10
Furniture, fixtures and other 3-10
Computer equipment and software 3-8
Capitalized software costs consist of costs to purchase and develop software. Costs incurred during the application development stagefor software bought and further customized by outside vendors for our use and software developed by a vendor for our proprietary usehave been capitalized. Costs incurred for our own personnel who are directly associated with software development are also capitalized.
Taxes on Income
We account for income taxes under an asset and liability approach that requires the recognition of deferred tax assets and liabilities forthe expected future tax consequences of events that have been recognized in our financial statements or tax returns. In estimating futuretax consequences, we generally consider all expected future events other than enactments of changes in tax laws or rates. The effect ondeferred tax assets and liabilities of a change in tax rates will be recognized as income or expense in the period that includes theenactment date. We file a consolidated United States Federal income tax return with our 80% or greater owned United States subsidiaries.
Foreign Currency Translation and Transactions
The financial position and results of operations of our foreign subsidiaries are determined using local currency as the functional currency.Assets and liabilities of these subsidiaries are translated at the exchange rate in effect at each year end. Income statement accounts aretranslated at the average rate of exchange prevailing during the year. Translation adjustments arising from the use of differing exchangerates from period to period are included in the accumulated other comprehensive income (loss) account in stockholders’ equity. Gainsand losses resulting from foreign currency transactions are included in earnings.
Risk Management and Derivative Financial Instruments
We use derivative instruments to minimize our exposure to fluctuations in interest rates and foreign currency exchange rates. Ourobjective is to manage the impact that interest rate and foreign currency exchange rate fluctuations could have on recognized asset andliability fair values, earnings and cash flows. We do not enter into derivative instruments for speculative purposes. Our derivativeinstruments include interest rate swap agreements related to our long-term fixed rate debt; foreign currency forward and swap contractsrelated to intercompany loans and certain forecasted transactions with foreign vendors. We consider our net investments in foreignsubsidiaries to be both long-term and strategic and consequently do not hedge such investments. Our risk management policy requiresthat derivative contracts used as hedges be effective at reducing the risks associated with the exposure being hedged and be designatedas a hedge at the inception of the contract.
Our interest rate swap agreements are designated as fair value hedging instruments. The terms of the interest rate swap agreements areidentical to the Senior Notes and consequently qualify for an assumption of no ineffectiveness under the provisions of Statement ofFinancial Accounting Standards ("FAS") No. 133, "Accounting for Derivative Instruments and Hedging Activities". Both the interest rateswap agreements and the underlying Senior Notes are marked-to-market through earnings at the end of each period; however, since ourinterest rate swap agreements are deemed fully effective, these mark-to-market adjustments have no net impact on earnings.
39

HENRY SCHEIN, INC.NOTES TO CONSOLIDATED FINANCIAL STATEMENTS (CONTINUED)
(In thousands, except share and per share data)
Note 1–Significant Accounting Policies (Continued)
Our foreign currency forward and exchange contracts are designated as cash flow hedging instruments. These contracts are recordedat fair value on the balance sheet and all changes in fair value are deferred in accumulated other comprehensive income (loss) until theunderlying transactions are recognized. Upon recognition, such gains or losses are recorded in operations as an adjustment to thecarrying amounts of the underlying transactions in the period in which these transactions are recognized.
Acquisitions
The net assets of businesses purchased are recorded at their fair value at the acquisition date and the consolidated financial statementsinclude their operations from that date. Any excess of acquisition costs over the fair value of identifiable net assets acquired is recordedas goodwill. Certain acquisitions provide for contingent consideration, primarily cash, to be paid in the event certain financial performancetargets are satisfied over future periods. We have not accrued any liabilities that may arise from these transactions since the outcome ofthe contingencies are not determinable beyond a reasonable doubt.
Goodwill and Other Indefinite-Lived Intangible Assets
In accordance with FAS No. 141, "Business Combinations", and No. 142, "Goodwill and Other Intangible Assets", goodwill and intangibleassets deemed to have indefinite lives are no longer amortized but are subject to annual impairment tests. Such impairment tests requirethe comparison of the fair value and carrying value of reporting units. Measuring fair value of a reporting unit is generally based onvaluation techniques using multiples of sales or earnings, unless supportable information is available for using a present value technique,such as estimates of future cash flows. We assess the potential impairment of goodwill and other indefinite-lived intangible assets annuallyand on an interim basis whenever events or changes in circumstances indicate that the carrying value may not be recoverable.
Some factors we consider important which could trigger an interim impairment review include the following:
• Significant underperformance relative to expected historical or projected future operating results;
• Significant changes in the manner of our use of the acquired assets or the strategy for our overall business; and
• Significant negative industry or economic trends.
If we determine through the impairment review process that goodwill has been impaired, we record an impairment charge in ourconsolidated statements of income. Based on our 2003 impairment review process, we have not recorded any impairments during theyear ended December 27, 2003.
Long-Lived Assets
Long-lived assets, other than goodwill and other indefinite-lived intangible assets, are evaluated for impairment when events or changesin circumstances indicate that the carrying amount of the assets may not be recoverable through the estimated undiscounted future cashflows from the use of such assets. Other definite-lived intangible assets are amortized over their estimated useful lives. Such definite-lived intangible assets primarily consist of non-compete agreements, and customer relationships. When an impairment exists, the relatedassets are written down to fair value. We have not recorded any impairments during the year ended December 27, 2003.
Stock-Based Compensation
We account for stock option awards under the intrinsic value-based method of accounting prescribed by APB No. 25, "Accounting forStock Issued to Employees". Under this method, no compensation expense is recorded provided the exercise price is equal to or greaterthan the quoted market price of the stock at the grant date.
We make pro forma disclosures of net income and earnings per share as if the fair value-based method of accounting (the alternativemethod of accounting for stock-based compensation) had been applied as required by FAS No. 123, "Accounting for Stock-BasedCompensation". The fair value-based method requires us to make assumptions to determine expected risk-free interest rates, stock pricevolatility, dividend yield and weighted-average option life.
40

HENRY SCHEIN, INC.NOTES TO CONSOLIDATED FINANCIAL STATEMENTS (CONTINUED)
(In thousands, except share and per share data)
Note 1–Significant Accounting Policies (Continued)
Under the accounting provisions of FAS 123, our net income and net income per common share would have been adjusted to the proforma amounts indicated in the table below. The following assumptions were used in determining the fair values: weighted-average risk-free interest rates of 3.0%, 4.0% and 4.7% for the years ended December 27, 2003, December 28, 2002 and December 29, 2001, stockprice volatility of 45.0%, dividend yield of 0.0% and weighted-average expected option life of five years for each of the three years endedDecember 27, 2003.
Years ended
December 27, December 28, December 29,2003 2002 2001
Net income as reported $137,510 $117,987 $87,373
Deduct: Total tax affected stock-based compensationexpense determined under fair value method (7,413) (5,725) (5,782)
Pro forma net income $130,097 $112,262 $81,591
Net income per common share, as reported:
Basic $ 3.15 $ 2.71 $ 2.06
Diluted $ 3.06 $ 2.63 $ 2.01
Net income per common share, pro forma:
Basic $ 2.98 $ 2.58 $ 1.93
Diluted $ 2.89 $ 2.50 $ 1.87
Earnings Per Share
Basic earnings per share is computed by dividing net income by the weighted-average number of common shares outstanding for theperiod. Diluted earnings per common share is computed similarly to basic, except it reflects, in periods in which they have a dilutiveeffect, the effect of common shares issuable upon exercise of stock options using the treasury stock method.
Comprehensive Income
Comprehensive income includes certain gains and losses that, under generally accepted accounting principles, are excluded from netincome as these amounts are recorded directly as an adjustment to stockholders’ equity. Our comprehensive income is primarilycomprised of net income and foreign currency translation adjustments, but also includes unrealized gains (losses) on hedging activity andmarketable securities and a pension adjustment loss in 2003.
New Accounting Pronouncements
In December 2003, the FASB issued a revision to FAS No. 132, "Employers’ Disclosures about Pensions and Other PostretirementBenefits." This statement does not change the measurement or recognition aspects for pensions and other postretirement benefit plans;however, it does revise employers’ disclosures to include more information about the plan assets, obligations to pay benefits and fundingobligations. FAS 132, as revised, was effective for our 2003 consolidated financial statements. The adoption of FAS 132 did not have amaterial effect on our consolidated financial statements.
In May 2003, the FASB issued FAS No. 150, "Accounting for Certain Financial Instruments with Characteristics of both Liabilities andEquity." FAS No. 150 clarifies the definition of a liability as currently defined in FASB Concepts Statement No. 6, "Elements of FinancialStatements," as well as other planned revisions. This statement requires a financial instrument that embodies an obligation of an issuerto be classified as a liability. In addition, the statement establishes standards for the initial and subsequent measurement of these financialinstruments and disclosure requirements. FAS 150 was effective for financial instruments entered into or modified after May 31, 2003. Forall instruments entered into or last modified prior to May 31, 2003, FAS 150 was effective at the beginning of our third quarter of 2003.The adoption of FAS 150 did not have a material effect on our financial position or results of operations.
41

HENRY SCHEIN, INC.NOTES TO CONSOLIDATED FINANCIAL STATEMENTS (CONTINUED)
(In thousands, except share and per share data)
Note 1–Significant Accounting Policies (Continued)
In April 2003, the FASB issued FAS No. 149, "Amendment of Statement 133 on Derivative Instruments and Hedging Activities." FAS No.149 amends FAS No. 133 for decisions made by the FASB’s Derivatives Implementation Group, other FASB projects dealing with financialinstruments, and in response to implementation issues raised in relation to the application of the definition of a derivative. This statementis generally effective for contracts entered into or modified after June 30, 2003 and for hedging relationships designated after June 30,2003. The adoption of FAS 149 did not have a material effect on our financial position or results of operations.
In January 2003, the FASB issued Interpretation ("FIN") No. 46, "Consolidation of Variable Interest Entities" and in December 2003, arevised interpretation was issued (FIN No. 46(R)). In general, a variable interest entity ("VIE") is a corporation, partnership, trust, or anyother legal structure used for business purposes that either does not have equity investors with voting rights or has equity investors thatdo not provide sufficient financial resources for the entity to support its activities. FIN 46 requires a VIE to be consolidated by a companyif that company is designated as the primary beneficiary. Application of FIN 46 is required in financial statements of public entities thathave interest in structures that are commonly referred to as special-purpose entities, or SPEs, for periods ending after December 15, 2003.Application by public entities, other than small business issuers, for all other types of VIEs (i.e. non-SPEs) is required in financialstatements for periods ending after March 15, 2004. The adoption of FIN 46 did not have a material effect on our financial position orresults of operations.
In December 2002, the FASB issued FAS No. 148, "Accounting for Stock-Based Compensation – Transition and Disclosure." Thisstatement amends FAS No. 123, "Accounting for Stock-Based Compensation," to provide alternative methods of transition for a voluntarychange to the fair value based method of accounting for stock-based employee compensation. In addition, FAS 148 amends thedisclosure requirements of FAS 123 to require prominent disclosures in both annual and interim financial statements about the method ofaccounting for stock-based employee compensation and the effect of the method used on reported results. We adopted the disclosureprovisions of this standard.
In November 2002, the FASB reached a consensus regarding EITF Issue No. 00-21, "Revenue Arrangements with Multiple Deliverables."EITF 00-21 addresses accounting for arrangements that may involve the delivery or performance of multiple products, services, and/orrights to use assets. The guidance provided by EITF 00-21 is effective for contracts entered into on or after July 1, 2003. The adoptionof EITF 00-21 did not have a material effect on our financial position or results of operations.
In November 2002, the FASB issued FIN No. 45, "Guarantor’s Accounting and Disclosure Requirements for Guarantees, Including IndirectGuarantees of Indebtedness of Others". FIN 45 addresses the disclosures to be made by a guarantor in its interim and annual financialstatements about its obligations under certain guarantees. FIN 45 also clarifies that a guarantor is required to recognize, at the inceptionof a guarantee, a liability for the fair value of the obligation undertaken in issuing the guarantee. The disclosure requirements in thisInterpretation are effective for financial statements of interim or annual periods ending after December 15, 2002. The adoption of FIN 45did not have a material effect on our financial position or results of operations.
In June 2002, the FASB issued FAS 146, "Accounting for Costs Associated with Exit or Disposal Activities". This Statement addressesfinancial accounting and reporting for costs associated with exit or disposal activities and nullifies EITF Issue No. 94-3, "LiabilityRecognition for Certain Employee Termination Benefits and Other Costs to Exit an Activity (including Certain Costs Incurred in aRestructuring)". The principal difference between this Statement and EITF 94-3 relates to the Statement’s requirements for recognition ofa liability for a cost associated with an exit or disposal activity. This Statement requires that a liability for a cost associated with an exit ordisposal activity be recognized when the liability is incurred, whereas under EITF 94-3, a liability was recognized at the date of an entity’scommitment to an exit plan. This Statement is effective for exit or disposal activities that are initiated after December 31, 2002. Theadoption of FAS 146 did not have a material effect on our financial position or results of operations.
In June 2001, the FASB issued FAS No. 143, "Accounting for Asset Retirement Obligations," which addresses financial accountingrequirements for retirement obligations associated with tangible long-lived assets. In May 2002, the FASB issued FAS No. 145, "Rescissionof FASB Statements 4, 44, 64, Amendment to FASB Statement No. 13, and Technical Corrections as of April 2002." FAS 145 amends otherexisting authoritative pronouncements to make various technical corrections, clarify meanings, or describe their applicability underchanged conditions. FAS 143 and 145 were effective commencing April 1, 2003 and did not have a material effect on our financial positionor results of operations.
42

HENRY SCHEIN, INC.NOTES TO CONSOLIDATED FINANCIAL STATEMENTS (CONTINUED)
(In thousands, except share and per share data)
Note 2–Earnings Per Share
A reconciliation of shares used in calculating basic and diluted earnings per common share follows:
Years ended
December 27, December 28, December 29,2003 2002 2001
Basic 43,708,586 43,489,229 42,366,048
Effect of assumed conversion of stock options 1,279,162 1,382,965 1,179,061
Diluted 44,987,748 44,872,194 43,545,109
Weighted-average options to purchase 17,177, 30,322 and 1,142,556 shares of common stock at prices ranging from $52.51 to $68.83,$46.80 to $54.00 and $35.50 to $46.00 per share that were outstanding during 2003, 2002 and 2001 were excluded from the computationof diluted earnings per common share. In each of these periods, the options’ exercise prices exceeded the average market price of ourcommon stock.
Note 3–Investments in Marketable Securities
Investments in available-for-sale securities as of December 27, 2003 were as follows:
Gross Gross FairAmortized Unrealized Unrealized Market
Cost Gain Loss Value
Debt Securities recorded at market,maturing within one year
Municipal securities $ 3,012 $ –– $ –– $ 3,012
Total short-term 3,012 –– –– 3,012
Debt Securities recorded at market,
maturing between one and three years
U.S. government and agency securities 10,505 1 (22) 10,484
Municipal securities 1,000 –– –– 1,000
Total long-term 11,505 1 (22) 11,484
Total investments in marketable securities $14,517 $ 1 $ (22) $14,496
43

HENRY SCHEIN, INC.NOTES TO CONSOLIDATED FINANCIAL STATEMENTS (CONTINUED)
(In thousands, except share and per share data)
Note 3–Investments in Marketable Securities (Continued)
Investments in available-for-sale securities as of December 28, 2002 were as follows:
Gross Gross FairAmortized Unrealized Unrealized Market
Cost Gain Loss Value
Debt Securities recorded at market,
maturing within one year
U.S. government and agency securities $ 7,517 $ 68 $ –– $ 7,585
Municipal securities 14,512 4 –– 14,516
Corporate notes and bonds 9,106 2 –– 9,108
Total short-term 31,135 74 –– 31,209
Debt Securities recorded at market,
maturing between one and two years
U.S. government and agency securities 15,911 64 –– 15,975
Municipal securities 1,000 –– –– 1,000
Corporate notes and bonds 7,000 1 –– 7,001
Total long-term 23,911 65 –– 23,976
Total investments in marketable securities $55,046 $139 $ –– $55,185
We determine cost of investments on the specific identification basis. Proceeds from sales of available-for-sale securities were $40.6million in 2003 and $0 in 2002. Gross realized gains were $114 and gross realized losses were $26 in 2003. There was no gains or losseson the sales of securities in 2002. The securities held on December 27, 2003 had contractual maturities of up to three years. Thesecurities held on December 28, 2002 had contractual maturities of up to two years. Expected maturities of debt securities may differfrom contractual maturities because borrowers may have the right to call or prepay obligations with or without penalty.
Note 4–Property and Equipment, Net
Property and equipment consisted of the following:
December 27, December 28,
2003 2002
Land $ 7,754 $ 7,061
Buildings and leasehold improvements 64,410 62,724
Machinery and warehouse equipment 34,148 27,165
Furniture, fixtures and other 30,176 25,737
Computer equipment and software 150,193 121,364
286,681 244,051
Less accumulated depreciation and amortization (132,476) (101,519)
Property and equipment, net $154,205 $142,532
The net book value of equipment held under capital leases amounted to approximately $2.3 million and $930 as of December 27, 2003and December 28, 2002. Depreciation expense for 2003, 2002 and 2001 was $33.6 million, $27.2 million and $22.6 million.
44

HENRY SCHEIN, INC.NOTES TO CONSOLIDATED FINANCIAL STATEMENTS (CONTINUED)
(In thousands, except share and per share data)
Note 5–Goodwill and Other Intangibles, Net
The changes in the carrying amount of goodwill for the year ended December 27, 2003 were as follows:
Distribution Technology Total
Balance as of December 28, 2002 $302,352 $ 335 $302,687
Adjustments to goodwill:
Acquisitions 80,480 1,550 82,030
Divestiture (2,358) –– (2,358)
Foreign currency translation 17,621 –– 17,621
Other (1,092) –– (1,092)
Balance as of December 27, 2003 $397,003 $1,885 $398,888
The acquisition costs incurred during the year ended December 27, 2003 related to eight acquisitions, contingent earnout paymentsrelating to acquisitions made in prior years and increased ownership interests in consolidated subsidiaries.
With the adoption of FAS 142, we ceased amortization of goodwill as of December 30, 2001. The following table presents our results forall periods presented on a comparable basis applying the effects of the adoption of FAS 142 to the year ended December 29, 2001:
Years endedDecember 27, December 28, December 29,
2003 2002 2001
Net income $137,510 $117,987 $87,373
Add back goodwill amortization, net of tax –– –– 7,296
Adjusted net income $137,510 $117,987 $94,669
Diluted net income per common share:
Net income $ 3.06 $ 2.63 $ 2.01
Add back goodwill amortization, net of tax –– –– 0.17
Adjusted diluted net income per common share $ 3.06 $ 2.63 $ 2.18
Other intangible assets consisted of the following:
December 27, 2003 December 28, 2002 (1)
Accumulated AccumulatedCost Amortization Cost Amortization
Non-compete agreements $18,869 $ (5,021) $10,826 $ (3,549)
Trademarks and trade names 12,494 –– 71 ––
Customer relationships 11,547 (1,074) –– ––
Other 3,316 (2,580) 897 (584)
Total $46,226 $ (8,675) $11,794 $ (4,133)
(1) Reclassified to conform to current year presentation.
45
Healthcare

HENRY SCHEIN, INC.NOTES TO CONSOLIDATED FINANCIAL STATEMENTS (CONTINUED)
(In thousands, except share and per share data)
Note 5–Goodwill and Other Intangibles, Net (Continued)
Trademarks and trade names and customer relationships were primarily related to acquisitions made during the year ended December27, 2003. Trademarks and trade names are deemed indefinite-lived intangible assets and are not amortized. Customer relationships aredefinite-lived intangible assets which are amortized on a straight-line basis over a weighted-average period of 5.3 years as of December27, 2003.
Amortization of definite-lived intangible assets for the years ended December 27, 2003, December 28, 2002 and December 29, 2001 was $3.2 million, $1.1 million and $1.3 million. The annual amortization expense expected for the years 2004 through 2008 is $4.6 million,$3.5 million, $2.6 million, $1.9 million and $1.4 million.
Note 6–Investments and Other
Investments and other consisted of the following:
December 27, December 28,2003 2002
Long-term note receivables (1) $35,434 $39,566
Investments in long-term marketable securities 11,484 23,976
Deposit on long-term inventory purchase agreement 6,899 ––
Investment in unconsolidated affiliates 5,538 4,728
Non-current deferred income tax asset 4,200 ––
Other 8,687 9,373
$72,242 $77,643
(1) Long-term note receivables carry interest rates ranging from 2.6% to 12.0% and are due in varying installments through 2020. Long-term note receivables include notes arising from the sale of certain businesses in prior years of approximately $19.7 million in 2003and $22.5 million in 2002.
Note 7–Business Acquisitions and Divestiture
On January 8, 2004, we entered into agreements to purchase demedis GmbH ("demedis"), a leading full-service distributor of dentalconsumables and equipment in Germany, Austria, and the Benelux countries, and Euro Dental Holding GmbH ("EDH"), which includesKRUGG S.p.A., Italy's leading distributor of dental consumable products and DentalMV GmbH (otherwise know as Muller & Weygandt),one of Europe's leading direct marketing distributors of dental consumable products. Thirty-five million euros of the purchase price ofapproximately 255 million euros was paid on January 20, 2004. The remainder of the purchase price of approximately 220 million eurosis payable in cash and due at closing.
During the year ended December 27, 2003, we acquired eight healthcare distribution businesses, which were not considered material oneither an individual or aggregate basis. On May 28, 2003, we acquired all of the outstanding common stock of Hager Dental GmbH, adental distributor of consumable supplies and equipment located in Germany. On June 2, 2003, we acquired the assets of ColonialSurgical Supply, Inc., a United States dental distributor of consumable supplies, primarily examination gloves. On November 17, 2003we acquired Damer & Cartwright Pharmaceutical, Inc. and American Medical Services, Inc., specialty pharmaceutical distributors in theUnited States.
The 2002 reported net sales were over $50.0 million for Hager Dental, over $40.0 million for Colonial Surgical and over $100.0 million forDamer & Cartwright and American Medical Services. The acquisitions were accounted for under the purchase method of accounting andhave been included in our consolidated financial statements from their respective acquisition dates.
On August 29, 2003, we sold PMA Bode GmbH, an x-ray film distribution business located in Germany, which was a component of ourhealthcare distribution business segment. PMA Bode generated annual net sales of approximately $31.0 million. The loss recorded onthe sale of PMA Bode was approximately $2.0 million (net of $54 tax benefit) and is presented separately as a loss on sale of discontinuedoperation in our statements of income. Due to immateriality, we have not reflected the operating results of PMA Bode separately as adiscontinued operation for any of the periods presented.
46

HENRY SCHEIN, INC. AND SUBSIDIARIESNOTES TO CONSOLIDATED FINANCIAL STATEMENTS (CONTINUED)
(In thousands, except share and per share data)
Note 7–Business Acquisitions and Divestiture (Continued)
During the year ended December 28, 2002, we purchased additional interests in three consolidated subsidiaries in Europe. Thesepurchases were not considered material either individually or in the aggregate.
During the year ended December 29, 2001, we completed the acquisition of two healthcare distribution businesses, which included thepurchase of the remaining 50% interest of an affiliate. Neither of these purchases was considered material either individually or in theaggregate. The two transactions were accounted for under the purchase method of accounting and have been included in theconsolidated financial statements from their respective acquisition dates.
Note 8–Debt
Bank Credit Lines
We have a Revolving Credit Facility of $200.0 million that is a committed line scheduled to terminate in May 2006. The interest rate isbased on LIBOR, or prime, as defined in the agreement, which were 1.1% and 4.0% at December 27, 2003. The agreement provides,among other things, that we maintain certain interest coverage and maximum leverage ratios, and contains restrictions relating to annualdividends in excess of $25.0 million, guarantees of subsidiary debt, investments in subsidiaries, mergers and acquisitions, liens, certainchanges in ownership and employee and shareholder loans. There were no borrowings under this credit facility as of December 27, 2003.
As of December 27, 2003, certain of our subsidiaries had available various short-term bank credit lines totaling approximately $32.6 millionexpiring through October 2004. Borrowings of $6.1 million under these credit lines, bear interest at rates ranging from 2.8% to 6.5%, andwere collateralized by accounts receivable, inventory and property and equipment with an aggregate net book value of $73.9 million atDecember 27, 2003.
In connection with our pending acquisition of demedis and EDH for approximately 255 million euros, as discussed in Note 7, we will bepaying approximately 220 million euros at closing. The remaining purchase price will be paid from existing cash resources and/or theproceeds of (i) a bridge loan and/or (ii) the issuance or sale in a public or private placement of equity interests or notes, debentures orother debt securities (or another debt financing) with a maturity in excess of one year (in any case, a "Permanent Financing"). We haveobtained commitments for a $150.0 million bridge loan facility scheduled to mature on the six-month anniversary of the closing of theacquisition. The bridge loan will be unsecured, and will bear interest, at our option, at LIBOR plus 0.925% or the prime rate. We intendto refinance the bridge loan by means of a Permanent Financing or, if a Permanent Financing can be arranged prior to the consummationof the Acquisition, we will pay the purchase price with the proceeds of such Permanent Financing. The acquisition is subject to standardclosing conditions and regulatory approvals and is expected to close mid-year 2004.
Long-term debt
Long-term debt consisted of the following:
As of As of December 27, December 28,
2003 2002
Senior Notes $230,741 $230,000
Notes payable to banks, interest rates ranging from 3.9% to 9.0%,
payable in quarterly installments ranging from $5 to $102
through 2019 12,494 11,667
Various uncollateralized loans payable with interest, in varying
installments through 2006 4,780 1,509
Capital lease obligations (see Note 13) 2,338 2,047
Total 250,353 245,223
Less current maturities (3,253) (2,662)
Total long-term debt $247,100 $242,561
47

HENRY SCHEIN, INC.NOTES TO CONSOLIDATED FINANCIAL STATEMENTS (CONTINUED)
(In thousands, except share and per share data)
Note 8–Debt (Continued)
As of December 27, 2003, the aggregate amounts of long-term debt maturing in each of the next five years are as follows: 2004 - $3.3million; 2005 - $3.3 million; 2006 - $22.0 million; 2007 - $21.9 million; 2008 - $20.8 million.
In prior years, we completed private placement transactions under which we issued $130.0 million and $100.0 million in Senior Notes.The $130.0 million notes mature on June 30, 2009 and bear interest at a rate of 6.94% per annum. Principal payments on the $100.0million notes totaling $20.0 million annually are due starting September 25, 2006 and bear interest at a rate of 6.66% per annum. Intereston both notes is payable semi-annually.
During the year ended December 27, 2003, we entered into interest rate swap agreements relating to our $230.0 million Senior Notes toexchange our fixed interest rates for variable interest rates. The weighted-average variable interest rate was 4.25% as of December 27,2003. This variable rate is comprised of LIBOR plus the spreads and resets on the interest due dates of the Senior Notes.
The agreement governing our Senior Notes provides, among other things, that we will maintain on a consolidated basis, certain leverageand priority debt ratios and a minimum net worth. The agreement also contains restrictions relating to transactions with affiliates, annualdividends, mergers and acquisitions and liens.
Note 9 – Taxes on Income
Taxes on income are based on income before taxes on income, minority interest, equity in earnings of affiliates and loss on sale of adiscontinued operation were as follows:
Years ended
December 27, December 28, December 29,2003 2002 2001
Domestic $214,283 $186,134 $140,675
Foreign 11,493 4,295 (324)
Total $225,776 $190,429 $140,351
The provision (benefit) for taxes on income from continuing operations was as follows:
Years ended
December 27, December 28, December 29,2003 2002 2001
Current tax expense:
U.S. Federal $61,383 $59,254 $46,225
State and local 10,680 9,223 3,806
Foreign 6,791 1,807 1,607
Total current 78,854 70,284 51,638
Deferred tax expense (benefit):
U.S. Federal 7,088 (1,196) (162)
State and local 1,141 (151) 234
Foreign (2,705) 1,573 220
Total deferred 5,524 226 292
Total provision $84,378 $70,510 $51,930
48

HENRY SCHEIN, INC.NOTES TO CONSOLIDATED FINANCIAL STATEMENTS (CONTINUED)
(In thousands, except share and per share data)
Note 9– Taxes on Income (Continued)
The tax effects of temporary differences that give rise to our deferred tax asset (liability) were as follows:
December 27, December 28,2003 2002
Current deferred tax assets:
Inventory, premium coupon redemptions and accounts receivable
valuation allowances $17,021 $18,991
Uniform capitalization adjustments to inventories 4,365 3,473
Other accrued liabilities 9,173 7,455
Total current deferred tax asset 30,559 29,919
Non-current deferred tax asset (liability):
Property and equipment (18,980) (14,590)
Provision for other long-term liabilities (26,593) (17,723)
Net operating loss carryforward 1,981 1,318
Net operating losses of foreign subsidiaries 15,552 11,221
Total non-current deferred tax liability (28,040) (19,774)
Valuation allowance for non-current deferred tax assets (1) (698) (1,842)
Net non-current deferred tax liability (28,738) (21,616)
Net deferred tax asset $ 1,821 $ 8,303
(1) Primarily relates to operating losses of foreign subsidiaries.
The net deferred tax asset is realizable as we have sufficient taxable income in prior years to realize the tax benefit for deductibletemporary differences. The non-current deferred tax liability is included in "Other liabilities" on the accompanying consolidated balancesheets.
As of December 27, 2003, we have domestic unconsolidated net operating loss carry forwards of $5.0 million, which are available to offsetfuture federal taxable income through 2023. Foreign net operating losses totaled $43.5 million as of December 27, 2003. Such lossescan be utilized against future foreign income and have an indefinite life.
The tax provisions differ from the amount computed using the federal statutory income tax rate as follows:
Years ended
December 27, December 28, December 29,2003 2002 2001
Income tax provision at federal statutory rate $79,020 $66,652 $49,122
State income taxes, net of federal income tax effect 7,684 5,897 2,626
Change in valuation reserve and other (2,326) (2,039) 182
Total income tax provision $84,378 $70,510 $51,930
49

HENRY SCHEIN, INC.NOTES TO CONSOLIDATED FINANCIAL STATEMENTS (CONTINUED)
(In thousands, except share and per share data)
Note 9–Taxes on Income (Continued)
Provision has not been made for U.S. or additional foreign taxes on undistributed earnings of foreign subsidiaries, which have been andwill continue to be reinvested. These earnings could become subject to additional tax if they were remitted as dividends, if foreignearnings were loaned to us or a U.S. affiliate, or if we should sell our stock in the foreign subsidiaries. It is not practicable to determinethe amount of additional tax, if any, that might be payable on the foreign earnings; however, we believe that foreign tax credits wouldsubstantially offset any U.S. tax liabilities. As of December 27, 2003, the cumulative amount of reinvested earnings was approximately$9.8 million.
Note 10–Financial Instruments and Concentrations of Credit Risk
Financial Instruments
The following methods and assumptions were used to estimate the fair value of each class of financial instruments for which it ispracticable to estimate that value:
Cash equivalents, trade receivables and short-term investments – Due to the short-term maturity of such instruments, the carrying amountsare a reasonable estimate of fair value.
Long-term investments and notes receivable – The fair values of long-term marketable securities are estimated based on quoted marketprices for those investments. Such instruments are carried at fair value on the balance sheet. For investments in unconsolidated affiliatesand notes receivable there are no quoted market prices available; however, we believe the carrying amounts are a reasonable estimateof fair value.
Long-term debt – The fair value of our long-term debt is estimated based on the quoted market prices for similar issues. The fair valueof our long-term debt as of December 27, 2003 and December 28, 2002 was estimated at $250.4 million and $245.2 million.
Derivative instruments – The fair value of foreign currency forward contracts and interest rate swap agreements are estimated by obtainingquotes from brokers. Such instruments are carried at fair value on the balance sheet. The fair value of our foreign currency forwardcontracts as of December 27, 2003 and December 28, 2002 were estimated at $114.9 million and $78.0 million which approximatedcontract value. The fair value of our interest rate swap agreements as of December 27, 2003 were estimated at $1.6 million. The fair valueof interest rate swap agreements are the estimated amounts we would pay or receive to terminate the agreements at the reporting date,taking into account current interest rates, market expectations for future interest rates and our current creditworthiness.
Concentrations of Credit Risk
Certain financial instruments potentially subject us to concentrations of credit risk. These financial instruments consist primarily of cashequivalents, trade receivables, short-term investments, long-term investments, notes receivable and derivative instruments. In all cases,our maximum exposure to loss from credit risk equals the gross fair value of the financial instruments. We continuously assess the needfor reserves for such losses, which have historically been within our expectations. We do not require collateral or other security to supportfinancial instruments subject to credit risk, except for long-term notes receivable.
With respect to our cash equivalents, short-term and long-term investments and derivative instruments, our credit risk is limited due to ourcounter-parties being high-credit quality financial institutions. As a risk management policy, we limit the amount of credit exposure byutilizing numerous different counter-parties.
With respect to our trade receivables, our credit risk is somewhat limited due to a relatively large customer base and its dispersion acrossdifferent types of healthcare professionals and geographic areas. We do have some concentrations of credit risk associated with our salesto hospitals; however, such credit risks are somewhat mitigated by our method of monitoring credit-worthiness and collectability of largeraccounts on a customer-by-customer basis. No single customer accounted for more than 1.3% of our net sales in 2003.
Our long-term note receivables represent strategic financing arrangements with certain industry affiliates and amounts owed to us fromsales of certain businesses. Generally, these notes are secured by certain assets of the counter-party; however, in most cases our securityis subordinate to other commercial financial institutions. While we have exposure to credit loss in the event of non-performance by thesecounter-parties, we conduct ongoing assessments of their financial and operational performance.
50

HENRY SCHEIN, INC.NOTES TO CONSOLIDATED FINANCIAL STATEMENTS (CONTINUED)
(In thousands, except share and per share data)
Note 11–Segment and Geographic Data
Our reportable segments are strategic business units that offer different products and services to the same customer base. We conductour business through two segments: healthcare distribution and technology.
Our healthcare distribution segment, which is comprised of our dental, medical (including veterinary) and international business groups,distributes healthcare products (primarily consumable) and services primarily to office-based healthcare practitioners and professionalsin the United States, Canada and international markets. Products, which are similar for each business group, are maintained anddistributed from strategically located distribution centers.
Our technology segment consists primarily of our practice management software business and certain other value-added products andservices that are distributed primarily to healthcare professionals in the United States and Canada. Most of the technology business,including members of its management, was acquired as a unit.
The following tables summarize information by business segment:
Years ended
December 27, December 28, December 29,2003 2002 2001
Net Sales:
Healthcare distribution (1):
Dental (2) $1,364,812 $1,227,273 $1,121,394
Medical (3) 1,338,084 1,093,956 982,569
International (4) 576,628 437,046 398,071
Total healthcare distribution 3,279,524 2,758,275 2,502,034
Technology (5) 74,281 66,726 56,209
Total $3,353,805 $2,825,001 $2,558,243
(1) Consists of consumable products, small equipment, laboratory products, large dental equipment, branded and genericpharmaceuticals, surgical products, diagnostic tests, infection control products and vitamins.
(2) Consists of products sold in the United States and Canada.
(3) Consists of products sold in the United States’ Medical and Veterinary markets.
(4) Consists of products sold in Dental, Medical and Veterinary markets, primarily in Europe.
(5) Consists of practice management software and other value-added products and services, which are distributed primarily tohealthcare professionals in the United States and Canada.
51

HENRY SCHEIN, INC.NOTES TO CONSOLIDATED FINANCIAL STATEMENTS (CONTINUED)
(In thousands, except share and per share data)
Note 11–Segment and Geographic Data (Continued)
Years ended
December 27, December 28, December 29,2003 2002 2001 (1)
Operating Income:
Healthcare distribution $205,029 $170,987 $128,337
Technology 28,690 26,016 19,413
Total $233,719 $197,003 $147,750
Interest Income:
Healthcare distribution $ 8,662 $ 10,354 $ 9,565
Technology 5,231 4,022 2,494
Total $ 13,893 $ 14,376 $ 12,059
Interest Expense:
Healthcare distribution $ 18,311 $ 18,012 $ 18,814
Technology 5,147 3,878 491
Total $ 23,458 $ 21,890 $ 19,305
Depreciation and Amortization:
Healthcare distribution $ 34,067 $ 25,978 $ 34,412
Technology 2,776 2,294 1,230
Total $ 36,843 $ 28,272 $ 35,642
Capital Expenditures:
Healthcare distribution $ 37,485 $ 46,641 $ 45,428
Technology 1,493 902 699
Total $ 38,978 $ 47,543 $ 46,127
December 27, December 28, December 29,2003 2002 2001 (1)
Total Assets:
Healthcare distribution $1,798,857 $1,533,529 $1,369,241
Technology 134,615 106,319 75,030
Total $1,933,472 $1,639,848 $1,444,271
(1) Reclassified to conform to current year presentation.
52

HENRY SCHEIN, INC.NOTES TO CONSOLIDATED FINANCIAL STATEMENTS (CONTINUED)
(In thousands, except share and per share data)
Note 11–Segment and Geographic Data (Continued)
The following table reconciles segment totals to consolidated totals as of and for the years ended December 27, 2003, December 28,2002 and December 29, 2001:
2003 2002 2001 (1)
Total Assets:
Total assets for reportable segments $1,933,472 $1,639,848 $1,444,271
Receivables due from healthcare distribution segment (113,629) (80,855) (57,685)
Receivables due from technology segment (473) (941) (1,158)
Consolidated assets $1,819,370 $1,558,052 $1,385,428
Interest Income:
Total interest income for reportable segments $ 13,893 $ 14,376 $ 12,059
Interest on receivables due from healthcare distribution segment (5,147) (3,878) (1,737)
Interest on receivables due from technology segment –– (52) (244)
Consolidated interest income $ 8,746 $ 10,446 $ 10,078
Interest Expense:
Total interest expense for reportable segments $ 23,458 $ 21,890 $ 19,305
Interest on payables due to healthcare distribution segment –– (52) (244)
Interest on payables due to technology segment (5,147) (3,878) (1,737)
Consolidated interest expense $ 18,311 $ 17,960 $ 17,324
(1) Reclassified to conform to current year presentation.
The following table presents information about us by geographic area as of, and for the three years ended December 27, 2003. Net salesby geographic area are based on the respective locations of our subsidiaries. No individual country, except for the United States,generated net sales greater than 10% of consolidated net sales. There were no material amounts of sales or transfers among geographicareas and there were no material amounts of United States export sales.
2003 2002 (1) 2001 (1)Long-Lived Long-Lived Long-Lived
Net Sales Assets Net Sales Assets Net Sales Assets
United States $2,708,195 $403,629 $2,333,347 $318,323 $2,114,623 $292,281
Foreign 645,610 187,015 491,654 134,557 443,620 113,703
Consolidated Total $3,353,805 $590,644 $2,825,001 $452,880 $2,558,243 $405,984
(1) Reclassified to conform to current year presentation.
Our subsidiary located in Germany had long-lived assets of $119.0 million, $85.2 million and $71.8 million as of December 27, 2003,December 28, 2002 and December 29, 2001.
53

HENRY SCHEIN, INC.NOTES TO CONSOLIDATED FINANCIAL STATEMENTS (CONTINUED)
(In thousands, except share and per share data)
Note 12–Stockholders’ Equity
(a) Common Stock Purchase Rights
On November 30, 1998, our Board of Directors adopted a Stockholder Rights Plan (the "Rights Plan"), and declared a dividend under theRights Plan of one common stock purchase right (a "Right") on each outstanding share of our common stock. Until the occurrence ofcertain events, each share of common stock that is issued will also have attached to it a Right. The Rights provide, in substance, thatshould any person or group acquire 15% or more of our outstanding common stock after the date of adoption of the Rights Plan, eachRight, other than Rights held by the acquiring person or group, would entitle its holder to purchase a certain number of shares of commonstock for 50% of the then-current market value of the common stock. Unless a 15% acquisition has occurred, we may redeem the Rightsat any time prior to the termination date of the Rights Plan. This Right to purchase the common stock at a discount will not be triggeredby a person’s or group’s acquisition of 15% or more of the common stock pursuant to a tender or exchange offer which is for all outstandingshares at a price and on terms that the Board of Directors determines (prior to acquisition) to be adequate and in the stockholders’ bestinterests. In addition, the Right will not be triggered by the positions of existing shareholders.
Certain business combinations involving an acquiring person or its affiliates will trigger an additional feature of the Rights. Each Right,other than Rights held by the acquiring person or group, will entitle its holder to purchase a certain number of shares of common stock ofthe acquiring person at a price equal to 50% of the market value of such shares at the time of exercise. Initially, the Rights will be attachedto, and trade with, the certificates representing our outstanding shares of common stock and no separate certificates representing theRights will be distributed. The Rights will become exercisable only if a person or group acquires, or commences a tender or exchangeoffer for, 15% or more of our common stock.
The Board of Directors may, at its option, redeem all but not less than all of the then outstanding Rights at a redemption price of $0.01 perRight at any time prior to the earlier of (a) any person or group acquiring 15% or more of our common stock or (b) the final expiration dateof November 30, 2008.
(b) Stock Options
We established the 1994 Stock Option Plan (the "Plan") for the benefit of certain employees. As amended in June 2003, pursuant to thisplan we may issue up to approximately 8,579,635 shares of our common stock. The Plan provides for two classes of options: Class Aoptions and Class B options. A maximum of 237,897 shares of common stock may be covered by Class A options. Both incentive andnon-qualified stock options may be issued under the Plan.
In 1995, Class A options to acquire 237,897 common shares were issued to certain executive management at an exercise price of $4.21per share, substantially all of which became exercisable upon the closing of our initial public offering which was on November 3, 1995.The exercise price of all Class B options issued has been equal to the market price on the date of grant, and accordingly, no compensationcost has been recognized. Substantially all Class B options vest evenly over three years from the date of grant; however shares exercisedin the second and third year after the date of grant may not be sold until the third anniversary of the date of grant. Class B options expireon the tenth anniversary of the date of issuance, subject to acceleration upon termination of employment.
On May 8, 1996, our stockholders approved the 1996 Non-Employee Director Stock Option Plan. As amended in June 2003, pursuant tothis plan we may grant options to each director who is not also an officer or employee, for up to 200,000 shares of our common stock.The exercise price and term, not to exceed 10 years, of each option is determined by the plan committee at the time of the grant. During2003, 2002 and 2001, 50,000, 40,000 and 12,000 options, were granted to certain non-employee directors at exercise prices equal to themarket price on the date of grant.
Additionally, in 1997 as a result of our acquisition of Sullivan Dental Products, Inc. and Micro Bio-Medics, Inc., we assumed their respectivestock option plans (the "Assumed Plans"). Options granted under the Assumed Plans of 1,218,000 and 1,117,000, which are convertibleinto our common stock, are exercisable for up to ten years from the date of grant at prices not less than the fair market value of therespective acquirees’ common stock at the date of grant.
54

HENRY SCHEIN, INC.NOTES TO CONSOLIDATED FINANCIAL STATEMENTS (CONTINUED)
(In thousands, except share and per share data)
Note 12–Stockholders’ Equity (Continued)
A summary of the status of our stock option plans, including the Assumed Plans, is presented below:
Years ended
December 27, 2003 December 28, 2002 December 29, 2001Weighted Weighted WeightedAverage Average AverageExercise Exercise Exercise
Shares Price Shares Price Shares Price
Outstanding at beginning
of year 4,281,425 $29.20 4,646,271 $26.04 4,650,722 $24.59
Granted 1,096,050 40.30 1,017,850 41.37 883,600 28.73
Exercised (1,078,075) 20.73 (1,271,528) 26.69 (736,923) 19.21
Forfeited (65,694) 33.48 (111,168) 37.56 (151,128) 30.26
Outstanding at end
of year 4,233,706 $34.16 4,281,425 $29.20 4,646,271 $26.04
Options exercisable at
end of year 2,995,383 $31.55 3,183,593 $26.44 3,722,164 $26.53
The following table summarizes information about stock options outstanding at December 27, 2003:
Options Outstanding Options Exercisable
Weighted AverageRemaining Weighted Weighted
Number Contractual Life Average Exercise Number Average ExerciseOutstanding in Years Price Exercisable Price
Range of Exercise Prices
$4.21 to $19.76 429,940 4.7 $13.80 429,940 $13.80
20.16 to 30.06 1,068,491 6.5 27.30 1,020,961 27.24
31.13 to 45.59 2,610,075 7.6 39.32 1,507,526 39.10
45.96 to 68.83 125,200 9.1 55.11 36,956 49.57
4,233,706 7.1 34.16 2,995,383 31.55
(c) Employee Benefit Plans
401(k) Plan
We offer qualified, fully-funded 401(k) plans to substantially all our domestic full-time employees. As determined by our Board of Directors,matching contributions to these plans are equal to 100% of the participants’ contributions up to 7% of their base compensation. Matchingcontributions include both cash and our common stock. Forfeitures attributable to participants whose employment terminates prior tobecoming fully vested are used to reduce our matching contributions.
Assets of the 401(k) plans are held in self-directed accounts enabling participants to choose from various investment fund options.Matching contributions to these plans charged to operations during 2003, 2002 and 2001 amounted to $7.6 million, $5.3 million and $4.1million.
55

HENRY SCHEIN, INC.NOTES TO CONSOLIDATED FINANCIAL STATEMENTS (CONTINUED)
(In thousands, except share and per share data)
Note 12–Stockholders’ Equity (Continued)
Supplemental Executive Retirement Plan
We offer an unfunded, non-qualified supplemental executive retirement plan to eligible employees. This plan generally covers officersand certain highly-compensated employees after they have reached the maximum IRS allowed pre-tax 401(k) contribution limit. Ourcontributions to this plan are equal to the 401(k) employee-elected contribution percentage applied to base compensation for the portionof the year in which such employees are not eligible to make pre-tax contributions to the 401(k) plan. The increases in plan value thatwere charged to operations during 2003, 2002 and 2001 amounted to $839, $707 and $426.
Note 13–Commitments and Contingencies
Operating Leases
We lease facilities and equipment under non-cancelable operating leases expiring through 2016. We expect that in the normal course ofbusiness, leases will be renewed or replaced by other leases.
Future minimum annual rental payments under our non-cancelable operating leases as of December 27, 2003 were:
2004 $ 22,286
2005 20,027
2006 15,321
2007 11,770
2008 8,955
Thereafter 24,419
Total minimum operating lease payments $102,778
Total rental expense for 2003, 2002 and 2001 was $26.9 million, $25.8 million, and $26.1 million.
Capital Leases
We lease certain equipment under capital leases. Future minimum annual lease payments under our capital leases together with thepresent value of the net minimum lease payments as of December 27, 2003 were:
2004 $ 718
2005 864
2006 273
2007 245
2008 206
Thereafter 411
Total minimum capital lease payments 2,717
Less: Amount representing interest at 5.0% to 11.3% (379)
Total minimum capital lease payments $2,338
56

HENRY SCHEIN, INC.NOTES TO CONSOLIDATED FINANCIAL STATEMENTS (CONTINUED)
(In thousands, except share and per share data)
Note 13–Commitments and Contingencies (Continued)
Purchase Commitments
In our healthcare distribution business, we sometimes enter into long-term purchase commitments to ensure the availability of productsfor distribution. Future minimum annual payments for inventory purchase commitments as of December 27, 2003 were:
2004 $149,891
2005 128,495
2006 945
2007 ––
2008 ––
Thereafter ––
Total minimum inventory purchase commitment payments $279,331
Litigation
Our business involves a risk of product liability claims and other claims in the ordinary course of business, and from time to time we arenamed as a defendant in cases as a result of our distribution of pharmaceutical and other healthcare products. As a business practice,we generally obtain product indemnification from our suppliers for manufactured products.
We have various insurance policies, including product liability insurance, covering risks and in amounts we consider adequate. In manycases in which we have been sued in connection with products manufactured by others, the manufacturer provides us withindemnification. There can be no assurance that the insurance coverage we maintain is sufficient or will be available in adequate amountsor at a reasonable cost, or that indemnification agreements will provide us with adequate protection. In our opinion, all pending matters,including those described below, are covered by insurance or will not otherwise seriously harm our financial condition.
Product Liability Claims
As of December 27, 2003, we were a defendant in approximately 16 product liability cases. Of these cases, 11 involve claims made byhealthcare workers who claim allergic reaction relating to exposure to latex gloves. In each of these cases, we acted as a distributor ofbrand name and/or "Henry Schein" private brand latex gloves, which were manufactured by third parties. To date, discovery in thesecases has generally been limited to product identification issues. The manufacturers in these cases have withheld indemnification of uspending product identification; however, we have impleaded or filed cross claims against those manufacturers in each case in which weare a defendant.
As of December 27, 2003, we had accrued our best estimate of potential losses relating to product liability claims for which we were ableto determine a reasonable estimated loss. This accrued amount was not material to our financial position, results of operations or cashflows. Our method for determining estimated losses considers currently available facts, presently enacted laws and regulations and otherexternal factors, including potential recoveries from third parties.
Texas Class Action
On January 27, 1998, in District Court in Travis County, Texas, we and one of our subsidiaries were named as defendants in a matterentitled "Shelly E. Stromboe and Jeanne Taylor, on Behalf of Themselves and all others Similarly Situated vs. Henry Schein, Inc., EasyDental Systems, Inc. and Dentisoft, Inc.", Case No. 98-00886. The petition alleges, among other things, negligence, breach of contract,fraud, and violations of certain Texas commercial statutes involving the sale of certain practice management software products sold priorto 1998 under the Easy Dental® name.
57

HENRY SCHEIN, INC.NOTES TO CONSOLIDATED FINANCIAL STATEMENTS (CONTINUED)
(In thousands, except share and per share data)
Note 13–Commitments and Contingencies (Continued)
In October 1999, the trial court, on motion, certified both a Windows® sub-class and a DOS sub-class to proceed as a class actionpursuant to Tex. R. Civ. P. 42. It is estimated that approximately 5,000 Windows® customers and approximately 10,000 DOS customerswere covered by the class action that was certified by the trial court. In November of 1999, we filed an interlocutory appeal of the trialcourt’s determination to the Texas Court of Appeals on the issue of whether this case was properly certified as a class action. OnSeptember 14, 2000, the Court of Appeals affirmed the trial court’s certification order. On January 5, 2001, we filed a Petition for Reviewin the Texas Supreme Court asking the Court to find that it had "conflicts jurisdiction" to permit review of the trial court’s certification order.The Texas Supreme Court heard oral argument on February 6, 2002. On October 31, 2002, the Texas Supreme Court issued an opinionin the case holding that it had conflicts jurisdiction to review the decision of the Court of Appeals and the finding that the trial court’scertification of the case as a class action was improper. The Texas Supreme Court further held that the judgment of the Court of Appeals,which affirmed the class certification order, must be reversed in its entirety. Upon reversal of the class certification order, the TexasSupreme Court remanded the case to the trial court for further proceedings consistent with its opinion.
On January 31, 2003, counsel for the class filed a Motion for Rehearing with the Texas Supreme Court seeking a reversal of the SupremeCourt’s earlier opinion reversing the class certification order. On May 8, 2003, the Texas Supreme Court denied the Motion for Rehearing,letting stand its opinion dated October 31, 2002, which decertified both sub-classes in their entirety. On August 29, 2003, class counselfiled amended papers seeking certification of an amended Windows® class and an amended DOS class. The only claim asserted forclass certification by the Windows® class was for the alleged breach of the implied warranty of merchantability. The only claim assertedfor class certification by the DOS class were claims for alleged violations of the Texas Unsolicited Goods Statute and the FederalUnordered Merchandise Act. Defendants filed motions for partial summary judgment as to the claims asserted on behalf of the Windows®Class and the DOS Class. A hearing on Defendants’ Motions for Partial Summary Judgment and Plaintiffs’ Amended Motion to Certify aClass was held on November 18-20, 2003. By Order dated December 10, 2003, the trial court (1) denied Defendants’ Motion for PartialSummary Judgment on the Windows® Class claims; (2) granted Defendants’ Motion for Partial Summary Judgment on the DOS Classclaims. By granting summary judgment on the claims asserted on behalf of the DOS class, the DOS motion for class certification becamemoot because certain class claims asserted by the named class representatives for the DOS class were found to be without merit. ByOrder dated January 13, 2004, the trial court denied the amended motion for class certification filed by the Windows® Class in its entirety.The deadline for the Windows® Class to file an interlocutory appeal of the denial of the amended motion for class certification was February2, 2004. No appeal was filed on or before that date. As a result of the favorable rulings obtained in the trial court, only certain individualclaims asserted on behalf of the named plaintiffs remain pending in this case.
Purported Class Action in New Jersey
In February 2002, we were served with a summons and complaint in an action commenced in the Superior Court of New Jersey, LawDivision, Morris County, entitled "West Morris Pediatrics, P.A. and Avenel-Iselin Medical Group, P.A. vs. Henry Schein, Inc., doing businessas Caligor", Case No. MRS-L-421-02. The plaintiffs’ complaint purports to be on behalf of a nationwide class, but there has been no courtdetermination that the case may proceed as a class action. Plaintiffs seek to represent a class of all physicians, hospitals and otherhealthcare providers throughout New Jersey and across the United States. This complaint, as amended in August 2002, alleges, amongother things, breach of oral contract, breach of implied covenant of good faith and fair dealing, violation of the New Jersey ConsumerFraud Act, unjust enrichment, conversion and promissory estoppel relating to sales of a vaccine product in the year 2001. We filed ananswer in October 2002. Because the plaintiffs have not specified damages, it is not possible to determine the range of damages or otherrelief sought by the plaintiffs. We intend to vigorously defend ourselves against this claim, as well as all other claims, suits and complaints.
Employment, Consulting and Non-Compete Agreements
We have employment, consulting and non-compete agreements expiring through 2007, except for a lifetime consulting agreement with aformer principal stockholder, which provides for current compensation of $308 per year, increasing $25 every fifth year with the nextincrease in 2007. The agreements provide for varying base aggregate annual payments of approximately $2.5 million, which decreaseperiodically to approximately $344. In addition, some agreements have provisions for incentive and additional compensation.
58
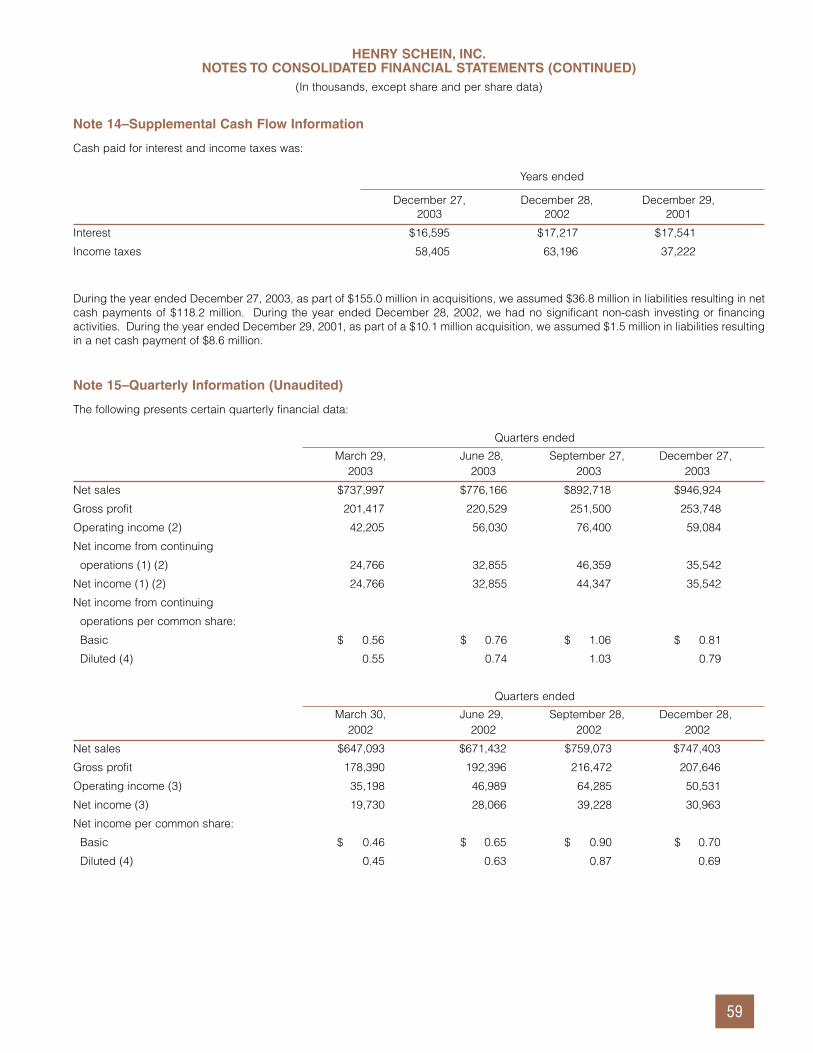
HENRY SCHEIN, INC.NOTES TO CONSOLIDATED FINANCIAL STATEMENTS (CONTINUED)
(In thousands, except share and per share data)
Note 14–Supplemental Cash Flow Information
Cash paid for interest and income taxes was:
Years ended
December 27, December 28, December 29,2003 2002 2001
Interest $16,595 $17,217 $17,541
Income taxes 58,405 63,196 37,222
During the year ended December 27, 2003, as part of $155.0 million in acquisitions, we assumed $36.8 million in liabilities resulting in netcash payments of $118.2 million. During the year ended December 28, 2002, we had no significant non-cash investing or financingactivities. During the year ended December 29, 2001, as part of a $10.1 million acquisition, we assumed $1.5 million in liabilities resultingin a net cash payment of $8.6 million.
Note 15–Quarterly Information (Unaudited)
The following presents certain quarterly financial data:
Quarters ended
March 29, June 28, September 27, December 27,2003 2003 2003 2003
Net sales $737,997 $776,166 $892,718 $946,924
Gross profit 201,417 220,529 251,500 253,748
Operating income (2) 42,205 56,030 76,400 59,084
Net income from continuing
operations (1) (2) 24,766 32,855 46,359 35,542
Net income (1) (2) 24,766 32,855 44,347 35,542
Net income from continuing
operations per common share:
Basic $ 0.56 $ 0.76 $ 1.06 $ 0.81
Diluted (4) 0.55 0.74 1.03 0.79
Quarters ended
March 30, June 29, September 28, December 28,2002 2002 2002 2002
Net sales $647,093 $671,432 $759,073 $747,403
Gross profit 178,390 192,396 216,472 207,646
Operating income (3) 35,198 46,989 64,285 50,531
Net income (3) 19,730 28,066 39,228 30,963
Net income per common share:
Basic $ 0.46 $ 0.65 $ 0.90 $ 0.70
Diluted (4) 0.45 0.63 0.87 0.69
59

HENRY SCHEIN, INC.NOTES TO CONSOLIDATED FINANCIAL STATEMENTS (CONTINUED)
(In thousands, except share and per share data)
Note 15–Quarterly Information (Unaudited) (Continued)
(1) During the third quarter of 2003, we recognized a $2.0 million loss, net of tax, from the sale of a discontinued operation (see Note 7).The effect of this loss on discontinued operation was $(0.04) on basic and diluted earnings per share for the third quarter of 2003.
(2) In the first quarter of 2003, we recorded a $726 pre-tax ($454 after-tax) gain related to a real estate transaction. This gain wasincluded in the "Other, net" line on the consolidated statements of income.
(3) In the third quarter of 2002, we recorded a $1.4 million pre-tax ($890 after-tax) gain related to a real estate transaction. This gain wasincluded in the "Other, net" line on the consolidated statements of income. In addition, in the fourth quarter of 2002, we recorded anet credit of $734 related to a reversal of previously accrued merger, integration and restructuring costs.
(4) Diluted earnings per share calculations for each quarter include the effect of dilutive stock options, which are added to the quarter’sweighted-average number of common shares outstanding for each period. As a result of this dilutive adjustment, as well as changesin the number of common shares outstanding from quarter to quarter, the sum of the quarters does not equal the full year dilutedearnings per common share amount.
Our business is subject to seasonal and other quarterly influences. Net sales and operating profits are generally higher in the third andfourth quarters due to timing of seasonal product sales, software and equipment sales, year-end promotions and purchasing patterns ofoffice-based healthcare practitioners and are generally lower in the first quarter primarily due to the increased purchases in the priorquarter.
Quarterly results also may be materially affected by a variety of other factors, including the timing of acquisitions and related costs, timingof sales, special promotional campaigns, fluctuations in exchange rates and adverse weather conditions.
60

CORPORATEINFORMATION
CORPORATE HEADQUARTERS
Henry Schein, Inc.135 Duryea RoadMelville, New York 11747U.S.A.(631) 843-5500www.henryschein.com
COMMON STOCK
Henry Schein Common Stock trades on the NASDAQ Stock Market® underthe symbol “HSIC.”
ANNUAL SHAREHOLDERS MEETING
Our Annual Meeting of Shareholders will be held on May 25, 2004 at 10 a.m. at The Mark New York, 25 East 77th Street, New York, NY 10021.
HENRY SCHEIN ON THE INTERNET
For more information about Henry Schein and its products and services, go to www.henryschein.com. Other Company Web sites include:www.sullivanschein.com; www.caligor.com; www.giv.com; www.dentrix.com;www.easydental.com; www.labnet.net; www.digitaldentaloffice.com;www.zahndental.com; www.studentdentist.com; and www.avimark.com.
SHAREHOLDER REPORTS AND INVESTOR INQUIRIES
For shareholder inquiries, including requests for quarterly and annual reports,contact our Investor Relations department at (631) 843-5611/5562, or e-mailyour request to [email protected]. Printed materials can also berequested through the Company’s Web site.
FORM 10-K
A copy of the Company’s annual report on Form 10-K for the fiscal year endedDecember 27, 2003, is available without charge to shareholders upon requestto the Company’s Investor Relations department. The report is also available onthe Company’s Web site.
INDEPENDENT AUDITORS
BDO Seidman, LLP330 Madison AvenueNew York, N.Y. 10017
LEGAL COUNSEL
Proskauer Rose, LLP1585 BroadwayNew York, N.Y. 10036
STOCK TRANSFER AGENT
For address changes, account consolidation, registration changes, and loststock certificates, please contact:Continental Stock Transfer & Trust Company17 Battery PlaceNew York, N.Y. 10004(212) 509-4000
ONEWORLD.ONECOMPANY. ONETEAM.
This Annual Report contains forward-looking statements under “Management’sDiscussion and Analysis of Financial Condition and Results of Operations”and elsewhere. The Company’s results may differ materially from thoseexpressed in or indicated by such forward-looking statements. The PrivateSecurities Litigation Reform Act of 1995 provides a “safe harbor” for forward-looking statements.

CORPORATEMISSION
To be the worldwide leader
in providing the best quality
and value in products and services
for our healthcare customers.
Henry Schein, Inc.135 Duryea RoadMelville, New York 11747U.S.A.(631) 843-5500WWW.HENRYSCHEIN.COM